Abstract
In welding tasks, the repeated positioning precision of robots can generally reach the micron level, but the data of each axis during each operation may vary. There may even be out-of-control situations where the robot does not run according to the set welding trajectory, which may cause the robot and equipment to collide and be damaged. Therefore, a real-time judgment method for the welding robot trajectory is proposed. Firstly, multiple sets of axis data are obtained by running the welding robot, and the phase of the data is aligned by using a proposed algorithm, and then the Kendall correlation coefficient is used to identify and remove weak axis data. Secondly, the mean of multiple sets of axis data with strong correlation is calculated as the standard trajectory, and the trajectory threshold of the robot is set using the μ ± nσ method based on the trajectory deviation judgment sensitivity. Finally, the absolute difference between the real-time axis trajectory and the standard trajectory is used to determine the deviation of the running trajectory. When the deviation reaches the threshold, a forewarning starts. When the deviation exceeds the threshold + σ, the robot is stopped. Take the six-axis welding robot as an example, by collecting the axis data of the robot running multiple times under the same conditions, it is proved that the proposed method can accurately warn the deviation of the running trajectory. The research results have important practical value for the prevention of welding robot accidents in industrial production.
1. Introduction
With the improvement of manufacturing levels, industrial products are increasingly pursuing a high quality, high efficiency, and high consistency, which means that the manufacturing industry will gradually transform from manual production to intelligent production [1,2]. Industrial robots (Irs), as a kind of production equipment with multiple DOF, have been widely used in intelligent manufacturing in various industries due to their advantages such as high work efficiency, stable, and reliable work [3]. Especially in manufacturing with high repeatability, high work intensity, high risk, and harsh environment, such as welding production [4] and metal forming [5], the huge advantages of Irs can be reflected.
The positioning precision of Irs includes repeated positioning precision (RPP) and absolute positioning precision (APP). Generally, Irs have very high RPP, generally reaching sub-millimeter or even micron levels, but their APP is very low, only millimeter level [6]. Therefore, when Irs reciprocate in a small space, they may collide with surrounding equipment and cause damage. This will waste time in downtime for repairs and even cause huge losses [7]. Furthermore, Irs that have been used for a long time may occasionally run out of control without following the programmed trajectory, which will pose a threat to the safety of products and personnel. In addition, Irs that operate continuously at a high intensity may also suffer from fatigue fractures of gears, and aging and slipping of belts. In this case, the shaft will lose its driving force and cause a risk of falling, which will also threaten equipment safety and affect product quality [8]. Therefore, it is very important to monitor and judge the space trajectory of Irs in real time to prevent sudden failures of Irs from threatening the safety of people, equipment, and products. It is of great practical significance to ensure the safety of Irs production.
At present, research on IR trajectories mainly focuses on methods of trajectory planning, prediction, and error compensation. There are rich research results in these aspects. However, there is a lack of research on real-time monitoring and judgment methods of Irs’ trajectory deviation. The trajectory planning of Irs aims to explore the most appropriate or optimal operating trajectory in the task to improve work efficiency. Batista et al. [9] used particle swarm optimization, genetic algorithm, and differential evolution to plan robot trajectories to avoid collisions. Wang et al. [10] proposed a path planning and optimization method for robotic machining based on the point cloud from onsite measurement. Fan et al. [11] proposed a method to plan the end-running trajectory based on the length of the curve between the robot end position and the starting point to achieve robot curve trajectory planning. The trajectory prediction of Irs aims to allow them to correct their running trajectories to adapt to changes in tasks. Seker et al. [12] proposed a deep prediction model that enables robots to predict their trajectory based on their interaction experience with objects of various shapes. Cheng et al. [13] designed a robust plan identification algorithm based on neural networks and Bayesian reasoning to predict robot trajectories to improve the efficiency and safety of human–machine collaboration. Li et al. [14] proposed an adaptive trajectory tracking controller for robot tracking error prediction, which realized the control and prediction of the robot trajectory. The trajectory error compensation of Irs is designed to achieve higher absolute positioning precision to meet the needs of ultra-high-precision tasks. Gonzalez et al. [15] presented an online compliance error compensation scheme that can be implemented in different industrial environments and various robotic systems. Li et al. [16] studied the real-time compensation method of the robot trajectory based on the PID parameter adjustment technology of the response surface model method of gray analysis and carried out real-time compensation for the motion trajectory of the KUKA robot. Zhao et al. [17] dynamically compensated the trajectory of the robot end effector by adding additional vision modules and execution modules to the robot hand. The above-mentioned research has made great progress in Irs trajectory planning, prediction, and error compensation. However, these types of research almost do not consider the operating status of the Irs after the trajectory deviates when a sudden failure occurs, nor do they consider the occurrence of an out-of-control situation that does not follow the programmed trajectory. Although the probability of these situations occurring is small, they will constitute major production accidents. Therefore, real-time monitoring and judgment of IR trajectories are also an issue worthy of study and of practical value.
In response to the above problems, this paper proposes a self-judgment method, named TRTJM, for IR space trajectories. TRTJM monitors and judges the deviation of industrial robot trajectories in real-time, thereby avoiding secondary damage to the robot and nearby equipment when the industrial robot fails. Firstly, the phases of the collected multiple sets of axis data are aligned, and the weakly correlated axis data in each axis are removed through the Kendall correlation coefficient. Then, the mean value is calculated as the standard trajectory of each axis, and the threshold of each axis trajectory is set using the μ ± nσ method based on the trajectory deviation judgment sensitivity (TDJS). Finally, the absolute difference between the real-time trajectory of each axis and the standard trajectory is used to determine the deviation of the Irs trajectory. When the deviation reaches the threshold, a forewarning is given. When the deviation exceeds the threshold + σ, the robot is stopped. The feasibility and effectiveness of the TRTJM are verified through the actual operation axis data of a six-axis IR. TRTJM only uses the axis data in the internal controller of the industrial robot, without adding other types of sensors to obtain data, and can be easily implemented and quickly deployed in actual production. The main contributions of this paper are summarized as follows:
- (1)
- An automatic algorithm is developed to remove invalid data and align data. The algorithm automatically removes invalid data of different lengths from the axis data, and aligns the axis data of multiple runs. It is used to eliminate the randomness of the robot axis data acquisition.
- (2)
- A set of axis trajectory thresholds is designed by using the absolute positioning precision of the robot. The threshold can be used to judge the real-time health status of each axis of the robot. If the real-time axis trajectory of a robot axis often exceeds the threshold, it indicates that the transmission system of the axis is abnormal.
- (3)
- A method for real-time judgment of robot axis trajectory is proposed. This method can be used to determine the real-time run status of each axis of the robot to monitor the deviation of the robot spatial trajectory in real-time during operation. It is used to ensure the safety of equipment and personnel.
2. Basic Theory
The proposed TRTJM in this article includes three major steps, namely the determination of standard trajectory (DST), setting of trajectory threshold (STT), and real-time judgment of trajectory (RTJ). The specific flow chart of the proposed TRTJM is shown in Figure 1.
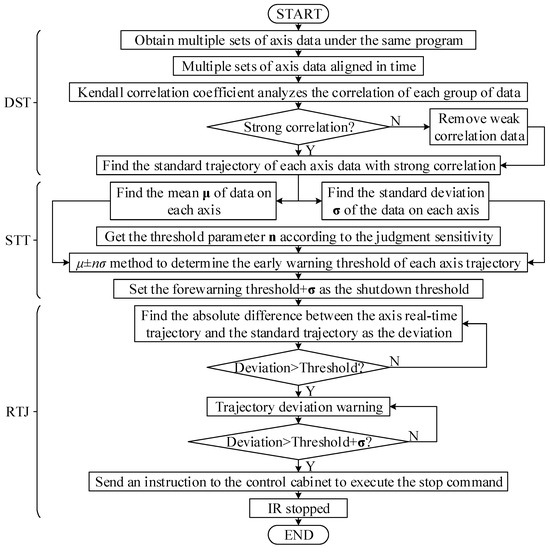
Figure 1.
The specific flow chart of the proposed method.
2.1. Determination of Standard Trajectory
In general, Irs run according to programmed trajectories, and the programmed trajectories can be regarded as standard trajectories. Nonetheless, due to manufacturing errors and sensor sensitivity, the operating trajectory cannot be the same as the ideal trajectory set by a program. Therefore, the standard trajectory needs to be determined through the operating trajectory. TRTJM uses the average of multiple running trajectories as the standard trajectory, which includes three steps: aligning the phase of axis data, analyzing the correlation of axis data, and solving the standard trajectory.
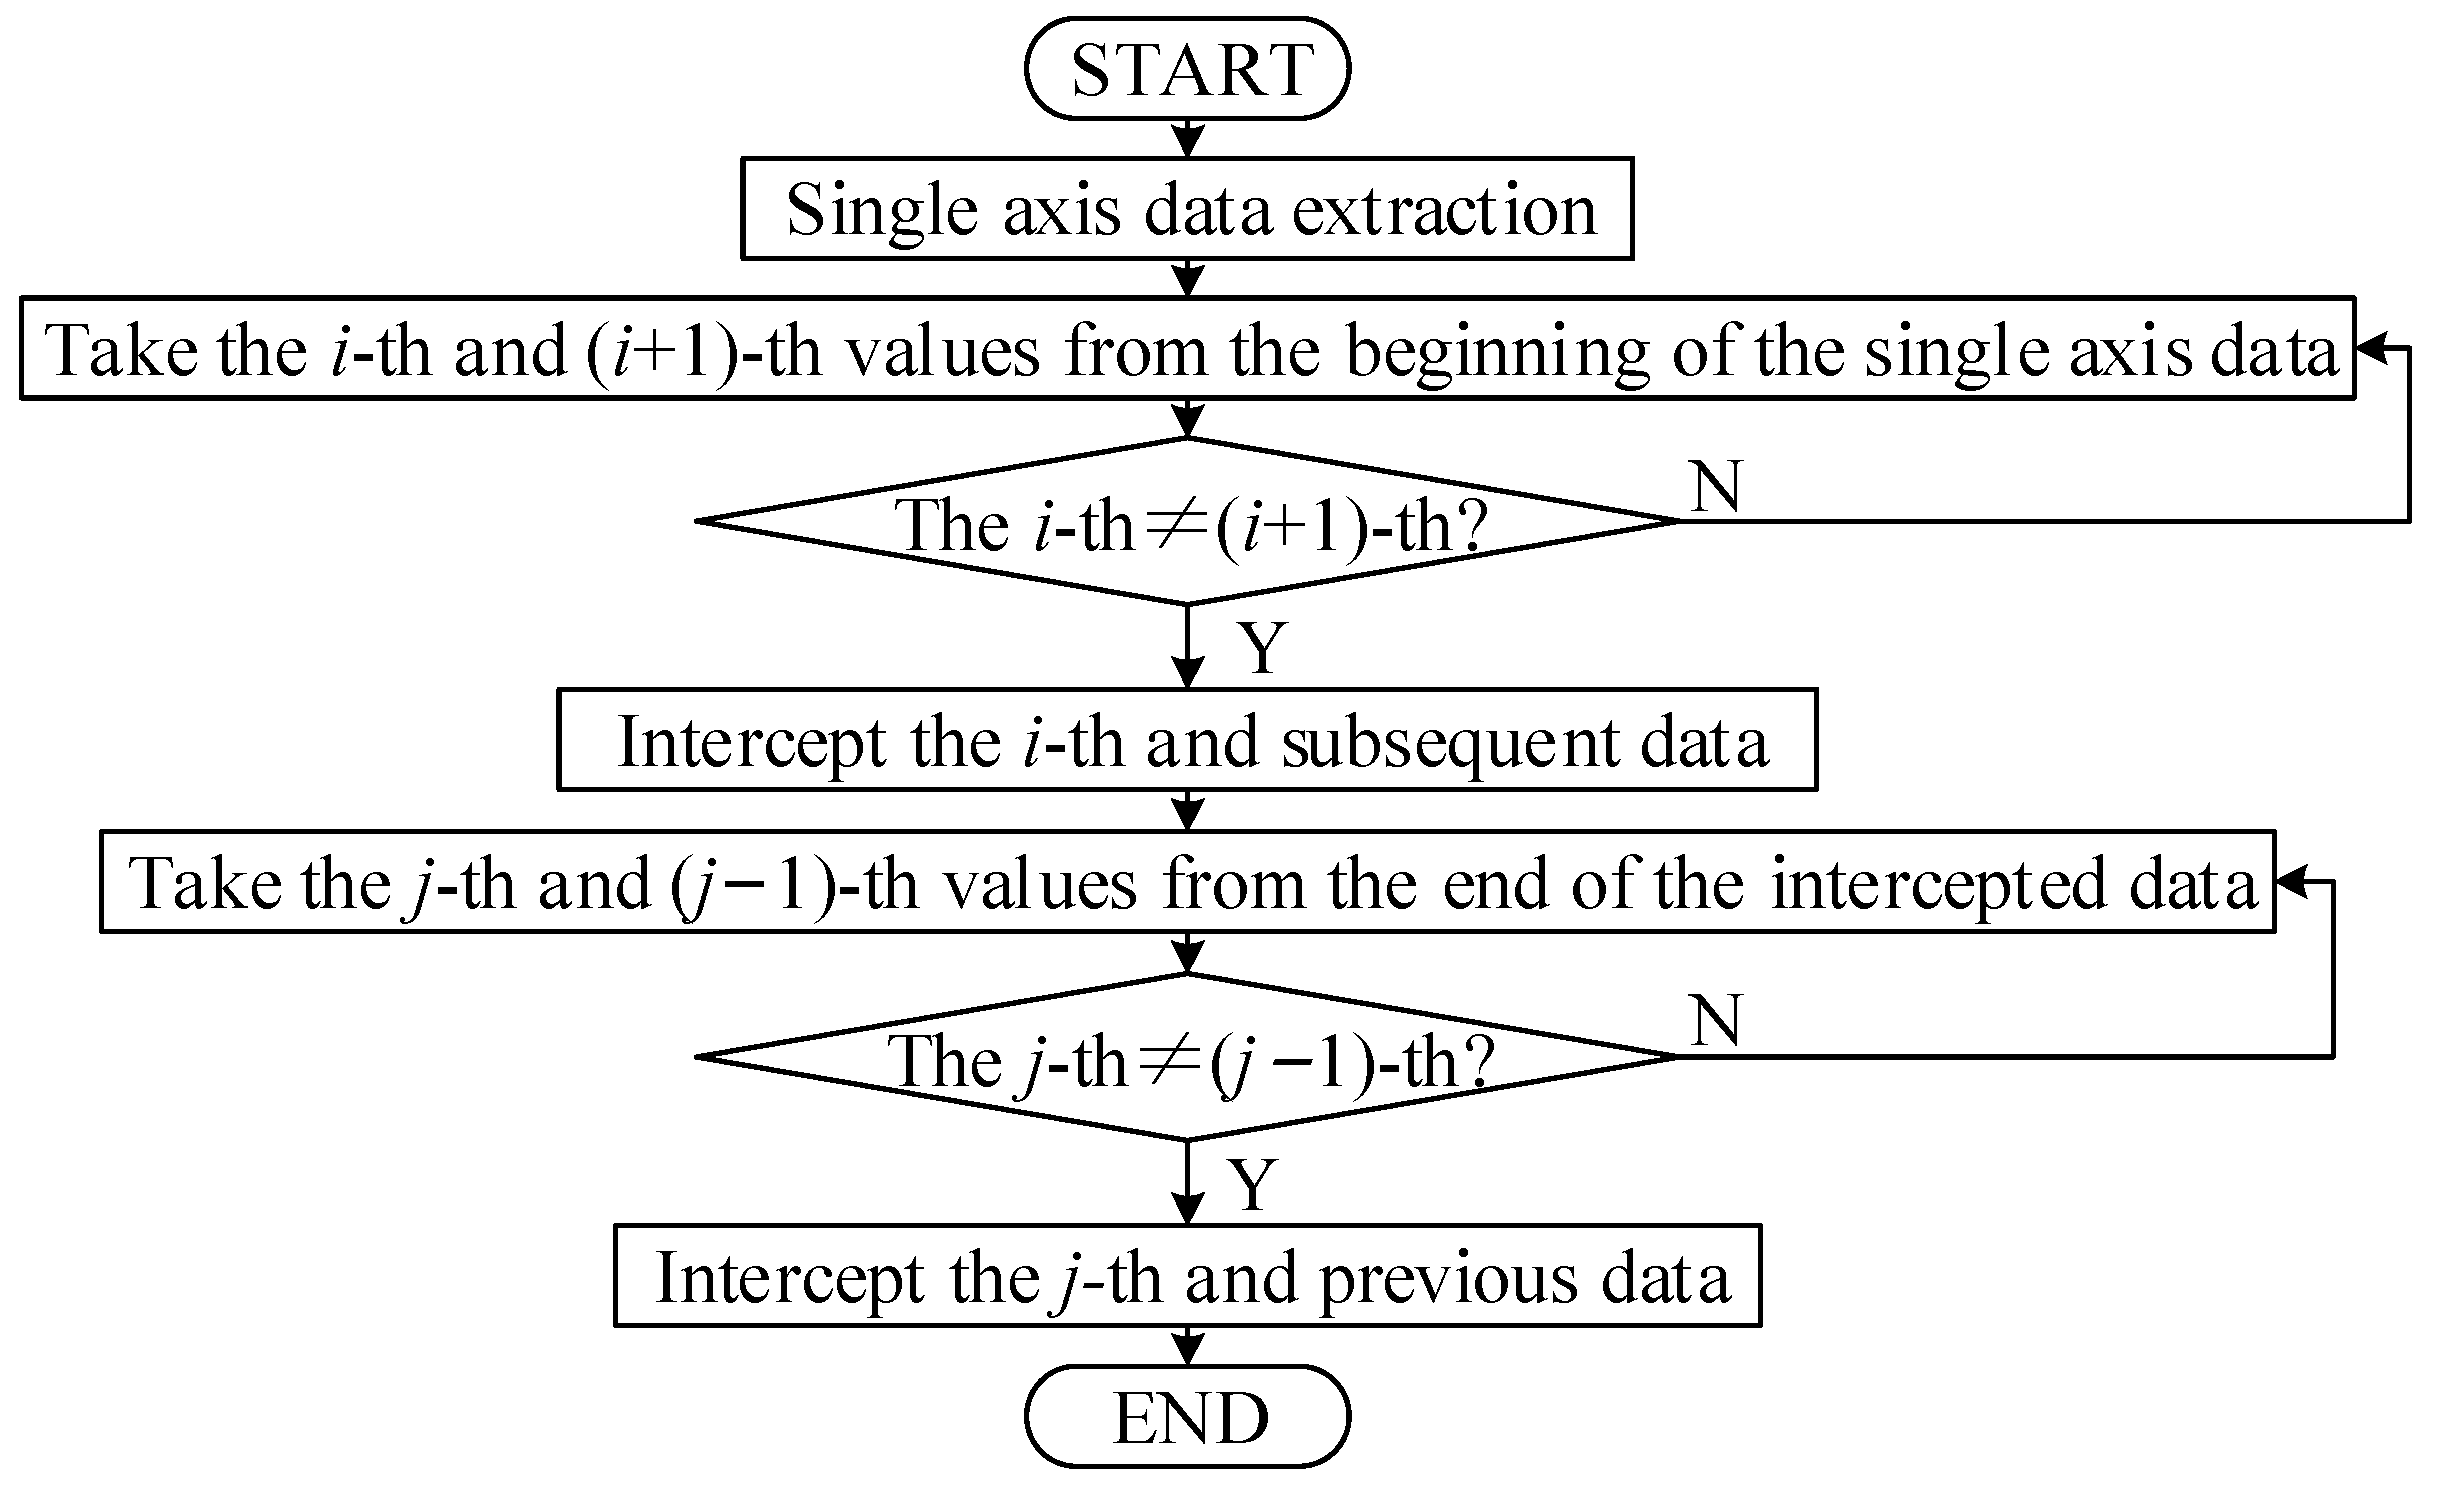
To collect the axis data of the whole operation, the collection starts before the robot runs and stops after the operation. The starting time of each group of data collection is random, resulting in the invalid data length contained in the axis data of each group being inconsistent. To facilitate subsequent analysis and eliminate invalid data, each set of axis data needs to be aligned. Since the axis data collected when the robot is not running all have the same value, consider using the method of removing duplicate values to eliminate invalid data. When the robot starts running, the axis data changes with time, which is enough to align the phases of each set of axis data. The algorithm flow chart for aligning axis data and removing invalid values is shown in Figure 2. It should be noted that Figure 2 illustrates the alignment process of angle data for a single axis, which is solely for the purpose of demonstration. In our experiments, we have actually extracted the angle data for all six axes of the robot simultaneously, and the data for each axis was extracted following the method described in Figure 2.

Figure 2.
Flow chart for aligning axis data and removing invalid values.
After obtaining the processed axis data, perform a correlation analysis on multiple sets of axis data. Since each set of data is obtained by running the robot under the same conditions, each set of data should have a strong correlation. If there are data with a weak correlation, it can be judged that the axis data of this set is abnormal and needs to be removed when determining the standard trajectory. There are three methods of correlation analysis: Pearson correlation coefficient, Spearman correlation coefficient, and Kendall correlation coefficient. Each method has its emphasis. The Pearson correlation coefficient is suitable for continuous variables with a normal distribution, the Spearman correlation coefficient is not affected by outliers and is suitable for nonlinear variables, and the Kendall correlation coefficient is suitable for ordered variables. The robot axis data do not necessarily satisfy the normal distribution. The purpose of a correlation analysis is to remove abnormal axis data (outliers), and it is time-ordered data. Therefore, this article selects the Kendall correlation coefficient for correlation analysis. The reasons for choosing the Kendall correlation coefficient in this paper are multifaceted. Firstly, the Kendall correlation coefficient provides a nonparametric method for assessing monotonic relationships in data. This means that even if the data do not conform to specific distribution assumptions, the Kendall correlation coefficient can still offer valuable insights. Secondly, the Kendall correlation coefficient is robust to outliers, which is particularly important in practical industrial environments where data may be subject to various noises and disturbances. Thirdly, compared to other statistical methods, the Kendall correlation coefficient is relatively simple to calculate, making it effective even in resource-limited environments. Lastly, the Kendall correlation coefficient has been applied in various fields, including economics, ecology, and engineering, demonstrating its validity as a reliable measure of correlation.
There are two calculation formulas for the Kendall correlation coefficient, namely Tau-a and Tau-b. Tau-b can handle situations with the same value and has a wider application range; hence, Tau-b is used to calculate the correlation value. Set the th data of the th axis in the th group of axis data , and the Kendall correlation coefficient calculates the correlation value based on the count of the same-order pairs . For axis data and , the same sequence means that and have the same sign. Therefore, the Kendall correlation coefficient Tau-b can be defined as:
where is the length of the kth axis data.
The value range of the Kendall correlation coefficient is , when , which means that the order of the two-column axis data is inverse to each other. When , it means that the two-column axis data order is the same. When , it means that the two-column axis data do not correlate. Specifically, the correlation criteria between data are shown in Table 1 [18]. This article uses axis data with a significant correlation (i.e., ) to calculate the standard trajectory to ensure the accuracy of the standard trajectory.

Table 1.
Correlation criteria between data.
After obtaining the axis data with a strong correlation, the standard trajectory of the robot can be obtained by taking the mean value of the axis data with a strong correlation. Assuming that the obtained strong correlation axis data are , then the standard trajectory of the th axis can be expressed as
where is the number of strongly correlated axis data. is the index of the th axis data, .
2.2. Setting of Trajectory Threshold
The setting of the trajectory threshold adopts the method, which also includes three steps. Namely, finding the mean and standard deviation of each axis data, finding the threshold parameters based on the TDJS, and setting the forewarning threshold (FT) and shutdown threshold (ST).
The mean value of each axis data is essentially the calculation method of the standard trajectory. That is, it is the mean value of the strongly correlated axis data, so the mean value of the th axis data can be expressed as
After obtaining the mean of each axis data, the standard deviation of each axis data can be easily obtained. The standard deviation of the th axis data is calculated by the following formula:
where is the number of strongly correlated axis data. is the index of the th axis data, .
The threshold parameter is calculated based on the TDJS given under the specific working environment and duration of use, which essentially reflects the degree of trajectory deviation. Therefore, the obtained threshold parameter should satisfy that the threshold of axis data at all times does not exceed the given trajectory deviation sensitivity. Assuming that the given TDJS is (since the APP of robots of different models is generally different, this paper can reflect the influence of robot models on the trajectory threshold setting through TDJS), the th axis trajectory deviation threshold parameter can be determined by the following formula:
where is the rounding operation. is the parameter of the working environment. In a specific working environment, . When the working environment becomes bad, . When the working environment becomes good, . is the parameter of the duration of use. When a specific duration of use or a short duration of use, . When a long duration of use, .
After the mean, standard deviation, and threshold parameters of each axis data are determined, the forewarning threshold and shutdown threshold of each axis data of the robot can be obtained. The forewarning threshold and shutdown threshold of the th axis data are as follows:
where is a smooth function.
2.3. Real-Time Judgment of Trajectory
After determining the standard trajectory and trajectory threshold, the offset of the trajectory is determined through the axis data and trajectory threshold collected in real time while the robot is running. The real-time trajectory judgment is divided into the first stage of forewarning judgment and the second stage of shutdown judgment. In the first stage, when the real-time trajectory of the robot deviates from the set threshold, the warning starts. The deviation warning of the th axis real-time trajectory can be expressed as:
Substituting Equations (3) and (6) into Equation (8), the above equation can be transformed into
where is the set forewarning deviation.
When the robot is running, the trajectory deviation is judged in real-time through the standard trajectory value and the set forewarning deviation value at each moment; that is
It can be seen from Equation (10) that in fact, the deviation warning is essentially judged by the absolute difference between the real-time axis data and the standard trajectory data at that moment. That is, the warning starts when the absolute difference reaches the set warning deviation value. When the axis real-time data exceeds the set warning deviation value to a certain extent, the robot trajectory is deemed to have deviated significantly, and the shutdown threshold will be reached to trigger the second stage of a shutdown.
The shutdown threshold of the second stage can be expressed as:
In the same way, by substituting Equations (3) and (7), the above equation can be transformed into:
where is the set shutdown deviation.
The same as the forewarning judgment in the first stage, based on the standard trajectory value and the set shutdown deviation value at each moment, the shutdown judgment in the second stage can also be expressed as
3. Experimental Validations and Discussion
3.1. Experimental Setup
The experimental axis data are derived from a KUKA robot, model KR10 R1420 (KUKA Robotics (China) Co., Ltd., Shanghai, China), which is utilized in welding experiments to weld the same welding line at a constant speed under identical working conditions. Its basic parameters are shown in Table 2. As can be seen from Table 2, this robot is a six-axis robot with a very high RPP, up to ±0.04 mm, while the APP is only ±0.5 mm. Compared with its RPP, its APP is very low.
Table 2.
The basic parameters of KUKA KR10 R1420.
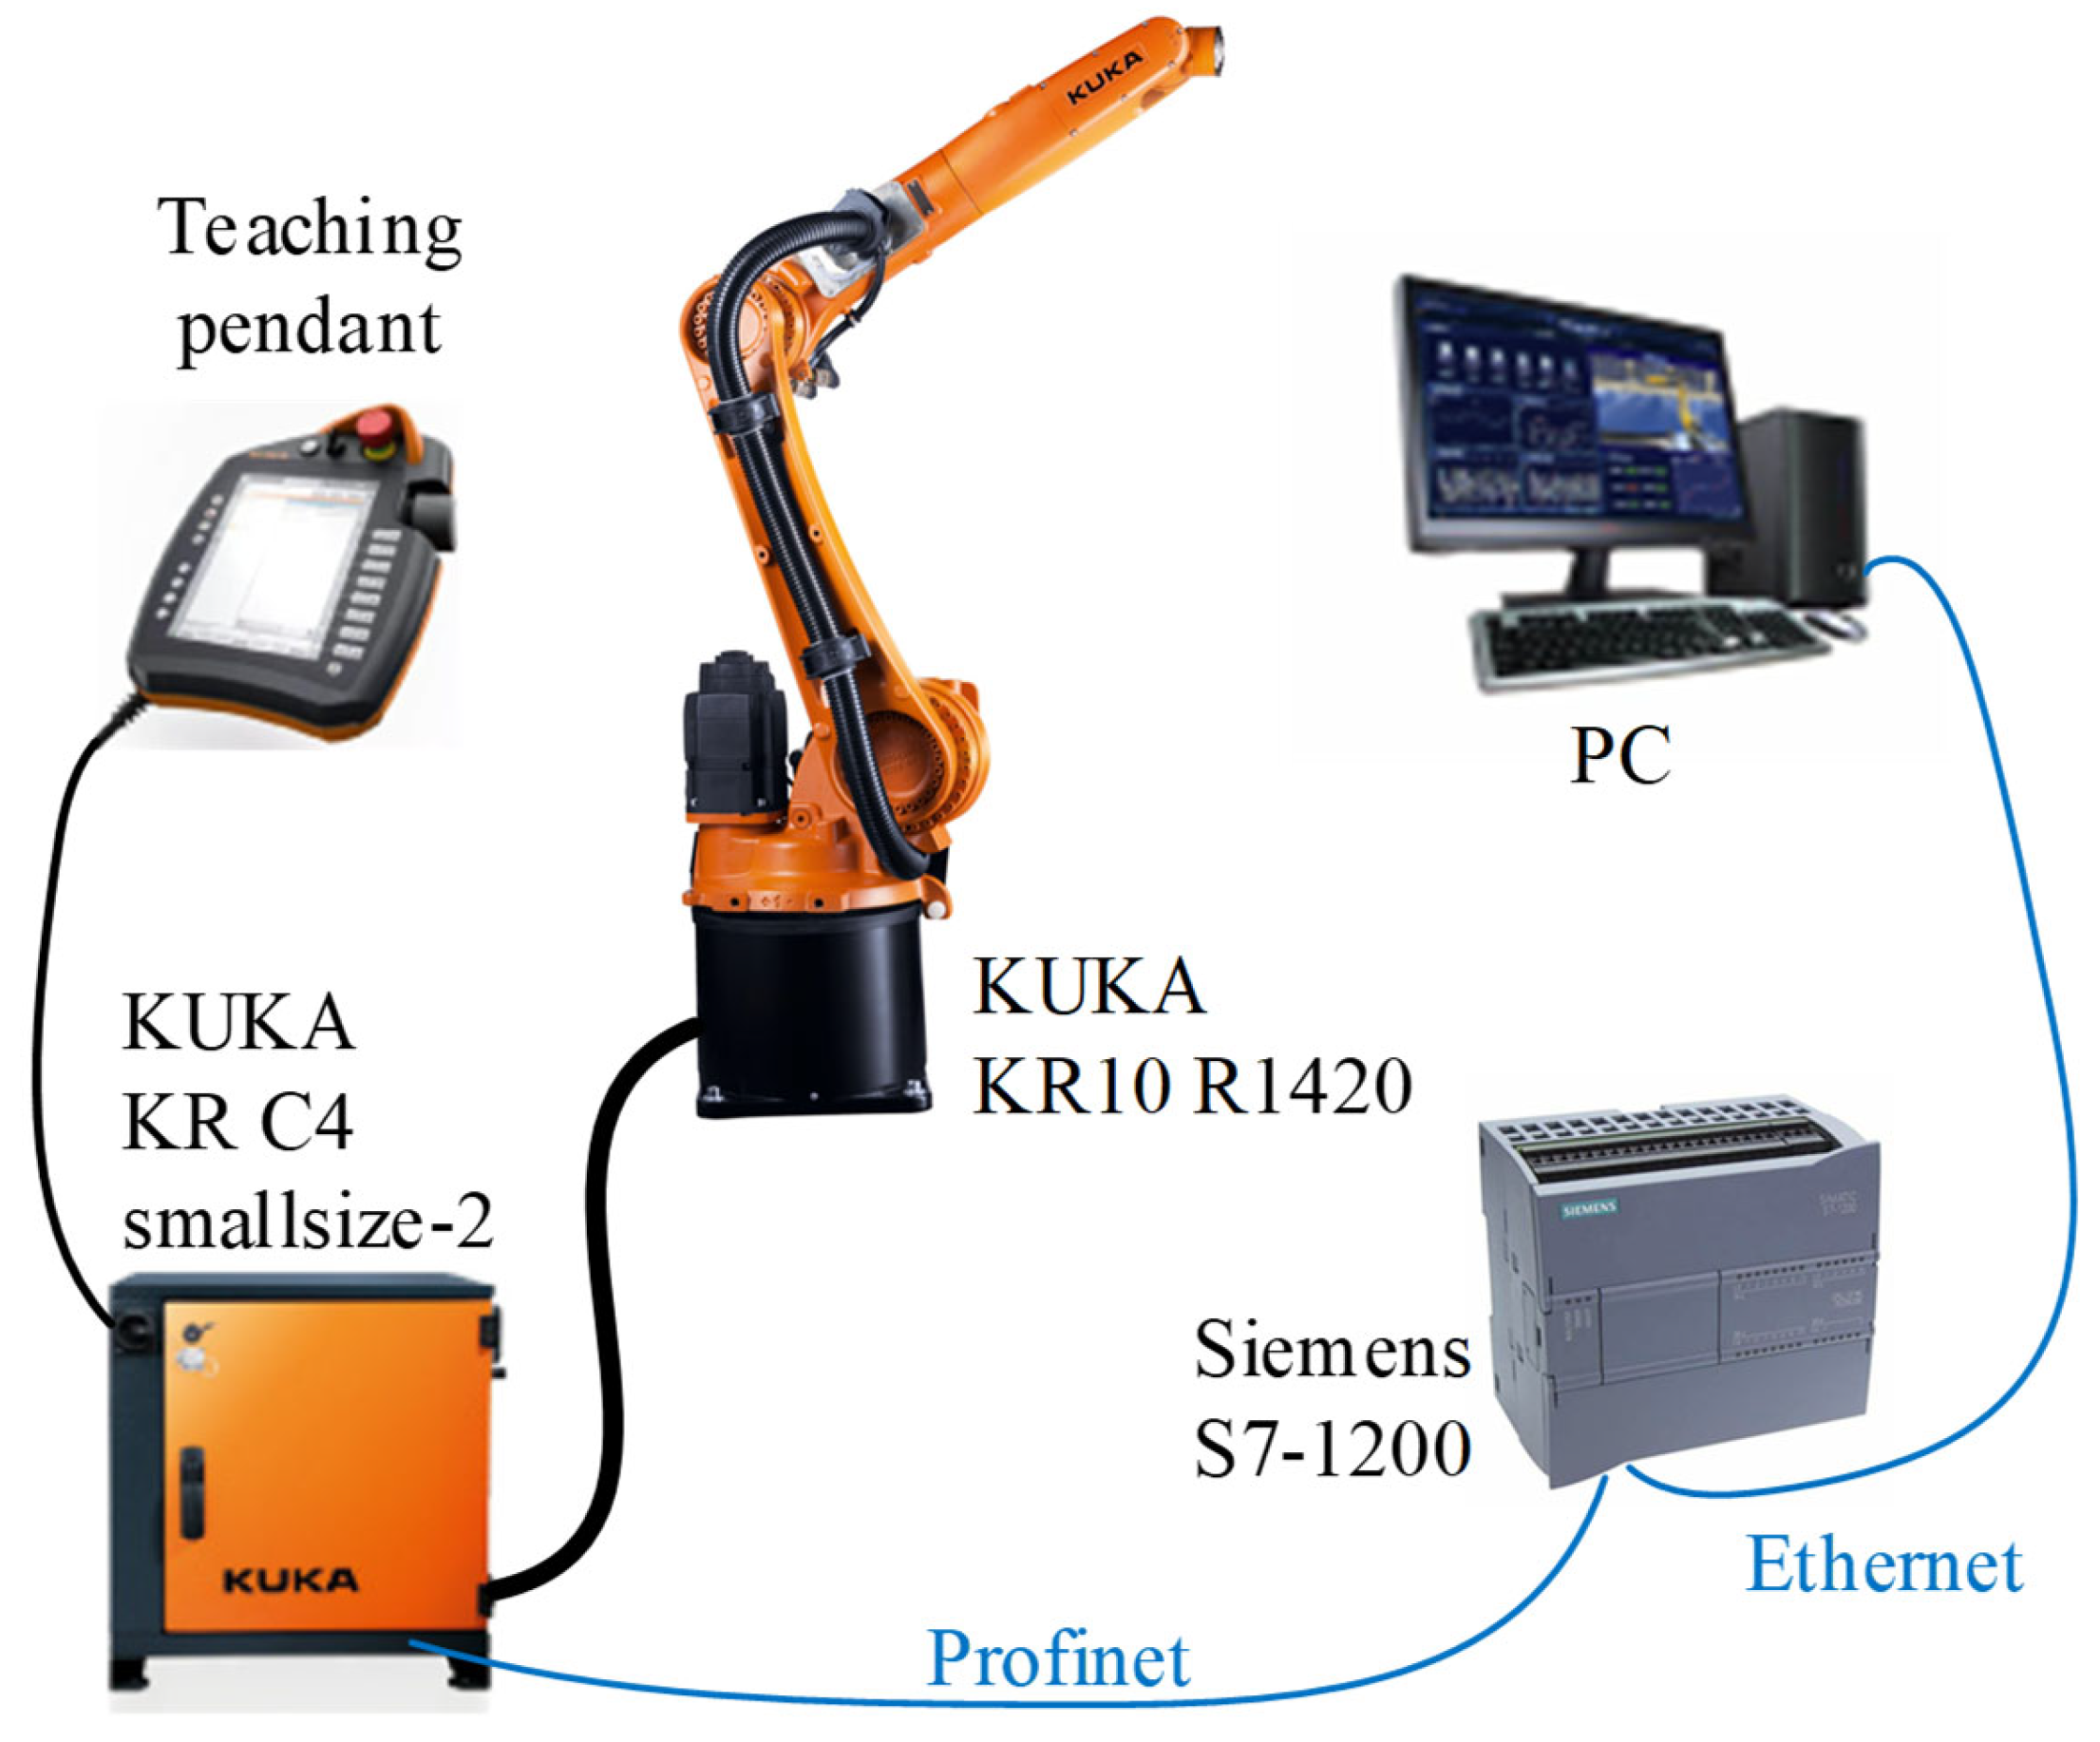
The schematic diagram of the axis data collection scheme used in the experiment is shown in Figure 3. The motion control of IRs is generally implemented by programming the teaching pendant and transmitting it to a special control cabinet. Its axis data and other parameters are stored in the control cabinet. The control cabinet of the test robot is KUKA KR C4 smallsize-2 (KUKA Robotics (China) Co., Ltd., Shanghai, China), which is connected to the robot through a dedicated cable and supports common communication protocols such as Profinet. Siemens S7-1200 PLC (Siemens (China) Co., Ltd., Beijing, China) is used to extract and collect axis data in the control cabinet, and save the collected axis data to the computer through Ethernet.
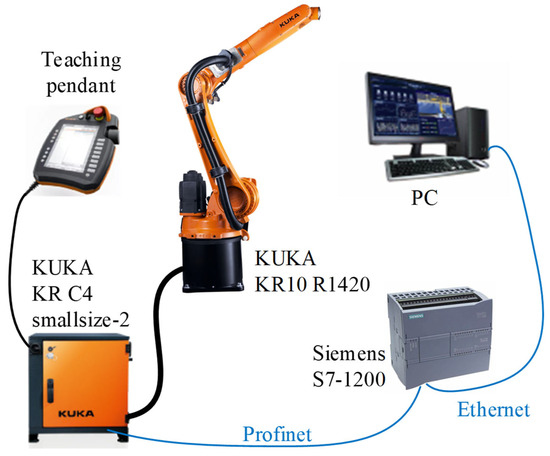
Figure 3.
The acquisition method of robot axis data.
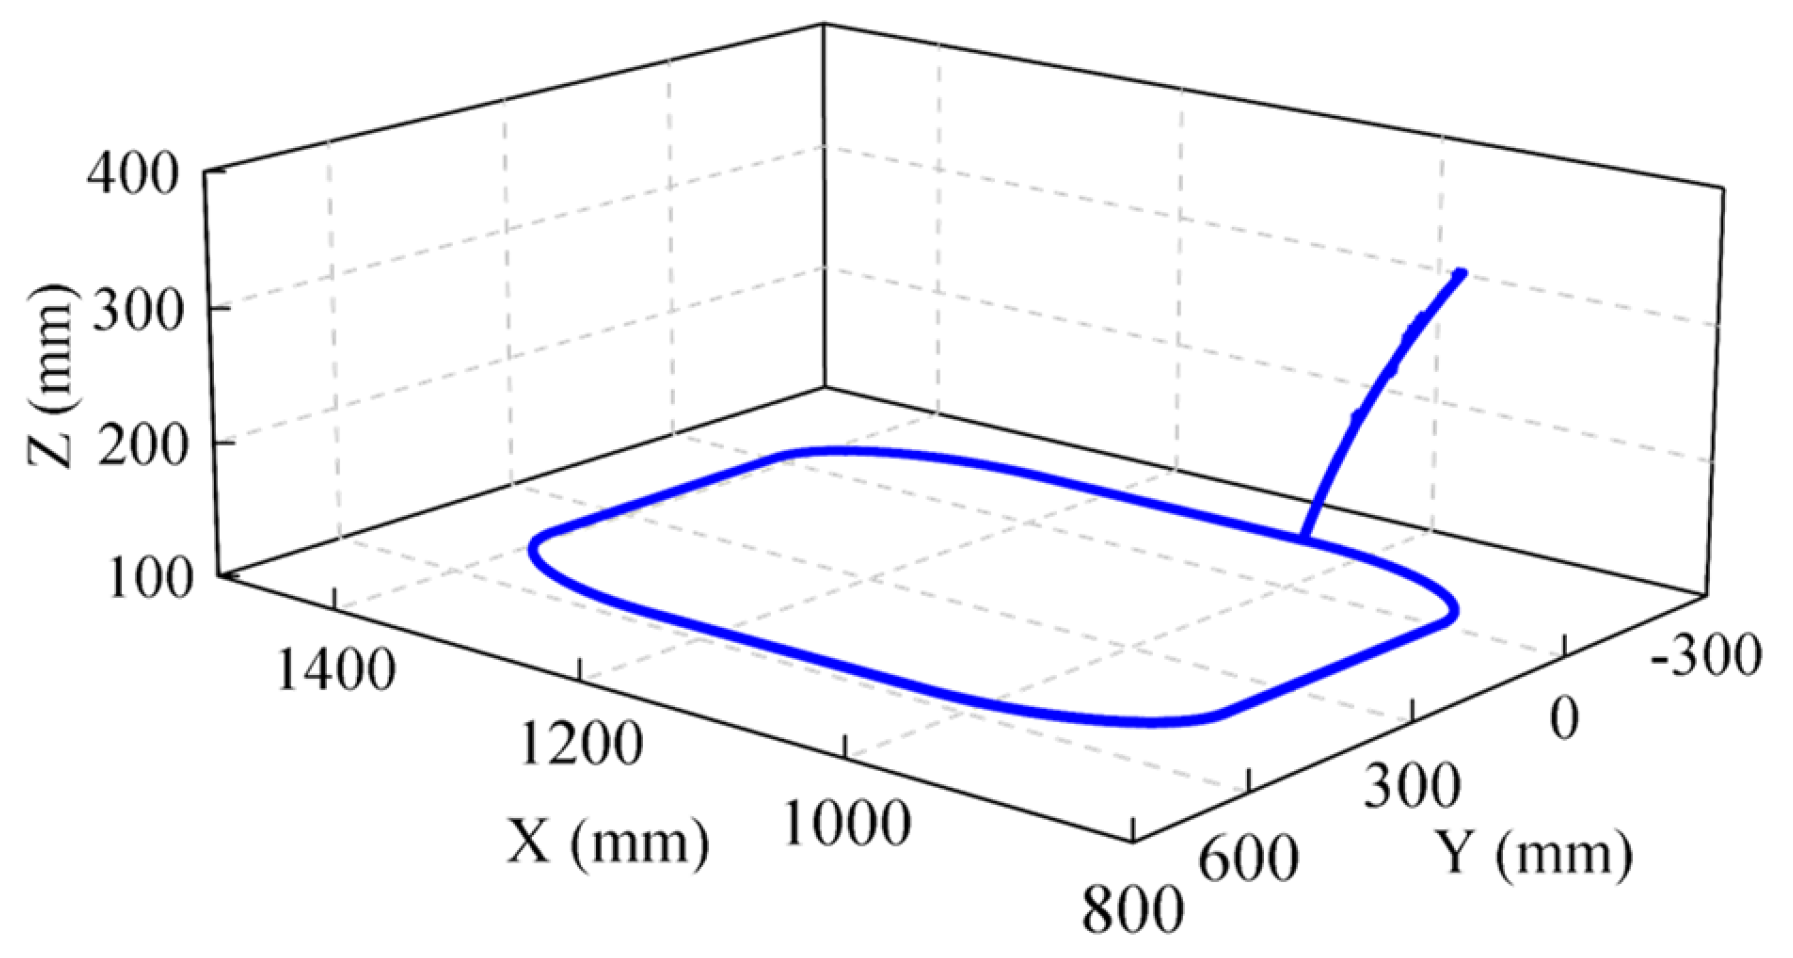
Before collecting axis data, write appropriate programs through the teaching pendant to realize the spatial operation of the robot. The written program needs to make each axis of the robot move with a larger amplitude to ensure that the data of each axis are more comprehensive. In this experiment, the teaching pendant was programmed to make the end-running trajectory a rounded rectangle to test the deviation of each axis of the robot in a linear and arc motion. The robot end-running trajectory is shown in Figure 4. The robot was run continuously six times under the same program (i.e., ), and six sets of axis data were obtained. The axis data curve of each operation of axis A1 is shown in Figure 5.

Figure 4.
The robot end trajectory in the experiment.
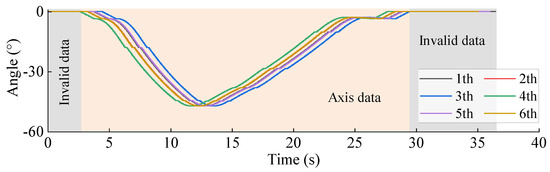
Figure 5.
Axis data curve of A1 for each run.
It can be seen from Figure 5 that the trend of the A1 axis data curve of the robot is roughly the same every time it is run. However, since each data collection starts before the robot runs and stops after the operation, the start time of collection is slightly different. As a result, the data of each axis in each run has phase differences, and the data length collected each time is inconsistent. In addition, it can also be seen from the figure that the front and back segments of the axis data curve are both horizontal line segments. This segment of data shows that as time goes by, each axis of the robot does not move, and it also shows that the front and rear segments of the axis data are invalid data.
3.2. Experimental Results and Analysis
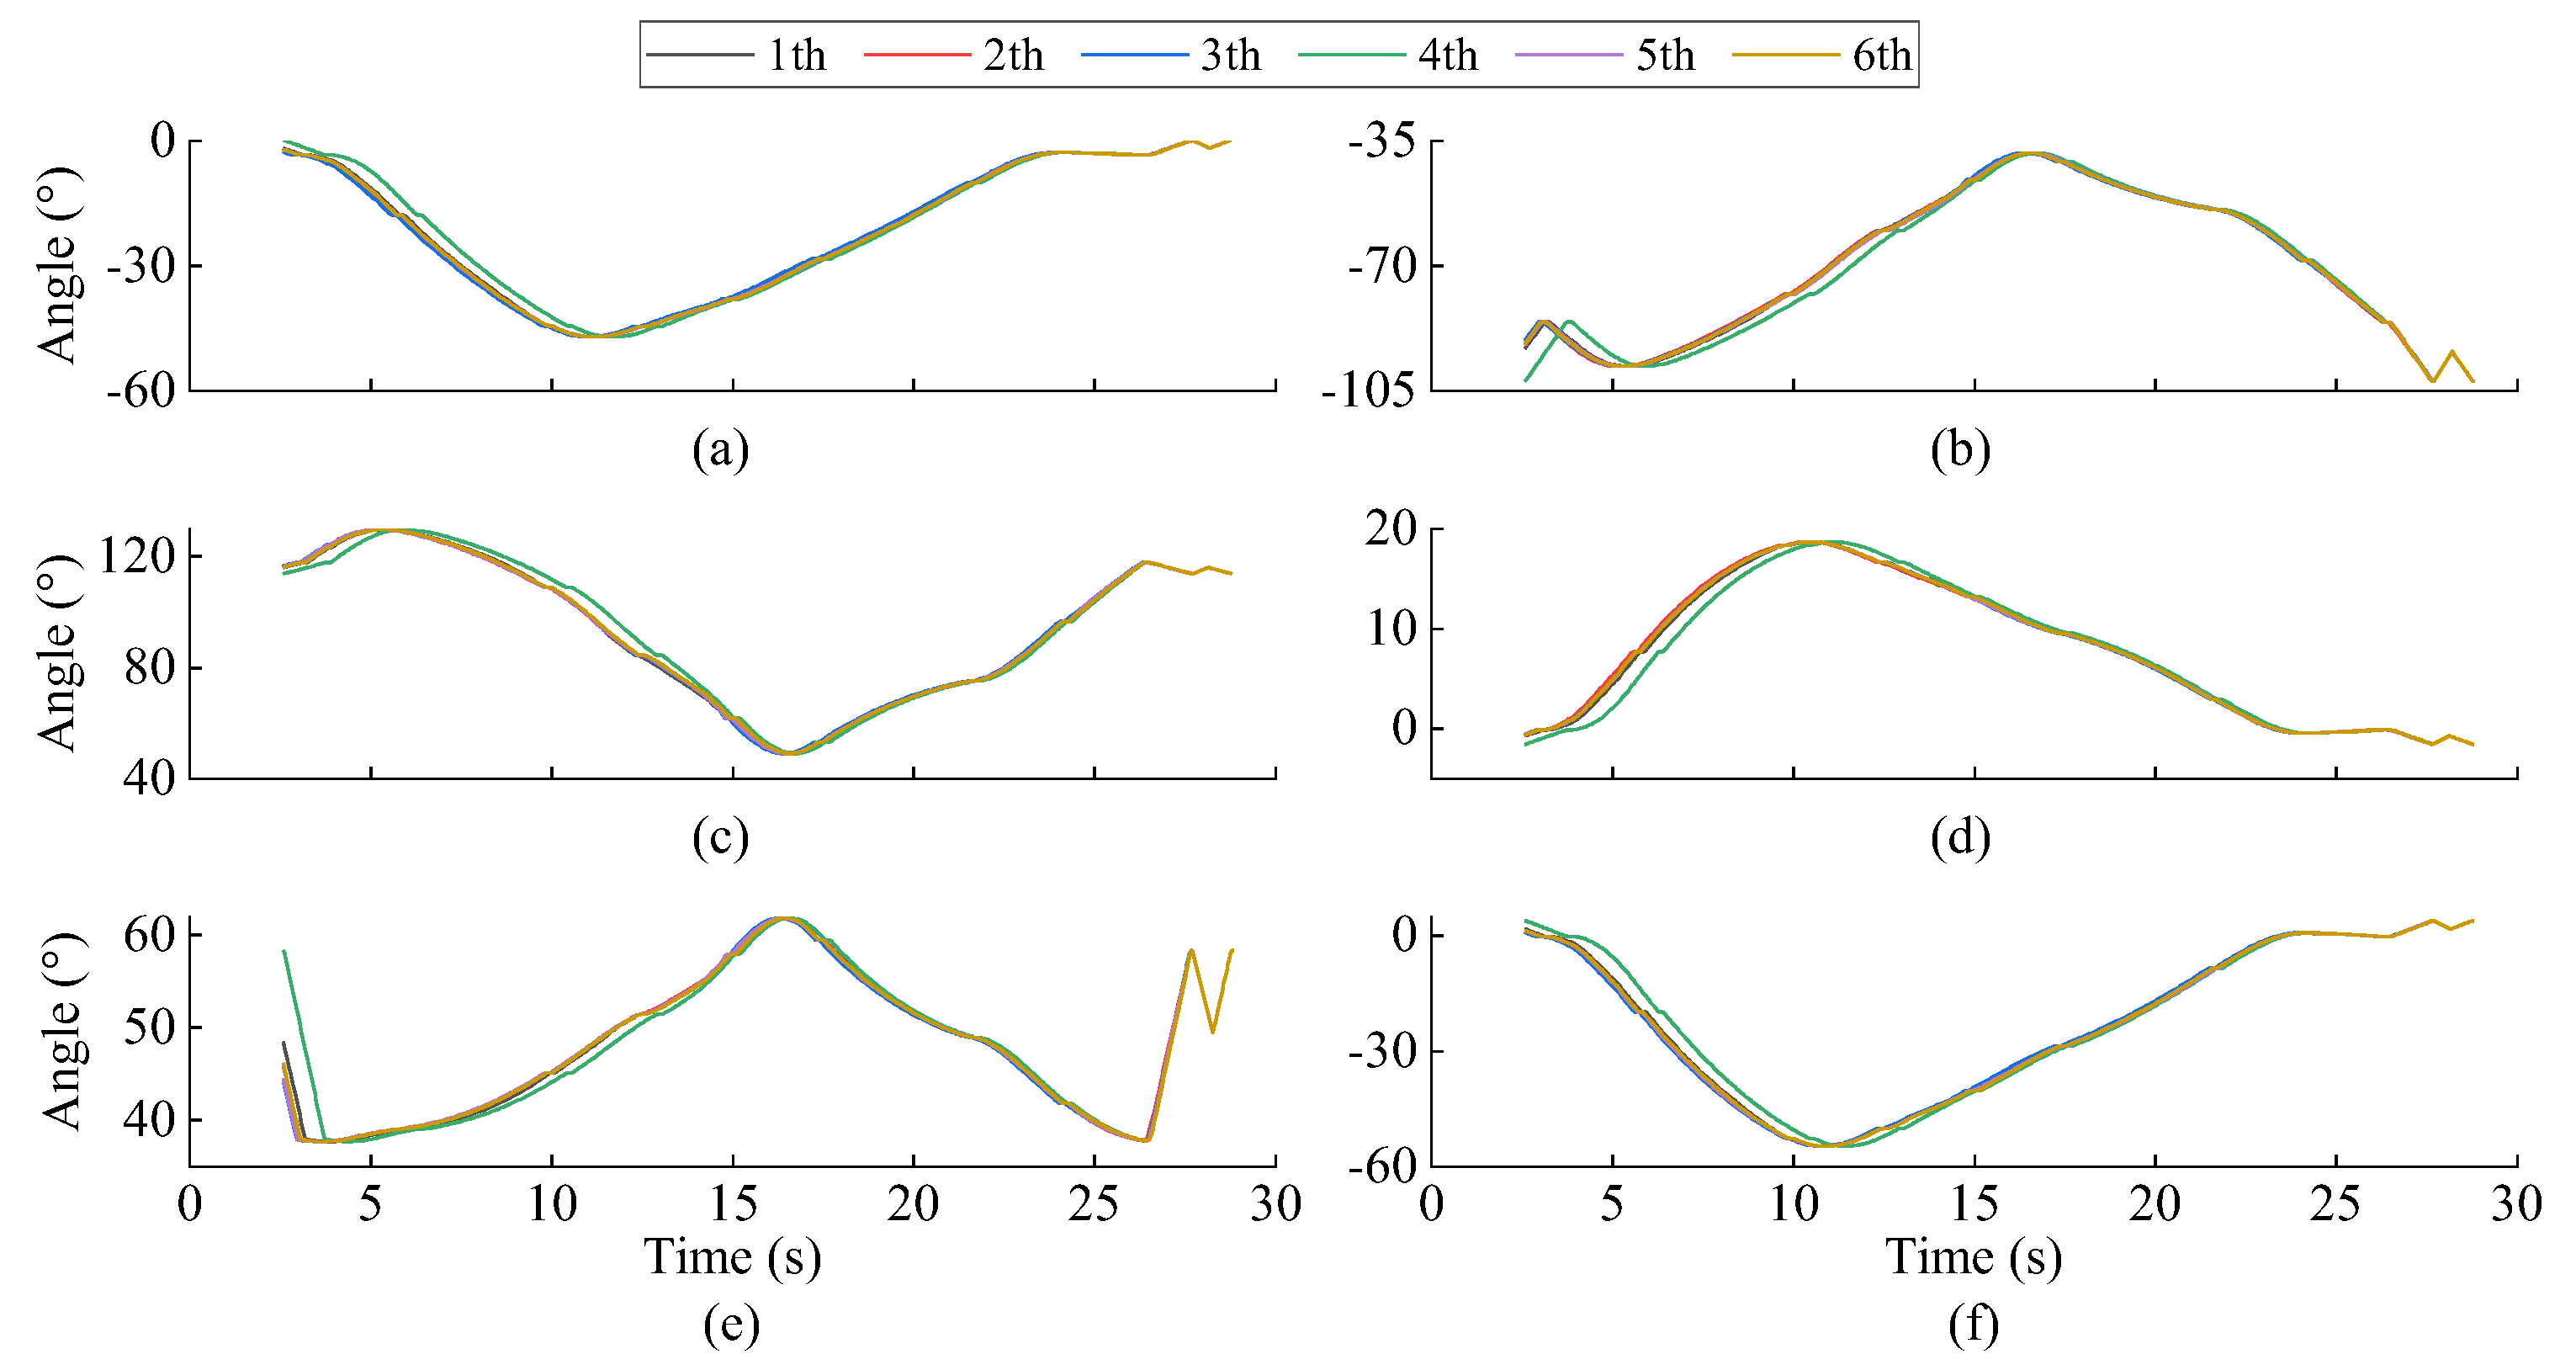
To obtain higher-quality axis data for subsequent trajectory judgment, it is necessary to remove invalid data from the collected axis data and align the phases of each axis data. The data curves of each axis after the phase alignment are shown in Figure 6. The algorithm removes the beginning and end segments of each axis data, leaving only the running data of each axis. As can be seen from Figure 6, in the case of six consecutive runs, most of the axis data when the robot is running are basically consistent, whereas there are also different situations, such as the fourth run, which is different from the axis data of other runs. The difference may be attributed to issues with the electrical systems of robots or software, as well as trajectory planning problems. During the experiment, sudden fluctuations in the power grid caused the electrical equipment to receive an abnormal instantaneous power supply, resulting in anomalous axis data. Furthermore, the motion planning of a robot is automatically completed by internal algorithms, which may have multiple solutions for trajectory planning. During the optimization process for these multiple solutions on the fourth run of the robot, there may have been inconsistencies compared to other runs, leading to deviations in the axis data. Moreover, it can also be seen in the figure that there are slight differences in the data of each axis in the starting period (that is, the data curves of each axis in each run during this period do not completely overlap). As time goes by, there is almost no difference in the data of each axis in the end period (that is, the data curves of each axis in each run in the sub-time period almost completely overlap). Even for the fourth run, which is quite different from the data curves of other runs, the data curves of each axis gradually approach the data curves of other groups during the end period. This phenomenon also reflects the characteristics of low APP and high RPP of the robot.
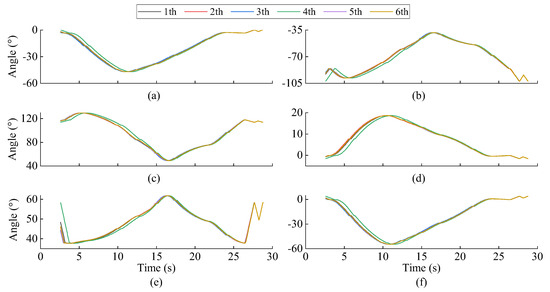
Figure 6.
The aligned axis data curve for each run: (a) A1; (b) A2; (c) A3; (d) A4; (e) A5; (f) A6.
After obtaining the phase-aligned axis data, the data curve can only qualitatively understand the axis data of each run. It is also necessary to quantitatively determine the difference of the axis data of each run through a correlation analysis. In this experiment, the correlation analysis of each axis data was performed through the Kendall correlation coefficient Tau-b, and the correlation matrix heat map of each axis data for each run was obtained, as shown in Figure 7. As can be seen from Figure 7, the correlation matrix heat map also shows the same results for each axis data curve of each run in Figure 6. Except for the low correlation between the axis data of the fourth run and the axis data of other runs, the correlation of the axis data of other runs is very high, reaching above 0.95. According to Table 1, the data of each axis of these runs are significantly related, so the data of each axis of the first, second, third, fifth, and sixth runs are used to calculate the standard trajectory corresponding to each axis.
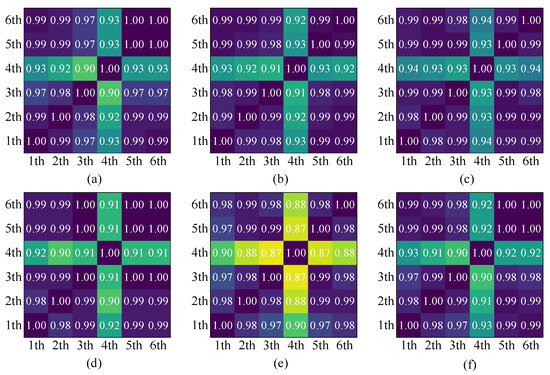
Figure 7.
The correlation heat map of axis data in six runs: (a) A1; (b) A2; (c) A3; (d) A4; (e) A5; (f) A6.
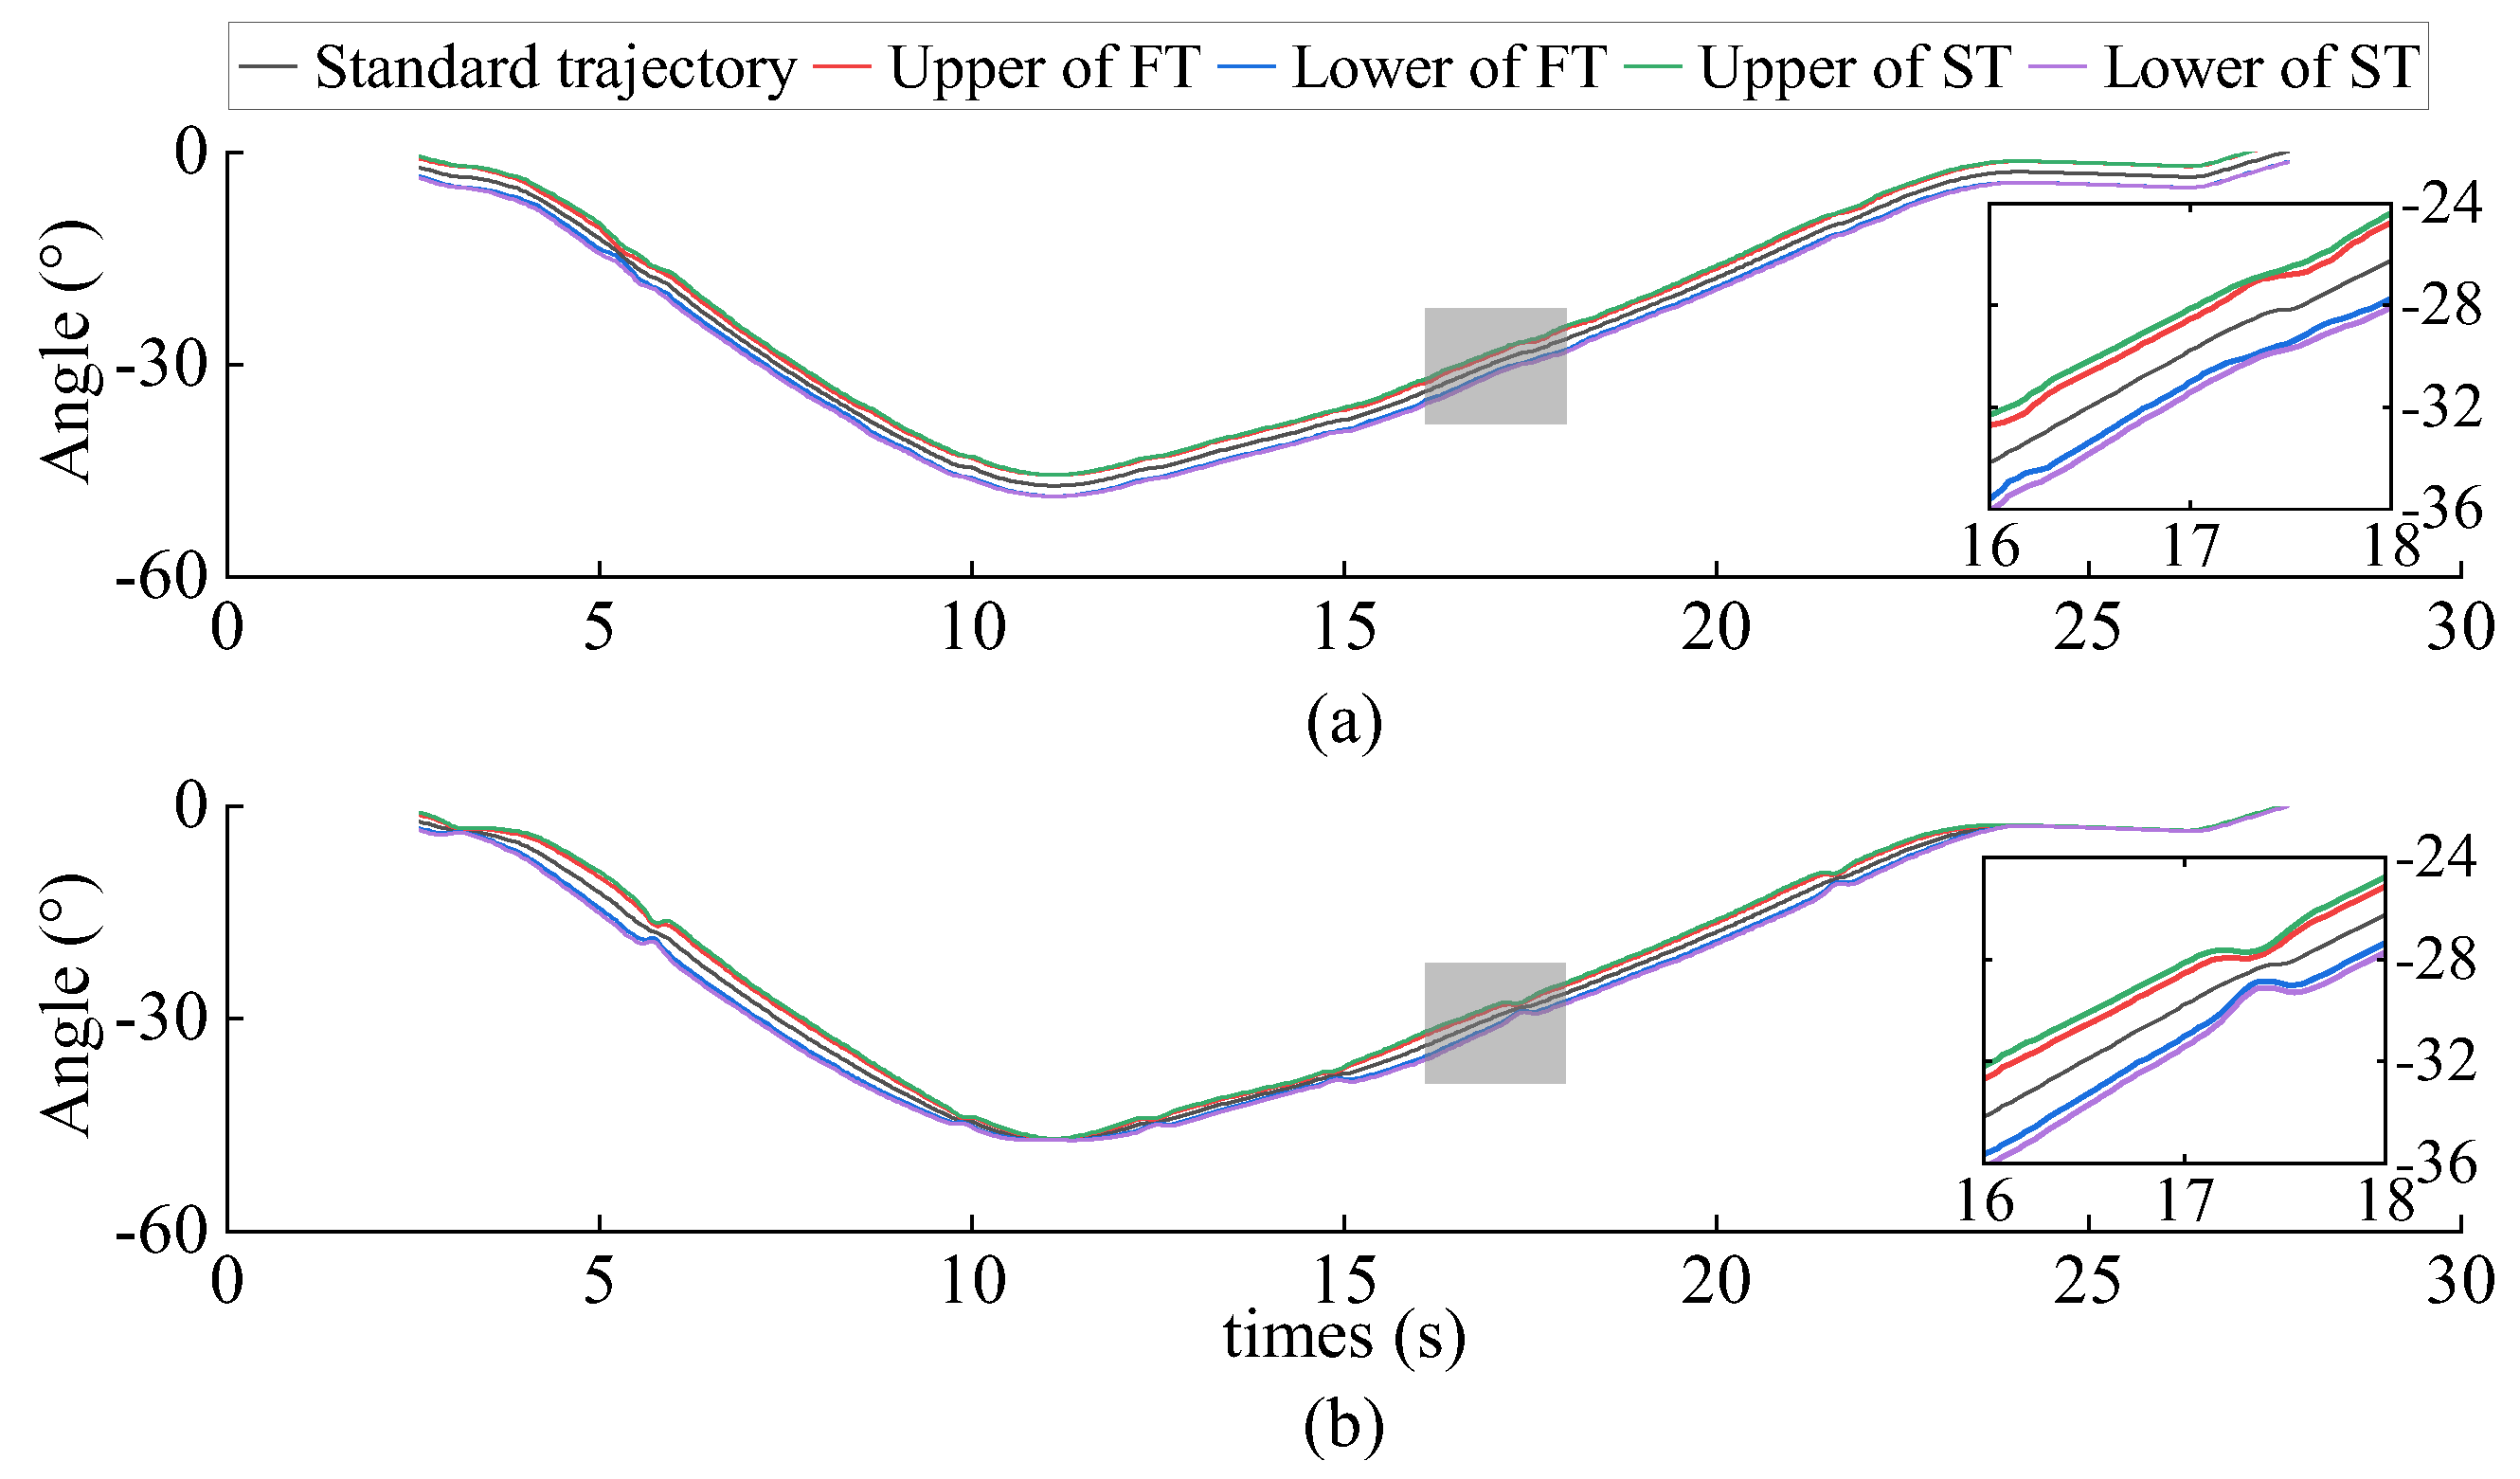
After removing the weakly correlated fourth group of axis data, average the other five groups of axis data to obtain the standard trajectory of each axis when the end running trajectory is a rounded rectangle. Figure 8 shows the standard trajectory of axis A1.
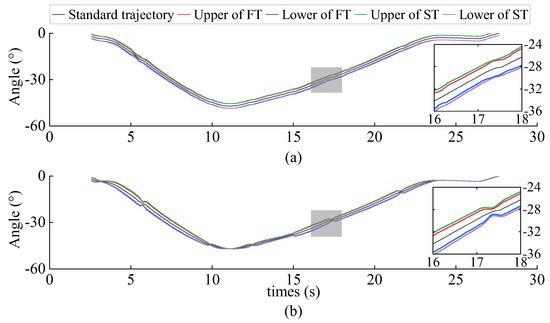
Figure 8.
The standard trajectory and threshold of A1: (a) the proposed method; (b) 3σ criterion.
After the significance-related axis data are obtained, the trajectory threshold of each axis can also be set. The mean vector and standard deviation vector of each axis data can be obtained through five sets of significantly related axis data. The trajectory deviation threshold parameter vector of each axis can be obtained by judging the sensitivity of the given trajectory deviation. As can be seen from Table 2, the APP of the experimental robot is ±0.5 mm. Therefore, the deviation of each axis data during normal operation of the robot should not be greater than 0.5 mm. In consequence, the TDJS of the robot in this experiment is . Moreover, the experiment is carried out under a specific working environment and duration of use; therefore, , . Through Equation (5), the trajectory deviation threshold parameters of each axis can be obtained, and then through Equations (6) and (7), the FT and ST of each axis trajectory can be obtained. The FT and ST of axis A1 are also shown in Figure 8.
In order to highlight the advantages of the trajectory threshold set by the proposed method, the trajectory threshold set by the 3σ criterion is compared. Figure 8b shows the trajectory threshold set by the 3σ criterion. As can be seen from Figure 8, the trajectory threshold set by the proposed method is significantly better than the 3σ criterion. The trajectory threshold set by the method is smoother in the whole working time, and the width of the threshold band does not change obviously. However, the trajectory threshold set by the 3σ criterion is prone to extreme values, and the width of the threshold band at the extreme value is narrow, which is more likely to lead to the error forewarning of the trajectory. The threshold parameters of the proposed method are different each time (i.e., dynamic threshold parameters), while the threshold parameters of the 3σ criterion are constant, which leads to this phenomenon. Moreover, the proposed method can also take into account the influence of the robot model, working environment, and duration of use on trajectory threshold setting. Nevertheless, the trajectory threshold set by the 3σ criterion cannot take these factors into account, which also proves the superiority of the proposed method.
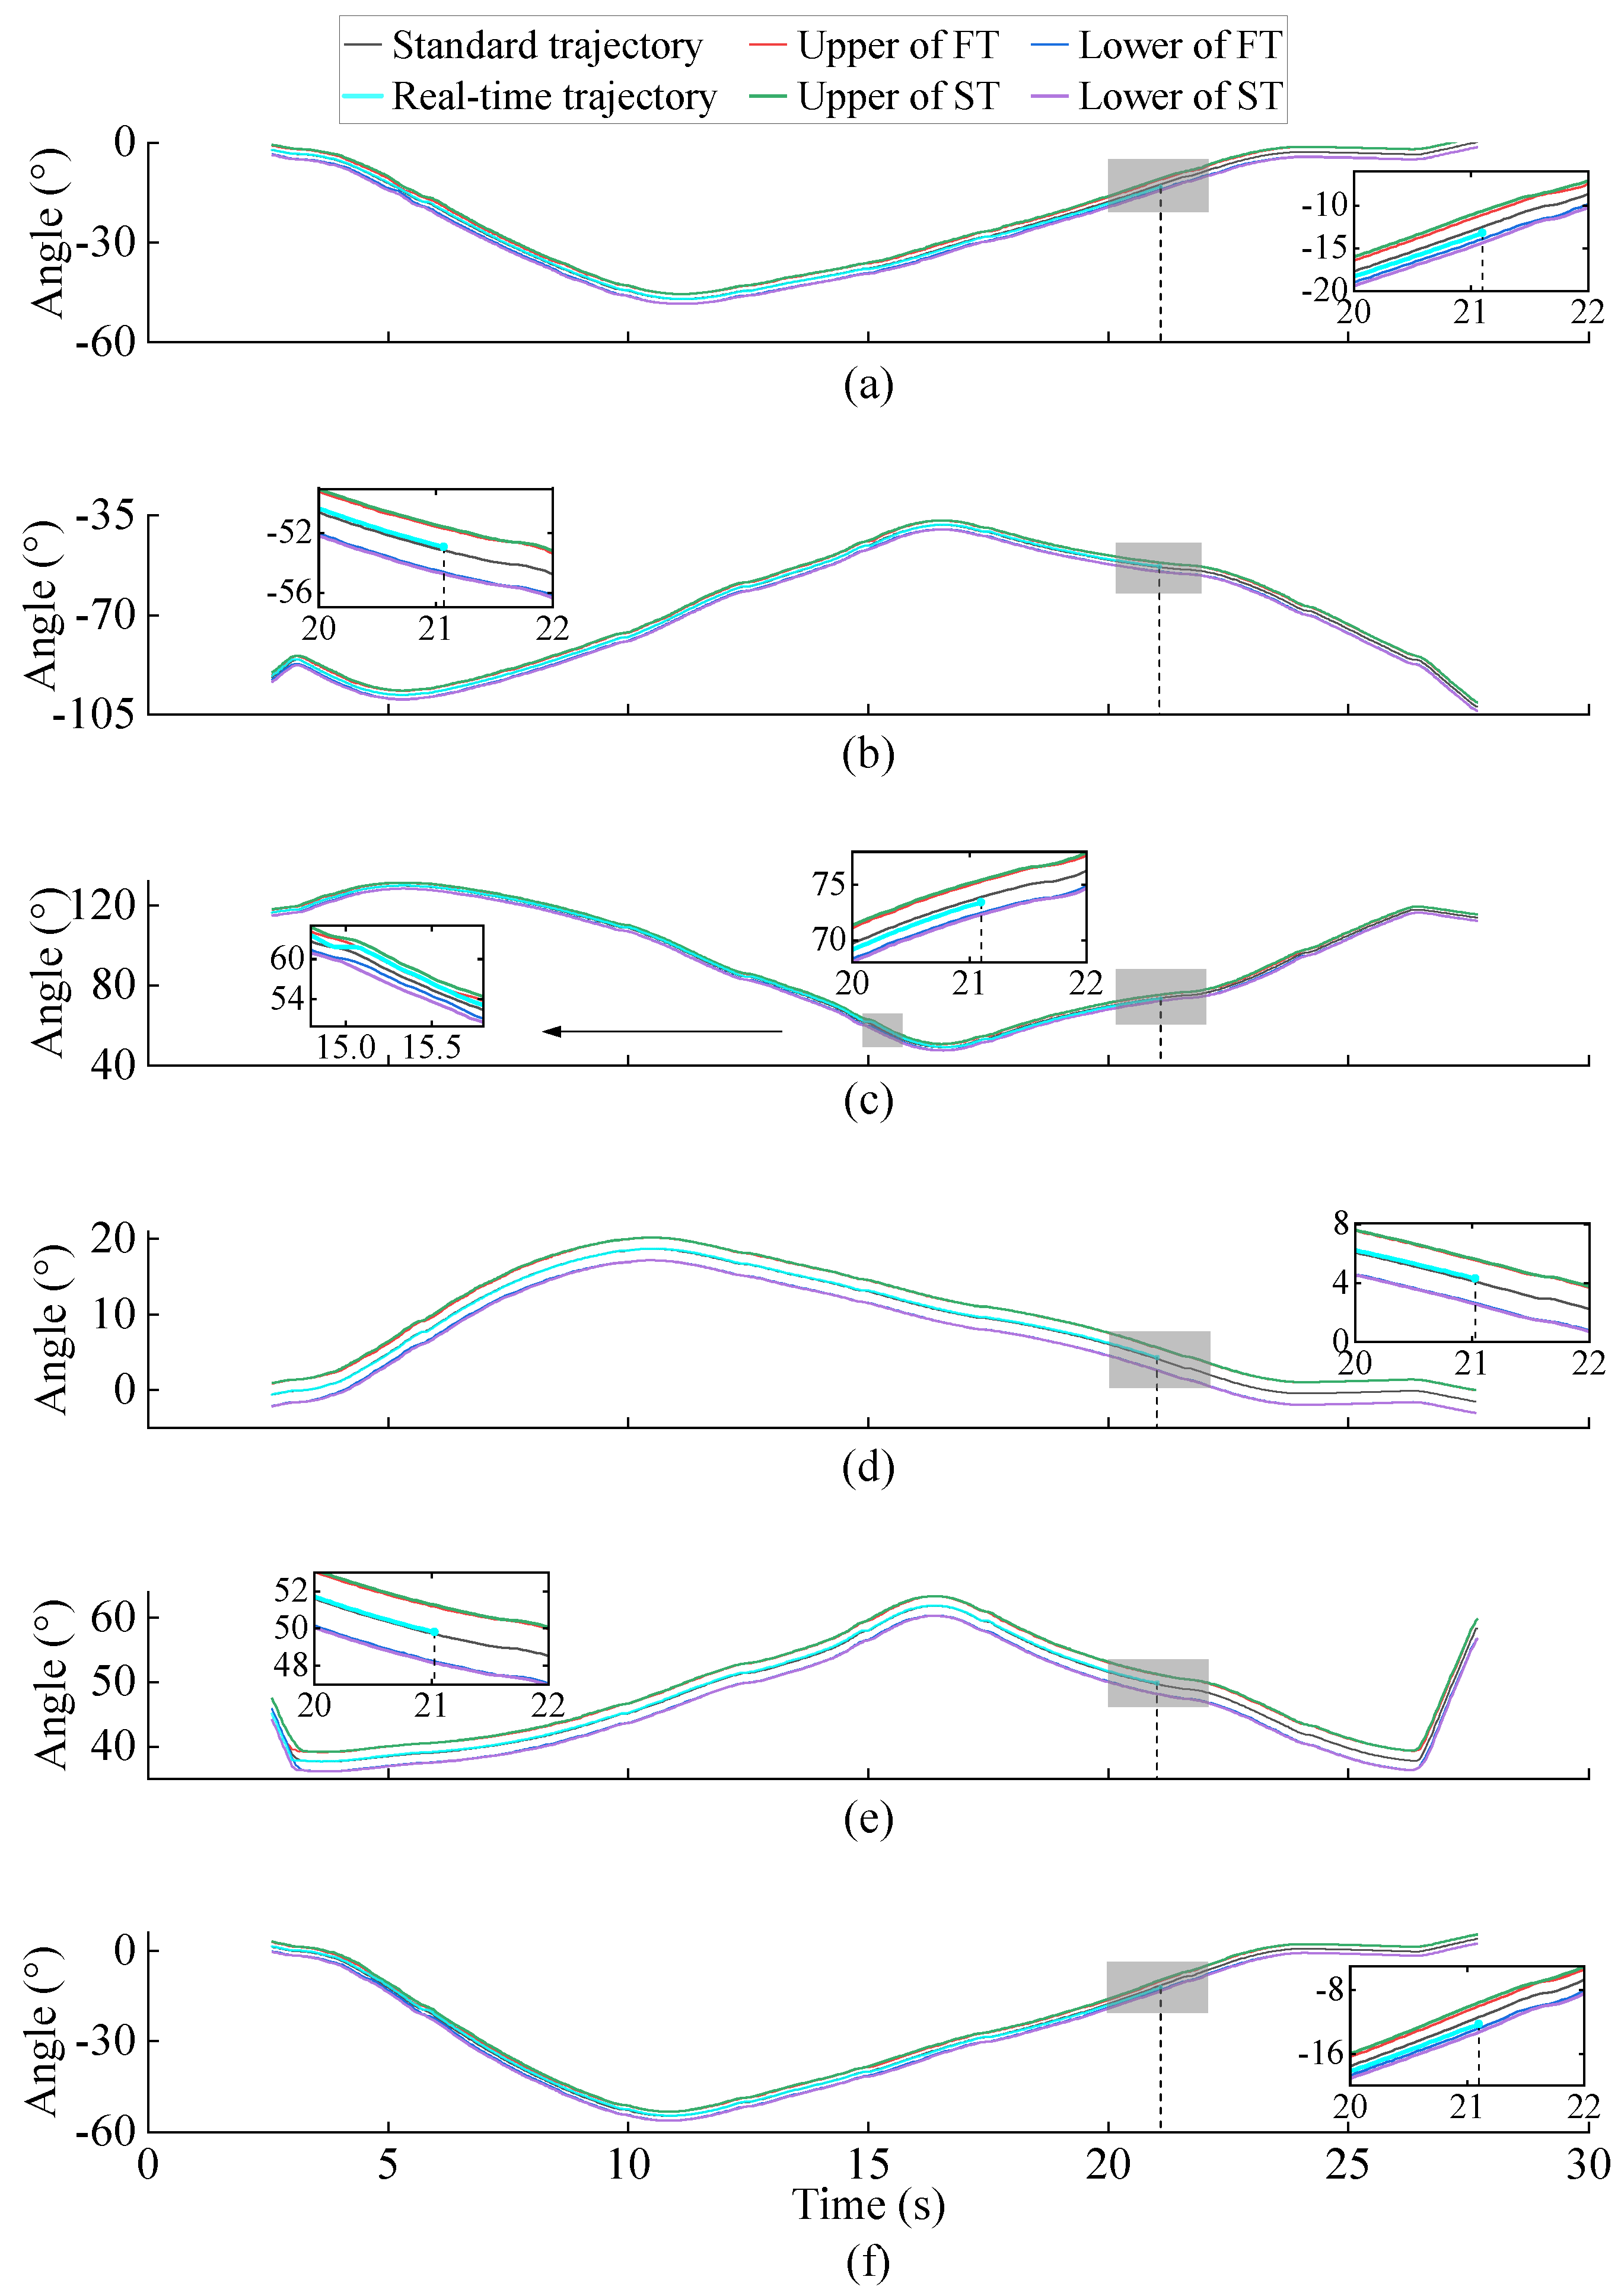
After the standard trajectory and threshold are obtained, the real-time axis trajectory curve is drawn by collecting the data of each axis of the operation in real-time to determine whether the robot trajectory deviates. If the real-time trajectory of an axis at a certain moment reaches the upper or lower bound of the FT, the system issues a deviation warning, and indicates that the axis is deviating at that moment. If the real-time trajectory of an axis at a certain moment exceeds the upper or lower bound of the ST, the system issues a shutdown command, and indicates that the axis deviation is too large at that moment and stops the robot. The trajectory judgment process of each axis of the six-axis IR is shown in Figure 9. The figure shows the real-time judgment process of the A1-A6 axis trajectory at 21.1 s. This method uses the real-time data of each axis at a certain time and the threshold at that time to determine whether the trajectory at that time has deviated. It can be seen from Figure 9 that at 21.1 s, the real-time data of each axis of the robot are near the standard trajectory at that time, and do not exceed the upper and lower bounds of the FT at that time. It indicates that the trajectory of the robot has not deviated at this moment and is in normal operation. In addition, Figure 9 also shows that the real-time data of axis A3 gradually deviates from the standard trajectory at 15.0 s, and tends to the upper bound of the FT at that time. It indicates that the trajectory of the A3 deviates at that time. The system will issue an A3 trajectory deviation warning. However, starting from 15.7 s, the real-time data of the A3 moved away from the upper bound of the FT, and gradually returned to the standard trajectory. It indicates that the A3 was gradually in normal operation again, and the A3 deviation warning was lifted.
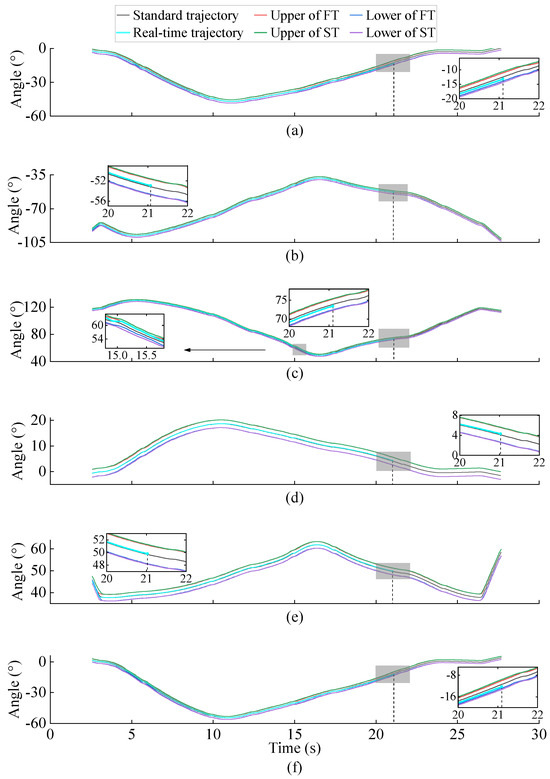
Figure 9.
Real-time judgment of each axis trajectories: (a) A1; (b) A2; (c) A3; (d) A4; (e) A5; (f) A6.
In addition, the judgment of the axis trajectory needs to be completed quickly and accurately to ensure that the robot responds promptly when each axis deviations occur. In order to evaluate the real-time performance of the proposed trajectory judgment algorithm, the duration used for the trajectory judgment of each axis is shown in Table 3. Table 3 lists six experiments to eliminate contingencies. Table 3 also calculates the total duration of all axis trajectory judgments and the average duration of each axis trajectory judgment for six experiments. As can be seen from Table 3, the average duration of the trajectory judgment for each axis of the six experiments does not exceed 1 ms, and the total duration of judgment for all axes is about 2.5–3.5 ms. It can be seen that the real-time judgment performance of the proposed trajectory judgment algorithm can reach the millisecond level, and it has a very high real-time performance, which can meet the needs of rapid response when the trajectory deviation of the robot.
Table 3.
The performance evaluation of axis trajectory judgment.
4. Conclusions
Aiming at the problem of sudden loss of control of welding robots and sudden damage to components, which poses a safety threat to itself, products, and personnel, this paper proposes a real-time judgment method for the trajectories of welding robots to improve safety in industrial production. This method removes and aligns the data of each axis of the robot that runs multiple times continuously. Simultaneously, the standard trajectory and judgment threshold of each axis are obtained through the strongly correlated data of each axis. Then, the real-time judgment of the welding robot trajectory deviation is realized through the judgment threshold. The feasibility of the proposed method was verified through the axis data and real-time operation data of six consecutive runs in a welding task. The proposed method removed the invalid values of the collected data and aligned the data phases. It identified weak correlation data in multiple runs, and obtained the standard trajectory and judgment thresholds. It determined the status of the real-time trajectory of each axis of the welding robot.
5. Future and Prospects
In the future, this method will be used in industrial production to monitor the real-time status of each axis trajectory of the welding robot, to ensure the reliability and safety of the welding production process. In addition, we will study the specific effects of factors such as robot model, working environment, and duration of use on trajectory thresholds, and extend the method to all cases rather than specific ones.
Author Contributions
Conceptualization, X.W. and Y.L.; methodology, X.W. and Y.L.; software, Y.L.; validation, X.W. and R.T.; formal analysis, Y.F.; investigation, X.W.; resources, H.G.; data curation, Y.L. and Y.F.; writing—original draft preparation, X.W. and Y.L.; writing—review and editing, Y.L. and H.G.; visualization, Y.L. and Y.F.; supervision, X.W. and R.T.; project administration, X.W. and H.G.; funding acquisition, H.G. All authors have read and agreed to the published version of the manuscript.
Funding
This work was funded in part by the National Natural Science Foundation of China, grant number 52275134, in part by the Sichuan Science and Technology Program, grant number 2023YFG0030, and in part by the technology development project of SWJTU, grant number KYL202212-0030.
Data Availability Statement
Data are contained within the article.
Conflicts of Interest
Author Renyong Tian was employed by the company CRRC Qingdao Sifang Co., Ltd. The remaining authors declare that the research was conducted in the absence of any commercial or financial relationships that could be construed as a potential conflict of interest.
References
- Liu, S.; Wu, C.; Liang, L.; Zhao, B.; Sun, R. Research on Vibration Suppression Methods for Industrial Robot Time-Lag Filtering. Machines 2024, 12, 250. [Google Scholar] [CrossRef]
- Chen, C.; Wang, T.; Liu, C.; Liu, Y.; Cheng, L. Lightweight Convolutional Transformers Enhanced Meta-Learning for Compound Fault Diagnosis of Industrial Robot. IEEE Trans. Instrum. Meas. 2023, 72, 3520612. [Google Scholar] [CrossRef]
- Raksiri, C.; Pa-im, K.; Rodkwan, S. An Analysis of Joint Assembly Geometric Errors Affecting End-Effector for Six-Axis Robots. Robotics 2020, 9, 27. [Google Scholar] [CrossRef]
- Wang, B.; Hu, S.J.; Sun, L.; Freiheit, T. Intelligent Welding System Technologies: State-of-the-Art Review and Perspectives. J. Manuf. Syst. 2020, 56, 373–391. [Google Scholar] [CrossRef]
- Han, G.; Zhang, H.; Wang, G. A Robotic Machining & Forming System for Rapid Spray Metal Tooling. ROBOT 2006, 28, 515–524. [Google Scholar]
- Gatla, C.S.; Lumia, R.; Wood, J.; Starr, G. An Automated Method to Calibrate Industrial Robots Using a Virtual Closed Kinematic Chain. IEEE Trans. Robot. 2007, 23, 1105–1116. [Google Scholar] [CrossRef]
- Zhang, Z. Fault Feature Extraction of Industrial Robot Gearbox Based on Sparse Autoencoder. Master’s Thesis, Kunming University of Science and Technology, Kunming, China, 2023. [Google Scholar]
- Kim, Y.; Park, J.; Na, K.; Yuan, H.; Youn, B.D.; Kang, C. Phase-Based Time Domain Averaging (PTDA) for Fault Detection of a Gearbox in an Industrial Robot Using Vibration Signals. Mech. Syst. Signal Process. 2020, 138, 106544. [Google Scholar] [CrossRef]
- Batista, J.; Souza, D.; Silva, J.; Ramos, K.; Costa, J.; dos Reis, L.; Braga, A. Trajectory Planning Using Artificial Potential Fields with Metaheuristics. IEEE Lat. Am. Trans. 2020, 18, 914–922. [Google Scholar] [CrossRef]
- Wang, G.; Li, W.; Jiang, C.; Zhu, D.; Li, Z.; Xu, W.; Zhao, H.; Ding, H. Trajectory Planning and Optimization for Robotic Machining Based on Measured Point Cloud. IEEE Trans. Robot. 2022, 38, 1621–1637. [Google Scholar] [CrossRef]
- Hao, F.; Xu, L.; Ju, J. Research on Curve Trajectory Planning Method for Articulated Robot. Mod. Mach. 2023, 1–6. [Google Scholar] [CrossRef]
- Seker, M.Y.; Tekden, A.E.; Ugur, E. Deep Effect Trajectory Prediction in Robot Manipulation. Robot. Auton. Syst. 2019, 119, 173–184. [Google Scholar] [CrossRef]
- Cheng, Y.; Sun, L.; Liu, C.; Tomizuka, M. Towards Efficient Human-Robot Collaboration with Robust Plan Recognition and Trajectory Prediction. IEEE Robot. Autom. Lett. 2020, 5, 2602–2609. [Google Scholar] [CrossRef]
- Li, D.; Yang, H.; Deng, H.; Huang, J. Adaptive Trajectory Tracking Controller for Snake Robot Tracking Error Prediction. Chin. J. Sci. Instrum. 2021, 42, 267–278. [Google Scholar]
- Gonzalez, M.K.; Theissen, N.A.; Barrios, A.; Archenti, A. Online Compliance Error Compensation System for Industrial Manipulators in Contact Applications. Robot. Comput.-Integr. Manuf. 2022, 76, 102305. [Google Scholar] [CrossRef]
- Li, R.; Ding, N.; Zhao, Y.; Liu, H. Real-Time Trajectory Position Error Compensation Technology of Industrial Robot. Measurement 2023, 208, 112418. [Google Scholar] [CrossRef]
- Zhao, N.; Murakami, K.; Yamakawa, Y. Vision Based Trajectory Dynamic Compensation System of Industrial Robot. Int. J. Adv. Manuf. Technol. 2024, 131, 6013–6026. [Google Scholar] [CrossRef]
- Song, F.; Chen, S. Fundamentals of Statistics; Modern Education Press: Beijing, China, 2011. [Google Scholar]


Disclaimer/Publisher’s Note: The statements, opinions and data contained in all publications are solely those of the individual author(s) and contributor(s) and not of MDPI and/or the editor(s). MDPI and/or the editor(s) disclaim responsibility for any injury to people or property resulting from any ideas, methods, instructions or products referred to in the content. |
© 2024 by the authors. Licensee MDPI, Basel, Switzerland. This article is an open access article distributed under the terms and conditions of the Creative Commons Attribution (CC BY) license (https://creativecommons.org/licenses/by/4.0/).