Article

A Comparative Study on Coupled Fluid–Thermal Field of a Large Nuclear Turbine Generator with Radial and Composited Radial–Axial–Radial Ventilation Systems

College of Marine Electrical Engineering, Dalian Maritime University, Dalian 116026, China
*
Author to whom correspondence should be addressed.
Machines 2024, 12(5), 326; https://doi.org/10.3390/machines12050326
Submission received: 29 March 2024 / Revised: 27 April 2024 / Accepted: 6 May 2024 / Published: 10 May 2024

Abstract

:
With the continuous growth of energy demand, the advantages of nuclear power, such as high energy density, low emissions, and cleanliness, are gradually highlighted. However, the increasing capacity of the turbine generator in nuclear power plants has led to greater losses and critical heating issues. Designing an effective cooling system plays an important role in improving the rotor’s heat dissipation ability, especially under the condition of limited rotor space. In this study, the cooling effects of the rotor using a radial straight-type cooling structure and a composited radial–axial–radial cooling structure are compared and analyzed for a 1555 MVA hydrogen-cooled nuclear turbine generator. Three-dimensional fluid thermal coupled models of the rotor with both cooling structures are established, and corresponding boundary conditions are provided. The models are solved using the finite volume method. The flow law of cooling hydrogen gas inside the rotor and the temperature distribution of various parts of the rotor are studied in detail. Compared with the radial straight-type cooling structure, adopting the composited radial–axial–radial cooling structure can reduce the average temperature of the rotor field windings by 4.5 °C. The research results provide a reference for the design and optimization of the rotor cooling system for large-capacity nuclear turbine generators.

1. Introduction

With the continuous development of the economy, the demand for clean and efficient electric power is increasing. Nuclear energy, as a high-energy-density resource, can better meet the growing demand for electricity, and its high stability also contributes to the reliable operation of the power grid [1]. Additionally, nuclear power is a clean energy source with low carbon emissions that is good for the economy and sustainable [2]. Therefore, it is expected that the single-machine capacity of nuclear turbine generators will continue to increase, but this poses the problem of increased losses. To ensure the safe and reliable operation and service life of nuclear power steam turbine generators, adopting a more effective cooling method and ventilation structure to reduce the temperature rise of the generator has become one of the key technologies in the design of nuclear turbine generators.
To reduce the temperature rise in the turbine generator, numerous scholars have studied the fluid field and temperature field of the stator and rotor of the turbine generator [3,4,5,6]. For the rotor of the steam turbine generator, its cooling structure is complex, and it is also affected by rotational motion during operation, making it difficult to study the fluid field and temperature field inside the rotor through experimental methods [7]. Currently, temperature prediction methods mainly include lumped parameter thermal networks and numerical analysis [8,9]. Lumped parameter thermal networks depend excessively on empirical formulas and coefficients and cannot predict the flow characteristics of the cooling medium in the motor [10]. In contrast, the numerical calculation method can accurately predict the fluid movement and rotor temperature distribution in the complex cooling system of the rotor [11,12].
The cooling method of the turbine generator rotor usually adopts a sub-slot cooling system, where the cooling medium flows in a turbulent state in the ventilation duct [13]. Different ventilation duct structures directly affect the cooling effect and temperature distribution of the rotor. For the sub-slot at the bottom of the rotor, the profile of the sub-slot will affect the velocity distribution of the cooling medium inside the radial ventilation duct and the heat dissipation performance. The profile of the sub-slot at the bottom of the rotor slot is often tapered smoothly from the inlet of the sub-slot to the axial center, which helps to enhance the pressure of the hydrogen gas cooling the axially middle part of the rotor, improving the cooling effect of the rotor [14]. Regarding the ventilation duct inside the rotor winding, when using radial straight-type ventilation ducts, changing the inclination angle of the radial ventilation duct can improve the vortex phenomenon inside the ventilation duct but does not affect the temperature distribution of the rotor [15]. To further reduce the temperature rise of the rotor, a solution of adopting a composited radial–axial–radial cooling structure inside the rotor field winding has been proposed. However, there is currently limited research on the temperature distribution of the rotor when such a ventilation system structure is adopted for the turbine generator rotor [16,17].
This paper studies the cooling performance of a 1555 MVA nuclear turbine generator belonging to the CAP 1400 model nuclear power plant. CAP 1400 is the model of a large-scale advanced pressurized water reactor nuclear power plant independently developed by China. It is based on the concept of passive safety, adopts the latest international standards, and meets the strictest emission requirements. It is one of the safest and most advanced third-generation nuclear power models in the world today.
In this study, a 1555 MVA nuclear turbine generator is taken as the research object to investigate the flow law of cooling hydrogen gas inside the rotor and the temperature rise distribution of various parts of the rotor when the rotor adopts two schemes: a radial straight-type cooling structure and a composited radial–axial–radial cooling structure. Firstly, three-dimensional fluid thermal coupled models of two cooling structures are established. Subsequently, by giving reasonable boundary conditions and using the standard k−ε turbulent model, numerical calculations are performed on the models of the two cooling structures to obtain the temperature distribution of the cooling hydrogen gas and various components of the rotor. Finally, a detailed comparative analysis of the temperature distributions along the axial and radial directions of the rotor field winding in the two cooling structures is conducted. The research results show that the composited radial–axial–radial cooling structure can reduce the temperature rise of the rotor field winding.
The cooling performance of large-capacity generators is one of the most critical issues that directly influence the safety, reliability, and economy of generator operation, especially in the situation of continuously increasing power rating. The research results can help to improve the cooling performance of existing ventilation systems and develop more effective ones. It is very valuable for reference to develop a larger capacity turbine generator towards 2000 MVA.

2. Establishment and Simulation of the Fluid Thermal Coupling Model for the 1555 MVA Nuclear Turbine Generator Rotor

2.1. Rotor Cooling System Structure

The basic parameters of the 1555 MVA half-speed nuclear turbine generator studied in this paper are shown in Table 1.
The rotor of the turbine generator studied in this paper adopts an axial bidirectional symmetrical sub-slot ventilation cooling system, as illustrated in Figure 1. The cooling hydrogen gas is driven by a multi-stage compressor axial fan at both ends of the rotor, and the flowing path of cooling hydrogen gas can be divided into two branches.
A portion of the hydrogen gas enters the sub-slot inlet and then flows axially along the rotor’s sub-slot. A certain proportion enters the rotor slots radially through radial ventilation ducts to cool the rotor Finally, the hydrogen gas is discharged through the ventilation outlet into the air gap and joins with the cooling hydrogen gas, directly entering the air gap and entering the hot gas region of the stator core. The other branch of hydrogen gas flows into the stator cold air region through the inlet duct on the back of the stator yoke, cooling the stator core and armature winding. Then, it converges with the hot hydrogen gas discharged from the rotor and enters the hot gas region of the stator together. Finally, it enters the cooler through the outlet duct to complete a cooling circulation.
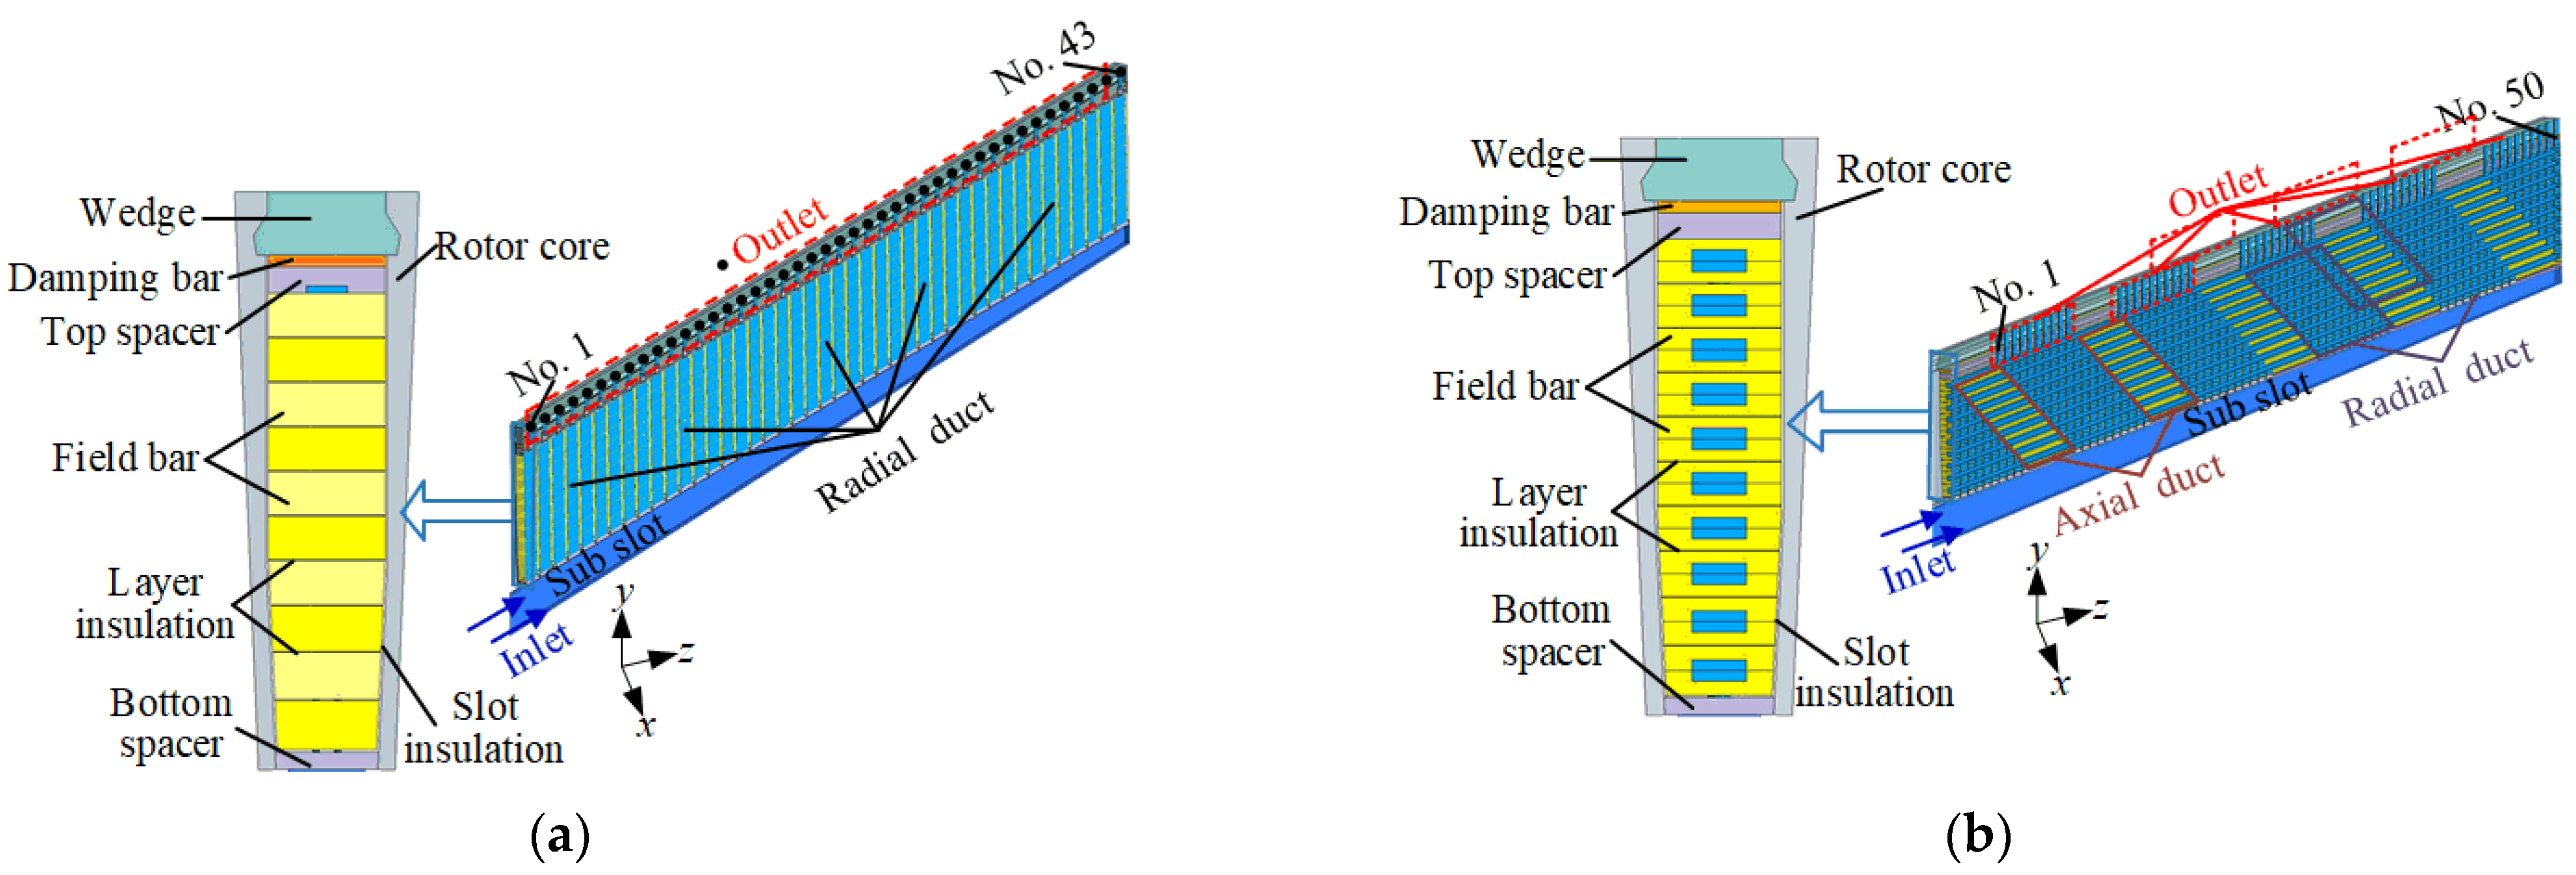
The ravdial straight-type ventilation duct (Scheme 1) is generally applied in the rotor’s sub-slot cooling system, as shown in Figure 2a. This paper focuses on studying an improved composited radial–axial–radial sub-slot rotor cooling system (Scheme 2), as shown in Figure 2b. A comparative study is conducted between the traditional radial straight-type cooling structure and the proposed Scheme 2 regarding the flow characteristics of the cooling gas inside the rotor and the temperature rise distribution of rotor components.
In Scheme 1, the cooling structure consists of 43 radial straight-type ventilation branches, each with the same flow path. Initially, cooling hydrogen gas enters the radial ventilation ducts through the rotor’s bottom sub-slot and then passes radially through the rotor slots to cool them. Subsequently, the cooling hydrogen gas flows out through the radial ventilation duct of the rotor and carries away the losses generated by the rotor.
In Scheme 2, the cooling system consists of five groups of composited radial–axial–radial ventilation ducts, with each group containing ten ventilation branches. Each branch includes a first-section radial ventilation duct, an axial ventilation duct, and a second-section radial ventilation duct. In the first branch of each group, the first-section radial ventilation duct passes through copper bars 1~10, followed by connecting to the axial ventilation duct located inside copper bar 10, and then the second-section radial ventilation duct passes through copper bar 10. Similarly, in the tenth branch, the first-section radial ventilation duct only passes through field bar 1, the axial ventilation duct is inside field bar 1, and the second-section radial ventilation duct runs through field bars 1–10.
In each ventilation branch, cooling hydrogen gas initially enters each group of ventilation ducts through the rotor’s bottom sub-slot, flows through the field bars in the radial–axial–radial direction, and finally exits through the radial ventilation ducts of the rotor to the air gap, completing the cooling of the rotor field bars.

2.2. Rotor Three-Dimensional Fluid Thermal Field Coupling Physical Model

The three-dimensional fluid thermal field coupling physical models of the two schemes are established, as shown in Figure 3. Since the cooling system of the rotor is symmetrical in the axial direction, and the rotor slots are periodical in the circumferential direction, the solution models of both schemes consist of a half axial length of one rotor slot. The heat generation and heat dissipation conditions inside each rotor slot are assumed to be the same, and the surfaces of various components are assumed to be smooth and closely connected. The established solution domain includes a slot wedge, a damping bar, rotor slot wedges, field bars 1~10, layer insulation and slot insulation, a slot bottom wedge, and a rotor core. The established model in Scheme 1 includes a sub-slot inlet and 43 outlets numbered from the rotor end region to the axial center, while the model in Scheme 2 includes a sub-slot inlet and 50 outlets to the air gap.

2.3. Rotor Three-Dimensional Fluid Thermal Field Coupling Mathematical Model

Due to the complexity of the cooling structure of the turbine generator rotor and the turbulent flow of the cooling hydrogen gas, it is considered to be in a turbulent state. At the same time, the cooling hydrogen gas is treated as an incompressible fluid. Based on fluid mechanics and heat transfer theory, coupled governing equations for the fluid field and temperature field within the solution domain are established, which comply with mass conservation, momentum conservation, and energy conservation equations [18,19].
  • Mass conservation equation
ρ t + ( ρ u ) x + ( ρ v ) y + ( ρ w ) z = 0
where t is the time (s); ρ is the density of the cooling medium (kg/m3); and u, v, and w are the velocity components of the velocity vector u along the x-, y-, and z directions, respectively (m/s).
2.
Momentum conservation equation
( ρ u ) ( t ) + d i v ( ρ u u ) = d i v ( μ g r a d u ) p x + S u ( ρ v ) ( t ) + d i v ( ρ v u ) = d i v ( μ g r a d v ) p y + S v ( ρ w ) ( t ) + d i v ( ρ u w ) = d i v ( μ g r a d w ) p z + S w
where μ is the viscosity coefficient; p is the pressure on the fluid microelement (Pa); and Su, Sv, and Sw are the generalized source terms of the momentum equation along the x-, y-, and z directions.
3.
Energy conservation equation
ρ T t + div ( ρ u ) = div ( λ c p grad T ) + S T
where T is the temperature (°C); cp is the specific heat capacity [J/(kg·°C)]; λ is the heat transfer coefficient of a convective fluid [w/(m·°C)]; and ST is the portion of fluid mechanical energy converted into thermal energy.
In fluid field calculations, the standard k−ε model control equation is widely used in fluid field calculations. In this paper, the standard k−ε equation is used to simulate the turbulent state of the cooling hydrogen flow [20]. The solving equation is represented by Equation (4).
t ρ k + x i ρ k u i = x j μ + μ t σ k k x j + G k ρ ε t ρ ε + x i ρ ε u i = x j μ + μ t σ ε ε x j + C 1 ε ε k G k C 2 ε ρ ε 2 k
where k = 1 2 u i u i ¯ represents turbulent kinetic energy and is known as the k-equation; ε = ν u i u i ¯ x l x l represents the energy dissipation rate and is known as the ε-equation; Gk is the turbulence generation rate, G k = μ t u i x j + u j x i u j x i ; μt is the turbulent viscosity coefficient, μ t = ρ C μ k 2 ε ; σk and σε are the turbulent Prandtl numbers for the k-equation and ε-equation, respectively; and C1ε and C2ε are constants, which are 1.44 and 1.92 in this simulation, respectively.

2.4. Boundary Conditions and Numerical Solution

Due to the complex structure of the rotor cooling system, a high computational cost is required. During the solution process, the cooling hydrogen gas is assumed to be incompressible and in a turbulent state, while the effects of buoyancy and gravity are neglected. The cooling effects at both ends of the generator rotor are assumed to be consistent, and hence the axial cross-section of the generator and the rotor tooth center surface are considered as adiabatic boundary conditions. The inlet of the bottom sub-slot is considered a pressure boundary, with a pressure of 1840 Pa and a cooling hydrogen gas temperature of 50 °C at the inlet. The outlet of the radial ventilation ducts on the rotor surface is considered a natural flow outlet. The interface between the cooling hydrogen gas and the rotor structural components is set as a coupled solution boundary.
The material attributes involved in this simulation are summarized in Table 2.
Meshing the solution model is an important part of the numerical solution process, and the quality of the mesh affects the convergence speed of the numerical solution accuracy of the final results. Due to the relatively long axial length of the turbine generator and the extremely small insulation thickness inside the slots, the ratio of the maximum size to the minimum size in the solid model is close to 104, resulting in complex mesh discretization of this solid model. Hexahedral meshes are used to discretize the solution domain, and additional mesh refinement is performed for insulation, field bars, and various fluid domains. Table 3 provides the mesh division information for the solution models of the two schemes.
The software package Fluent 6.3 is used to conduct the coupled fluid thermal simulation with an i7-10700 @2.90 GHz processor and a 32 GB RAM desktop PC. The pressure-based solver, which is suitable for low speed and incompressible fluid in Fluent, is used. The solver first obtains the velocity field from the momentum equation and then modifies the velocity field from the pressure equation to satisfy the continuity condition. Since the pressure equation is derived from the continuity equation and the momentum equation, the simulation of the flow field can satisfy the conservation of mass and momentum at the same time. The SIMPLE segregated Algorithms and Green-Gauss node-based gradient are selected in the simulation process. The residual of continuity, velocity, k, and ε are set as 0.001, and the residual of energy is 10−6.

3. Cooling Hydrogen Gas Flow Patterns and Temperature Distribution

The rotor cooling system presents a complex structure. Analyzing the influence of the ventilation duct on the flow patterns of the cooling hydrogen gas is helpful for understanding the temperature variation patterns of various heating components in the motor and their causes. Additionally, it can provide guidance for designers to develop more rational and efficient cooling systems. This section analyzes the flow patterns of the cooling hydrogen gas and the temperature variation within the rotor cooling system.

3.1. Flow Patterns of Cooling Hydrogen Gas

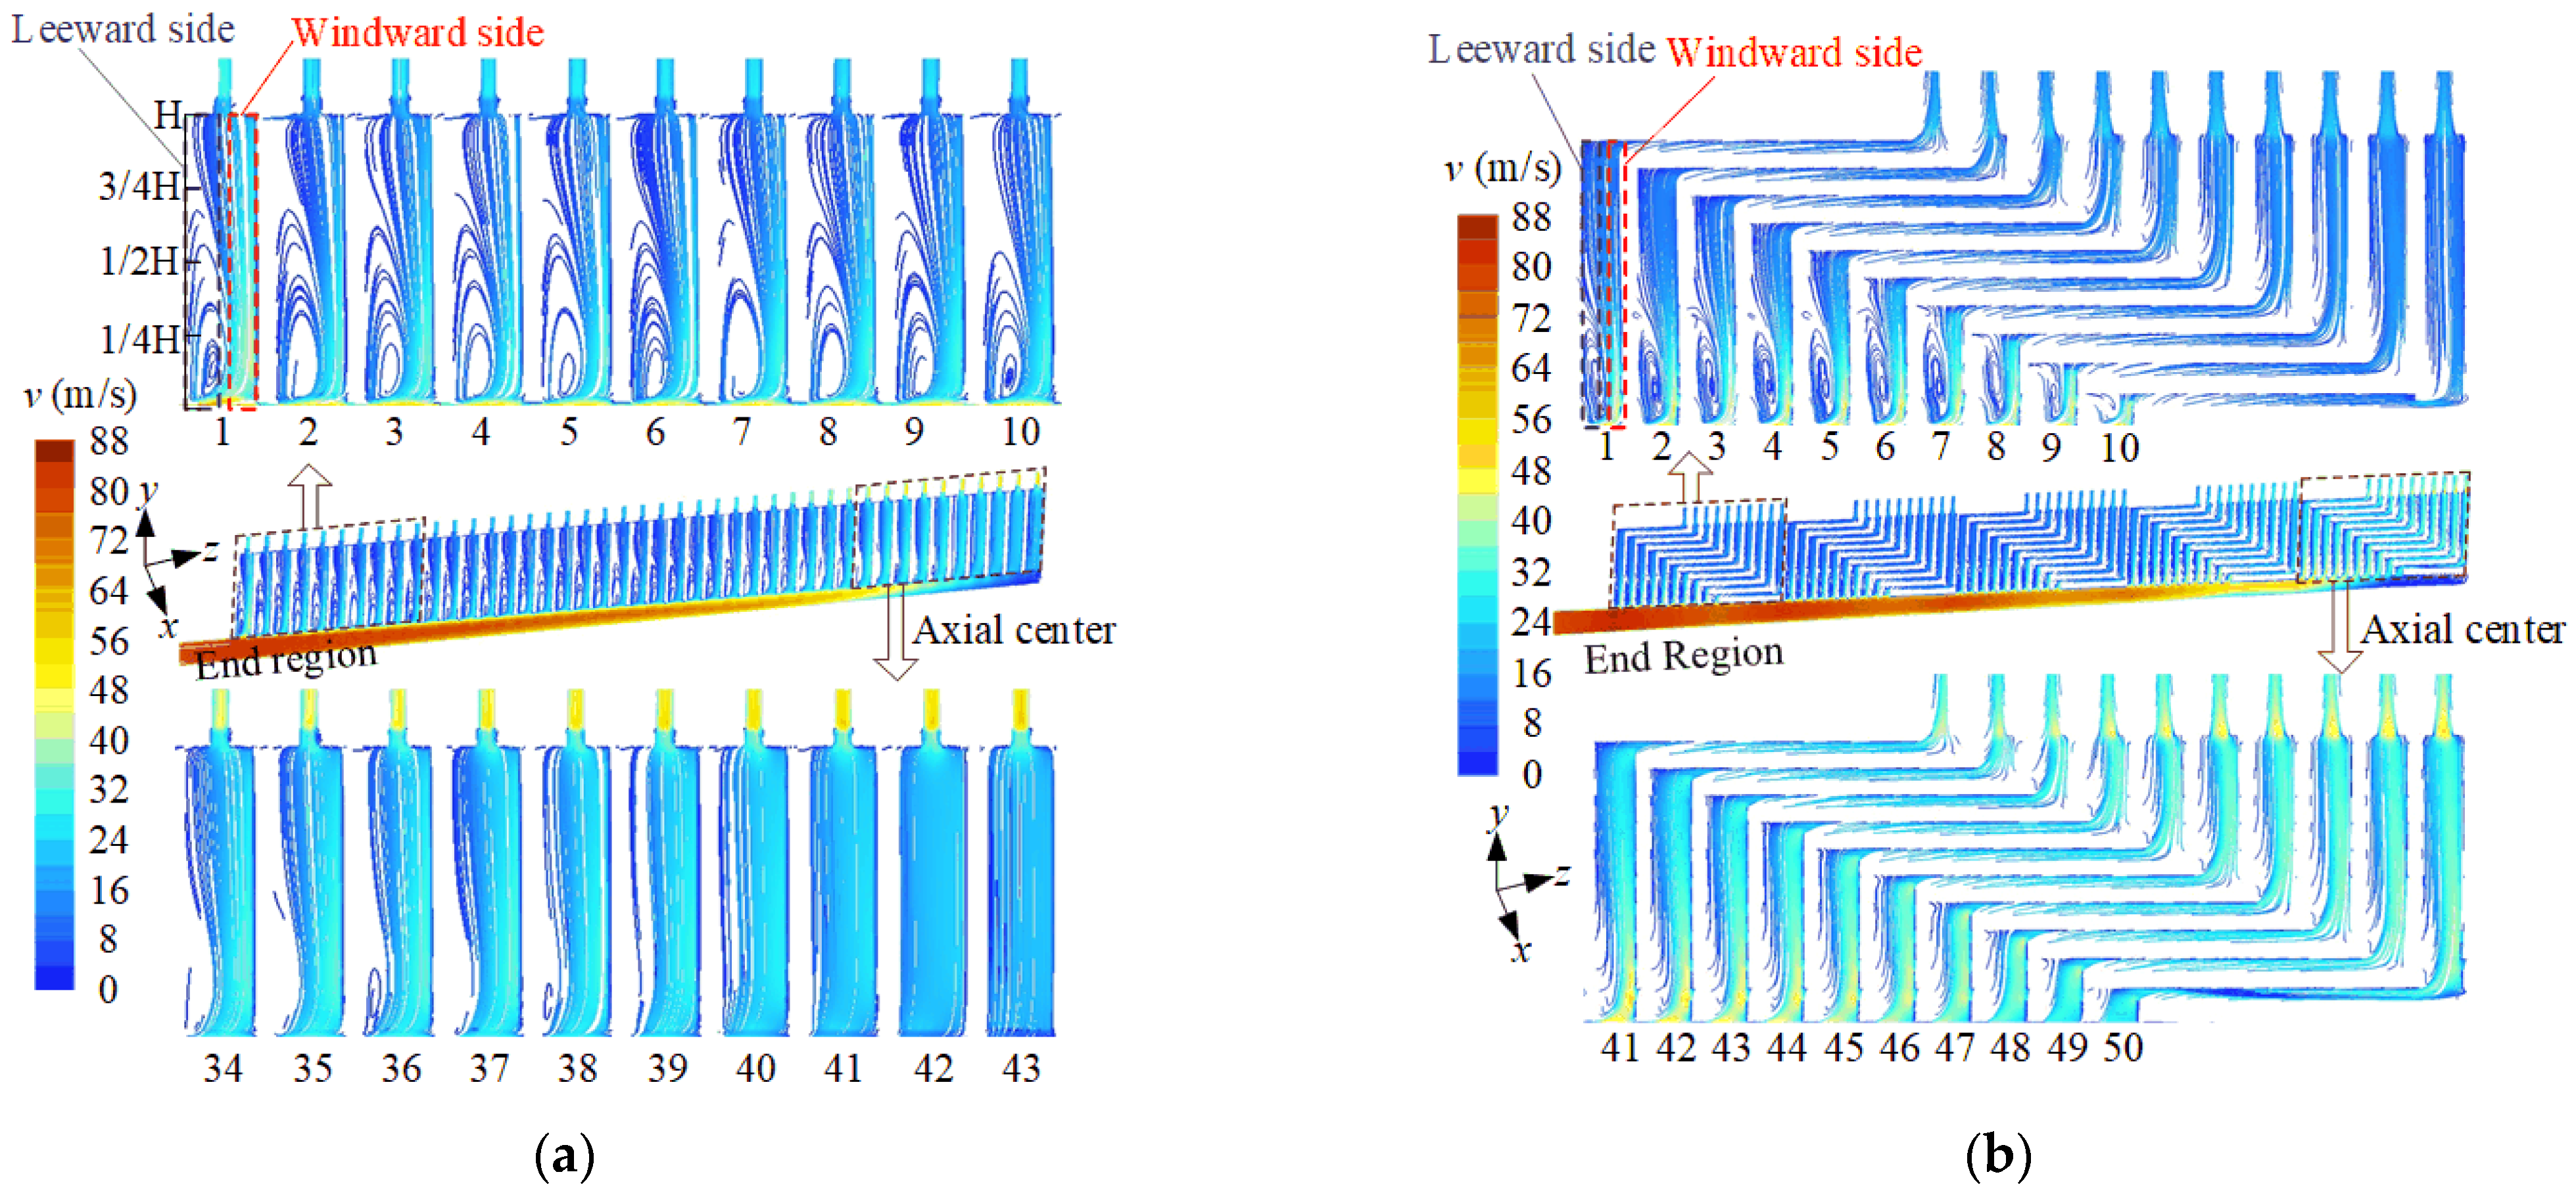
Figure 4a illustrates the velocity vector of cooling hydrogen gas within the ventilation ducts in Scheme 1. In Scheme 1, the hydrogen gas velocity is highest at the inlet of the bottom sub-slot, reaching 87.6 m/s. As the cooling hydrogen gas flows axially within the bottom sub-slot, a portion of it enters the radial ventilation ducts, causing a gradual reduction in the flow rate of the cooling hydrogen gas within the sub-slot. In the radial ventilation ducts, the proximity of radial ventilation ducts 1~10 to the bottom sub-slot inlet presents a challenge, as the high flow velocity of cooling hydrogen gas within the sub-slot makes the transition from axial to radial flow direction difficult. Consequently, notable vortices form on the leeward side of the radial ventilation ducts, with vortex heights ranging from 1/2~3/4 height of the rotor slot. In locations where these vortices occur on the leeward side, the flow rate of the cooling hydrogen gas decreases. The disparity in flow velocity between the windward and leeward sides of radial ducts 1~10 is significant. For instance, in radial duct 1, the difference in flow velocity between the windward and leeward sides can reach up to 30 m/s. Conversely, in radial ducts 34~43 near the axial center, the flow velocities on the windward and leeward sides remain relatively consistent at approximately 20 m/s. This phenomenon arises from the lower flow velocity of cooling hydrogen gas within the bottom sub-slot near the axial center, facilitating an easier change in flow direction without the formation of vortices on the leeward side of the ventilation ducts.
Figure 4b depicts the velocity vector diagram of the cooling hydrogen gas within Scheme 2’s cooling system. Similar to Scheme 1, in Scheme 2, the cooling hydrogen gas velocity is highest near the inlet of the bottom sub-slot, reaching 84.6 m/s. However, unlike Scheme 1, the velocity of the cooling hydrogen gas within the bottom sub-slot does not gradually decrease along the axial direction but shows a slight increase followed by a decrease after passing through the inlet of each radial ventilation duct.
In the first-section radial ventilation ducts of the first four groups, similar to Scheme 1, distinct vortices form on the leeward side of the radial ventilation ducts, with windward side velocities higher than those on the leeward side. For instance, in the first group of radial ventilation ducts, the average flow velocity of the windward side cooling hydrogen gas is approximately 40 m/s, about 30 m/s higher than that on the leeward side. Differently from Scheme 1, near the bottom of radial ventilation ducts in the fifth group, although vortices do not form on the leeward side, the flow of cooling hydrogen gas is minimal on the leeward side, concentrated mainly on the windward side, where the average flow velocity of the cooling hydrogen gas is about 50 m/s.
In Scheme 2, it is noteworthy that after the cooling hydrogen gas passes through the axial ventilation duct and enters the second section of the radial ventilation duct, the flow velocities of the cooling hydrogen gas on the windward side and the leeward side tend to equalize. The flow velocity of the cooling hydrogen gas in the fifth group of ventilation ducts is higher than that in the first group. In the first group of radial ventilation ducts, the flow velocity of the cooling hydrogen gas is approximately 18 m/s, while in the fifth group of radial ventilation ducts, it is approximately 35 m/s.

3.2. Temperature Distribution of Cooling Hydrogen Gas

Figure 5a illustrates the temperature distribution of cooling hydrogen gas inside the rotor for Scheme 1. The temperature of the cooling hydrogen gas exhibits a trend of initially increasing from ventilation duct 1~43 and then decreasing. Within each radial ventilation duct, the temperature of the cooling hydrogen gas gradually increases radially from the bottom to the top of the duct. Furthermore, within the radial ventilation duct, the temperature of the windward side cooling hydrogen gas is lower than that of the leeward side cooling hydrogen gas. This discrepancy arises because the higher windward side gas velocity results in a relatively brief heat exchange process with the heating bars, while the lower leeward side gas velocity allows for more substantial heat exchange. In Scheme 1, the regions with higher temperatures of the cooling hydrogen gas primarily concentrate on the leeward side of the duct top, specifically ventilation ducts 9~16, with the highest temperature reaching approximately 93 °C.
Figure 5b presents the temperature distribution of cooling hydrogen gas for Scheme 2. The temperature of the cooling hydrogen gas exhibits a trend of initially increasing and then decreasing from the first group to the fifth group of ventilation ducts. Taking the second group of ventilation ducts with higher temperatures as an example, within the first-section radial ventilation ducts, the temperature of the cooling hydrogen gas similarly increases radially. However, the cooling hydrogen gas temperature is lower, ranging from 53 to 64 °C. Subsequently, as the cooling hydrogen gas enters the axial ventilation duct, its temperature gradually rises, ranging from 56 °C to 76 °C. Upon entering the second-section ventilation ducts, the temperature of the cooling hydrogen gas reaches its peak, continuing to increase radially, with a range of 61~84 °C. Compared to Scheme 1, Scheme 2 achieves a reduction of 9 °C in the maximum temperature of the cooling hydrogen gas.
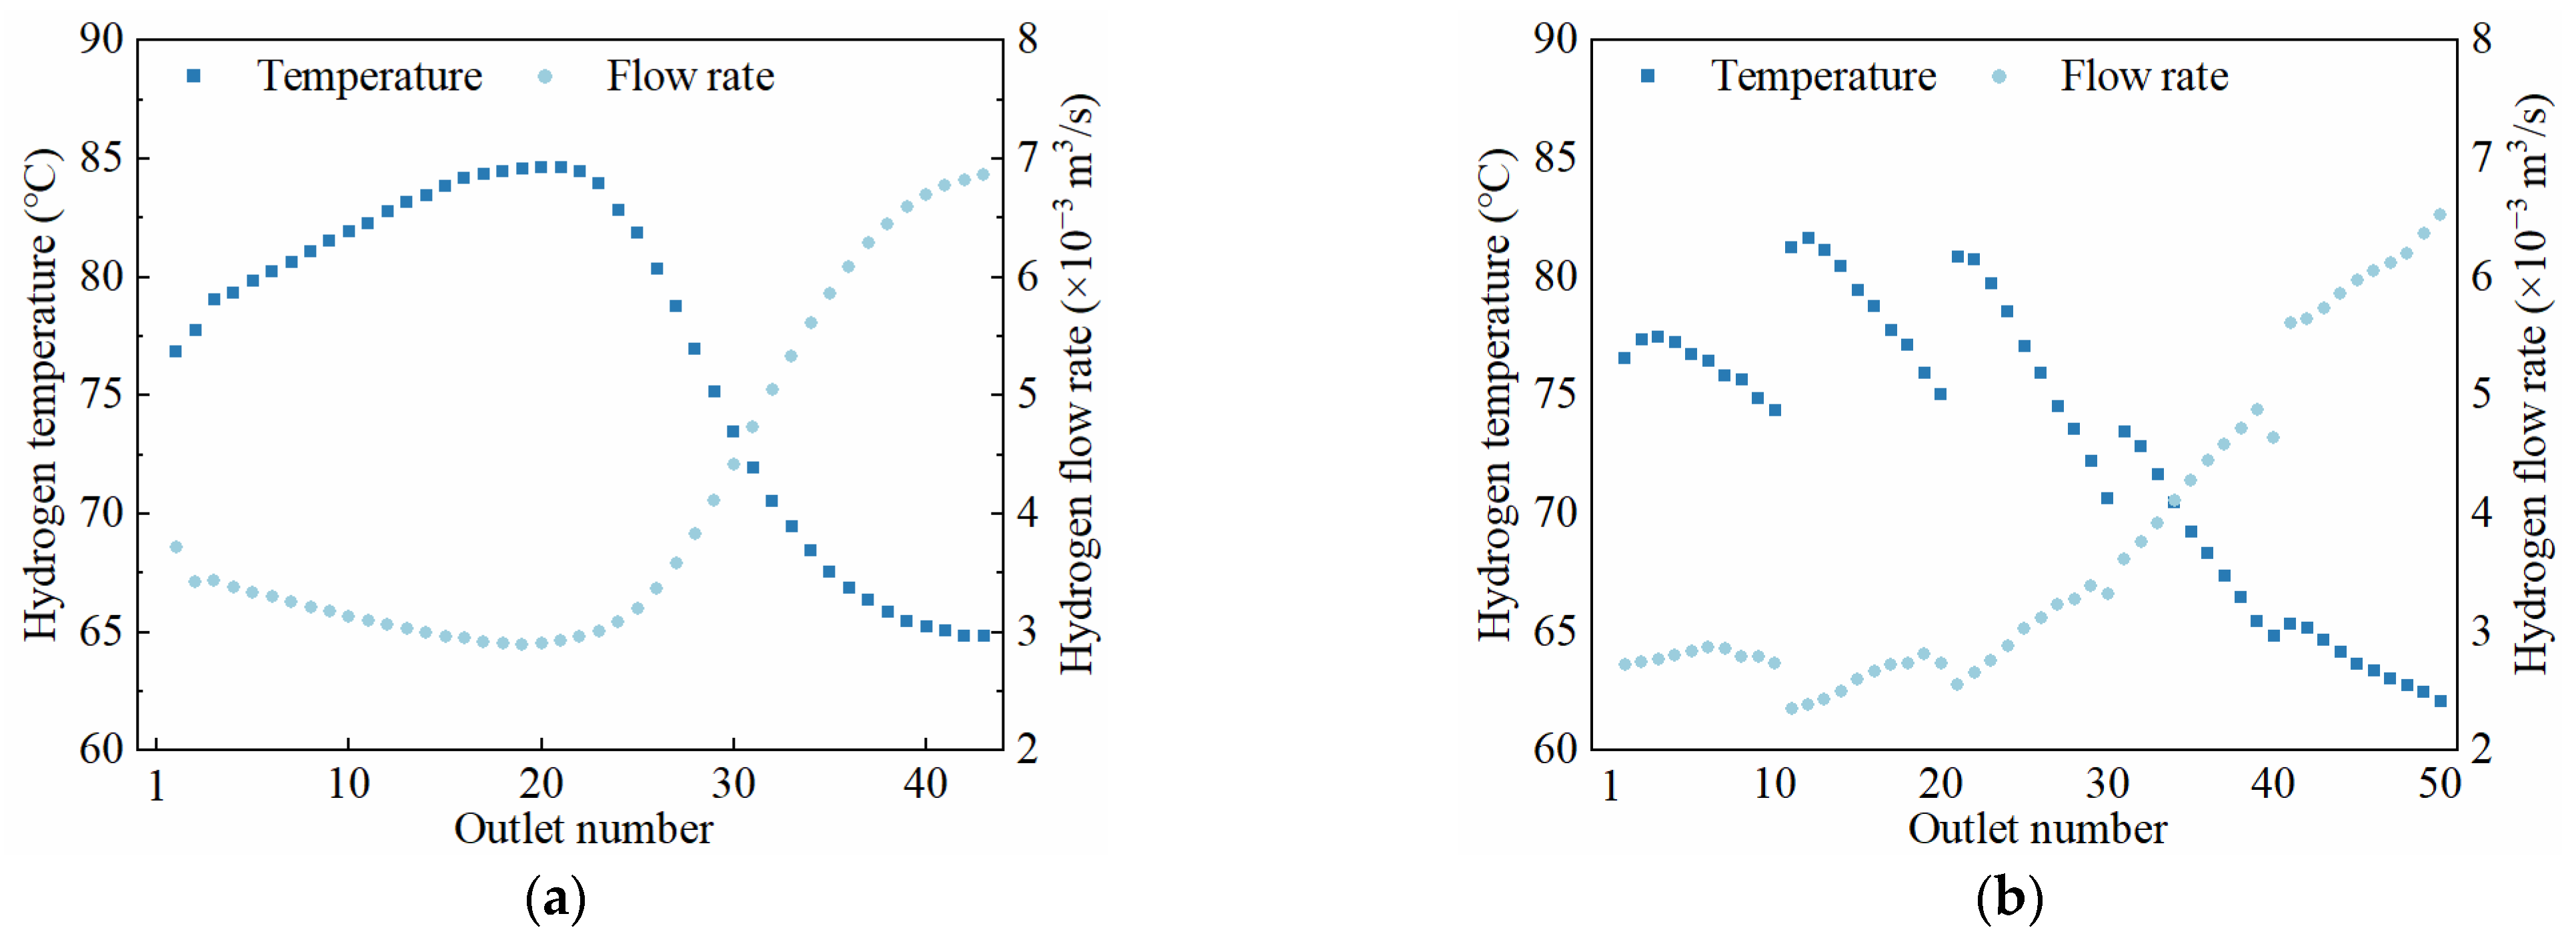
To further compare and investigate the cooling performance of the two schemes, Figure 6 illustrates the variation in flow rate and temperature of the cooling hydrogen gas at each rotor outlet for both schemes. Figure 6a depicts the temperature distribution and flow rate of cooling hydrogen gas at each rotor outlet in Scheme 1. The temperature variation of the cooling hydrogen gas is inversely proportional to the flow rate variation. This is because an increase in the cooling hydrogen gas flow rate enhances the cooling performance of the rotor field bars while simultaneously reducing the temperature of the cooling hydrogen gas. The flow rate of the cooling hydrogen gas decreases from outlet 1 to 43, showing a decreasing trend after an initial increase. The lowest flow rate appears at outlet 20, with a flow rate of 2.9 × 10⁻³ m3/s, while the highest flow rate is at outlet 43, 2.4 times that of outlet 20. The average temperature of the cooling hydrogen gas at outlet 20 is the highest, reaching 84.7 °C, which is 19.8 °C higher than the lowest temperature at outlet 43.
Figure 6b illustrates the temperature distribution and flow rate of cooling hydrogen gas at each rotor outlet in Scheme 2. The overall variation trend of temperature and flow rate of the cooling hydrogen gas is similar to Scheme 1. However, in Scheme 2, both the temperature and flow rate of the cooling hydrogen gas vary in groups of ten ventilation ducts. It is noteworthy that Scheme 2 has an increased number of outlets, resulting in a slight decrease in the flow rate of the cooling hydrogen gas compared to Scheme 1. The lowest flow rate of the cooling hydrogen gas appears at outlet 11 in the second group of ventilation ducts, with a magnitude of 2.3 × 10⁻³ m3/s, a 20.7% decrease compared to the lowest flow rate in Scheme 1. The highest flow rate at outlet 50 in the fifth group of ventilation ducts is 6.5 × 10⁻³ m3/s, a 5.8% decrease compared to the highest flow rate in Scheme 1.
In Scheme 2, despite a slight decrease in the flow rate of the cooling hydrogen gas at each outlet, the increased number of cooling channels better dissipates the heat generated by the rotor field bars. The highest temperature of the cooling hydrogen gas at the outlet in Scheme 2 appears at outlet 12 in the second group, with a maximum temperature of 81.7 °C, a 3 °C decrease compared to Scheme 1. The lowest temperature of the cooling hydrogen gas at the outlet appears at outlet 50 in the fifth group, with a minimum temperature of 61.0 °C, a 3.9 °C decrease compared to Scheme 1.

4. Temperature Distribution Analysis of the Rotor

4.1. Temperature Distribution of Various Rotor Components

Figure 7 presents the maximum, average, and minimum temperatures of various rotor components for two different cooling schemes. The slot wedges located at the bottom of the slots are cooled by both the sub-slot and the radial ventilation ducts, effectively reducing the temperature rise of the slot wedges. Therefore, in both schemes, the temperature of the slot wedges is the lowest, with Scheme 2 showing an average temperature of 61.3 °C for the slot wedges, a decrease of 2.8 °C compared to Scheme 1. Since the insulation material is in close contact with the field bars and has a low thermal conductivity, the insulation inside the rotor presents an approximate temperature rise in the field bars. In Scheme 2, the average temperature of the insulation is 85.6 °C, a decrease of 2.6 °C compared to Scheme 1. As the field bars serve as the sole heat source in the rotor, the highest temperature rise of the rotor occurs within the field bars, with maximum temperatures of 106.1 °C and 104.5 °C for Scheme 1 and Scheme 2, respectively, indicating a decrease of 1.6 °C in Scheme 2. The rotor core is affected by the heat conducted from the field bars and suffers from severe heat dissipation conditions, which results in the average temperatures of the rotor core in Scheme 1 and Scheme 2 being 85.2 °C and 83.4 °C, respectively.

4.2. Temperature Distribution of Rotor Field Bars

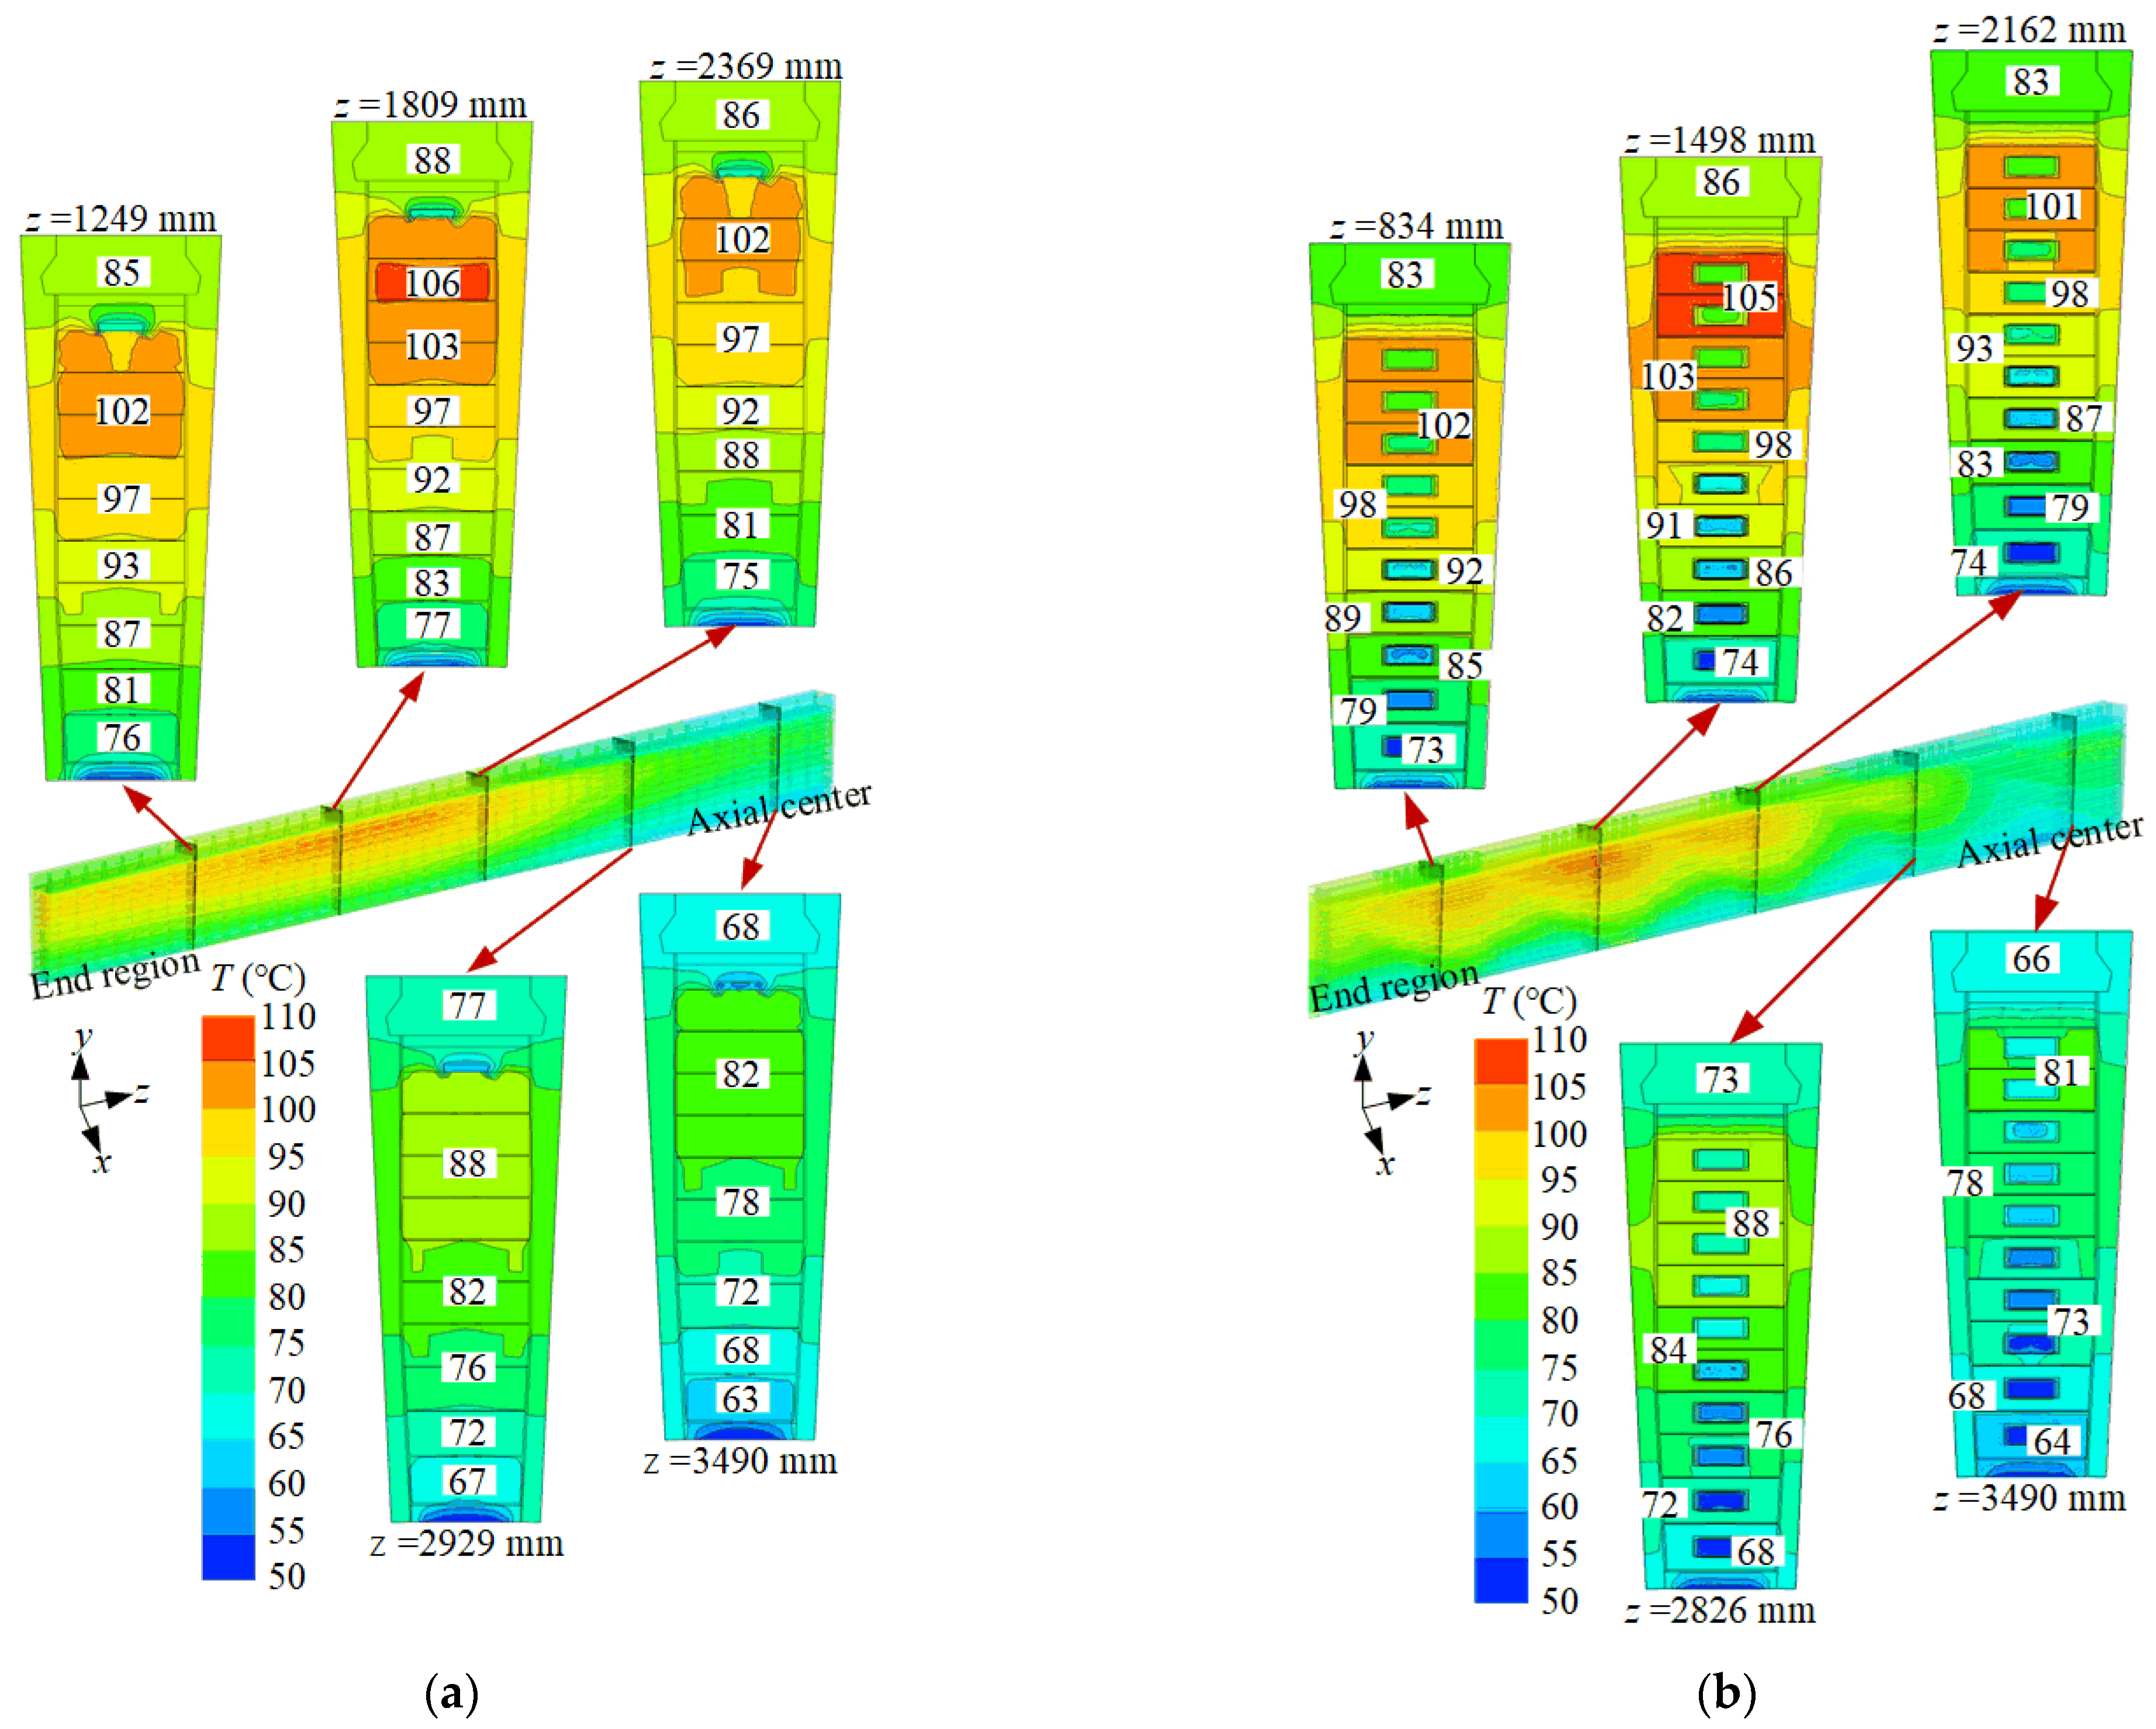
The temperature variations of rotor field bars along the radial and axial directions are comparatively studied in detail. Figure 8 illustrates the radial cross-section temperature distributions of the rotor field bars for both schemes.
In Scheme 1, five radial cross-sections are evenly selected along the axial direction from the rotor end region to the center, positioned at distances of 1249 mm, 1809 mm, 2369 mm, 2929 mm, and 3489 mm. The temperatures of bottom field bars are lower than those of top bars, with the temperature of bottom bar 1 at the rotor slot bottom being the lowest, below 80.0 °C, while the temperatures of bars 7~10 are all above 100.0 °C. This is attributed to the lower temperature of the cooling hydrogen gas in the radial ventilation at the slot bottom, resulting in stronger heat dissipation. As the cooling hydrogen gas flows radially, its temperature increases, leading to reduced heat dissipation. Among the five axial cross-sections, the temperature of field bars at z = 1809 mm is significantly higher than at other sections, with the largest temperature difference between the bottom and top bars, reaching 28.8 °C. Conversely, at z = 3489 mm, the bar temperature is the lowest, with the smallest radial temperature difference of 19.1 °C.
In Scheme 2, the radial cross-sections are located at axial positions of 834 mm, 1498 mm, 2162 mm, 2826 mm, and 3490 mm. The temperature distribution pattern of the rotor field bars along the radial direction in Scheme 2 is similar to Scheme 1, with temperatures increasing from bottom bar 1 to top bar 10. Among the five axial cross-sections, the bar temperature at z = 1498 mm is the highest, with the largest radial temperature difference of 31 °C, while the bar temperature at z = 3490 mm is the lowest, with the smallest radial temperature difference of 17.3 °C.
It is worth noting that in both schemes, due to the proximity of field bar 10 to the rotor slot wedge, it receives effective cooling from the hydrogen in the air gap, resulting in a lower temperature compared to field bar 9, making field bar 9 the hottest part of the rotor.
Figure 9 provides the axial variation of field bar temperatures for both schemes. In Scheme 1, the bar temperatures along the axial direction show a pattern of initially increasing and then decreasing from the rotor end region to the center, with the high-temperature region concentrated approximately 1000~2000 mm along the axial direction. The average temperature of bar 1 has the lowest temperature of 72.8 °C. Additionally, the axial temperature variation of field bar 1 is relatively small, and the maximum axial temperature difference of 14.6 °C. In contrast, the average temperature of bar 9 is the highest at 97.5 °C. Bar 9 also has a larger axial temperature variation, and the maximum axial temperature difference is 23.8 °C. This phenomenon is due to the bottom bars being close to the sub-slot, with effective cooling conditions due to the lower temperature of the cooling hydrogen gas, resulting in small temperature variations along the axial direction. However, the top bars are only cooled by the hydrogen gas in the ventilation ducts inside the bars, and their temperature rise is significantly affected by the velocity, temperature rise, and flow rate of the cooling hydrogen gas in the ventilation duct.
In Scheme 2, the temperature variation pattern of the rotor field bars along the axial direction is consistent with Scheme 1. However, it is noteworthy that in Scheme 2, since the ventilation ducts are grouped into ten branches and divided into five groups, the temperature variation of the bars along the axial direction can be divided into five segments. In each segment, the temperature of the bars also shows a trend of initially increasing and then decreasing, with the high-temperature region of each bar appearing in the second segment (i.e., the region of the second group of ventilation ducts). In Scheme 2, similarly, the temperature of bar 1 is the lowest, with an average temperature of 69.1 °C, and the temperature of bar 9 is the highest, with an average temperature of 93.0 °C, representing a decrease of 4.5 °C compared to Scheme 1.
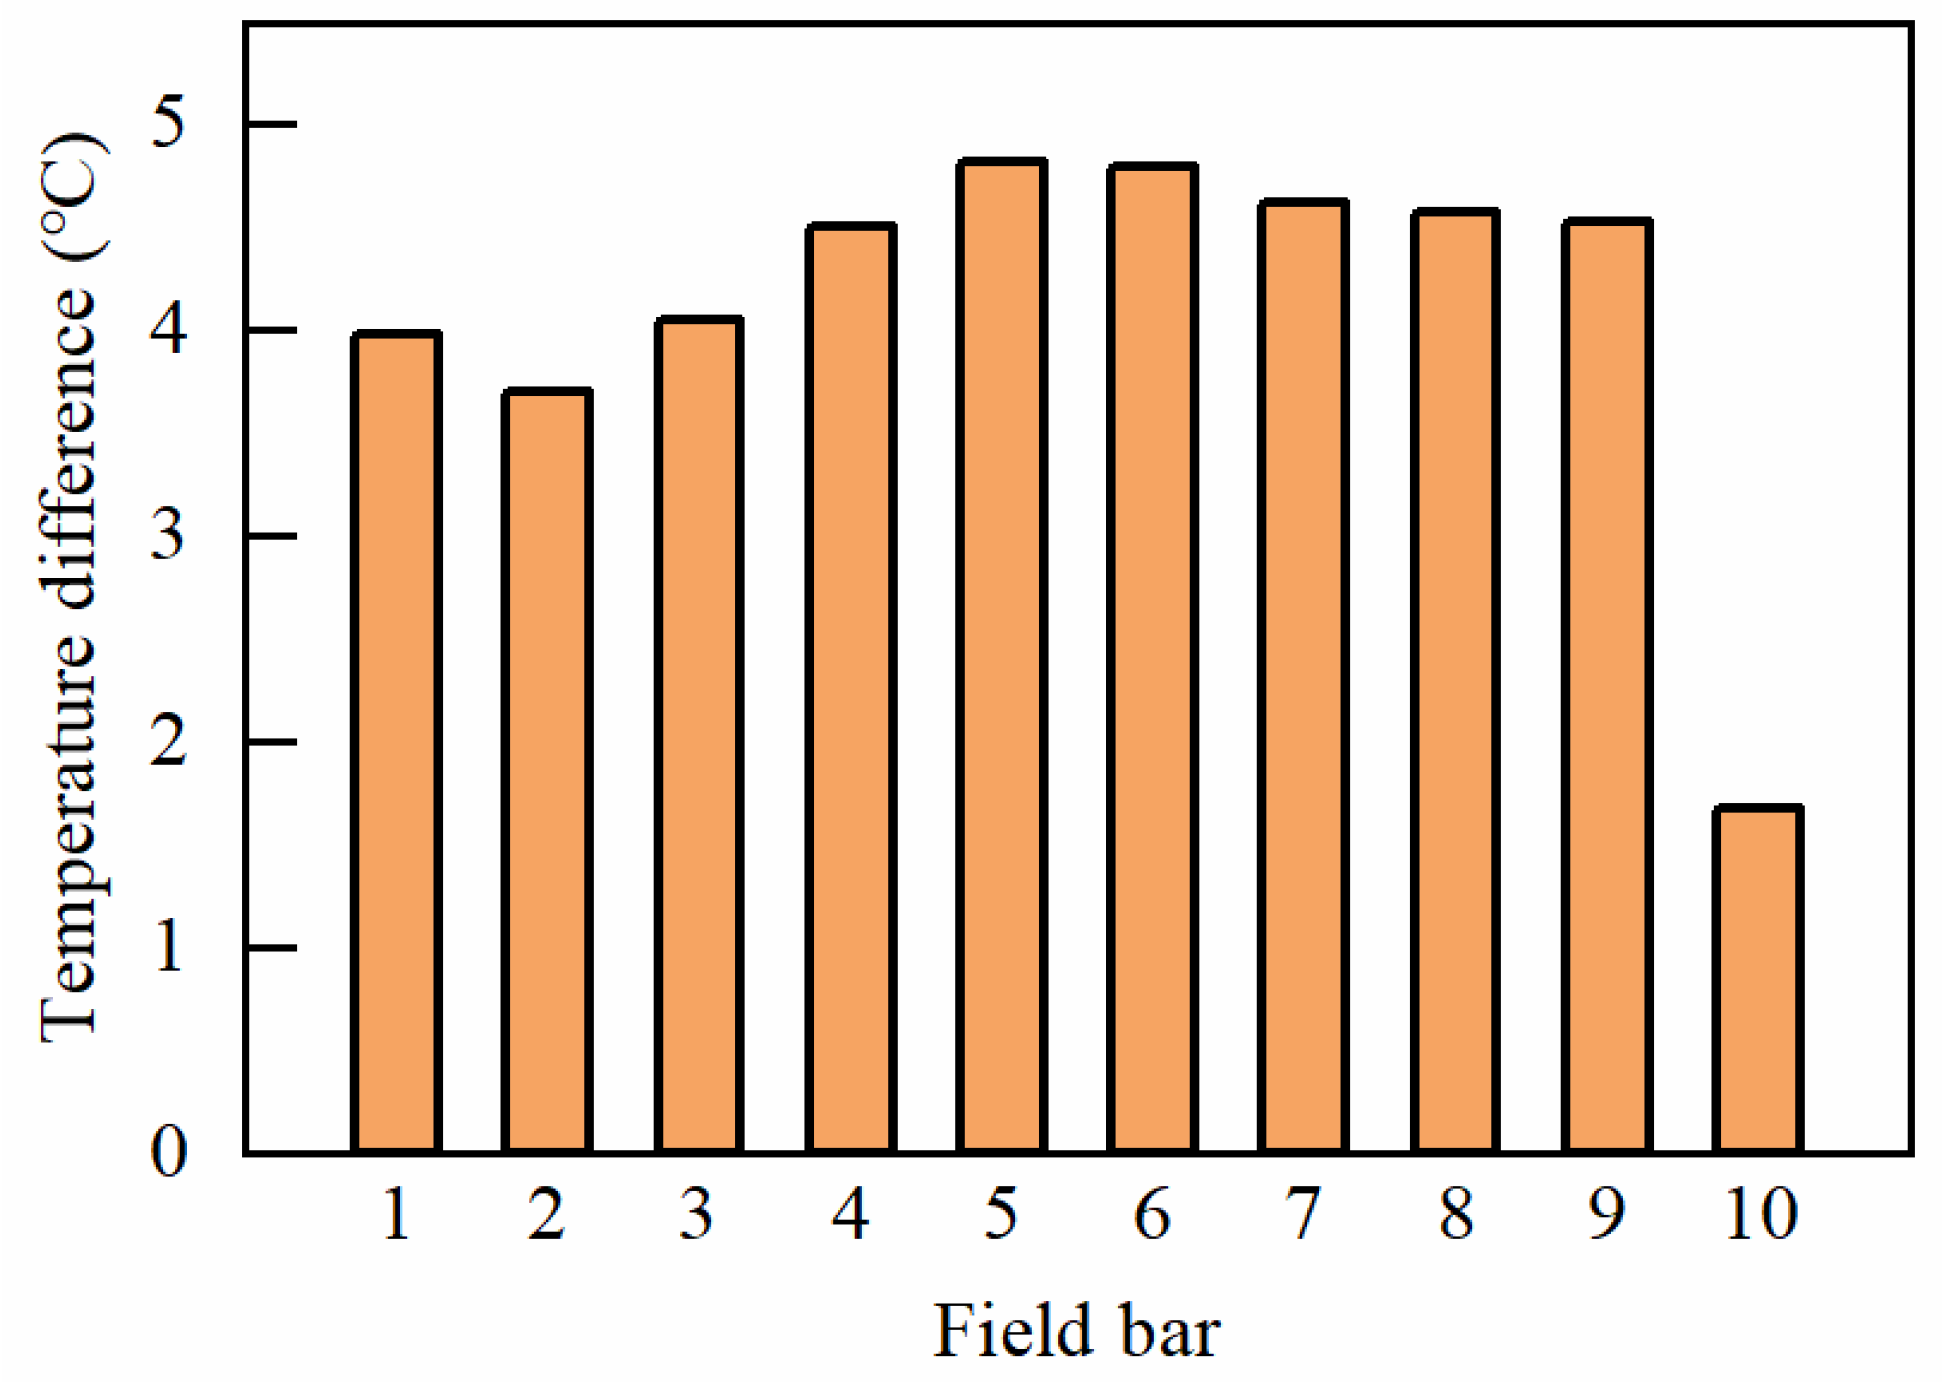
The average temperature differences of field bars 1~10 in the two schemes are shown in Figure 10. It shows that an approximate temperature decrease of greater than 4.5 °C can be obtained by employing the cooling Scheme 2. As bar 10 has a better cooling condition in both schemes, the temperature difference of bar 10 is smaller.

5. Conclusions

In this study, numerical simulation methods are employed to investigate the coupling fluid thermal field of the rotor of a nuclear turbine generator with two cooling schemes: a radial straight-type ventilation system and a composited radial–axial–radial ventilation system. A comparative analysis of the flow patterns of cooling hydrogen gas and the distribution of temperature rises in various parts of the rotor was conducted. The following conclusions were drawn:
(1)
In both cooling schemes, the flow rates of cooling hydrogen gas at outlets exhibit a trend of initially decreasing from the rotor end region towards the rotor center and then increasing. Although, in Scheme 2, the outlet flow rate of cooling hydrogen gas is slightly lower compared to Scheme 1, with its maximum flow rate reduced by 5.8% compared to Scheme 1. However, the increase in the number of cooling branches facilitates more efficient heat exchange between the cooling hydrogen gas and the rotor field bars. In comparison with Scheme 1, the maximum temperature rise of the field bars in Scheme 2 is reduced by 1.6 °C.
(2)
Within the rotor slots, both schemes result in the lowest temperature observed in the slot bottom wedges. In Scheme 2, the average temperature of the slot bottom wedges is 64.2 °C, which is 2.8 °C lower than that in Scheme 1. Additionally, the average temperature of the rotor insulation in Scheme 2 is 85.6 °C, representing a decrease of 2.6 °C compared to Scheme 1.
(3)
In both cooling schemes, the temperature variation along the radial direction of the field bars shows a consistent trend of increasing from bar 1 near the slot bottom towards bar 10 near the slot top. Field bar 10 can be effectively cooled by heat conduction through slot wedges and heat convection through the air gap, and hence the highest temperature is observed in bar 9.
(4)
Similarly, in both cooling schemes, the temperature variation along the axial direction of the field bars shows a trend of initially increasing from the rotor end region towards the rotor center and then decreasing. In Scheme 2, the high-temperature region of bar 9 is concentrated in the region of the second group of ventilation ducts, with an average temperature of 93.0 °C, representing a decrease of 4.5 °C compared to bar 9 in Scheme 1.

Author Contributions

Conceptualization, S.Z.; methodology, S.Z. and F.W.; validation, F.W., Y.Z. and W.G.; formal analysis, Y.Z. and W.G.; investigation, S.Z. and F.W.; writing—original draft preparation, Y.Z. and W.G.; writing—review and editing, S.Z. and C.X.; supervision, C.X.; funding acquisition, S.Z. and C.X. All authors have read and agreed to the published version of the manuscript.

Funding

This research was funded by the National Key Research and Development Program of China, grant number 2023YFB4301500.

Institutional Review Board Statement

Not applicable.

Informed Consent Statement

Not applicable.

Data Availability Statement

Data are contained within the article.

Conflicts of Interest

The authors declare no conflicts of interest.

References

  1. Poudel, B.; Joshi, K.; Gokaraju, R. A dynamic model of small modular reactor based nuclear plant for power system studies. IEEE Trans. Energy Convers. 2020, 35, 977–985. [Google Scholar] [CrossRef]
  2. Rehm, T.E. Advanced nuclear energy: The safest and most renewable clean energy. Curr. Opin. Chem. Eng. 2023, 39, 100878. [Google Scholar] [CrossRef]
  3. Zhao, Y.; Yan, B.; Zeng, C.; Huang, S.; Chen, C.; Deng, J. Optimal scheme for structural design of large turbogenerator stator end winding. IEEE Trans. Energy Convers. 2016, 31, 1423–1432. [Google Scholar] [CrossRef]
  4. Han, J.; Ge, B.; Tao, D.; Li, W. Calculation of temperature distribution in end region of large turbogenerator under different cooling mediums. IEEE Trans. Ind. Electron. 2018, 65, 1178–1186. [Google Scholar] [CrossRef]
  5. Zhou, G.; Han, L.; Fan, Z.; Zhang, H.; Dong, X.; Wang, J.; Sun, Z.; Zhang, B. Ventilation cooling design for a novel 350-MW air-cooled turbo generator. IEEE Access 2018, 6, 62184–62192. [Google Scholar] [CrossRef]
  6. Krok, R. Assessment of thermal condition of turbogenerator’s excitation winding with new hybrid cooling system. In Proceedings of the 2018 International Symposium on Electrical Machines (SME), Andrychow, Poland, 10–13 June 2018. [Google Scholar]
  7. Yoo, W.; Jeon, S.; Son, C.; Yang, J.; Ahn, D.; Kim, S.; Hwang, K.; Ha, S. Full surface heat transfer characteristics of rotor ventilation duct of a turbine generator. Appl. Therm. Eng. 2016, 94, 385–394. [Google Scholar] [CrossRef]
  8. Lu, Y.; Hong, G.; Tang, L.; Han, J. Calculation of 3D flow field of large air-cooled turbo-generators with multi-path ventilation. Proc. CSEE 2013, 33, 133–139. [Google Scholar]
  9. Zarghani, A.; Torkaman, H.; Arbab, N.; Toulabi, M.S. Mohammad. Lumped parameter thermal network for thermal analysis of a rotor-excited axial flux switching machine with electromagnetic-thermal design. Measurement 2022, 193, 110971. [Google Scholar] [CrossRef]
  10. Cavazzuti, M.; Gaspari, G.; Pasquale, S.; Stalio, E. Thermal management of a Formula E electric motor: Analysis and optimization. Appl. Therm. Eng. 2019, 157, 113733. [Google Scholar] [CrossRef]
  11. Li, D.; Li, W.; Li, J.; Liu, X. Analyzing regularity of interpolar air motion and heat dissipation coefficient distribution of a salient pole synchronous generator considering rotary airflow. Int. Commun. Heat Mass Transf. 2020, 119, 104828. [Google Scholar] [CrossRef]
  12. Wu, Y.; Guo, Y. Study on the suppression effect of variable hydrogen parameters on the temperature rise of the turbo-generator rotor under deep peak regulation. IET Electr. Power Appl. 2023, 17, 1524–1534. [Google Scholar] [CrossRef]
  13. Lu, Y.; Chen, P.; Li, J.; Zhang, X.; Deng, H.; Han, J. Flow field analysis of new type ventilation method in one air-cooled turbo-generator rotor. Proc. CSEE 2010, 30, 63–68. [Google Scholar]
  14. Korovkin, N.V.; Verkhovtsev, D.; Gulay, S. Rotor air-cooling efficiency of powerful turbogenerator. IEEE Trans. Energy Convers. 2021, 36, 1983–1990. [Google Scholar] [CrossRef]
  15. Franc, J.; Pechanek, R.; Kindl, V.; Zavrel, M. Ventilation system with skewed rotor cooling ducts of 40-MW synchronous machine: A case study. Electr. Eng. 2019, 101, 203–211. [Google Scholar] [CrossRef]
  16. Su, Y.; Li, W.; Li, D.; Li, D.; Liu, Y.; Liu, W. Influence of incident angle of hydrogen in the ventilation ducts on multi-physical fields of 1100 MW turbine-generator rotor. Int. J. Heat Mass Transf. 2019, 140, 852–861. [Google Scholar] [CrossRef]
  17. Li, W.; Su, Y.; Li, D.; Li, Y.; Hu, L.; Wang, P. Multi-physical fields of rotor windings with axial-radial ventilation system for 1100 MW nuclear half-speed turbine generator. Energy 2019, 188, 116092. [Google Scholar] [CrossRef]
  18. Liu, L.; Ding, S.; Li, Z.; Shen, S.; Chen, S.; Dou, Y. Effect of gas compressibility on fluid field of air-cooled turbo-generator. IET Electr. Power Appl. 2022, 16, 701–709. [Google Scholar] [CrossRef]
  19. Xu, Y.; Xu, Z.; Zhao, Q.; Wang, Y. Global domain fluid-thermal coupling modeling method and characteristics analysis for large capacity motor. Case Stud. Therm. Eng. 2023, 44, 102860. [Google Scholar] [CrossRef]
  20. Yang, G.; Liu, Y.; Sun, Q.; Qiao, J.; Wang, T. Numerical simulation on the flow and temperature field in the high-power motor. IEEE Access 2023, 11, 82830–82837. [Google Scholar] [CrossRef]
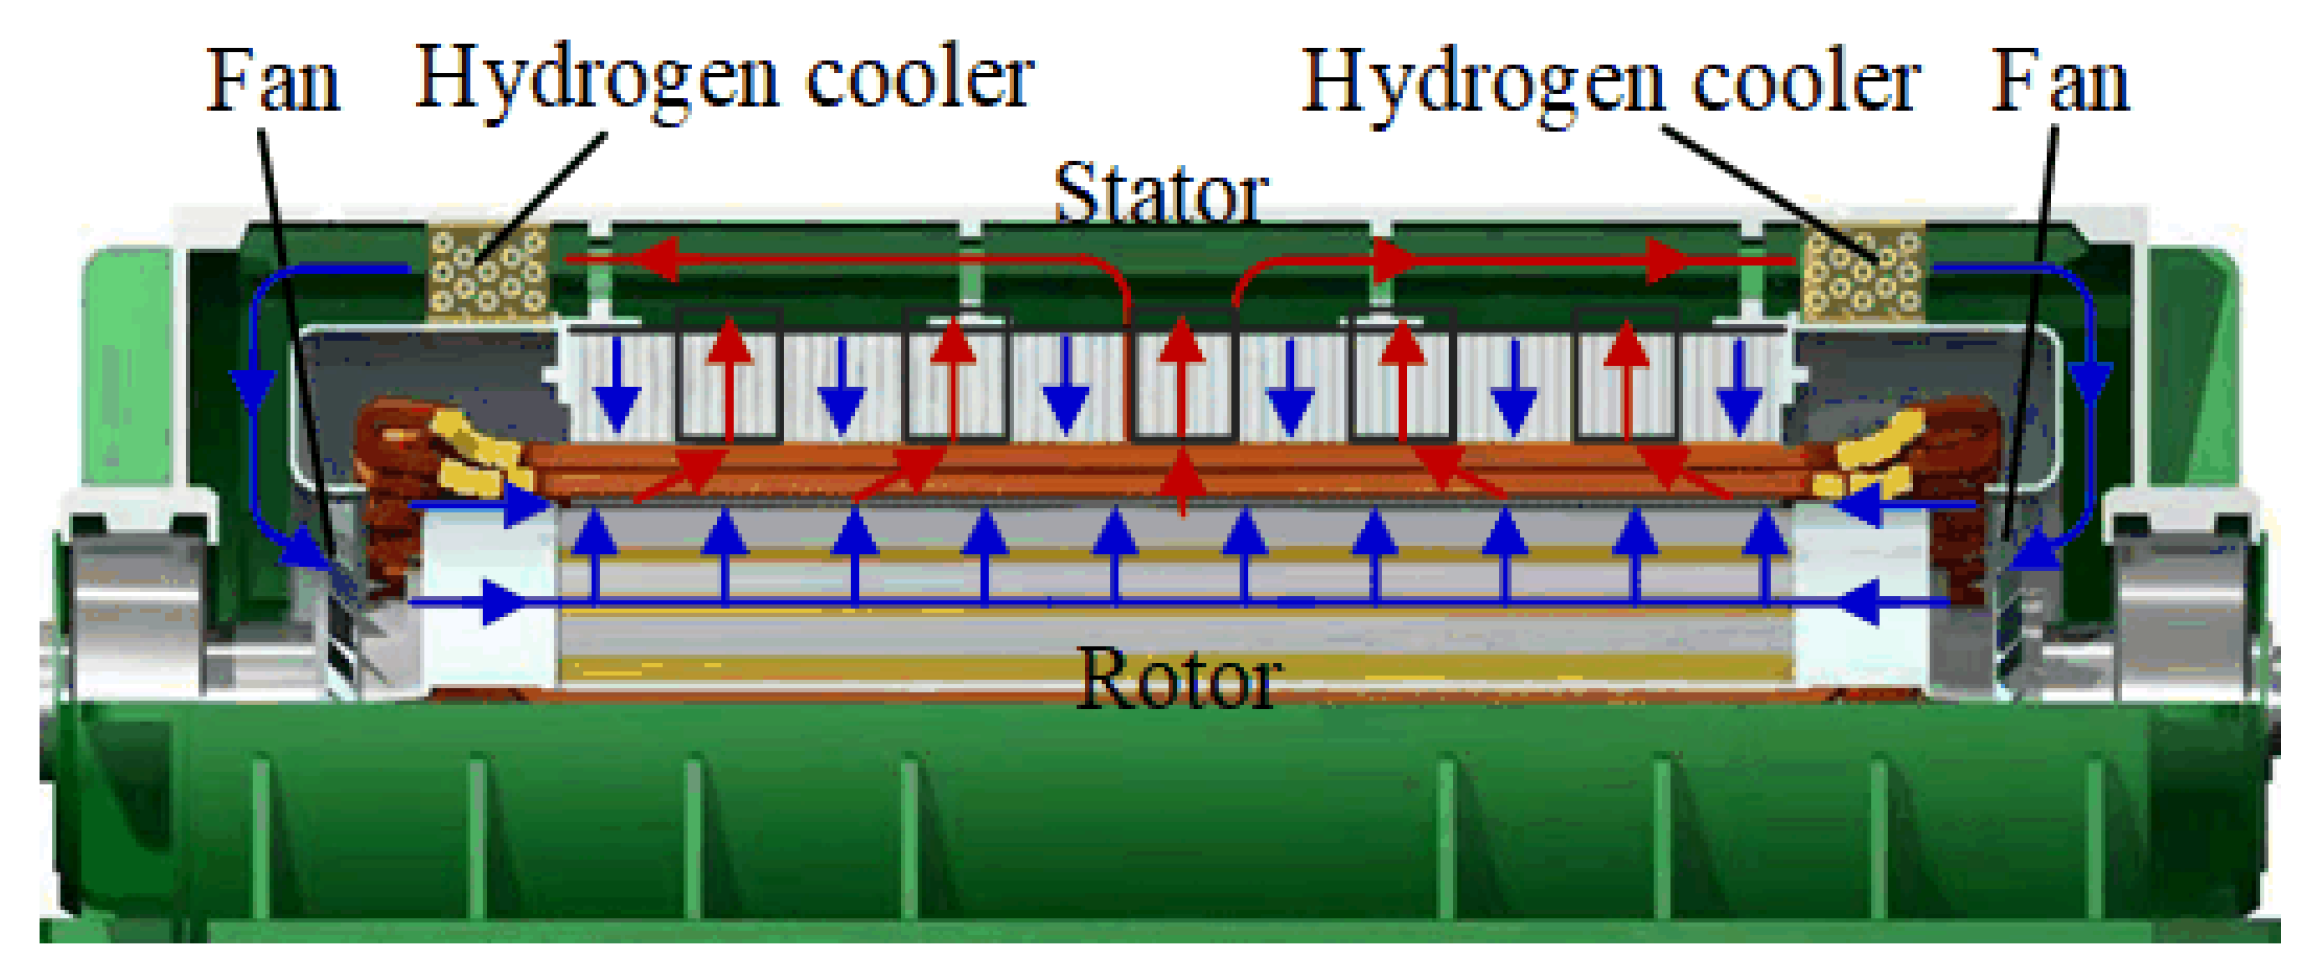
Figure 1. Schematic diagram of the turbine generator rotor cooling system.
Machines 12 00326 g001
Figure 2. Ventilation structure of the rotor. (a) Radial straight-type ventilation structure (Scheme 1); (b) composited radial–axial–radial ventilation structure (Scheme 2).
Machines 12 00326 g002
Figure 3. Coupled fluid temperature field model of the rotor. (a) Scheme 1; (b) Scheme 2.
Machines 12 00326 g003
Figure 4. Fluid field distribution of cooling hydrogen gas. (a) Scheme 1; (b) Scheme 2.
Machines 12 00326 g004
Figure 5. Temperature distribution of cooling hydrogen gas. (a) Scheme 1; (b) Scheme 2.
Machines 12 00326 g005
Figure 6. Temperature and flow rate of cooling hydrogen gas at the outlet. (a) Scheme 1; (b) Scheme 2.
Machines 12 00326 g006
Figure 7. Temperature of various rotor components. (a) Scheme 1; (b) Scheme 2.
Machines 12 00326 g007
Figure 8. The temperature of field bars along the radial direction. (a) Scheme 1; (b) Scheme 2.
Machines 12 00326 g008
Figure 9. The temperature of field bars along the axial direction. (a) Scheme 1; (b) Scheme 2.
Machines 12 00326 g009
Figure 10. Temperature differences of field bars along the axial direction.
Machines 12 00326 g010
Table 1. Basic parameters of the 1555 MVA nuclear turbine generator.
Generator ParametersValue
Power (MVA)1555
Voltage (kV)27
Field current (A)7800
Frequency (Hz)50
Pole pair2
Power factor0.9
Rotation speed (r/min)1500
Stator outer diameter (mm)3770
Rotor outer diameter (mm)2040
Rotor length (mm)7400
Table 2. Material attributes of different components.
MaterialDensity (kg/m3)Specific Heat (J/(kg·K))Thermal Conductivity (w/(m K))
Field bar8978381398
Rotor core760050446/46/3.6
Insulation70017600.22
Table 3. Meshing results of the solving domain.
ElementsNodes
Scheme 1 3,281,2843,522,046
Scheme 2 4,999,2625,801,715
Disclaimer/Publisher’s Note: The statements, opinions and data contained in all publications are solely those of the individual author(s) and contributor(s) and not of MDPI and/or the editor(s). MDPI and/or the editor(s) disclaim responsibility for any injury to people or property resulting from any ideas, methods, instructions or products referred to in the content.