Abstract
This paper presents a planar cable-driven model of a simple mechanism that is able to measure forces and displacements. Recently, a preliminary study based on a cable-driven sensitive mechanism was presented to the research community, underlining the innovative characteristics of the model in under-actuation and under-sensing. The core of the research work was to conceive a compliant system able to measure forces and displacements from a point located in a different zone with respect to the one where the force is applied, and this is possible thanks to cable-driven systems. In this paper, a new simplified model with respect to our published work is presented, reducing the number of cables and including the calculation of friction in the developed test bench. The formulation to calculate the displacement of the point of the applied force and the formulation to calculate the force are presented and validated with a simulation and by using a real test bench for experimentation. A multi-body system is used for the simulation, and the results are compared and discussed. Four cases are analysed to test the formulation, including the friction in pulleys and in the joint connection between the mobile part and the fixed part of the mechanism. Future works will be oriented toward reducing the dimensions of the conceived mechanism in order to implement the model in minimally invasive robotic surgery instruments.
1. Introduction
Micro-electro-mechanical systems (MEMSs) can be defined as devices and systems produced by micro-machining other than integrated circuits or other conventional semiconductor devices [1]. MEMS technology can be used for sensing elements and be included in electronic components, such as in the work where a biomimetic MEMS-based tactile sensor array with fingerprints is integrated into a robotic fingertip for artificial roughness encoding [2]. However, if electronic components cannot be used in contact with extreme or dangerous environmental conditions (i.e., high humidity, high/low temperature, radiation, fluid interaction), MEMSs cannot be implemented directly.
Many solutions can be used to create isolation to the environment: by using impermeable covers to protect electronic components, such as in a robotic fingertip by using silicones [2], or in underwater artificial skin by using oils and membranes [3]. Many MEMSs are available on the market and in the literature, but no tactile or force–torque sensors or transducers are included in clinical surgical operations. Recently, some researchers developed a MEMS-based piezoresistive sensor chip with an encapsulation cap with a top elastic layer [4]. In this work, experimental demonstration involved palpation but also the integration of a sensing module onto the forceps [4]; however, experiments were only performed in the laboratory and not in a clinical environment in which sterilisation processes must be performed, which could be dangerous for electronic components. Moreover, a cover to protect electronic components is not simple to create or implement for all environments, such as in the case of surgical robotics [5].
The reliability of MEMSs depends on many factors, and potential failure mechanisms must be determined, such as mechanical fracture (i.e., overload, shock, corrosion), stiction, charge accumulation, wear, etc. [6]. One inconvenience of MEMS technology used for actuators is the transmission of small forces and small strokes, such as in electrostatic actuators, which are suitable to create micropumps with fast response times and good reliability [7]. However, the technology of hydraulically electrostatic actuators is suitable for wearable haptics to reproduce the sense of touch [8].
In conclusion, MEMSs are used for micro-systems where small forces can be developed using the technology base in major cases on flexure hinges [9,10], but miniaturised systems able to transmit and measure high forces and protected by the external environmental conditions are limited by the available technology. The forces transmitted from MEMSs are small, and an alternative to encapsulating MEMSs could be to locate MEMSs in a protected environment and study mechanisms able to transfer and measure interaction forces from the protected zone to the danger zone by using under-actuation and under-sensing systems. In [11], it is underlined how it is convenient to have under-actuation and under-sensing in the same artificial system.
Cable-driven systems (and fluid-driven systems [12]) are the best solutions for these scopes. However, new theoretical models must be developed to associate the actuation part with the sensitive part. Cable-driven and tendon-driven systems are used in many different contests and domains for under-actuation (i.e., surgical robotics [13], flight simulation of aeroplanes [14], soft robotics [15], supports for rehabilitation [16,17], building constructions [18], etc.), but their use on a miniaturised scale and in under-sensitive systems is very limited [5,19]. Recently, redundant cable-driven parallel robots (CDPRs) have been used not only for actuation but also for force distribution sensitivity [5,19,20,21,22,23,24,25], applied in many domains such as rehabilitation [26], and defining cable tension sensitivity analysis for macroscopic applications, such as maintaining a camera in suspension for a football match [27]. Cable-driven systems are also used to achieve maximum workspace and isotropic force exertion, such as shown in [28]. The preliminary study performed in [29] underlines that the indirect force estimation method is a viable method of measuring the forces of cables driven in minimally invasive robotic systems.
Today, cable-driven systems and MEMS technology are mainly used like two different architectures: one is mainly used for actuation (cable-driven system) and the other one is mainly used for sensing (MEMSs). The assembly of these two architectures in one general system for under-sensing and under-actuation is difficult to obtain for many reasons; one of these reasons is related to the different dimensions between the miniaturized cable-driven systems and the microspopic MEMSs. Our work will help to define the next step forward in this conceptual assembly that requests a more feasible and advanced technology. In the meanwhile, in our work the cable-driven system is studied in order to include under-sensing and under-actuation capabilities in the same cable-driven architecture.
In this paper, we present a planar cable-driven sensitive mechanism for force transduction. The system can be reconfigurable by modifying the position of the cables. The first cable-driven sensitive mechanism was presented in [19], and the proposed mechanism in this paper is simpler (with respect to the first one presented in [19]) because a new constraint, conceived with a revolute joint, is included in the mechanism in order to reduce degrees of freedom and to help in defining the mechanical behaviour of the whole system.
The work presented in [19] is based on a model of a cable-driven sensitive mechanism with eight cables and the appropriate combination of the tension of the cables that allows the determination of the external forces on the mechanism. The model presented in this paper uses the same approach, but the cables are reduced from eight in the space (four in the plane) to two in the plane in order to analyse the behaviour of a simpler system, which is more useful to adapt and control in complex environments.
The paper is structured as follows: Section 2 presents the formulations used for the definition of the model; Section 3 shows the multibody model conceived to validate the formulation; Section 4 presents the physical implementation in the developed test bench; Section 5 shows results and discussion. The paper ends with conclusions.
2. Analytical and Physical Modelling
2.1. Force Transduction and Displacement Determination
A planar scheme to conceive the model proposed in this paper is shown in Figure 1. The mobile part (A) is free to rotate around point O, with respect to the frame (thanks to a planar revolute joint). The equilibrium in the starting position (Figure 1 on the left) is possible thanks to the balancing of tensions on cables ( and ) connected to the frame with two springs ( and ) and to the mobile part at two points. Four pulleys (, , , and ) are used to modify the direction of cables.
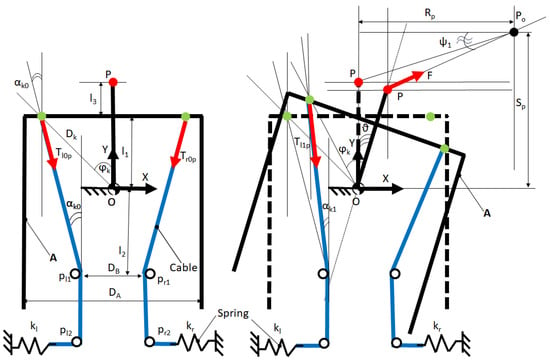
Figure 1.
Planar scheme used to conceive the model. Starting position (on the left) and mechanism in motion with external applied load F (on the right).
If an external load (F) is applied to point P of part A, the equilibrium is perturbed, and a new balancing configuration could be created, balancing the torque produced by F with the torque produced by springs and transferred by cables. In Figure 1, on the right, only one tension of cables () is shown because only pull (and not push) is admitted in the mechanical behaviour of cables, and . In order to standardise the model, we imagine that the direction of the load F is always oriented from P to . The torque , produced by the load F (applied to point P and shown in Figure 1), is obtained by the following formulation:
If the system must be in equilibrium, the torque calculated with respect to point O must be :
is the resistance torque, caused by frictions and other non-ideal conditions. In the ideal system, . is obtained by the difference in the tension of cables in the two balancing configurations. Substituting Equation (1) into Equation (2), the following Equation (3) is obtained:
The load F applied to point P can be calculated with the following Equation (4). The geometrical parameters shown in Figure 1 and in the presented equations (, , , , , , , , , ) are known from the starting position. is the tension of the active cable during the next balancing configuration, and it will be calculated with the assumption that the cable is inextensible. , , and will be determined in the following by using the geometrical configuration shown in Figure 1.
In order to determine , some steps must be performed. Figure 2 (left) will help to find by using the theorem of cosines.
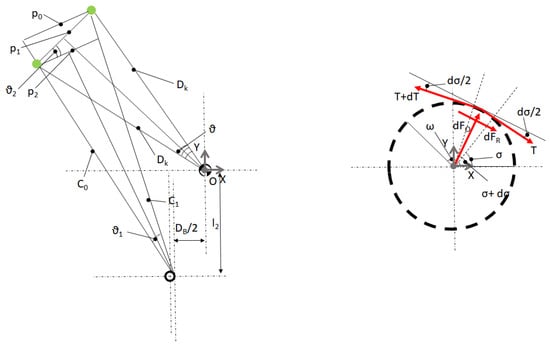
Figure 2.
(Left): scheme used for the implementation of the theorem of cosines. (Right): scheme of the pulley (dashed line) for the calculation of forces on a sliding cable ( is the friction coefficient between cable and pulley). Each cable is considered inextensible because the motion of the mobile part is possible thanks to the displacement of springs.
The following Equations (8)–(12) can be written
however, is also the diagonal of an isosceles trapezoid:
where and are lengths of cable in two different configurations, respectively, in the starting position (configuration ) and in the new balancing configuration (configuration ). and are functions of , and they will be determined in the following equations. is also shown in Figure 1.
assembling (8) with (9), can be found as a function of :
Substituting (9) and (10) in (11), the following Equation (18) is obtained
substituting (17) in (18), Equation (19) is obtained as a function of
By Equation (15), the correlation between the length of the cable () and the angle of revolution of the mobile part can be found.
In order to simplify the equations, the following change in variables can be used:
2.2. Cable Tension, Friction, and Physical Interaction with Pulleys
In our study, we assumed that the cables were non-extensible. Figure 1 shows a planar sketch of cables and pulleys with physical interactions. Each cable is connected to a spring with a stiffness coefficient ( or ). The variation in the left cable’s length (or right ) is a function of the displacement (or ) of the left spring (or right spring ).
and are obtained from the difference between the measured length of the left spring in the starting position (0) (or in the new configuration (1)), and its initial length (equal for both). The same type of equations are obtained for and , where the cable is connected with the spring of a coefficient stiffness . The ideal cable tension near the spring in the two configurations ( and ) is obtained by the following equations:
The same approach is used to calculate the cable tensions near the spring in the two configurations ( and ).
Figure 2 (right) shows the tensions of cables connected to the spring generating a force , while the cables’ tension near the mobile part is named . Each cable is considered inextensible, and the motion of the mobile part is possible thanks to the displacement of the springs: and .
Two different cases can be underlined:
- Case 1: No friction is included between the pulley and the shaft of the pulley, but the cable crawls on the pulley’s surface with a friction coefficient (see Figure 2, right);
- Case 2: No sliding between the pulley and the cable is included, but a friction coefficient between the shaft and the pulley is used (see Figure 3).
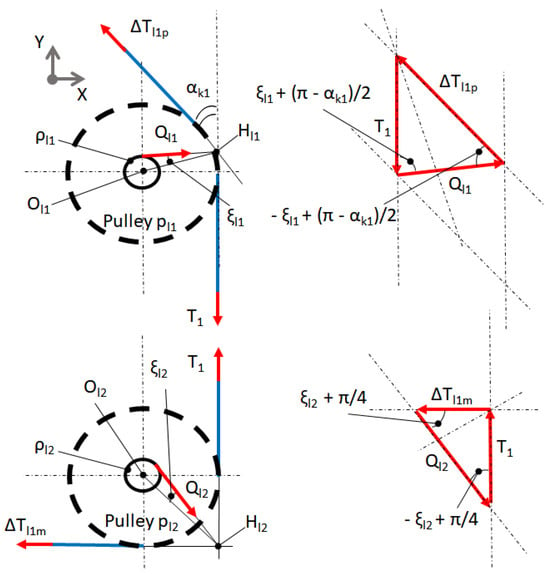 Figure 3. Free body diagram of cables and pulleys. The motion of the cable on pulleys is without sliding and the friction is included between the pulley and the shaft of the pulley ( is the radius of the circle of friction). Each cable is considered inextensible, because the motion of the mobile part is possible thanks to the displacement of springs.
If the cable crawls on pulleys, as shown in the case 1, in order to calculate the cable’s tension on the mobile part, the scheme in Figure 2 (right) can be considered. In this case, is the friction coefficient between the cable and the pulley [19]:
with ; ; ; ; ; ; . The following equation can be obtained:
Equation (33) can be used to calculate and to include it in Equation (4) if case 1 shown above is presented.
If only friction is present between the pulley and its shaft, as shown in the case 2, in order to calculate the cables’ tension on the mobile part, the scheme of Figure 3 can be used. and are the radii of the circle of friction of the shafts of the two pulleys and .
where and are the radii of the shaft and and are the radii of the two pulleys ( and ). Gravity is not considered in these calculations because we are in a plane parallel to the ground. is the radius of the circle of friction. From the analysis of Figure 3, the following equations can be written
merging Equations (34)–(36), the following Equations (37) and (38) are obtained:
2.3. Case 3: Friction in Revolute Joint and Plane
In order to be coherent with the real application, the friction in the revolute joint and in contact with the plane must be considered. The following calculations allow us to calculate the resultant resistant torque () that creates an obstacle to the motion of the mobile part. is obtained by the contribution of friction in the revolute joint () and by the contact of the mobile part with the plane (), as shown in (42). In order to calculate the contribution of friction in the revolute joint, the reaction forces in O must be determined. From Figure 1, the X () and Y () components of the reaction force () can be found imposing balance.
where is the radius of the shaft of the revolute joint; is the friction coefficient in the shaft; is the friction coefficient between the plane and the mobile part; m is the total mass of the mobile part; g is the gravity; L is the distance between the point of contact of the plane with the mobile part and point O in the plane.
3. Multibody System Dynamic Simulation
3.1. Multibody Model
In order to implement the formulation presented in Section 2 and to simulate the mechanical behaviour of the whole system, a multibody system dynamic simulation was performed using MATLAB®, Simulink®, and Simscape™ Multibody™.
Figure 4 shows the designed multibody planar mechanism, which reproduces the scheme shown in Figure 1. The load applied to point P by using a cable is measured by the motion of the two little squares in the lower part. A spring is mounted in each of the two little red squares (in the lower part of the Figure 4) with a constant stiffness value of N/mm. The tension of the cable is calculated by the product of the displacement of the spring and its stiffness value. The dimensions included in Figure 1 are as follows: mm; mm; mm; mm; mm; mm; mm.
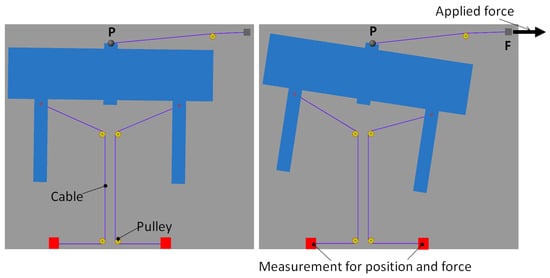
Figure 4.
Multibody system dynamic simulation of the planar mechanism with the external applied force F.
3.2. Results of Simulation
Figure 5 and Figure 6 show the first results of the simulation, obtained by applying five different external forces of 2 N, 4 N, 6 N, 8 N, and 10 N on point P. In the two figures (Figure 5 and Figure 6), the friction coefficient on pulleys is set to zero (, ). The measured and calculated forces are shown in Figure 5, and the measured and calculated displacements of point P are shown in Figure 6. The force calculated with Equation (4) is shown with continuous lines for all applied forces in Figure 5. At the end of the simulation time, it seems that the gap error between the measured and calculated force is less than for a lower value of the applied load (e.g., 2 N), and it increases to a maximum of for a high value of the applied load (e.g., 10 N). The analysis of Figure 5 allows us to underline the proportionality between the velocity needed to arrive at the maximum value of the calculated force and the value of the load. For a higher value of the load (e.g., 10 N), the simulation time required to obtain the calculated value is less than the simulation time required to calculate a lower value of the applied force (e.g., 2 N). For the same simulation time, it can be seen that the displacement calculated with Equation (26) gives excellent results in the simulation, as can be seen in Figure 6. In conclusion, the proposed formulations in the last section seem to be a good solution to give a prevision on the forces and displacements at point P if an external load is applied.
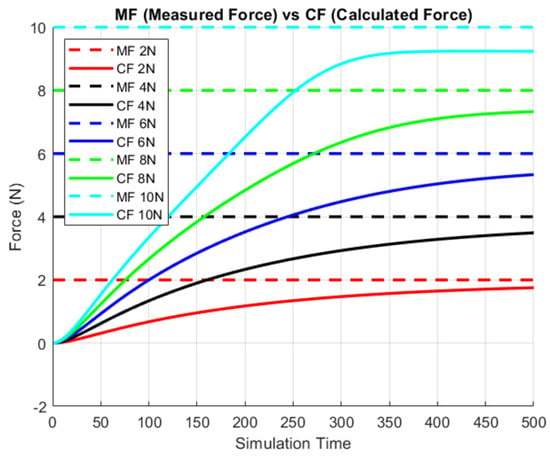
Figure 5.
Comparison of multibody simulation between measured force (MF, dashed line) and calculated force (CF, continuous line) on the force application point. The application of five loads (2 N, 4 N, 6 N, 8 N, 10 N) was simulated. The friction coefficient on pulleys is set to 0 (, ).
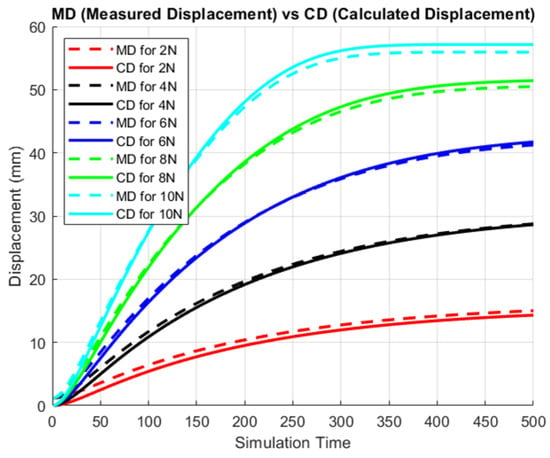
Figure 6.
Comparison of multibody simulation between measured displacement (MD, dashed line) and calculated displacement (CD, continuous line) of the force application point. The application of five loads (2 N, 4 N, 6 N, 8 N, 10 N) was simulated. The friction coefficient on pulleys is set to 0 (, ).
4. Physical Implementation
4.1. Scheme of the Planar Test Bench
Figure 7 shows a scheme of the planar test bench prototype used to test the force-sensitive cable-driven mechanism. It is constituted of two parts: a fixed part and a mobile part. The fixed part is connected to a fixed plane; the mobile part can be moved on the fixed plane (by using two spherical joints positioned between the mobile part and the fixed plane), and it can rotate around a revolute joint. Figure 7 shows the revolution of the mobile part as a dashed line. Two cables connect two links of the mobile part with the fixed part. At the end of each cable, a spring is attached. In order to change the direction of the cables, two pulleys (attached to the fixed part) are used for each cable. An external load is applied to point P by using weights connected by a cable and a pulley. The equilibrium between the force of the applied load on point P and the force on springs allows us to determine the characteristics of the sensitive cable-driven mechanism for force transduction.
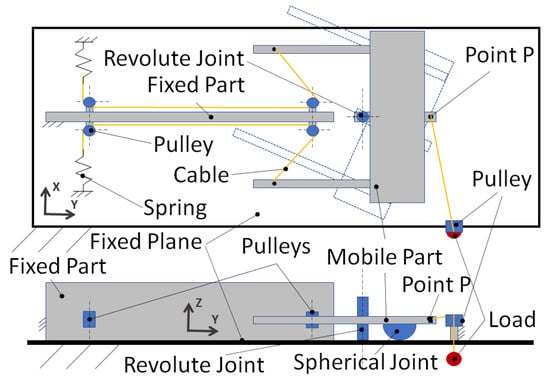
Figure 7.
Scheme of the planar test bench prototype used for the analysis of the cable-mechanism force transducer. The mobile part can be moved on the fixed plane by using two spherical joints (in contact with the fixed plane and the mobile part) and rotate around a revolute joint, as shown by the dashed line.
4.2. Test Bench Prototype
Figure 8 shows the realised test bench prototype. In the top part of the figure, the starting position is shown with all the details. The figure shows the motion with the externally applied load and the direction of the cables’ tension. The general process used in each experiment is as follows:
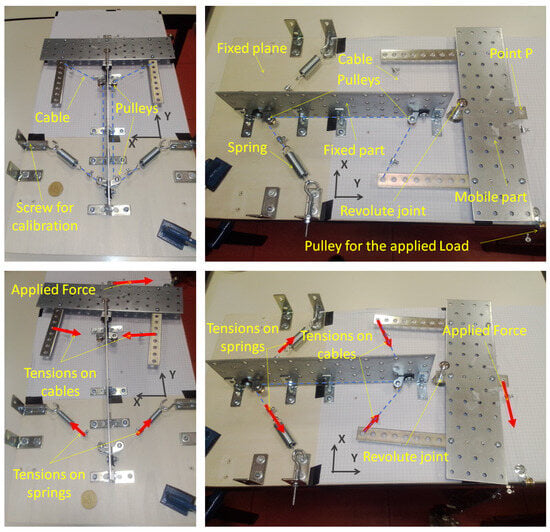
Figure 8.
Planar test bench prototype used for the analysis of the cable force transducer: starting position (top); motion of the mobile part with the applied force (down).
- 1.
- Connection of cables with the mobile part;
- 2.
- Connection of cables with the springs, passing around pulleys;
- 3.
- Calibration of the mechanism in the initial position using screws;
- 4.
- Measurement of the length of springs;
- 5.
- Application of loads connected (by a cable) to point P;
- 6.
- Measurement of the new length of springs;
- 7.
- Measurement of the displacement of point P.
At the base of the first measurement of the length of the spring, as shown in point 4, the force of the load on the spring can be calculated as the product of the stiffness constant and the displacement between the initial length of the spring and the new length. This force represents the tension of the cable in the initial configuration . The difference between the measurements of the length of the spring in points 4 and 6 gives the displacement of the spring between the two configurations and (the same approach has been used in [19]). Thanks to this displacement, it is possible to calculate the of the force between the two configurations and .
In the experiments, the following ten loads were applied to point P: N, N, N, N, N, N, N, N, N, and N, and the weight of the mobile part is set to kg.
5. Results and Discussion
Figure 9 (on the left) shows twelve anchor points for cables on the mobile part, with a symmetric position with respect to its axis of symmetry (six anchor points are shown on the left and six anchor points are shown on the right, named, respectively, , , , , , and , for left and right). The connection of the mobile part (in the starting position) with two springs is also symmetric with respect to the fixed part, as shown in Figure 7.
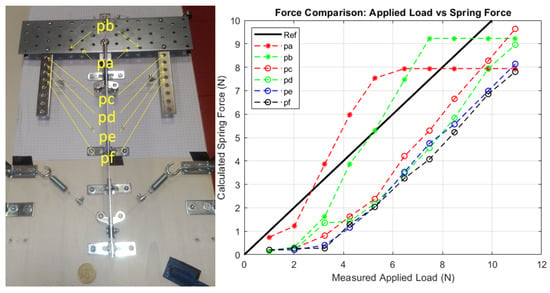
Figure 9.
Influence of the anchor points of the cable on the force transduction. (Left): sensitive mechanism and six symmetric anchor points (, , , , , ); (right): comparison graph between the applied load and the calculated force on springs. The black continuous line (Ref) is the reference for a hypothetical condition in which the load can be associated with the calculated force on springs.
Figure 9 (on the right) shows the influence of the variation in the cables’ anchor points on the cables’ force. If the two cables (left and right) are connected to the springs by using the holes (Figure 9 on the left), the relative black dashed line in the graph of Figure 9 (on the right) will have a lower inclination with respect to the red dashed line obtained if the cables’ anchor points are used. This result is obtained because the mechanical behaviour is different in the two cases. The torque produced by the external load (applied to point P) must be balanced by the torque produced by the force on the cable, and if the anchor point is used, a minimum force is necessary on the cable with respect to the use of a -like anchor point because the two anchor points have different distances with respect to the centre of revolution. It is possible to use this result in order to have an adaptable range of calibration as the base of the preferred application for the sensitive mechanism. In the graph on the right (Figure 9), the horizontal lines show that the mobile part touches the fixed one and the measurement is not performed. The black continuous line (Ref) is the reference for a hypothetical condition in which the load can be associated with the calculated force on the cable. This sensitive mechanism is able to operate as a force transducer in the range of 2–10 N.
All displacements are calculated with respect to the starting position. In line with the results shown in the graph in Figure 9 (on the right), the inclination of the lines shown in the graph of Figure 9 is around the same for the four anchor points , , , and .
Figure 10 (right) shows the comparison between the measured and calculated X displacements of the force applied to the point (point P) for the six symmetric anchor points. The distance between the black continuous line and the dashed lines of the six anchor points is reduced, underlining the excellent prevision of the mechanical behaviour of the system. This graph validates the formulations presented in the last sections of this paper and is in line with the results of the simulation shown in Figure 6, validating Equation (26). Figure 10 (left) shows the comparison between the measured displacement of the spring and the measured X displacement of the force application point, underlining how no correlations are noted between point P and the motion of the springs and giving other positive outputs to the formulations presented in this paper because only the presented formulation is able to give the correlation between the spring displacement and motion of point P.
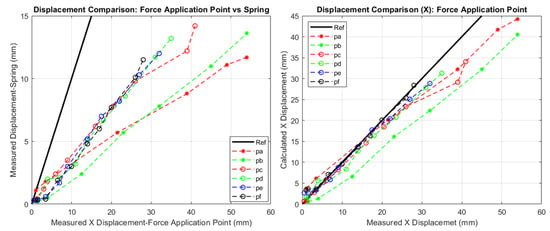
Figure 10.
(Left): comparison between the measured X displacement of the force application point (point P) and the displacement of the spring. (Right): comparison of measured and calculated X displacement of the force application point for six symmetric anchor points (, , , , , ). The black continuous line (Ref) is the reference for the ideal condition.
Figure 11 shows the comparison between the measured and calculated loads applied to the force application point for the six symmetric anchor points. The force on point P is calculated using Equation (4), and the resistance torque () is set equal to zero for the ideal case () and calculated including friction coefficients on the revolute joint () and in the contact between the mobile part and the plane in the two contacts with the two spherical joints (). The coefficient of friction between the shaft of the pulley and the pulley () is included in the calculation. The black continuous line (Ref) is the reference for an ideal condition in which the load can be associated with the calculated applied force. From the graphs in Figure 11, the distance between the black line (Ref) and the dashed lines of the six anchor points represents to what extent the behaviour of the system is near to the ideal one. The distance is caused by the unknown friction in the test bench, which is not included in Formulation (4) when is forced to zero with . A comparison between this graph and the graph of Figure 9 (on the right) suggests that the force on the cable could be used as an alternative to calculate the force on the applied point when the friction on the entire system is not simple to determine. Unfortunately, it is not simple to calculate friction and other non-ideal forces; however, the simulation gives us an idea of the validation of the formula of Equation (4), as shown in Figure 5. In the simulation, only the anchor point was used.
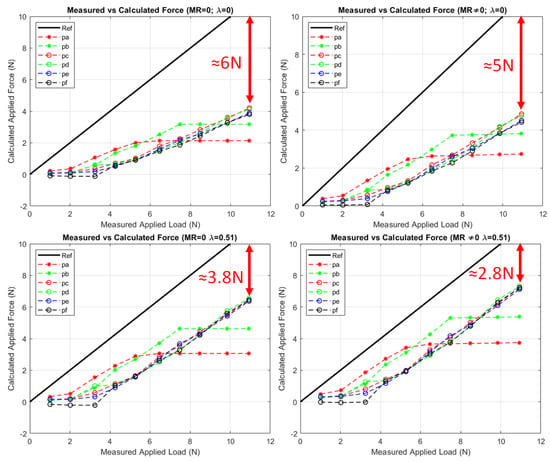
Figure 11.
Comparison between measured and calculated external forces on the force application point for six symmetric anchor points (, , , , , ). Four cases are calculated modifying the friction of the shaft of pulleys ( or ) and the resultant resistant torque ( or ). The black continuous line (Ref) is the reference for the ideal condition.
In order to give an idea of the quality of the presented formulations in this paper, the four graphs in Figure 11 show how the inclination of the calculated applied force is around parallel to the reference continuous line if and . This is a very good result, validating not only Equations (4) and (26) but also other equations for the definition of the friction in the mechanism. From the analysis of Figure 11, it can be noted how the prevision of the friction reduces the gap between the calculated and measured applied force.
6. Conclusions
In this paper, an analysis of a planar cable-driven sensitive mechanism used for force transduction is presented. The external force applied to the mechanism is compared with the calculated one by using the formulation presented in this paper, including the prevision of friction. One of the results of this paper is that the variation in the inclination of the cables seems to have an influence on the correlation between the applied and calculated forces. This result opens up new challenges in the definition of new reconfigurable force transducers. The multibody simulation presented in the paper validates the equations and justifies the different behaviour of the real physical system, which includes friction and non-ideal conditions. The formulations of the presented model are simulated, tested, and validated in the paper. Future work will be oriented toward implementing the model in miniaturised systems like minimally invasive robotic surgery instruments.
Author Contributions
Conceptualization, G.G.M.; methodology, G.G.M.; software, G.G.M.; validation, G.G.M.; formal analysis, G.G.M.; investigation, G.G.M.; resources, G.G.M. and P.F.; data curation, G.G.M.; writing—original draft preparation, G.G.M.; writing—review and editing, G.G.M. and P.F.; visualization, G.G.M. and P.F.; supervision, G.G.M. and P.F.; project administration, G.G.M. and P.F.; funding acquisition, P.F. All authors have read and agreed to the published version of the manuscript.
Funding
This work was supported in part by the European Union Grants ERC-ADG No. 742671, Autonomous Robotic Surgery (ARS) project. URL: https://www.ars-project.eu (accessed on 30 December 2023).
Institutional Review Board Statement
Not applicable.
Informed Consent Statement
Not applicable.
Data Availability Statement
Data are contained within the article.
Conflicts of Interest
The authors declare no conflicts of interest.
Abbreviations
The following abbreviations are used in this manuscript:
| MEMSs | Micro-electro-mechanical systems |
| CDPRs | Cable-driven parallel robots |
References
- Judy, J.W. Microelectromechanical systems (MEMS): Fabrication, design and applications. Smart Mater. Struct. 2001, 10, 1115. [Google Scholar] [CrossRef]
- Oddo, C.M.; Beccai, L.; Muscolo, G.G.; Carrozza, M.C. A Biomimetic MEMS-based Tactile Sensor Array with Fingerprints integrated in a Robotic Fingertip for Artificial Roughness Encoding. In Proceedings of the IEEE 2009 International Conference on Robotics and Biomimetics (ROBIO 2009), Guilin, China, 19–23 December 2009. Finalist for Best Student Paper Award. [Google Scholar]
- Muscolo, G.G.; Moretti, G.; Cannata, G. SUAS: A Novel Soft Underwater Artificial Skin with Capacitive Transducers and Hyperelastic Membrane. Robotica 2019, 37, 756–777. [Google Scholar] [CrossRef]
- Hou, C.; Wang, K.; Wang, F.; Li, H.; Lou, L.; Zhang, S.; Gu, Y.; Liu, H.; Chen, T.; Sun, L. A Highly Integrated 3D MEMS Force Sensing Module with Variable Sensitivity for Robotic-Assisted Minimally Invasive Surgery. Adv. Funct. Mater. 2023, 33, 2302812. [Google Scholar] [CrossRef]
- Muscolo, G.G.; Fiorini, P. Force-Torque Sensors for Minimally Invasive Surgery Robotic Tools: An overview. IEEE Trans. Med. Robot. Bionics 2023, 5, 458–471. [Google Scholar] [CrossRef]
- Huang, Y.; Vasan, A.S.S.; Doraiswami, R.; Osterman, M.; Pecht, M. MEMS Reliability Review. IEEE Trans. Device Mater. Reliab. 2012, 12, 482–493. [Google Scholar] [CrossRef]
- Nguyen, N.; Huang, X.; Chuan, T.K. MEMS-Micropumps: A Review. ASME J. Fluids Eng. 2002, 124, 384–392. [Google Scholar] [CrossRef]
- Leroy, E.; Hinchet, R.; Shea, H. Multimode Hydraulically Amplified Electrostatic Actuators for Wearable Haptics. Adv. Mater. 2020, 32, 2002564. [Google Scholar] [CrossRef]
- Sun, Y.; Lueth, T.C. Safe Manipulation in Robotic Surgery Using Compliant Constant-Force Mechanism. IEEE Trans. Med. Robot. Bionics 2023, 5, 486–495. [Google Scholar] [CrossRef]
- Tong, Z.; Zhang, X.; Wang, G. Automatic Optimization for Compliant Constant Force Mechanisms. Actuators 2023, 12, 61. [Google Scholar] [CrossRef]
- Nudehi, S.S.; Mukherjee, R. Enhancing Controllability and Observability in Underactuated and Undersensed Systems Through Switching: Application to Vibration Control. ASME J. Dyn. Syst. Meas. Control. 2004, 126, 790–799. [Google Scholar] [CrossRef]
- Caldwell, D.G.; Medrano-Cerda, G.A.; Goodwin, M. Control of pneumatic muscle actuators. IEEE Control. Syst. Mag. 1995, 15, 40–48. [Google Scholar] [CrossRef]
- Zhang, W.; Li, H.; Cui, L.; Li, H.; Zhang, X.; Fang, S.; Zhang, Q. Research progress and development trend of surgical robot and surgical instrument arm. Int. J. Med. Robot. 2021, 17, e2309. [Google Scholar] [CrossRef]
- Chen, Q.; Lin, Q.; Wei, G.; Ren, L. Tension vector and structure matrix associated force sensitivity of a 6-DOF cable-driven parallel robot. Proc. Inst. Mech. Eng. Part J. Mech. Eng. Sci. 2022, 236, 100–114. [Google Scholar] [CrossRef]
- Armanini, C.; Boyer, F.; Mathew, A.T.; Duriez, C.; Renda, F. Soft Robots Modeling: A Structured Overview. IEEE Trans. Robot. 2023, 39, 1728–1748. [Google Scholar] [CrossRef]
- Oyman, E.; Korkut, M.; Yilmaz, C.; Bayraktaroglu, Z.; Arslan, M. Design and control of a cable-driven rehabilitation robot for upper and lower limbs. Robotica 2022, 40, 1–37. [Google Scholar] [CrossRef]
- Khomami, A.M.; Najafi, F. A survey on soft lower limb cable-driven wearable robots without rigid links and joints. Robot. Auton. Syst. 2021, 144, 103846, ISSN 0921-8890. [Google Scholar] [CrossRef]
- Lee, C.H.; Gwak, K.W. Design of a novel cable-driven parallel robot for 3D printing building construction. Int. J. Adv. Manuf. Technol. 2022, 123, 4353–4366. [Google Scholar] [CrossRef]
- Muscolo, G.G.; Fiorini, P. A New Cable-Driven Model for Under-Actuated Force–Torque Sensitive Mechanisms. Machines 2023, 11, 617. [Google Scholar] [CrossRef]
- Liu, Z.; Qin, Z.; Gao, H.; Sun, G.; Huang, Z.; Deng, Z. Initial-Pose Self-Calibration for Redundant Cable-Driven Parallel Robot Using Force Sensors Under Hybrid Joint-Space Control. IEEE Robot. Autom. Lett. 2023, 8, 1367–1374. [Google Scholar] [CrossRef]
- Zi, B.; Ding, H.; Wu, X.; Kecskemethy, A. Error modeling and sensitivity analysis of a hybrid-driven based cable parallel manipulator. Precis. Eng. 2014, 38, 197–211. [Google Scholar] [CrossRef]
- Li, J.; Zhao, Y.; Tang, Q.; Sun, W.; Yuan, F.; Lu, X. Conceptual design and error analysis of a cable-driven parallel robot. Robotica 2022, 40, 2152–2167. [Google Scholar] [CrossRef]
- Wang, X.; Ma, S.; Lin, Q. Hybrid pose/tension control based on stiffness optimization of cable-driven parallel mechanism in wind tunnel test. In Proceedings of the 2016 2nd International Conference on Control, Automation and Robotics (ICCAR), Hong Kong, China, 28–30 April 2016; pp. 75–79. [Google Scholar] [CrossRef]
- Patel, S.; Nguyen, V.L.; Caverly, R.J. Forward kinematics of a cable-driven parallel robot with pose estimation error covariance bounds. Mech. Mach. Theory 2023, 183, 105231. [Google Scholar] [CrossRef]
- Rousseau, T.; Pedemonte, N.; Caro, S.; Chaumette, F. Stability Analysis of Profile Following by a CDPR using Distance and Vision Sensors. In Cable-Driven Parallel Robots, Proceedings of the International Conference on Cable-Driven Parallel Robots, Nantes, France, 25–28 June 2023; Springer Nature: Cham, Switzerland, 2023. [Google Scholar]
- Ennaiem, F.; Chaker, A.; Arévalo, J.S.S.; Laribi, M.A.; Bennour, S.; Mlika, A.; Romdhane, L.; Zeghloul, S. Sensitivity based selection of an optimal cable-driven parallel robot design for rehabilitation purposes. Robotics 2020, 10, 7. [Google Scholar] [CrossRef]
- Liu, P.; Tian, H.; Qiao, X. Minimum Cable Tensions and Tension Sensitivity for Long-Span Cable-Driven Camera Robots with Applications to Stability Analysis. Actuators 2022, 12, 17. [Google Scholar] [CrossRef]
- Yoon, J.; Lee, D.; Bang, J.; Shin, H.G.; Chung, W.K.; Choi, S.; Kim, K. Cable-Driven Haptic Interface with Movable Bases Achieving Maximum Workspace and Isotropic Force Exertion. IEEE Trans. Haptics 2023, 16, 365–378. [Google Scholar] [CrossRef]
- Yu, L.; Yu, X.; Zhang, Y. Microinstrument contact force sensing based on cable tension using BLSTM–MLP network. Intell. Serv. Robot. 2020, 13, 123–135. [Google Scholar] [CrossRef]
Disclaimer/Publisher’s Note: The statements, opinions and data contained in all publications are solely those of the individual author(s) and contributor(s) and not of MDPI and/or the editor(s). MDPI and/or the editor(s) disclaim responsibility for any injury to people or property resulting from any ideas, methods, instructions or products referred to in the content. |
© 2024 by the authors. Licensee MDPI, Basel, Switzerland. This article is an open access article distributed under the terms and conditions of the Creative Commons Attribution (CC BY) license (https://creativecommons.org/licenses/by/4.0/).