
Design Methodology and Economic Impact of Small-Scale HAWT Systems for Urban Distributed Energy Generation

Abstract
1. Introduction
2. Methodology
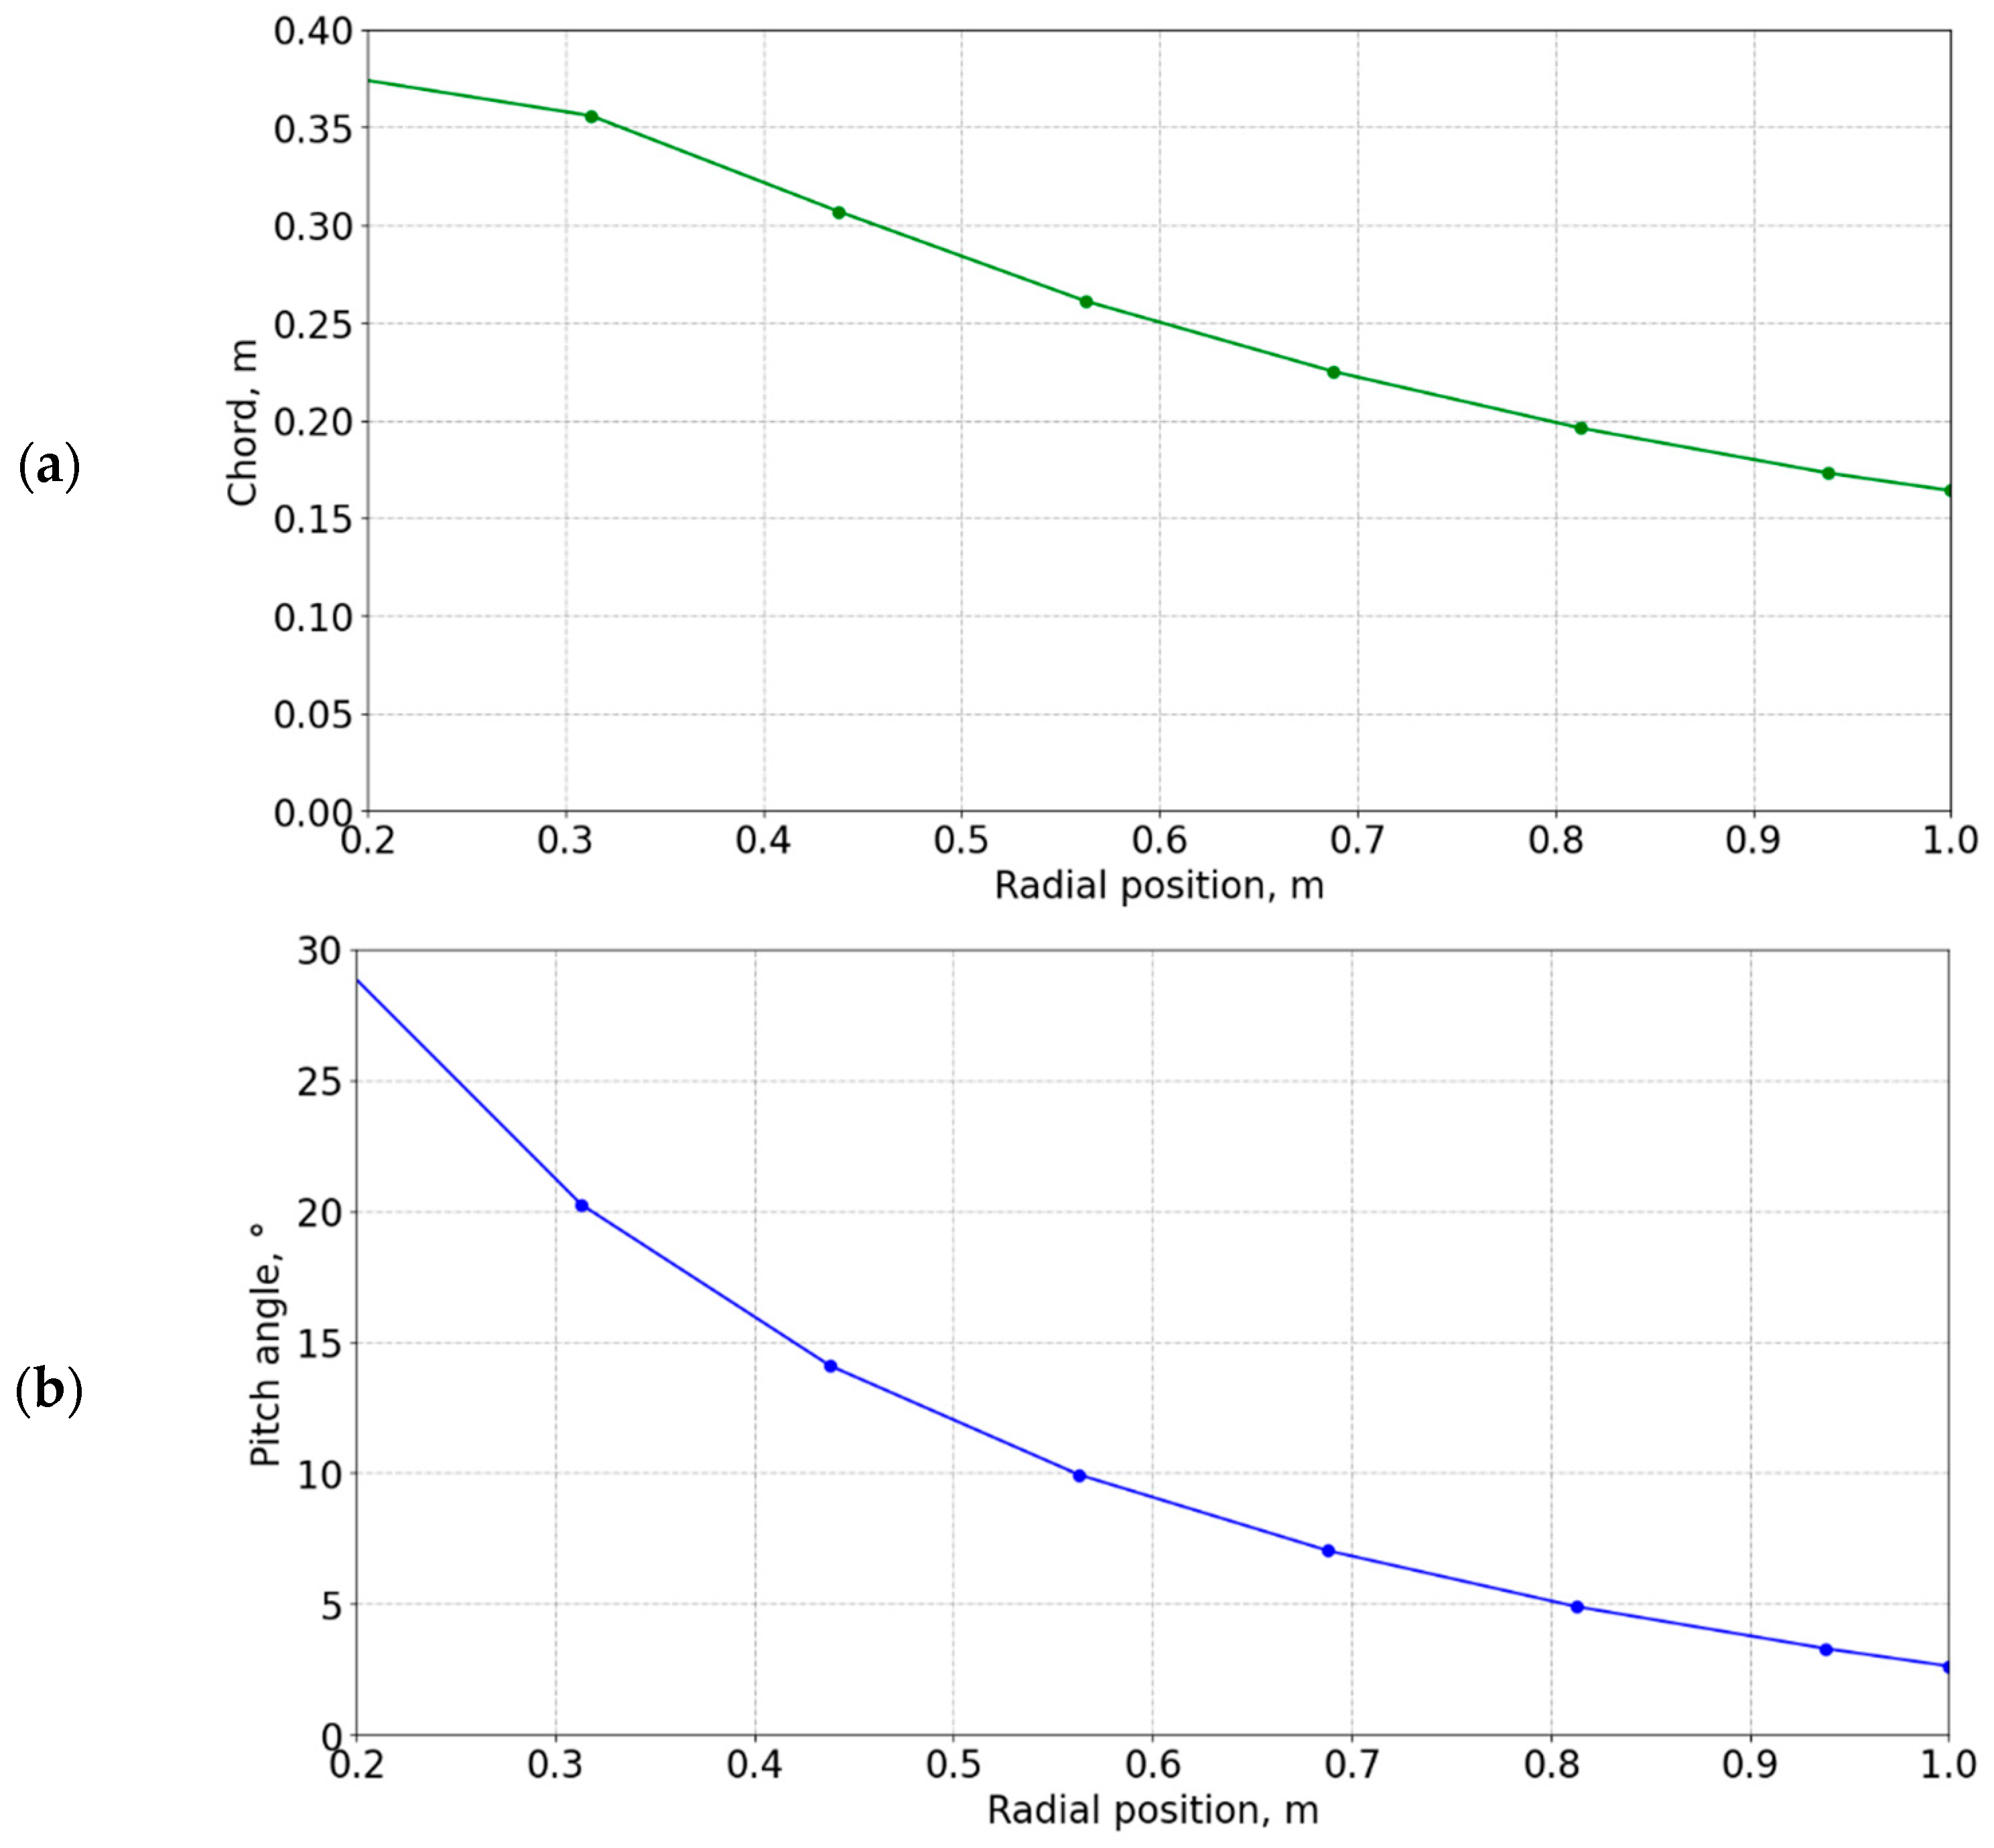
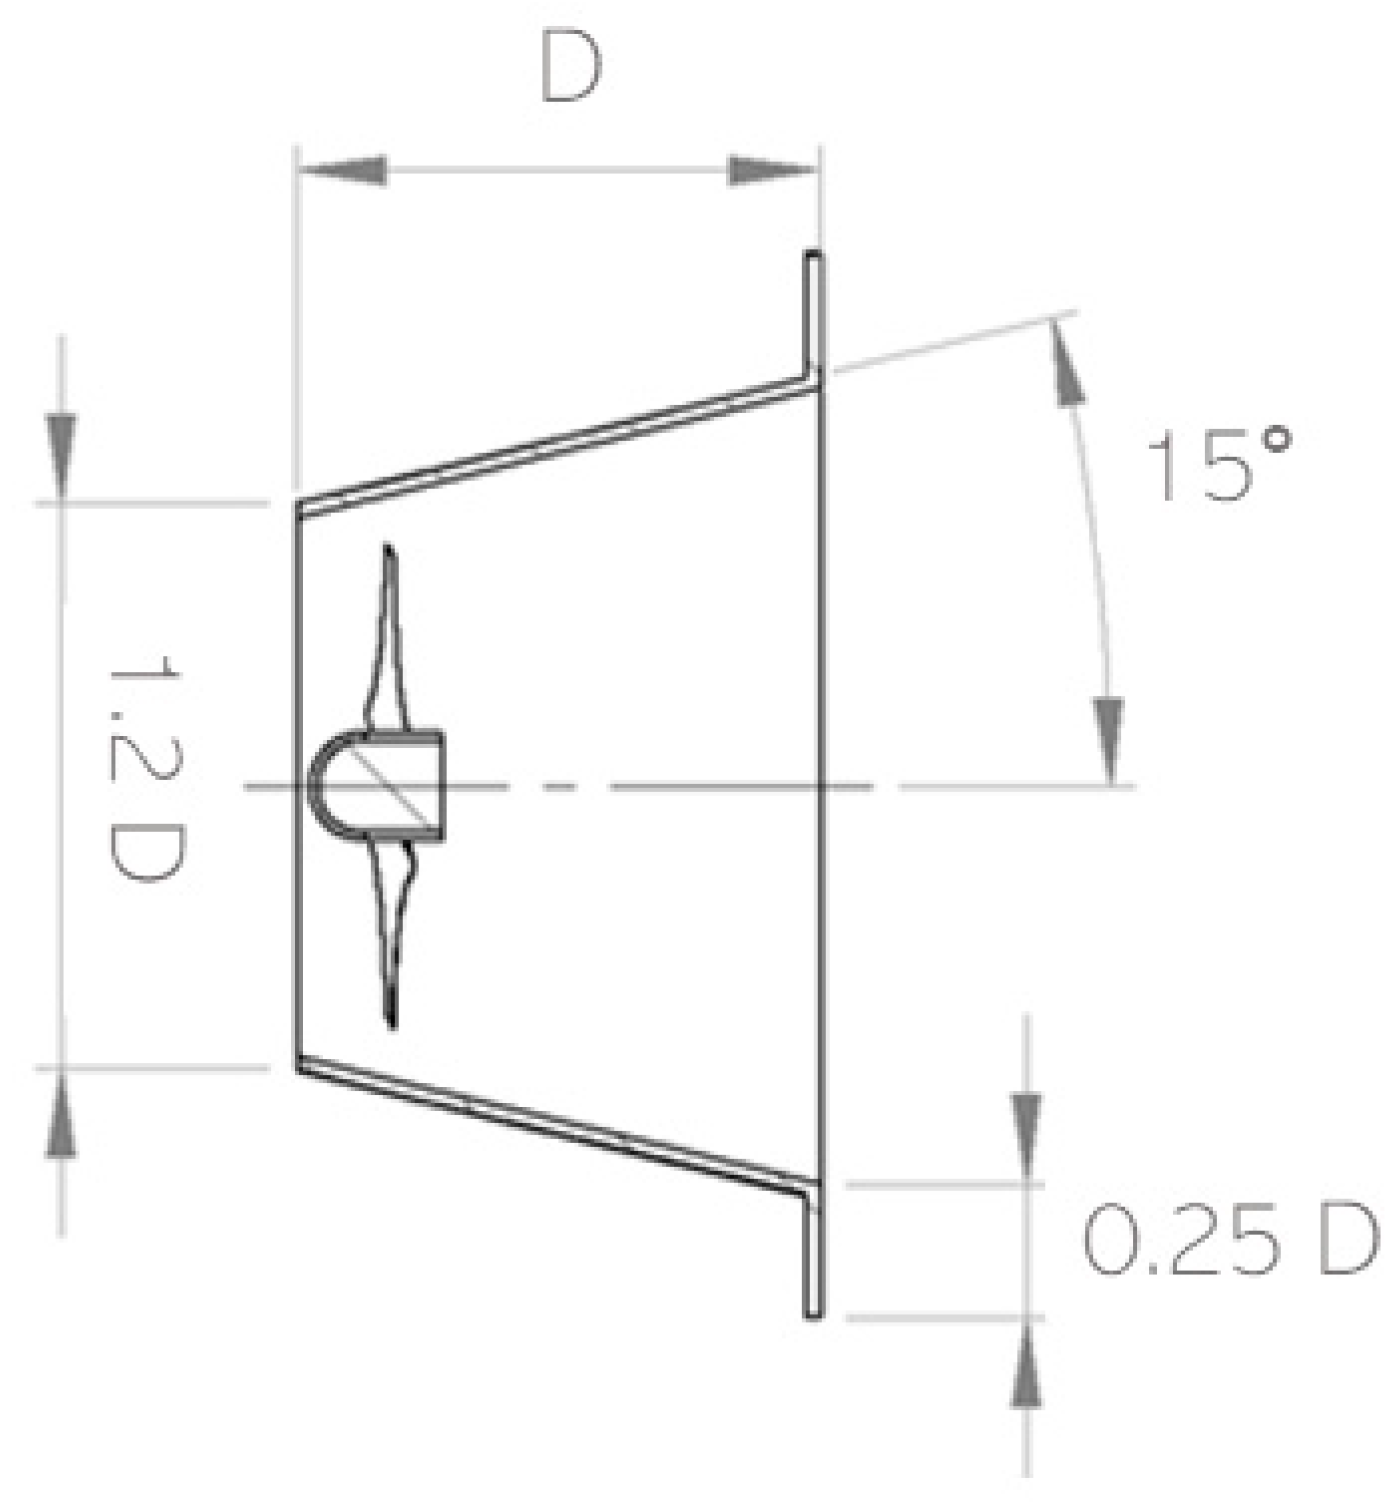
2.1. Turbine Design
2.2. Economic Analysis
3. Results
3.1. Power Coefficient and Power Curves
3.2. LCOE Comparison
4. Discussion
5. Conclusions
- The numerical simulation results indicate that significant increase in the power coefficient is obtained with diffuser augmentation DSWT compared to bare rotor design BSWT. Moreover, DSWT power coefficients are relatively high in a wide range of operating conditions (at different wind speeds). The maximum power coefficient of 0.43 is achieved at TSR of 3.5 for BSWT while for DSWT the maximum power coefficient of 0.78 is achieved at TSR of 4.5.
- The calculated LCOE is the lowest for the diffuser augmented turbines (DSWT) at all the considered locations, but the best wind conditions for small wind turbine installation are in Split. It worth noting that the use of a more sophisticated variable speed control strategy resulted in a higher LCOE than in the case of the fixed speed generator in Split, Knin and Šibenik, while in Zadar it is lower. This can be explained by comparing histograms. Most of the time, the wind speeds are far from the design conditions and there is more of an advantage of a variable rotational speed generator that enables operation at maximum efficiency even in the case of these off-design wind conditions. This leads to the conclusion that the use of a more expensive and more sophisticated variable rotational speed generator is justified mainly at locations where there is a significant frequency of wind speeds (above 40–50%) that are far from the design wind speed value.
- The sensitivity analysis demonstrates that diffuser-augmented turbines, particularly the DSWT-FS model, remain economically competitive, even with significant increases in investment and maintenance costs, offering a promising alternative to traditional bare turbine technologies. Moreover, the analysis of overestimated energy production reveals that, even when DSWT technology experiences a 20% reduction in actual energy production compared to the estimated value, its LCOE remains comparable to or lower than that of BSWT technology, where actual production matches the initial estimate.
- To ensure the reliable operation of small wind turbines with the diffuser in the urban areas, it is necessary to further consider the protection of diffuser augmented turbines in extreme wind conditions.
Author Contributions
Funding
Data Availability Statement
Conflicts of Interest
Appendix A
References
- Stathopoulos, T.; Alrawashdeh, H.; Al-Quraan, A.; Blocken, B.; Dilimulati, A.; Paraschivoiu, M.; Pilay, P. Urban wind energy: Some views on potential and challenge. J. Wind Eng. Ind. Aerodyn. 2018, 179, 146–157. [Google Scholar] [CrossRef]
- Rodriguez, C.V.; Rios, A.; Luyo, J.E. CFD Design of Urban Wind Turbines: A Review and Critical Analysis. Int. J. Renew. Energy Res. 2021, 11, 621–638. [Google Scholar]
- Mokarran, M.; Pham, T.M. Predicting wind turbine energy production with deep learning methods in GIS: A study on HAWTs and VAWTs. Sustain. Energy Technol. Assess. 2024, 72, 104070. [Google Scholar]
- Liu, S.; Zhang, L.; Lu, J.; Zhang, X.; Wang, K.; Gan, Z.; Liu, X.; Jing, Z.; Cui, X.; Wang, H. Advances in urban wind resource development and wind energy harvesters. Renew. Sust. Energy Rev. 2025, 207, 114943. [Google Scholar] [CrossRef]
- Tasneem, Z.; Al Noman, A.; Das, S.K.; Saha, D.K.; Islam, M.R.; Ali, M.F.; Badal, M.F.R.; Ahamed, M.H.; Moyeen, S.I.; Alam, F. An analytical review on the evaluation of wind resource and wind turbine for urban application: Prospect and challenges. Dev. Built Environ. 2020, 205, 104324. [Google Scholar] [CrossRef]
- Idriss, A.I.; Ahmed, R.; Omar, A.I.; Said, R.K.; Akinci, T.C. Wind energy potential and micro-turbine performance analysis in Djibouti-city, Djibouti. Eng. Sci. Technol. Int. J. 2020, 23, 65–70. [Google Scholar] [CrossRef]
- Emejeamara, F.C.; Tomlin, A.S. A method for estimating the potential power available to building mounted wind turbines within turbulent urban air flows. Renew. Energy 2020, 153, 787–800. [Google Scholar] [CrossRef]
- Shah, S.R.; Kumar, R.; Raahemifar, K.; Fung, A.S. Design, modeling and economic performance of a vertical axis wind turbine. Energy Rep. 2018, 4, 619–623. [Google Scholar] [CrossRef]
- Wong, K.H.; Chong, W.T.; Yap, H.T.; Fazlizan, A.; Omar, W.Z.W.; Poh, S.C.; Hsiao, F.B. The design and flow simulation of a power-augmented shroud for urban wind turbine system. Energy Procedia 2014, 61, 1275–1278. [Google Scholar] [CrossRef]
- Zanforlin, S.; Letizia, S. Improving the performance of wind turbines in urban environment by integrating the action of a diffuser with the aerodynamics of the rooftops. Energy Procedia 2015, 82, 774–781. [Google Scholar] [CrossRef]
- Juan, Y.; Rezaeiha, A.; Montazeri, H.; Blocken, B.; Yang, A. Improvement of wind energy potential through building corner modifications in compact urban areas. J. Wind Eng. Ind. Aerodyn. 2024, 248, 105710. [Google Scholar] [CrossRef]
- Gil-García, I.C.; García-Cascales, M.S.; Molina-García, A. Urban Wind: An Alternative for Sustainable Cities. Energies 2022, 15, 4759. [Google Scholar] [CrossRef]
- Adeyeye, K.A.; Ijumba, N.; Colton, J.S. A Techno-Economic Model for Wind Energy Costs Analysis for Low Wind Speed Areas. Processes 2021, 9, 1463. [Google Scholar] [CrossRef]
- Pambudi, N.A.; Febriyanto, R.; Wibowo, K.M.; Setyawan, N.D.; Wardani, N.S.; Saw, L.H.; Rudiyanto, B. The Performance of Shrouded Wind Turbine at Low Wind Speed Condition. Energy Procedia 2019, 158, 260–265. [Google Scholar]
- Rahmatian, M.A.; Tari, P.H.; Mojaddam, M.; Majidi, S. Numerical and experimental study of the ducted diffuser effect on improving the aerodynamic performance of a micro horizontal axis wind turbine. Energy 2022, 245, 123267. [Google Scholar] [CrossRef]
- Pellegrini, M.; Guzzini, A.; Saccani, C. Experimental measurements of the performance of a micro-wind turbine located in an urban area. Energy Rep. 2021, 7, 3922–3934. [Google Scholar] [CrossRef]
- Ragnarsson, B.F.; Oddsson, G.V.; Unnthorsson, R.; Hrafnkelsson, B. Levelized Cost of Energy Analysis of a Wind Power Generation System at Búrfell in Iceland. Energies 2015, 8, 9464–9485. [Google Scholar] [CrossRef]
- Masukume, P.M.; Makaka, G.; Tinarwo, D. Technoeconomic Analysis of Ducted Wind Turbines and Their Slow Acceptance on the Market. J. Renew. Energy 2014, 1, 951379. [Google Scholar] [CrossRef]
- Galinos, C.; Larsen, T.J.; Madsen, H.A.; Paulsen, U.S. Vertical axis wind turbine design load cases investigation and comparison with horizontal axis wind turbine. Energy Procedia 2016, 94, 319–328. [Google Scholar] [CrossRef]
- ArabGolarcheh, A.; Anbarsooz, M.; Benini, E. An actuator line method for performance prediction of HAWTs at urban flow conditions: A case study of rooftop wind turbines. Energy 2024, 292, 130268. [Google Scholar] [CrossRef]
- Dilimulati, A.; Stathopoulos, T.; Paraschivoiu, M. Wind turbine designs for urban applications: A case study of shrouded diffuser casing for turbines. J. Wind Eng. Ind. Aerodyn. 2018, 175, 179–192. [Google Scholar] [CrossRef]
- Barbarić, M. Mogućnosti poboljšanja hidrodinamičkih karakteristika kinetičkih vodnih turbina. Ph.D. Thesis, University of Zagreb, Faculty of Mechanical Engineering and Naval Architecture, Zagreb, Croatia, 2021. [Google Scholar]
- Drela, M.; Youngren, H. Xfoil, Subsonic Airfoil Development System. Available online: http://web.mit.edu/drela/Public/web/xfoil/ (accessed on 28 October 2024).
- Umar, D.A.; Yaw, C.T.; Koh, S.P.; Tiong, S.K.; Alkahtani, A.A.; Yusaf, T. Design and Optimization of a Small-Scale Horizontal Axis Wind Turbine Blade for Energy Harvesting at Low Wind Profile Areas. Energies 2022, 15, 3033. [Google Scholar] [CrossRef]
- Celik, I.B. Procedure for estimation and reporting of uncertainty due to discretization in CFD applications. J. Fluids Eng. Trans. ASME 2008, 130, 078001. [Google Scholar]
- Hsiao, F.; Bai, F.; Wen-Tong, C. The Performance Test of Three Different Horizontal Axis Wind Turbine (HAWT) Blade Shapes Using Experimental and Numerical Methods. Energies 2013, 6, 2784–2803. [Google Scholar] [CrossRef]
- Khojasteh, H.; Noorollahi, Y.; Tahani, M.; Masdari, M. Optimization of Power and Levelized Cost for Shrouded Small Wind Turbine. Inventions 2020, 5, 59. [Google Scholar] [CrossRef]
- Delapedra-Silva, V.; Ferreira, P.; Cunha, J.; Kimura, H. Methods for Financial Assessment of Renewable Energy Projects: A Review. Processes 2022, 10, 184. [Google Scholar] [CrossRef]
- Steffen, B. Estimating the cost of capital for renewable energy projects. Energy Econ. 2020, 88, 104783. [Google Scholar] [CrossRef]
- Roth, A.; Brückmann, R.; Jimeno, M.; Đukan, M.; Kitzing, L.; Breitschopf, B.; Alexander-Haw, A.; Blanco, A.L.A. Renewable Energy Financing Conditions in Europe: Survey and Impact Analysis; Report; Aures: Cheshire, UK, 2021. [Google Scholar]
- Meteorological, C.; Service, H. Meteorological Data. Available online: https://meteo.hr/index_en.php (accessed on 28 October 2024).
- Banuelos-Ruedas, F.; Angeles-Camacho, C.; Rios-Marcuello, S. Methodologies Used in the Extrapolation of Wind Speed Data at Different Heights and Its Impact in the Wind Energy Resource Assessment in a Region. In Wind Farm-Technical Regulations, Potential Estimation and Siting Assessment; IntechOpen: London, UK, 2021. [Google Scholar]
- Moriarty, P.J.; Hansen, A.C. AeroDyn Theory Manual; NREL: Golden, CO, USA, 2005.


| Mesh | ||||||
|---|---|---|---|---|---|---|
| 1 | 2.0 M | 0.7902 | 1.66 | 0.938 Monotonic convergence | 1.6 | 1.14% |
| 2 | 1.2 M | 0.7994 | 2.4 | |||
| 3 | 0.5 M | 0.8092 | - |
| City | |||||
|---|---|---|---|---|---|
| Turbine | Zadar | Šibenik | Knin | Split | |
| APP (kWh) | BSWT-FS | 558.6 | 863.1 | 818.7 | 1463.5 |
| BSWT-VS | 840.4 | 1070.4 | 1021.6 | 1693.8 | |
| DSWT-FS | 1193.8 | 1703.4 | 1650.7 | 2744.3 | |
| DSWT-VS | 1544.4 | 1970.9 | 1861.4 | 3124.8 | |
| LCOE (€/kWh) | BSWT-FS | 0.363 | 0.235 | 0.248 | 0.139 |
| BSWT-VS | 0.314 | 0.246 | 0.258 | 0.156 | |
| DSWT-FS | 0.229 | 0.161 | 0.166 | 0.100 | |
| DSWT-VS | 0.222 | 0.174 | 0.184 | 0.110 | |
Disclaimer/Publisher’s Note: The statements, opinions and data contained in all publications are solely those of the individual author(s) and contributor(s) and not of MDPI and/or the editor(s). MDPI and/or the editor(s) disclaim responsibility for any injury to people or property resulting from any ideas, methods, instructions or products referred to in the content. |
© 2024 by the authors. Licensee MDPI, Basel, Switzerland. This article is an open access article distributed under the terms and conditions of the Creative Commons Attribution (CC BY) license (https://creativecommons.org/licenses/by/4.0/).
Share and Cite
Budanko, M.; Guzović, Z. Design Methodology and Economic Impact of Small-Scale HAWT Systems for Urban Distributed Energy Generation. Machines 2024, 12, 886. https://doi.org/10.3390/machines12120886
Budanko M, Guzović Z. Design Methodology and Economic Impact of Small-Scale HAWT Systems for Urban Distributed Energy Generation. Machines. 2024; 12(12):886. https://doi.org/10.3390/machines12120886
Chicago/Turabian StyleBudanko, Marina, and Zvonimir Guzović. 2024. "Design Methodology and Economic Impact of Small-Scale HAWT Systems for Urban Distributed Energy Generation" Machines 12, no. 12: 886. https://doi.org/10.3390/machines12120886
APA StyleBudanko, M., & Guzović, Z. (2024). Design Methodology and Economic Impact of Small-Scale HAWT Systems for Urban Distributed Energy Generation. Machines, 12(12), 886. https://doi.org/10.3390/machines12120886