Article

Prediction and Analysis of Borosilicate Glass Surface Deformation Induced by Flame Jet

1
AVIC Aerodynamics Research Institute, Shenyang 110034, China
2
Aviation Key Laboratory of Science and Technology of High Speed and High Reynolds, Shenyang 110034, China
3
School of Mechatronic Engineering and Automation, Foshan University, Foshan 528001, China
4
Guangdong Provincial Key Laboratory of Industrial Intelligent Inspection Technology, Foshan University, Foshan 528000, China
5
School of Mechatronic Engineering, Changchun University of Science and Technology, Changchun 130022, China
*
Author to whom correspondence should be addressed.
Machines 2024, 12(11), 765; https://doi.org/10.3390/machines12110765
Submission received: 28 September 2024 / Revised: 23 October 2024 / Accepted: 28 October 2024 / Published: 30 October 2024
(This article belongs to the Section Material Processing Technology)

Abstract

:
To address the issues of low processing efficiency, poor forming accuracy, and internal damage in glass material processing, this study proposes the use of flame jet forming. However, the mechanism of flame jet processing requires further elucidation. This research investigates the relationship between the indentation morphology on the glass surface and the inlet velocity of the flame jet. A theoretical model was established through mathematical analysis to reflect this relationship. The model’s accuracy was validated using numerical simulation methods. By comparing experimental data with theoretical model results, surface tension was incorporated, and the model was iteratively optimized using MATLAB R2024a. The final optimized model demonstrated an absolute error range of 0.009 to 0.069 mm. This study confirms the feasibility of flame jet processing and enriches the understanding of its mechanism, providing a novel, efficient, and precise method for processing glass materials.

1. Introduction

Glass is a transparent, brittle, and chemically stable material with good thermal conductivity and electrical insulation properties. As the precision requirements in these fields continue to rise, the demand for accurate machining of glass products also escalates. It has been widely used in fields such as optics [1], medicine [2], and architecture [3]. At present, glass processing mainly includes two methods: ultra-precision processing [4,5,6] and thermoforming [7,8]. The theoretical foundation of ultra-precision cutting technology lies in the deformation of hard, brittle materials under the imprinting of a rigid diamond tool. Thermoforming refers to heating glass above its softening point temperature, making quartz glass soft and easy to process. However, existing processing methods have problems such as high processing difficulty, high processing cost, and low processing accuracy. A new processing method is needed to make up for the shortcomings of the current glass processing method.
Flame jet forming leverages the high temperature and high flow velocity characteristics of the flame jet to continuously impact the glass material. The elevated temperatures of the flame jet cause the impacted regions of the glass to soften. Concurrently, the kinetic energy carried by the flame jet impacts the softened region, inducing deformation in that area. By regulating key parameters such as jet flow velocity and jet height and controlling the trajectory of the jet nozzle, precise control over the curvature of the formed glass surface can be achieved. The forming principle is illustrated in Figure 1.
The flame jet forming enables precise machining of glass materials, ensuring processing accuracy and overcoming the limitations of traditional machining methods. This expands the application and development potential of glass materials. Existing studies have thoroughly validated the exceptional properties of flame jets [9,10,11,12] and their effective interaction with objects [13,14,15]. Researchers have successfully applied this technique to fields such as welding [16], cutting [17], and thermal spraying [18]. Current research has characterized the flow field near the glass surface following the impact of flame jets on glass plates [19] and has applied flame jets to the polishing of array lenses, achieving high-quality processed surfaces [20]. These studies establish a theoretical foundation for flame jet forming. Current research has made some progress in characterizing flame jet behavior, yet the detailed interactions between flame jets and glass surfaces, particularly the distribution of thermal and kinetic energy, remain insufficiently understood. Furthermore, no mathematical models have been developed that adequately describe the phenomena occurring during the flame jet forming process.
To verify the feasibility of flame jet forming and to gain a deeper understanding of its forming mechanism, this study employs the fluid momentum depth equation to establish a mathematical model that correlates the inlet velocity of the oxyhydrogen flame jet with the resulting indentation morphology. The accuracy of the model’s trends was validated through simulation experiments. Subsequently, the model was iteratively optimized using experimental data on glass indentation depths, leading to the development of a refined model. This refined model enables accurate prediction of the indentation depth on the glass surface under varying flame inlet velocities, thereby enhancing the understanding of the detailed interactions between the flame jet and the glass surface.

2. Modeling and Analysis

Establishing a theoretical model for flame jet forming is crucial for understanding its mechanisms and guiding practical applications. However, the construction of such a model is complex due to the involvement of flame flow field variations and the material properties of glass. This study analyzes the distribution of temperature and velocity fields in flame jets and combines this with the intrinsic properties of glass materials to develop a theoretical model. This model effectively captures the morphology of surface depression in glass materials resulting from the impact of flame jets.

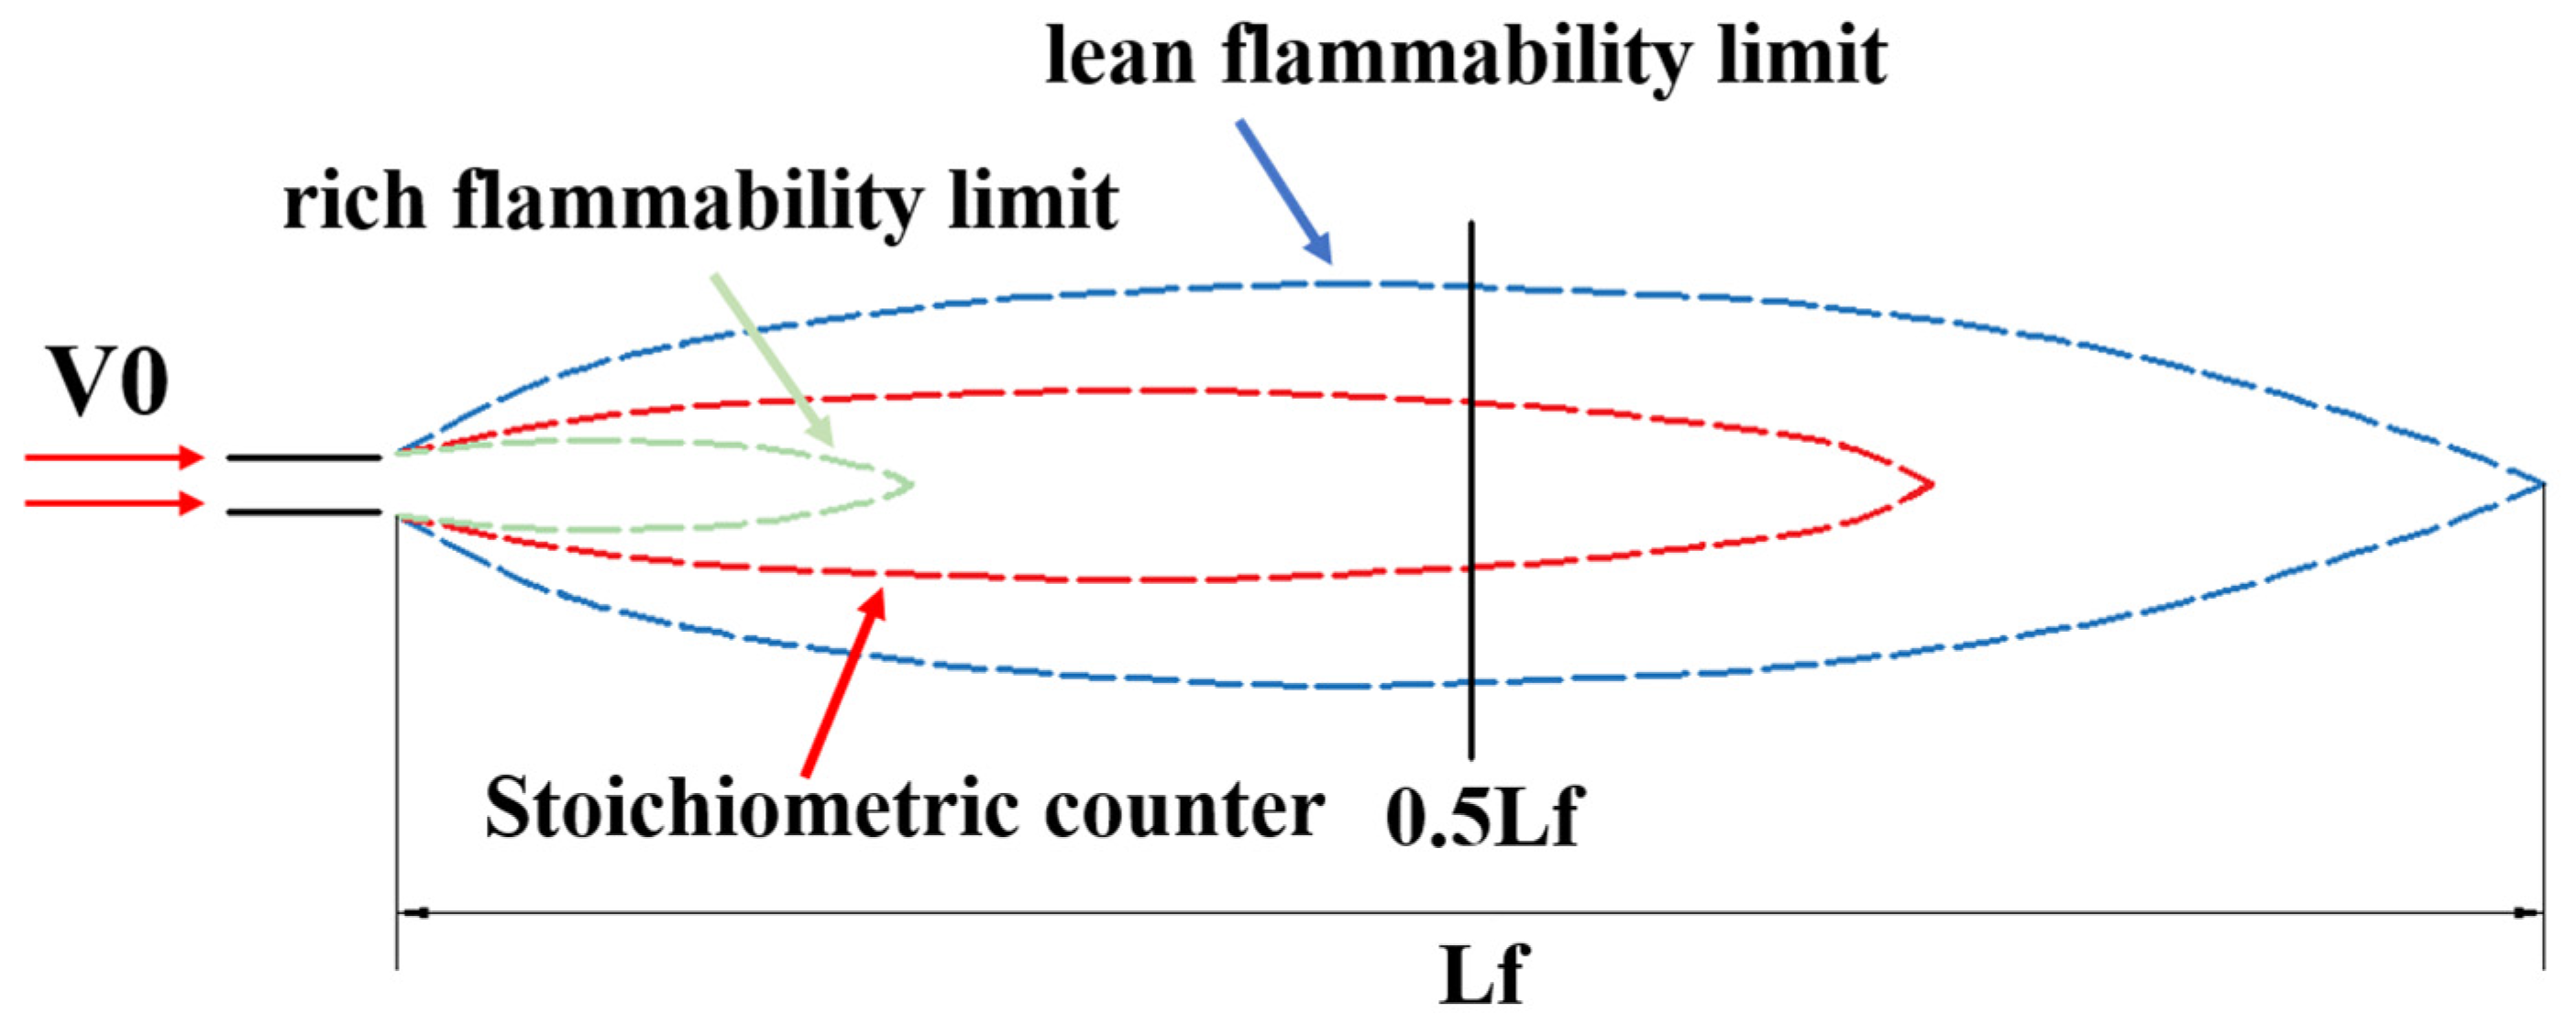
2.1. Determination of the Self-Shape Morphology of Flames

When the flame jet is ejected from the nozzle of the spray gun, it entrains air from the surrounding environment. The entrainment of ambient air causes the fuel concentration in the jet to decrease as it mixes with the environment. The ratio of this momentum to buoyancy can be characterized by the exit density Froude number [21].
Determining the morphology of flames is essential for understanding their temperature distribution and kinetic properties. Therefore, this study first analyzes the morphology of flames. When flames are expelled from the nozzle, they may entrain excessive air, leading to a reduction in concentration and forming a turbidity current phenomenon. This phenomenon can cause the flames to transition into a turbulent state. In the absence of turbidity current, the flames maintain a jet-like morphology. To analyze the morphology of flames, this study introduces the exit Froude number. The morphology of the flames is determined using the exit Froude number, calculated by the following equation:
F r = U 0 · 3.16 · p 0 1 / 2 / ( d ( p a i r p 0 ) ) 1 / 2
where U0 is the exit velocity, d is the nozzle diameter, pair is the density of the ambient air, and p0 is the inlet density of the hydrogen.
When the Froude number > 1000, the flames are in a jet configuration; when the Froude number ≤ 1000, the flames are in a turbulent configuration. The flame nozzle used in this study has a millimeter-scale diameter, and calculations confirm that the Froude number for the flames in this study always exceeds 1000, placing them within the high Froude number jet regime. Therefore, the flames utilized in this study exhibit a jet configuration, with their characteristics primarily determined by the initial momentum of the jet rather than the buoyancy effects arising from relative density differences between the gases in the jet and the ambient air. Consequently, the relevant characteristic equations for the theoretical model can be established.

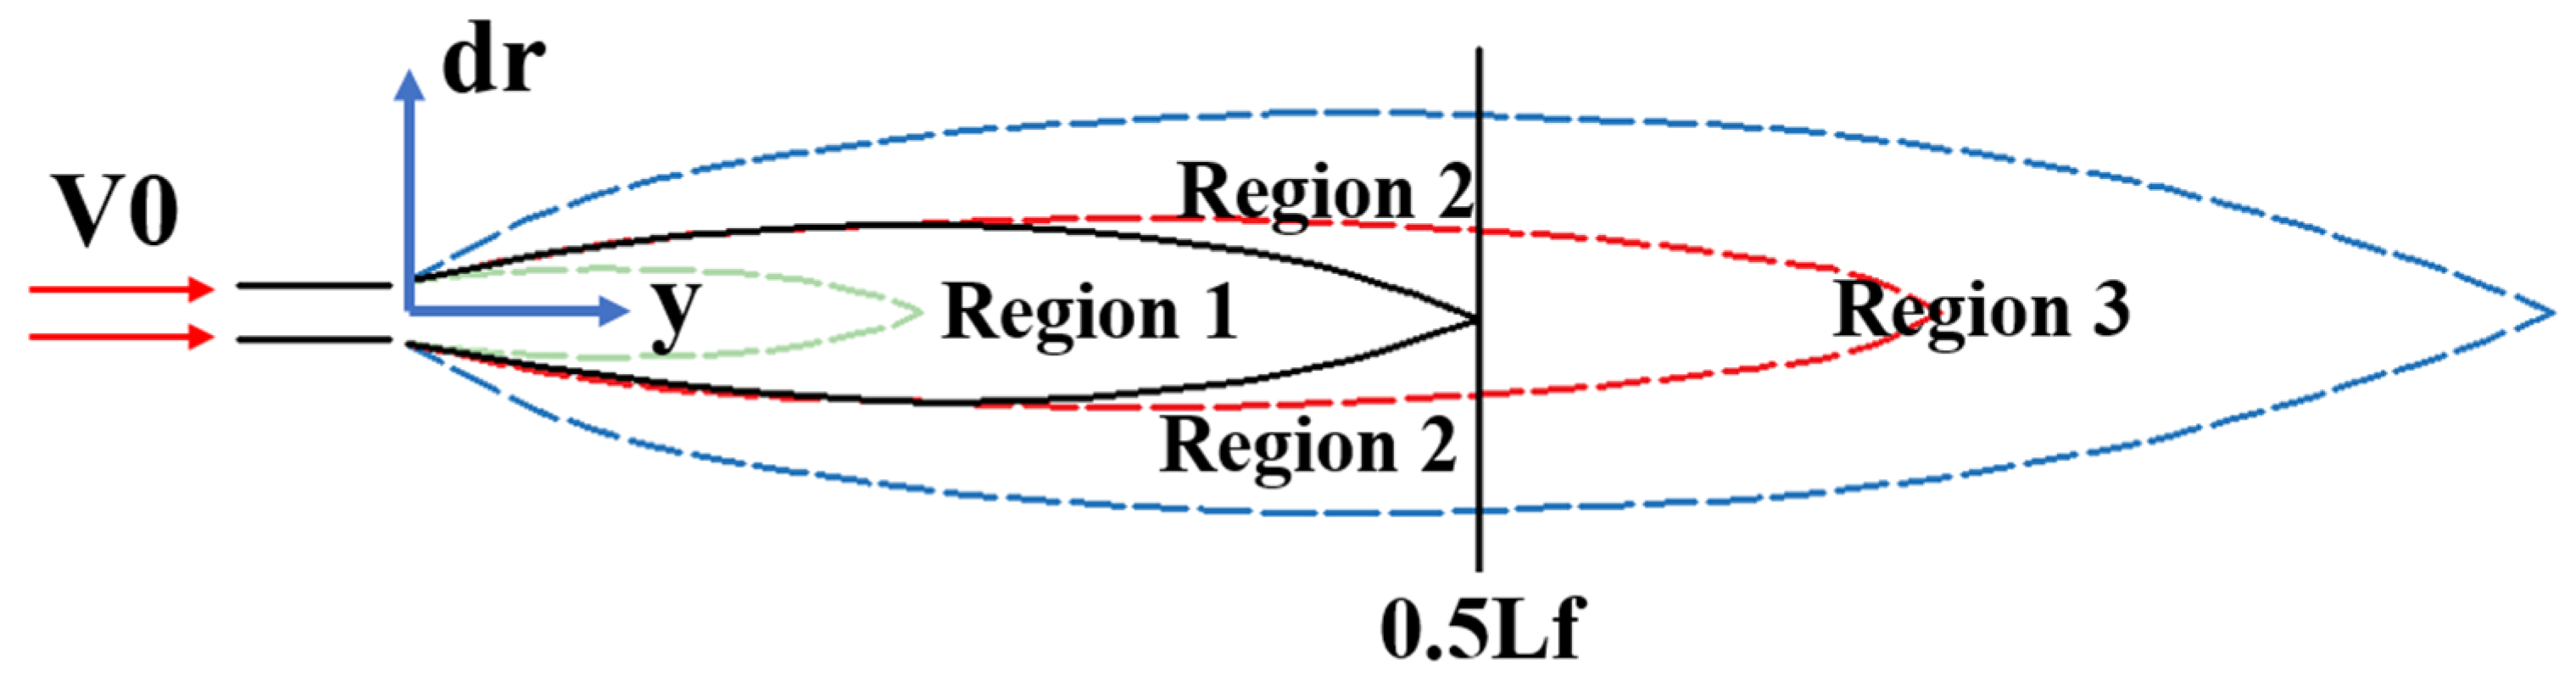
2.2. Determination of the Machining Scope

Determining the processing envelope of flame jets is essential for establishing a predictive processing model and elucidating the machining mechanism. The inherent structural characteristics of flame jets lead to temperature variations across different flame regions. Consequently, upon impact with a glass surface, varying temperatures occur, resulting in different degrees of processing depth at various indentation points. Therefore, based on the temperature distribution mechanism of flame jets and in conjunction with the temperature requirements for glass deformation, this study employs mathematical analysis to precisely define the radial temperature distribution characteristics of flame jets, accurately determining the processing zone.
As depicted in Figure 2, the structure of flame jets can be categorized into three primary regions based on fuel concentration and combustion completeness: the lean flammability region, the rich flammability region, and the stoichiometric region [22]. In the rich flammability region, an excessive fuel concentration combined with insufficient oxygen prevents effective combustion, resulting in the lowest temperatures. Conversely, in the stoichiometric region, the fuel-to-oxygen ratio is theoretically optimal, enabling efficient combustion and yielding the highest temperatures. In the lean flammability region, temperatures decrease progressively as the boundary distance diminishes, indicating a deficiency in fuel concentration and a reduction in combustion efficiency. This study opts to utilize the stoichiometric region while avoiding the rich flammability region.
Based on the inherent characteristics of flame jets, the radial temperature of the flame decreases progressively from the center outward. An in-depth analysis of this radial temperature variation indicates that the heat radiation from the centerline of the flame jet transfers thermal energy to the surrounding air. As the distance from the centerline increases, thermal convection and thermal conduction become more pronounced, thermal convection takes heat away from the center of the flame through the movement of the fluid, causing the temperature of the outer fluid to gradually decrease; at the same time, heat conduction causes the heat inside the high-temperature flame to diffuse outward, causing the temperature to drop. In addition, the heat radiated to the surroundings during the combustion process, and the mixing effect will also increase energy loss, thereby further reducing the temperature. These factors together cause the flame temperature to gradually decrease outward along the center line. Therefore, it is necessary to further analyze the radial temperature of the flame jet. The analysis of radial temperature should first clarify the centerline temperature. The centerline temperature of the flame jet can be calculated using Equation (2) [12].
T c l T max = { 1.85 exp [ 1.48 ( y L f ) ] + 0.12 , y L f > 0.5 1.13 1.17 · 0.012 ( y L f ) , y L f 0.5
where y represents the distance from the nozzle to the glass surface, Tcl represents the centerline temperature at distance y from the nozzle. Tmax indicates the maximum flame temperature, and Lf signifies the length of the oxy-hydrogen flame jet.
According to the centerline temperature formula, determining the temperature also requires specifying the length of the oxy-hydrogen flame jet. The length of the oxy-hydrogen flame jet is determined using the flame-jet length formula derived by Mogi T et al. [23]:
L f = 5.564 Re f 1000 ( Re f 4500 )
where Lf represents the flame length, and Ref denotes the Reynolds number.
Upon establishing the central line temperature and the length of the flame jets, this study categorizes the flame structure into three distinct regions based on their temperature distribution to accommodate varying processing characteristics. The processing range is determined by the flame temperature requirements for each region: the core region along the flame trajectory y < 0.5 Lf (Region 1), the immediate vicinity surrounding the core y < 0.5 Lf (Region 2), and the downstream region y > 0.5 Lf (Region 3). These flame regions are illustrated in Figure 3.
In region 1, the relationship between the required processing temperature and the processing range is calculated using Equation (4) [12].
T max T T max T c l = 1 300 · ( d r y + 0.55 L f ) 2 y = 0.275 L f | 0.275 L f y |
where Tcl is the centerline temperature, T is the required processing temperature, and dr is the template processing range.
In region 2, the relationship between the required processing temperature and the processing range is calculated according to Equation (5) [12].
T T a i r 2 T max T c l T a i r = exp [ 22.5 ( d r y + 0.125 L f ) 2 ]
In region 3, the relationship between the required processing temperature and the processing range is determined by Equation (6) [12].
T T a i r T c l T a i r = exp [ 85 ( d r y + 0.5 L f ) 2 ]
Based on the aforementioned considerations, the procedure for establishing the processing range involves calculating the centerline temperature and length of flame jets using Equations (2) and (3). Subsequently, the distance from the nozzle of the flame jet torch to the glass surface and the required processing temperature are determined to ascertain the current operational zone of the oxy-hydrogen flame jet. This facilitates the selection of appropriate models for calculating the processing range.

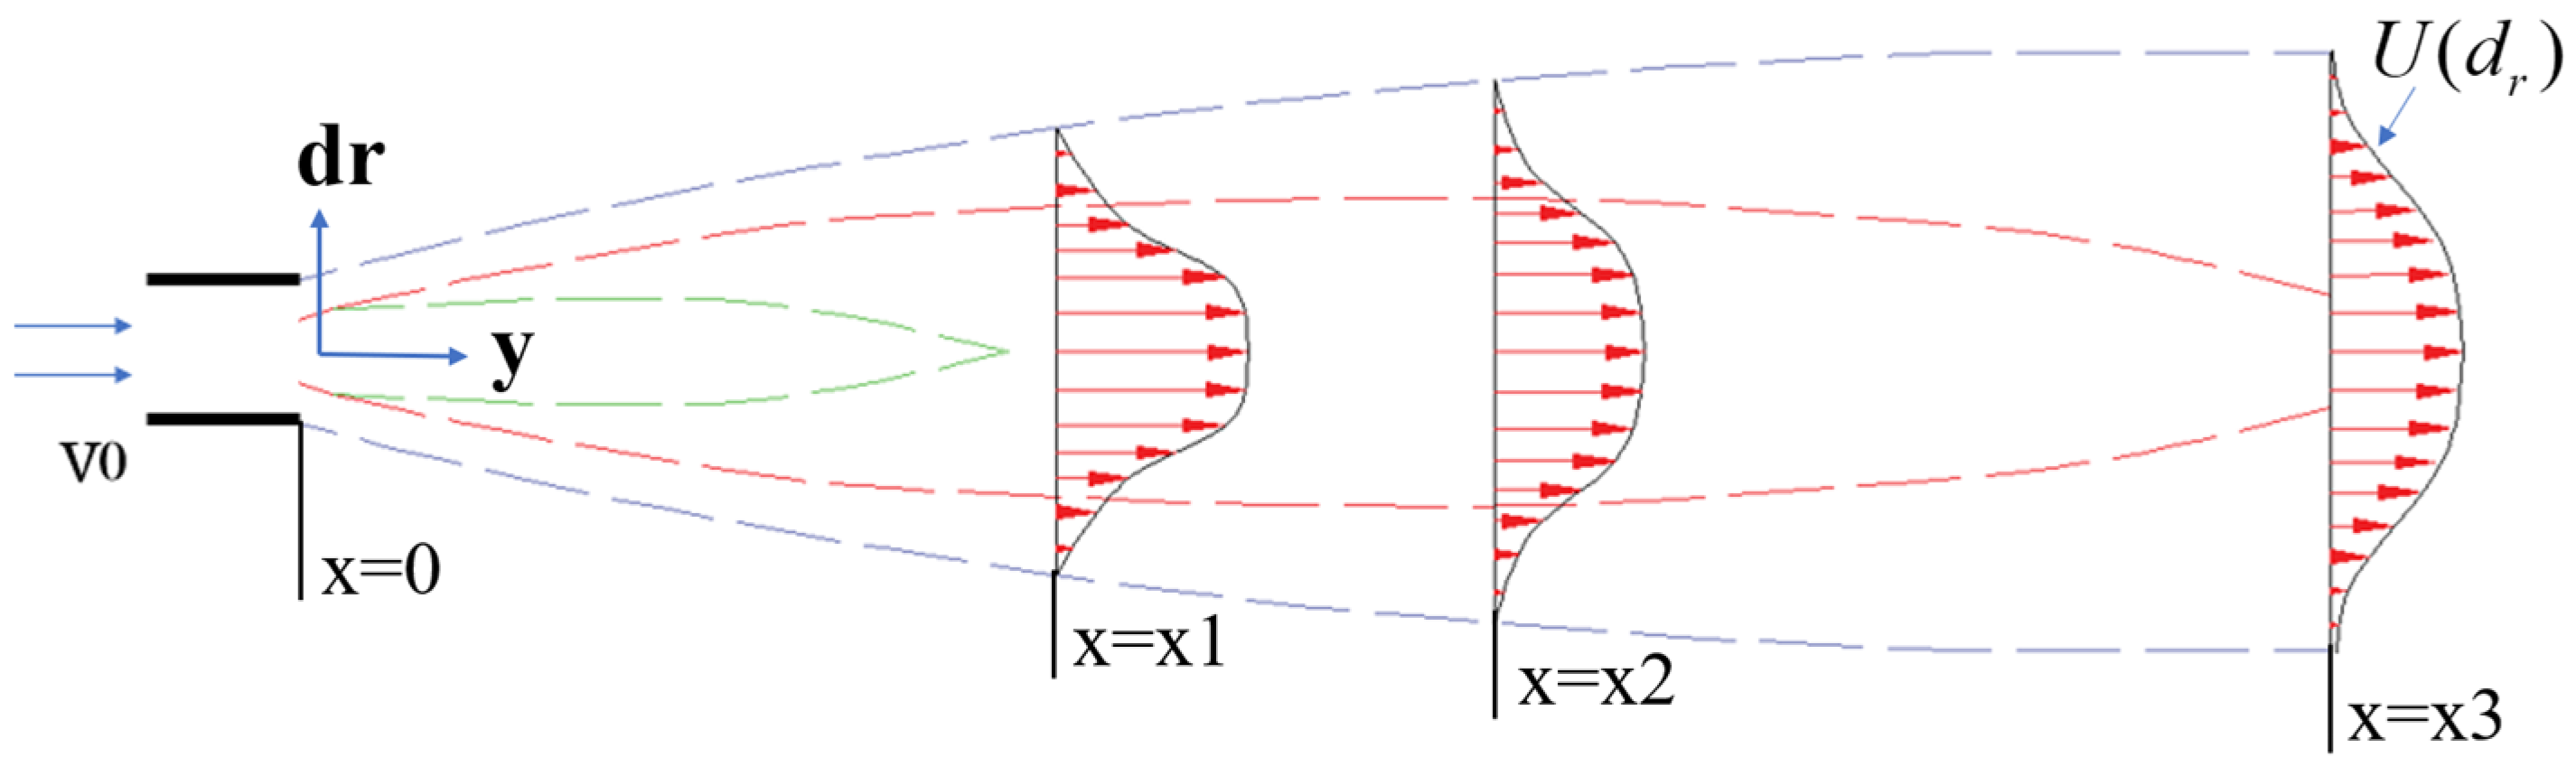
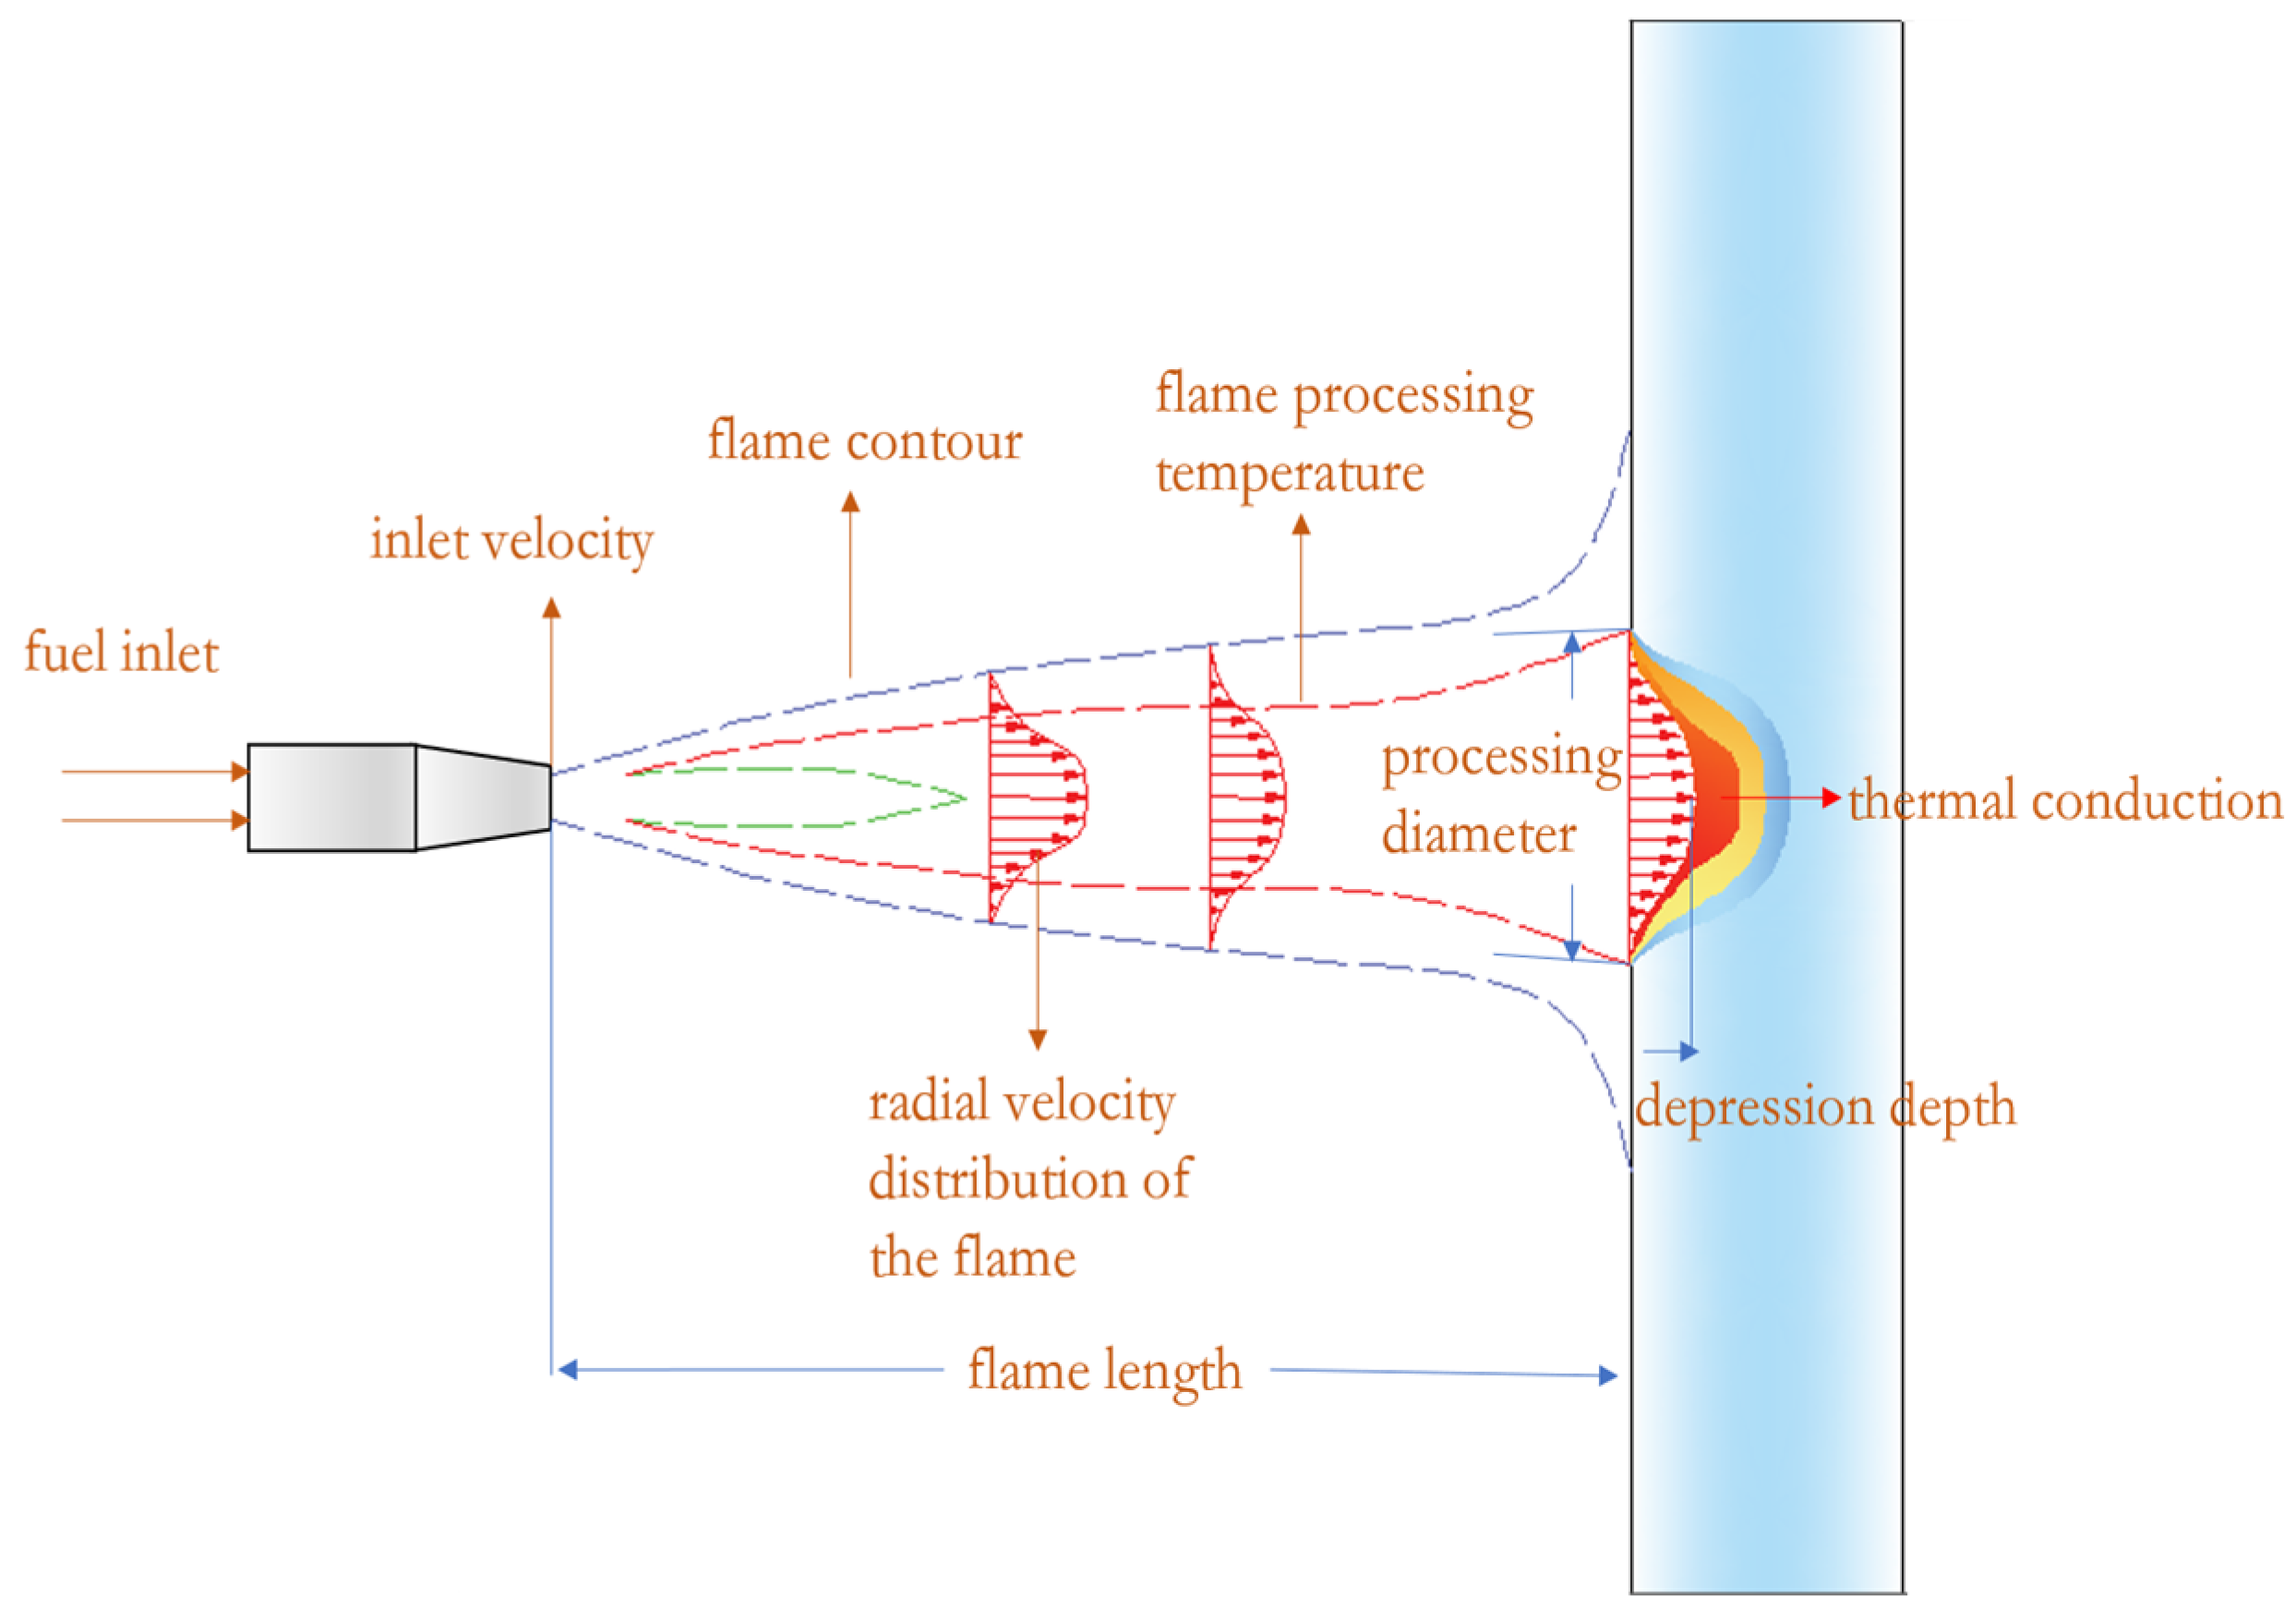
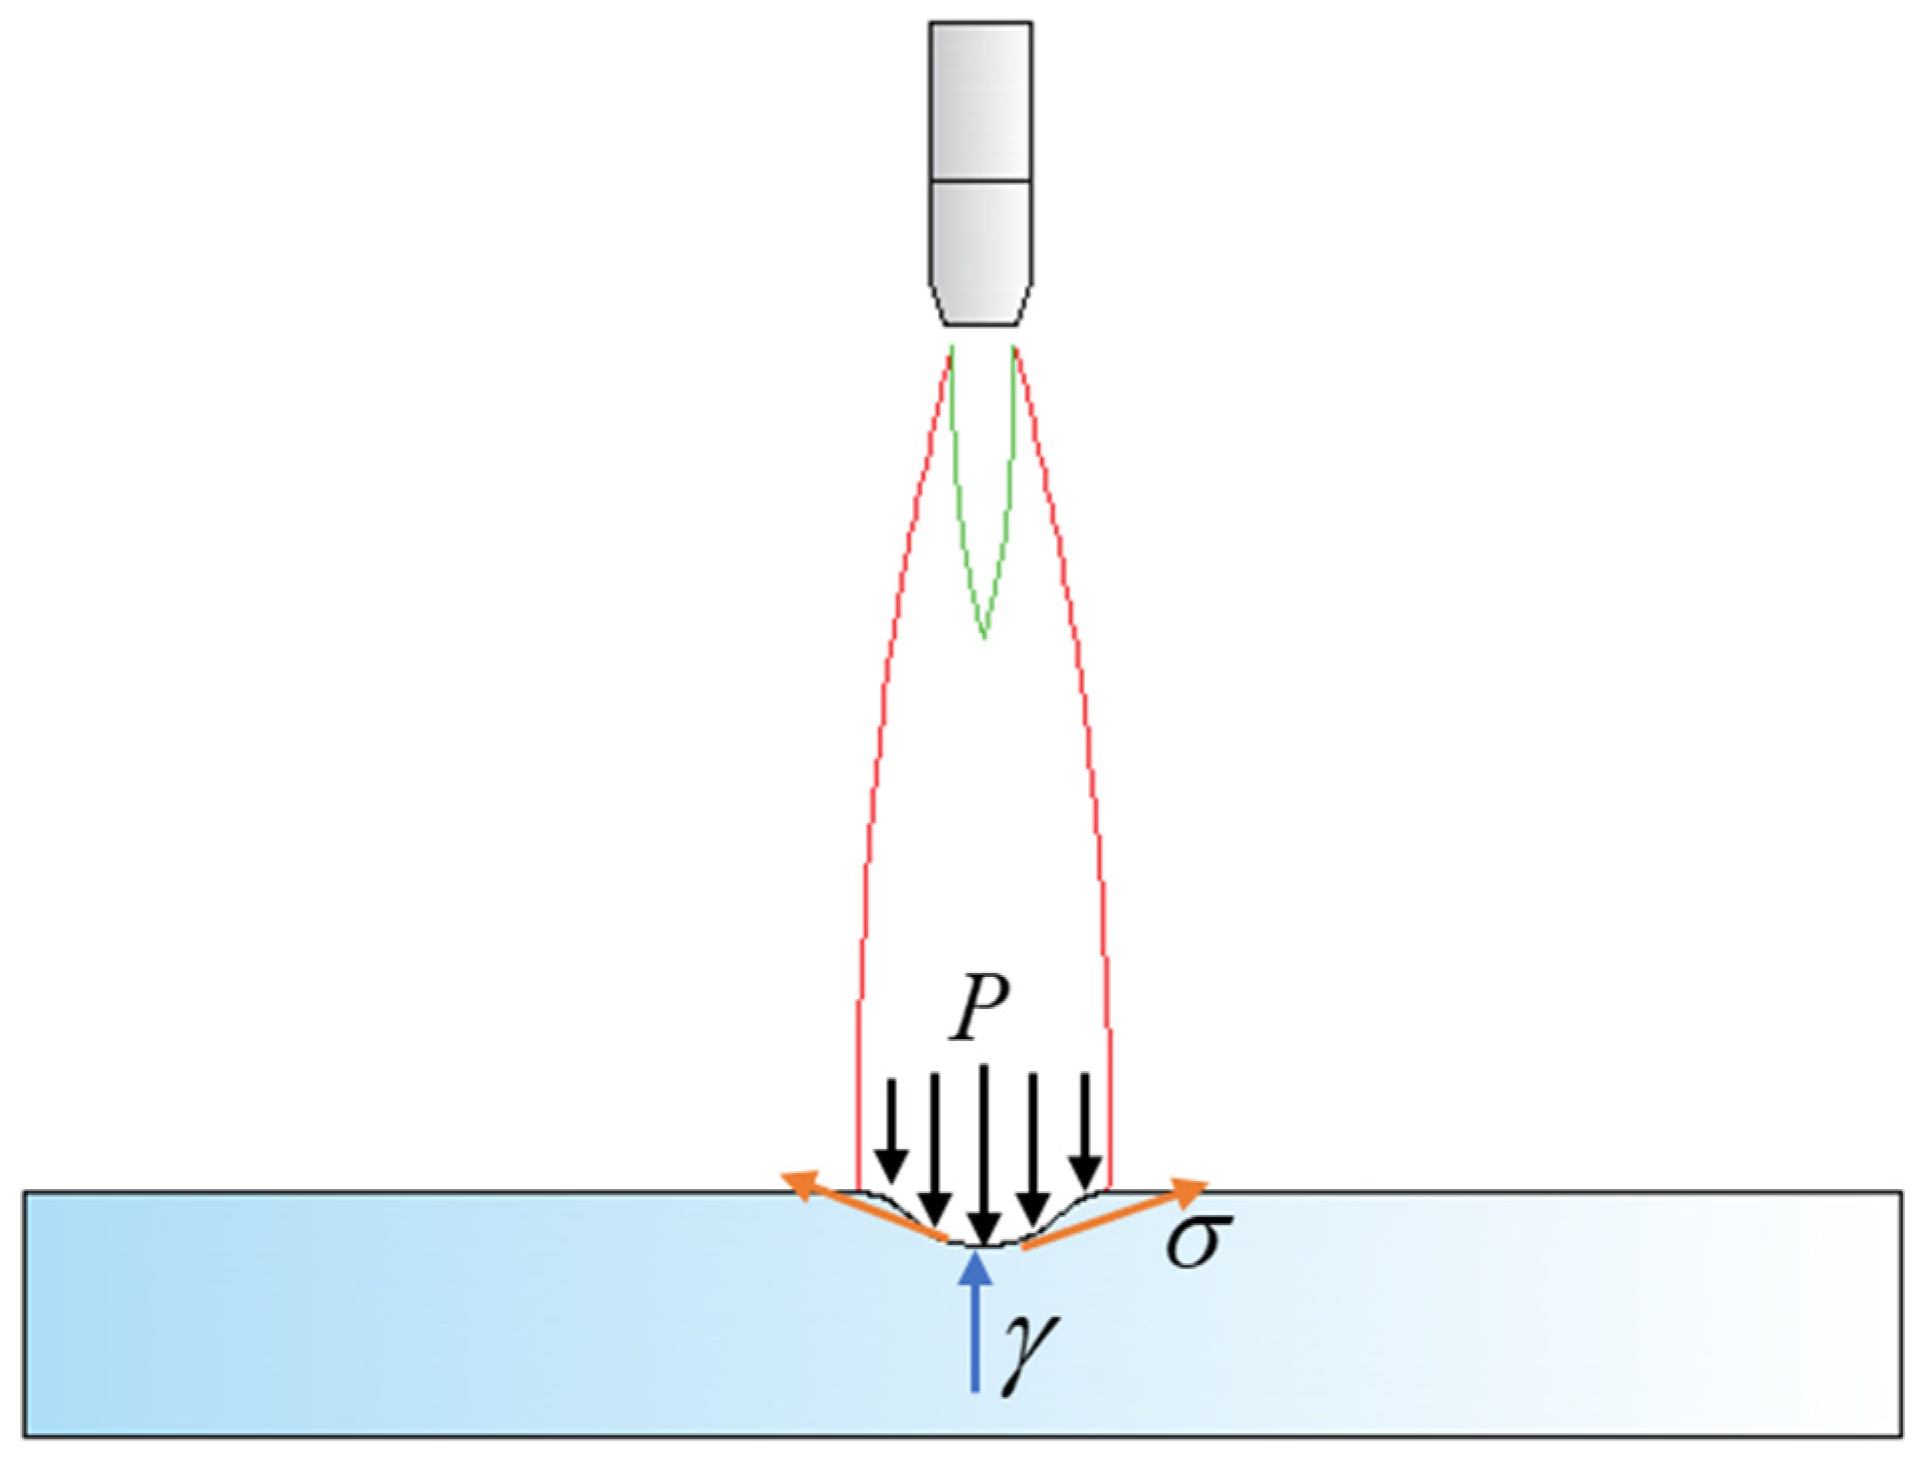
2.3. Establishment of the Theoretical Model

The kinetic energy carried by flame jets impacts softened regions of glass at elevated temperatures, resulting in the deformation of the glass material. Therefore, elucidating the morphological changes at concave regions of glass materials under oxy-hydrogen flame-jet impact critically depends on comprehending the momentum characteristics of the flame jets. According to Newton’s First Law, a rigorous investigation into the momentum of flame jets necessitates a thorough analysis of their velocity characteristics. In this study, radial velocity distribution is chosen as the primary focus for velocity characterization. The radial velocity distribution of flame jets exhibits a Gaussian profile [24], as depicted in Figure 4.
Based on the calculated processing range of the flame jets, the radial velocity distribution of the flame jets acting on the processed glass surface is determined using Equation (7) [25].
U ( d r ) = U 0 · 50 · d 0 y · ( p a i r p 0 ) 1 / 2 · exp [ d r 2 25 ]
where U0 is the inlet velocity at the nozzle, d0 is the nozzle diameter, and y is the axial distance. dr represents the processing range; its unit is mm.
Upon acquiring velocity data, the momentum distribution of the flame jets can be calculated using the obtained velocity information, as specified in Equation (8) [26].
M = 0.8 · ( U ( d r ) · d 0 ) 2 · p g
The radial density distribution of the flame jets, represented as pg, follows a Gaussian distribution [18]. This phenomenon stems from variations in combustion intensity within different regions of the flame and convective interactions with ambient air during the combustion process. Specifically, the high temperature of the flame makes the surrounding air light and expand, causing its density to decrease and rise while the cool air flows downward, forming a convection cycle. It is this convection cycle that changes the gas density inside the flame.
The radial density of the flame jets can be computed using Equation (9) [18]. Since this study uses flame jets, air has little effect on the flame, so the effect of air density on flame density is ignored.
p ( x ) = p c l exp 2 [ y 5 · d r ]
where pcl represents the centerline density.
For the centerline density, it can be determined using the principle of mass conservation, as depicted by Equation (10).
A 0 p 0 U 0 = A c l p c l U c l
Here, p0 represents the inlet gas density, and U0 denotes the exit velocity. Since we are interested in the density at the centerline, where the cross-sectional areas (A0 and Acl) can be approximated as equal, the final centerline density can be expressed using Equation (11).
p 0 U 0 U c l = p c l
Therefore, upon obtaining the aforementioned parameters, the momentum of the flame jets can be computed. Subsequently, the radial depth distribution during the processing can be determined by solving the fluid momentum–depth relationship equation. This relationship is based on the momentum–depth equation derived by Banks et al. [27], as presented in Equation (12) [26].
M p l g y 3 = π 2 k 2 · h y · ( 1 + h y ) 2
where k represents a constant, h denotes the processing depth, and pl is the density of the processed glass material. g represents neutral acceleration, and this article uses the value 9.81 N/kg.
As indicated by Equation (12), the density of the glass material significantly influences the depth of the indentations formed upon impact. For glass materials, which are amorphous solids lacking an ordered crystalline structure, the molecular vibrations increase with rising temperatures, leading to changes in volume and, consequently, variations in density. Therefore, to accurately derive the relationship between momentum and depth, it is crucial to understand the effect of temperature on the density of glass. The relationship between glass density and temperature can be expressed by Equation (13) [28].
p ( T ) = i 0 / ( 1 + w · ( T T 0 ) )
where w is the thermal expansion coefficient of silicate glass, which is taken as 3.3 × 10⁻⁶ K−1 in this study. T is the current flame temperature. i0 is the density of glass at room temperature.
During the flame jet processing of glass materials, the depth of indentations in the glass changes over time. These depth variations lead to changes in surface temperature, which in turn affect the density of the glass material. Consequently, it is necessary to determine the variation of glass density with depth. This study uses flame-zone three for processing, so substituting Equation (6) into Equation (13) can obtain the equation for calculating the specific depth density, as given by Equation (14).
p ( T ) = i 0 · ( 1 w · ( T ( y + h ) T 0 ) )
where y represents the height of the flame spray gun nozzle from the glass surface and h represents the processing depth. Both units are mm. According to Equation (12), once the glass material density reaches a critical condition (the flame temperature is lower than the glass softening temperature of the glass), the impact of the flame jets will no longer cause deformation of the glass material. Therefore, combining the above theoretical derivations, the relationship between the depth of surface indentation in glass material after flame-jet impact and the inlet velocity of the flame jets can be derived.
y · p c l · U 0 2 · k 2 · i 0 2 = h · ( 1 + h y ) 2 1 T ( y + h )
U0 represents the inlet velocity of the flame jets, h denotes the processing depth, y is the initial distance from the nozzle of the oxy-hydrogen flame jet torch to the glass surface, and k is a constant. For this study, an initial chosen value of k is 1.98. This value is obtained by preliminary calculation and will be further optimized based on experimental results.
Based on the above theoretical derivations, the overall processing mechanism of glass materials under flame jets can be elucidated, as depicted in Figure 5.
To enrich the processing mechanism and ensure precision and controllability in the processing procedure, this study employs Equation (15) as the theoretical model. By fixing the flame-nozzle diameter and the initial distance from the nozzle to the glass surface and varying the inlet velocity of the flame jets, using a combination of simulation and experimental methods, we conduct an in-depth analysis of the relationship between the inlet velocity of the flame jets and the indentation depth on the glass surface after processing. The accuracy of the model’s predictions is then validated against the experimental results.

3. Numerical Methodology

Since the accuracy of the established theoretical model in predicting the relationship trends between the studied variables has not been validated, it cannot provide direct theoretical guidance for subsequent experiments. To address this issue, this study employs numerical simulation methods using the commercial simulation software FLUENT 2022R1 to verify the accuracy of the model’s predicted trends. This will provide guidance for future experiments.

3.1. Selection of Simulation Parameters

It is essential to determine the simulation parameters. These parameters not only establish the boundary conditions for the simulation model but also directly affect the outcomes of the simulation experiments. This study involves four key parameters: the distance from the nozzle to the glass surface, the glass thickness, the inlet gas velocity at the nozzle, and the nozzle diameter.
The selection of the distance from the nozzle to the glass surface is crucial; too far will result in insufficient temperature, failing to produce noticeable processing effects, while too close may cause excessive deformation of the glass.
For the inlet gas velocity and nozzle diameter, this study selected parameters based on the characteristics of the flame jets and the results of theoretical model analysis. The reliability of the parameters is proved through preliminary simulation experiments. Adjusting the inlet gas velocity of the flame jets, the relationship between the deformation of glass during processing and the inlet velocity was observed. The simulation experiments comprised nine test groups, with the inlet jet parameters detailed in Table 1.

3.2. Establishment of the Simulation Models

The establishment of the simulation model directly determines the accuracy of the final simulation results. In this study, the simulation inlet gas source consists of a mixture of 66% hydrogen and 34% oxygen (mass percent), with an inlet diameter of 0.5 mm. Given the high-temperature characteristics involved, the processing material selected is high borosilicate glass. High borosilicate glass exhibits an extremely low coefficient of thermal expansion and can withstand rapid temperature changes up to 200 degrees, making it highly suitable for the requirements of this study. Its physical and chemical properties are detailed in Table 2. Combining the adopted simulation parameters, the simulation model for this study was ultimately established. Table 3 shows the chemical composition of high borosilicate glass. In order to better characterize the deformation state, the simulation adopts a three-dimensional simulation. The grid size is 0.48 mm, and the total number of simulation units is 813,802, the simulation adopts steady-state simulation to obtain the maximum deformation state of the glass, and the simulation step length is 1000; the combustion is simulated using the component transport model, and the energy equation is turned on. The turbulence model uses the k-w equation. After obtaining the pressure field and temperature field of the glass surface in FLUENT, the indentation data of the glass surface is obtained by fluid–solid coupling.

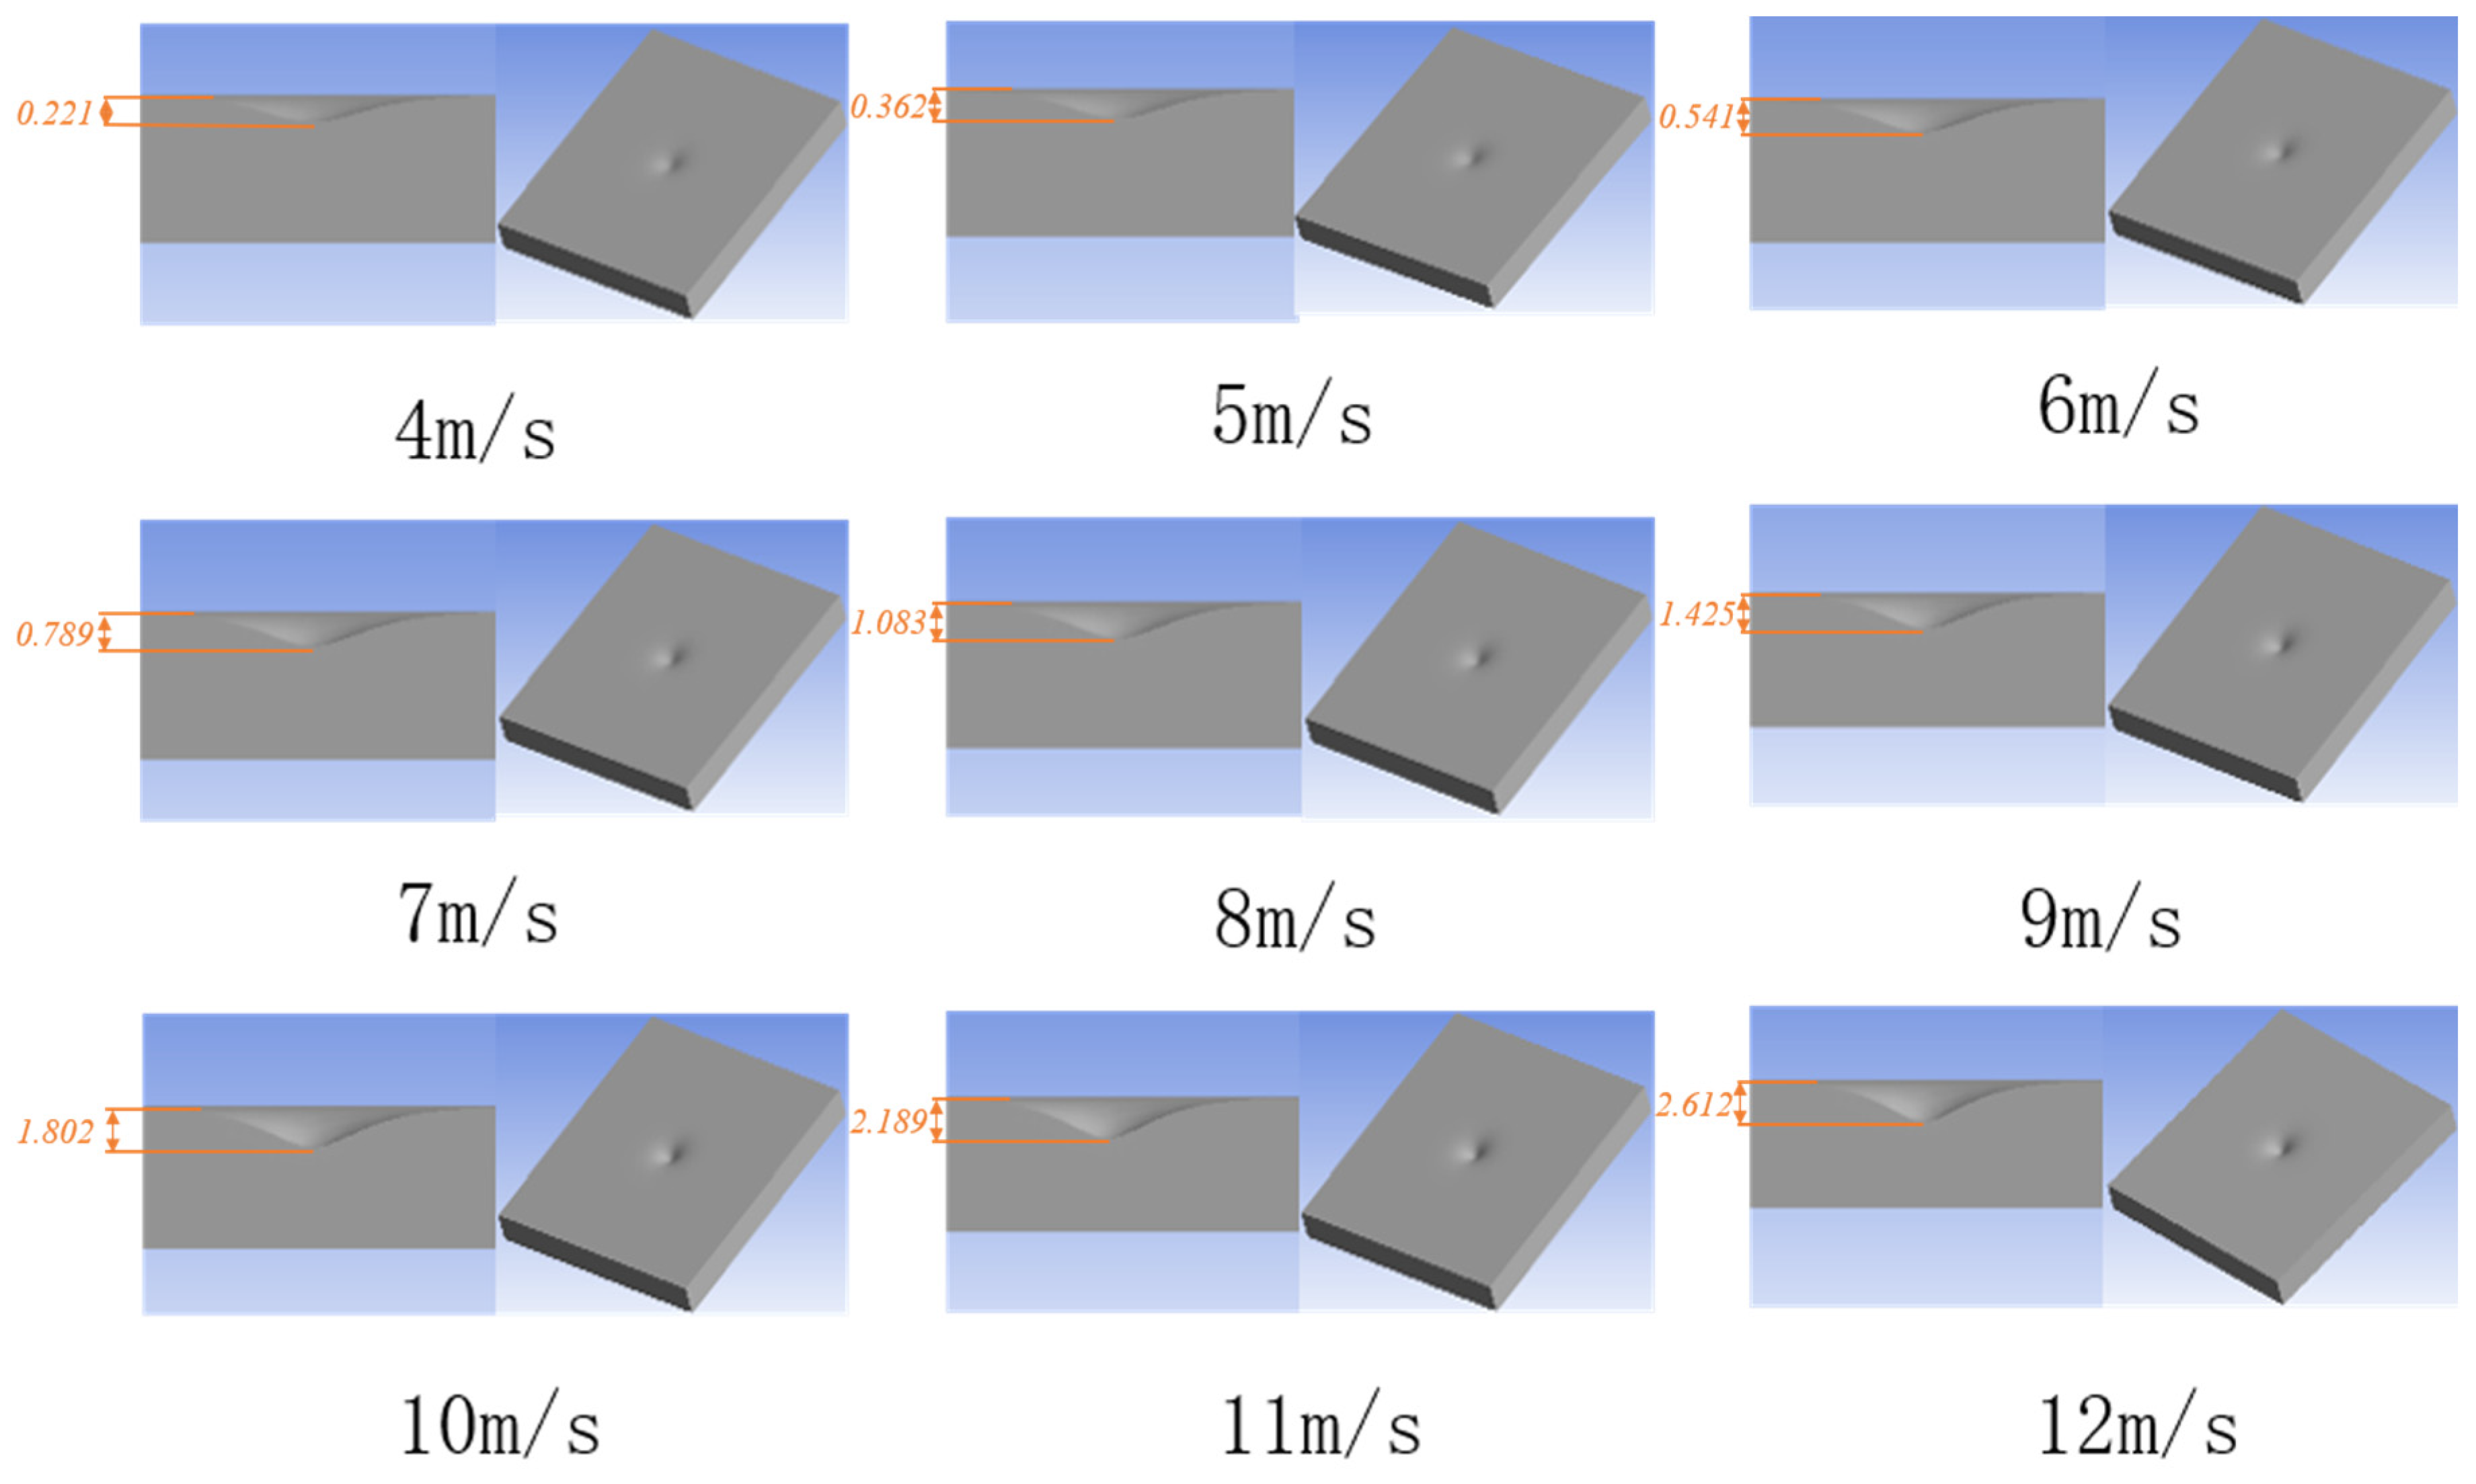
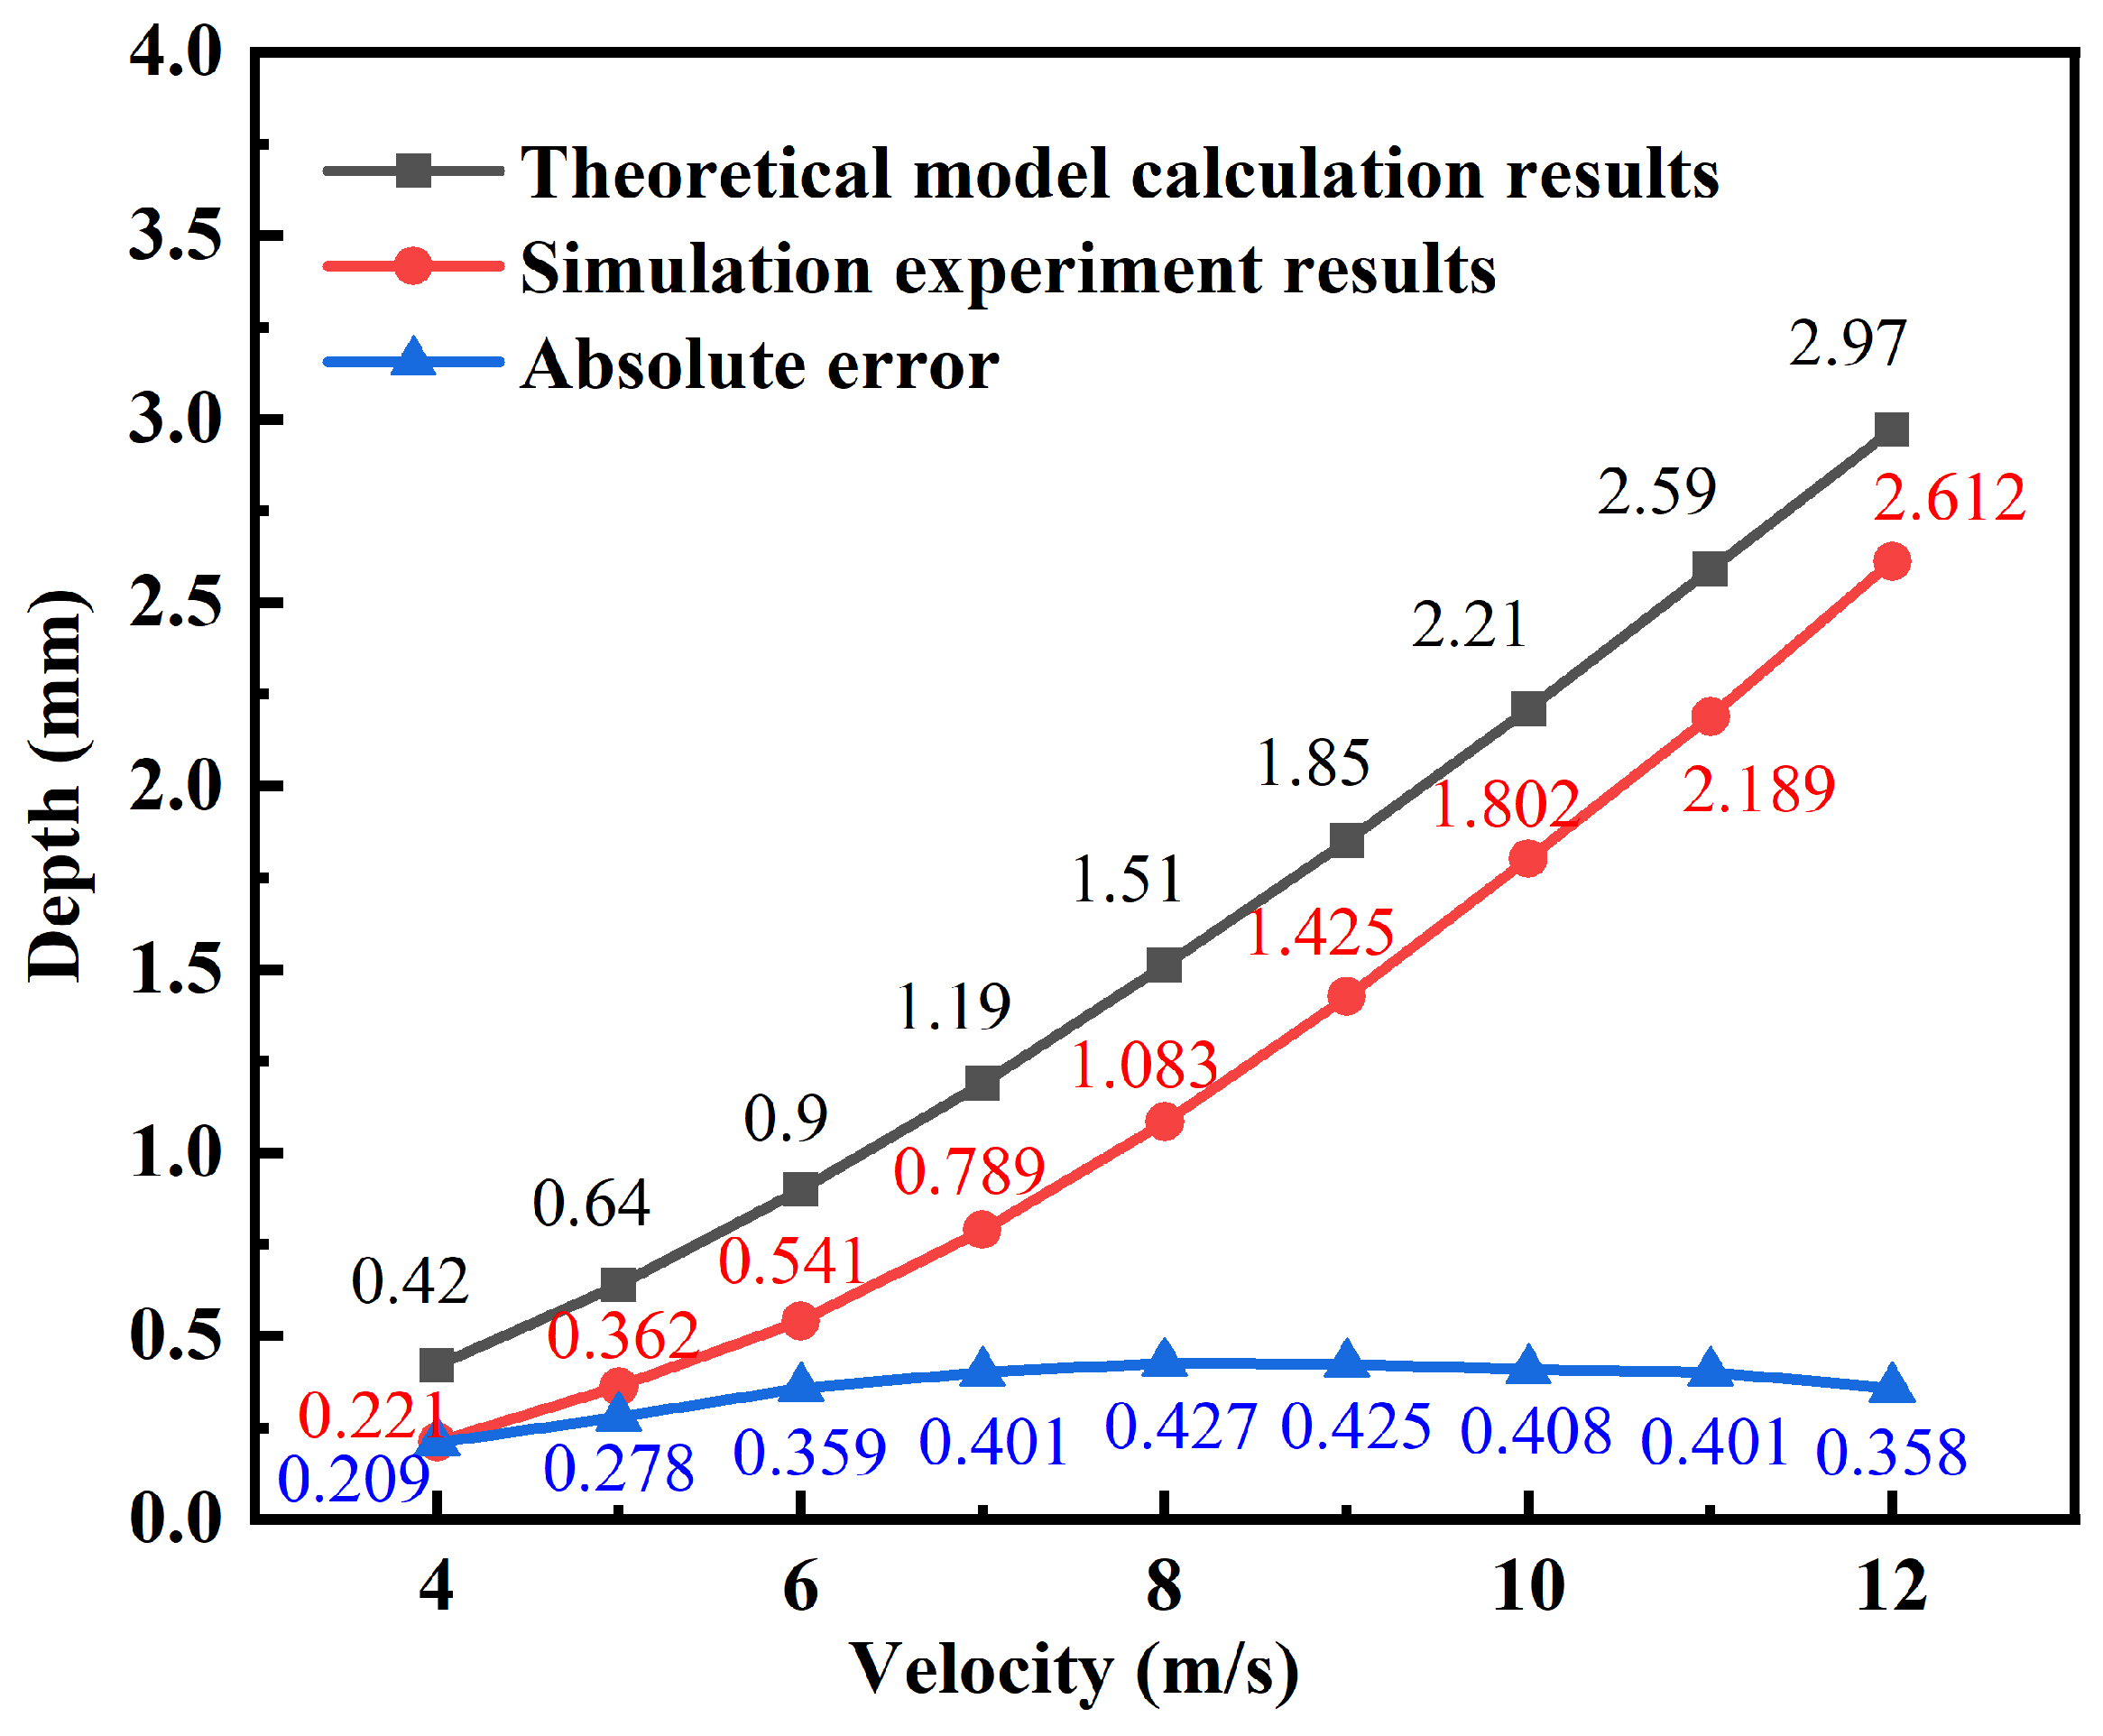
3.3. Analysis of the Simulation Results

The simulation results are shown in Figure 6; the comparison between the simulated data and the results derived from the established mathematical model demonstrates a consistent relationship: the depth of concavity in glass, post-impact by flame jets, shows a direct proportionality to the inlet velocity of these flames. This alignment underscores the theoretical model’s capacity to accurately predict trends observed in the simulation data. As such, these findings substantiate the theoretical model’s predictive accuracy and provide a guiding framework for subsequent experimental validation of the model. The numerical comparison between simulated data and theoretical model calculations is illustrated in Figure 7. At the same time, we observed that when the temperature is lower than 1220 °C, the indentation depth on the glass surface no longer changes. Therefore, we can determine that the critical processing temperature is 1220 °C.

4. Experiment

Due to the constraints of simulation calculations, the simulated results can only elucidate the accuracy of the relationship trends between the inlet velocity of flame jets as predicted by the theoretical model and the resulting concave morphology on the surface of processed glass. However, they cannot validate the precision of the model’s computational outcomes. Therefore, this study conducted multiple experiments using a surface profilometer (Taylor Hobson PGI from Guangzhou, China) to measure the concave morphology of glass material following exposure to flame jets. Using a surface profilometer (Taylor Hobson PGI), precise measurements of the concave depth were obtained, and these values were compared with the calculated results from the theoretical model. Based on discrepancies between experimental outcomes and theoretical model calculations, adjustments were made to the model. To ensure consistency between experiments and simulations, identical experimental parameters and material selections were employed as in the simulation experiments.

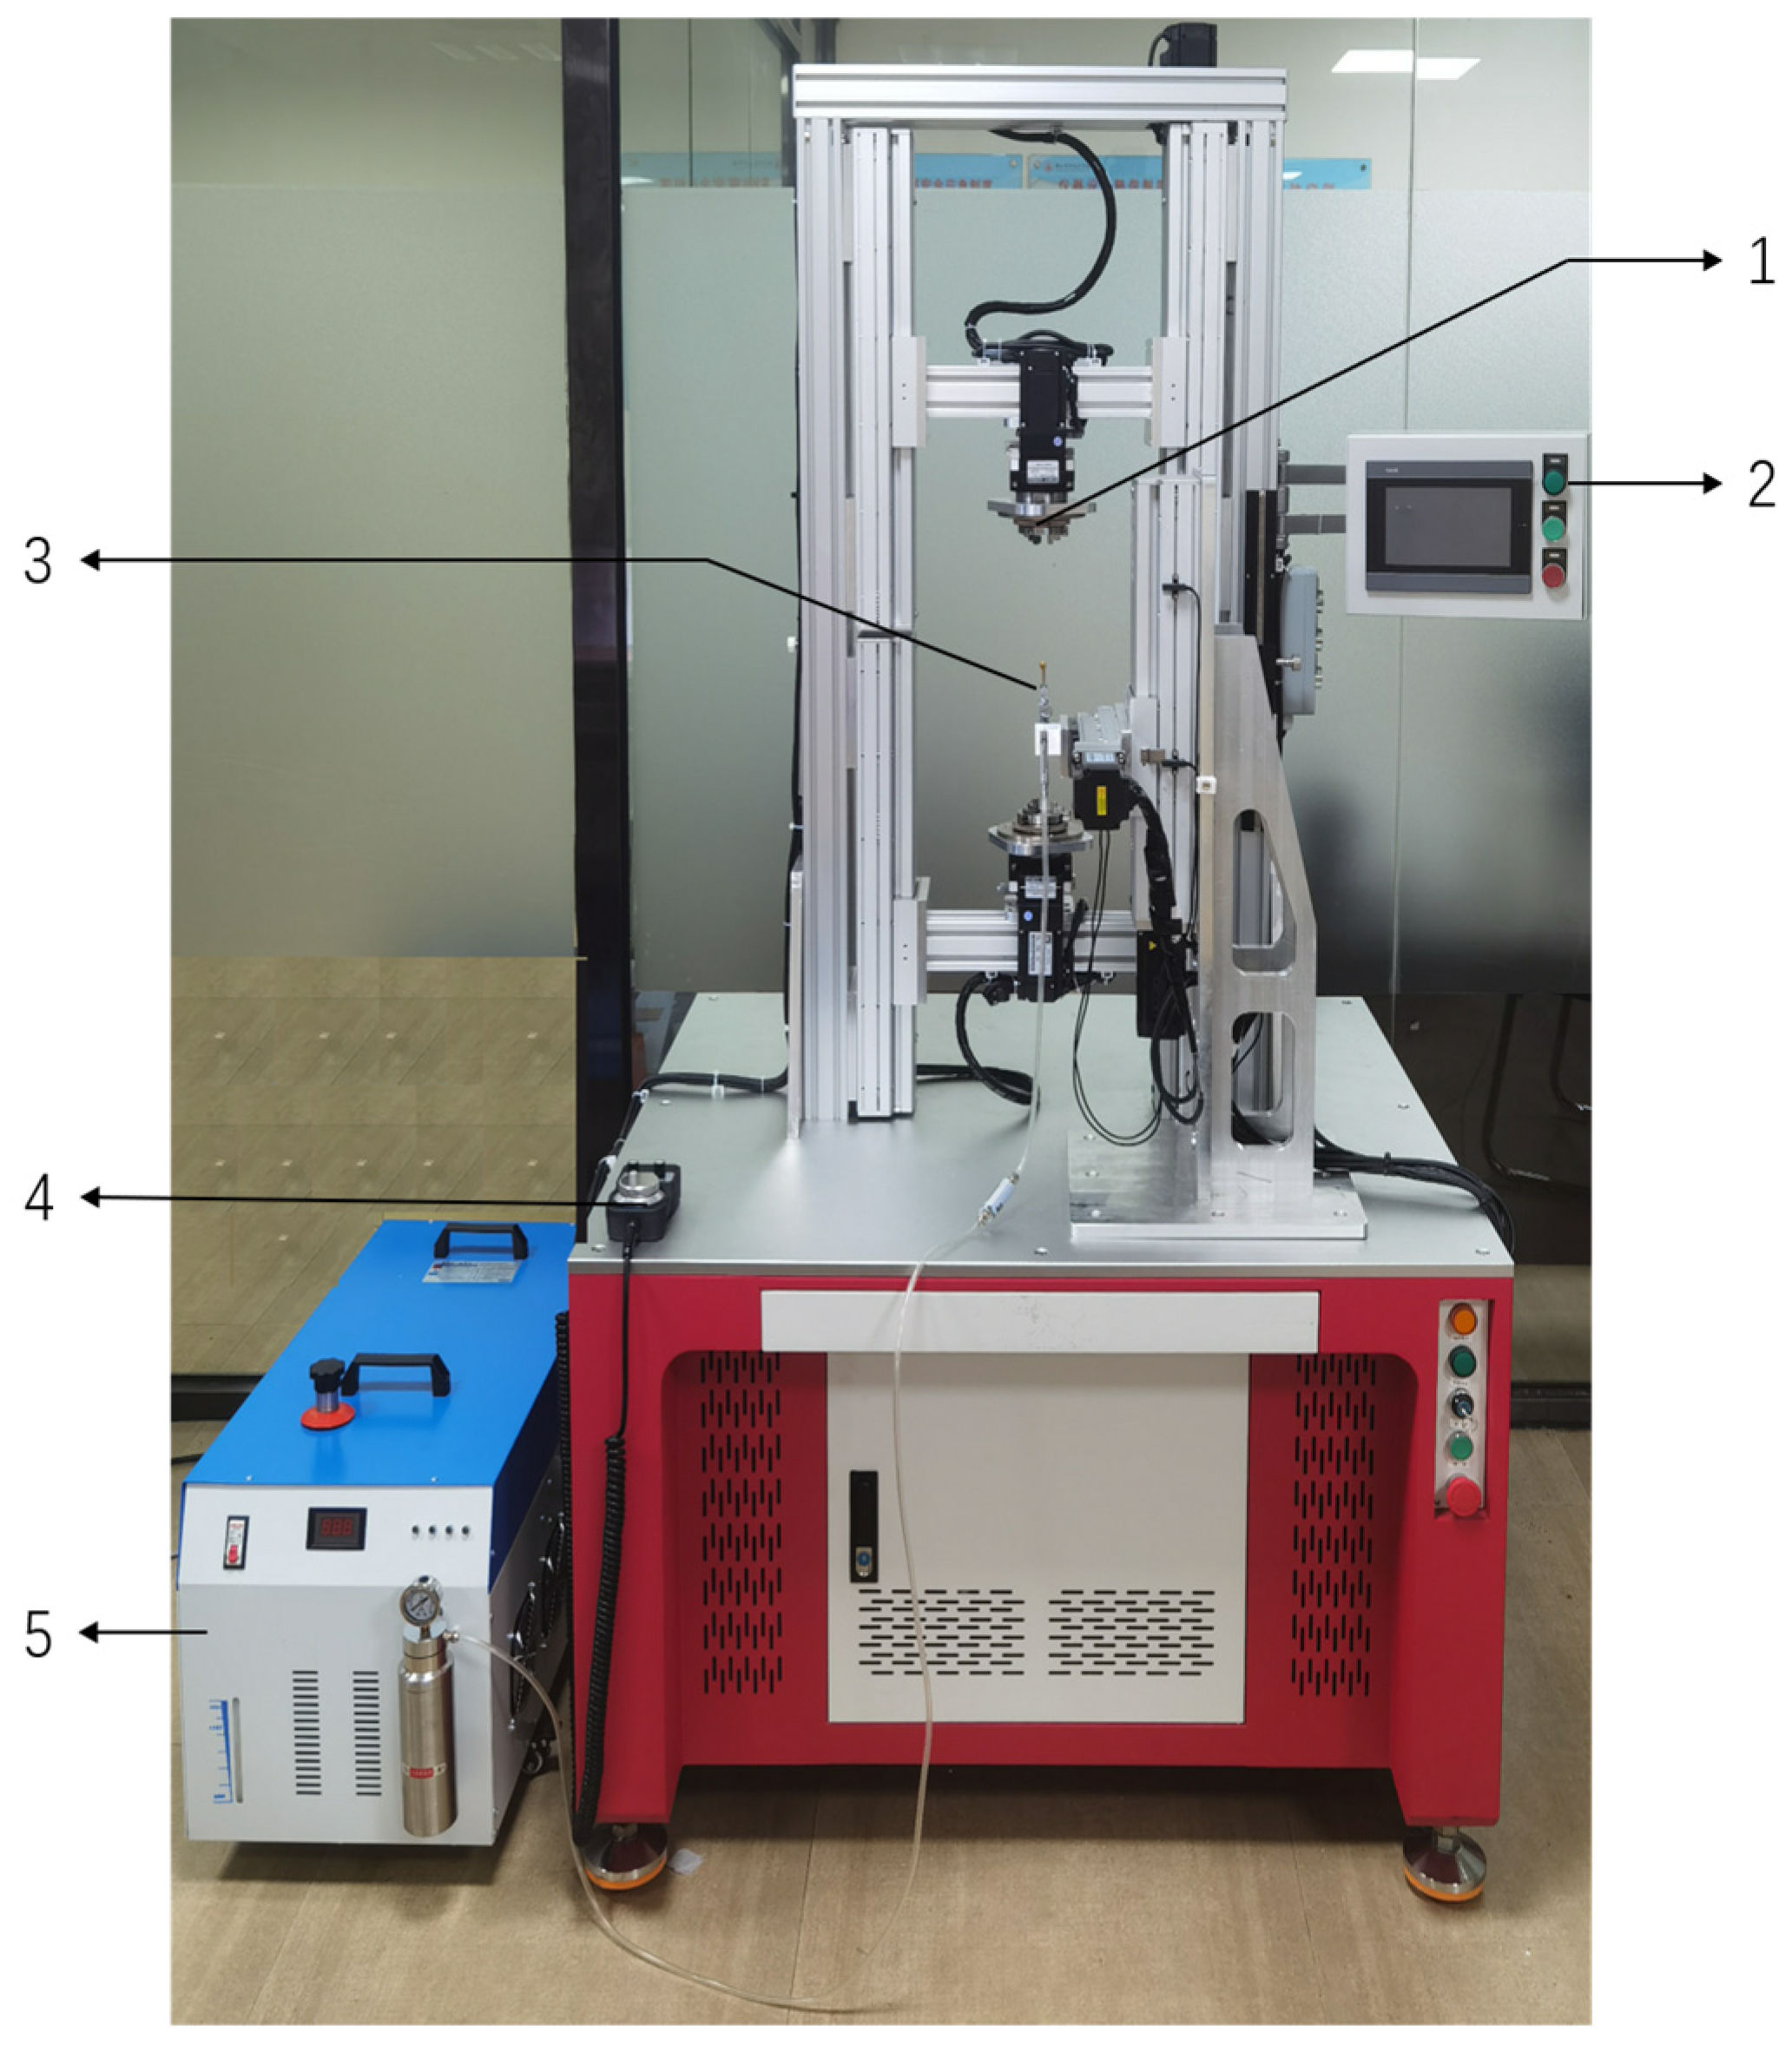
4.1. Experimental Setup

The processing equipment used in this experiment is shown in Figure 8. Prior to conducting the experiments, adjustments were made to the position of the nozzle axis and the horizontal distance from the nozzle orifice to the glass surface using a precision three-axis movable platform with an accuracy of 0.01 mm in order to achieve the desired experimental position.
During the experimental process, a hydrogen–oxygen flame generator continuously and stably electrolyzed water into a mixed gas of hydrogen and oxygen. Upon ignition at the nozzle outlet of the flame gun, a concentrated high-temperature oxy-hydrogen flame jet was formed. The nozzle flow velocity was adjusted using a nozzle flow rate adjustment device, and the gas flow rate was monitored at the mass flow meter to calculate the gas velocity. Finally, the oxy-hydrogen flame jet was directed at the center of the glass surface using the flame gun, while the experimental glass was securely fixed in a movable fixture adjustable in the X and Y directions. After processing, annealing was conducted in a muffle furnace to relieve internal stresses induced by processing and prevent glass breakage. At the same time, the experimental parameters are consistent with the simulation to ensure the rigor of the experimental process.

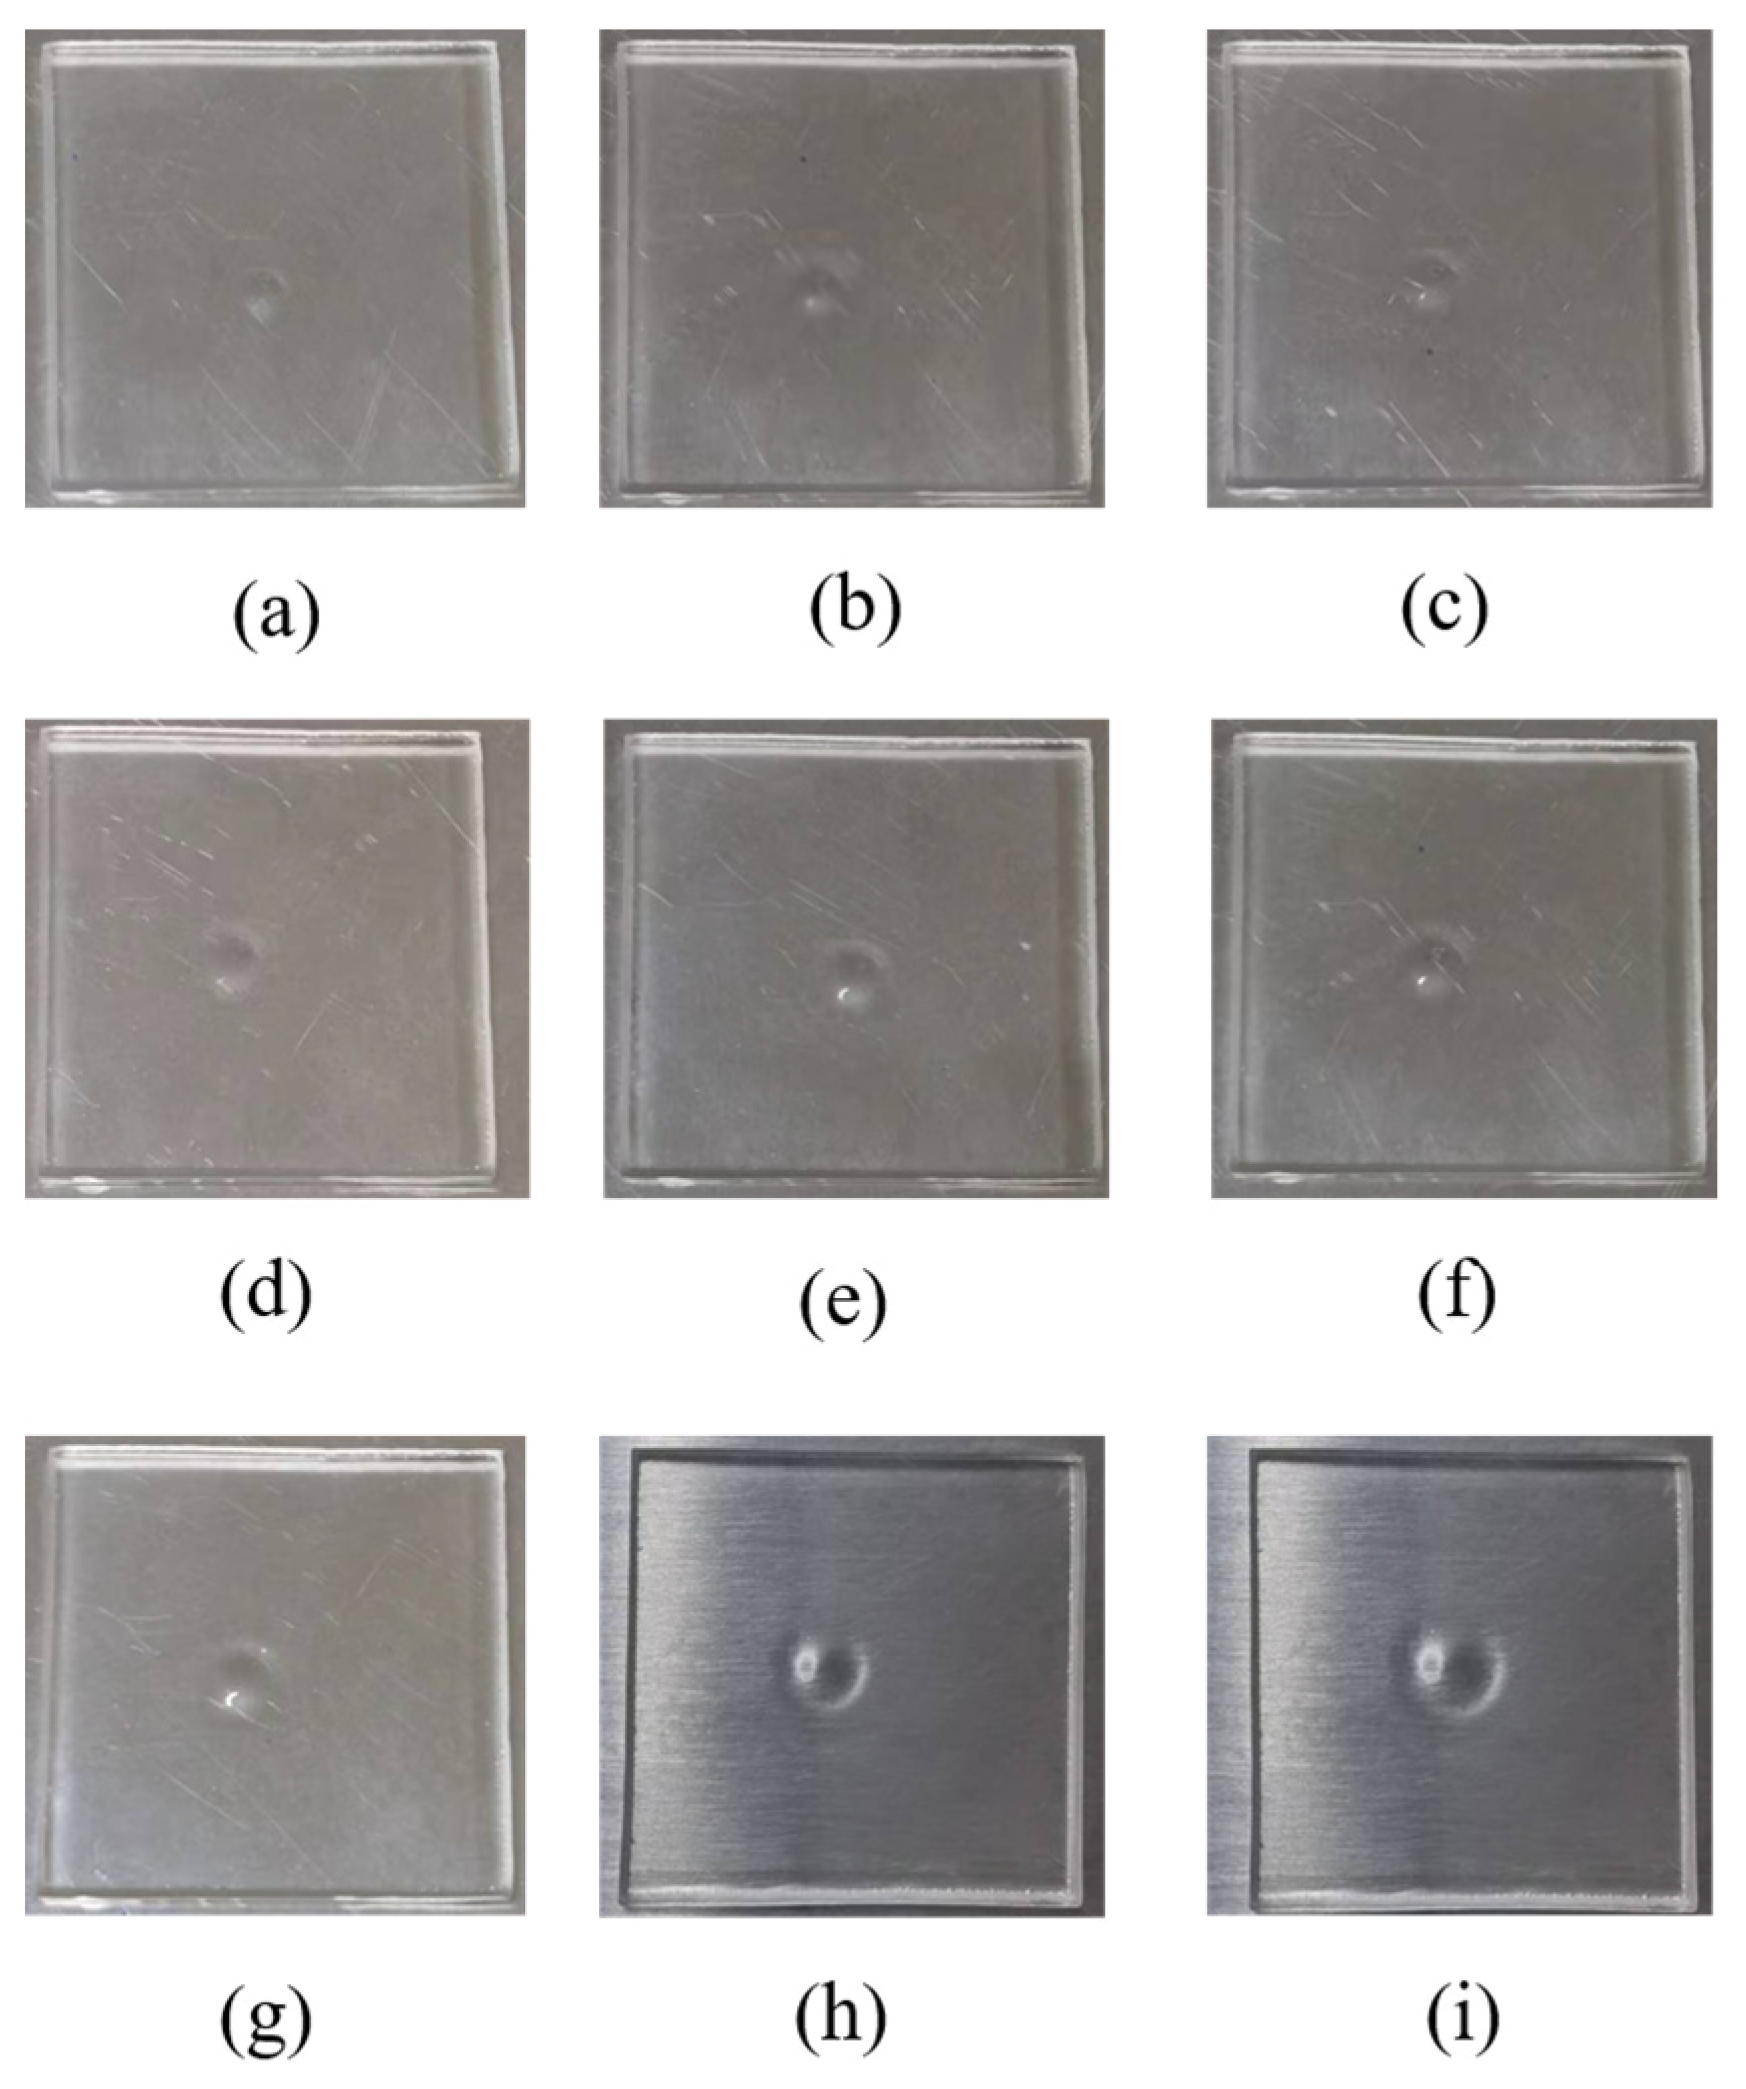
4.2. Measurement Methods for Experimental Results

After annealing the experimental glass until it reached room temperature, surface shape data were obtained using a surface profilometer (Taylor Hobson PGI), and measurements of the maximum depth of concavities were recorded.

5. Discussion

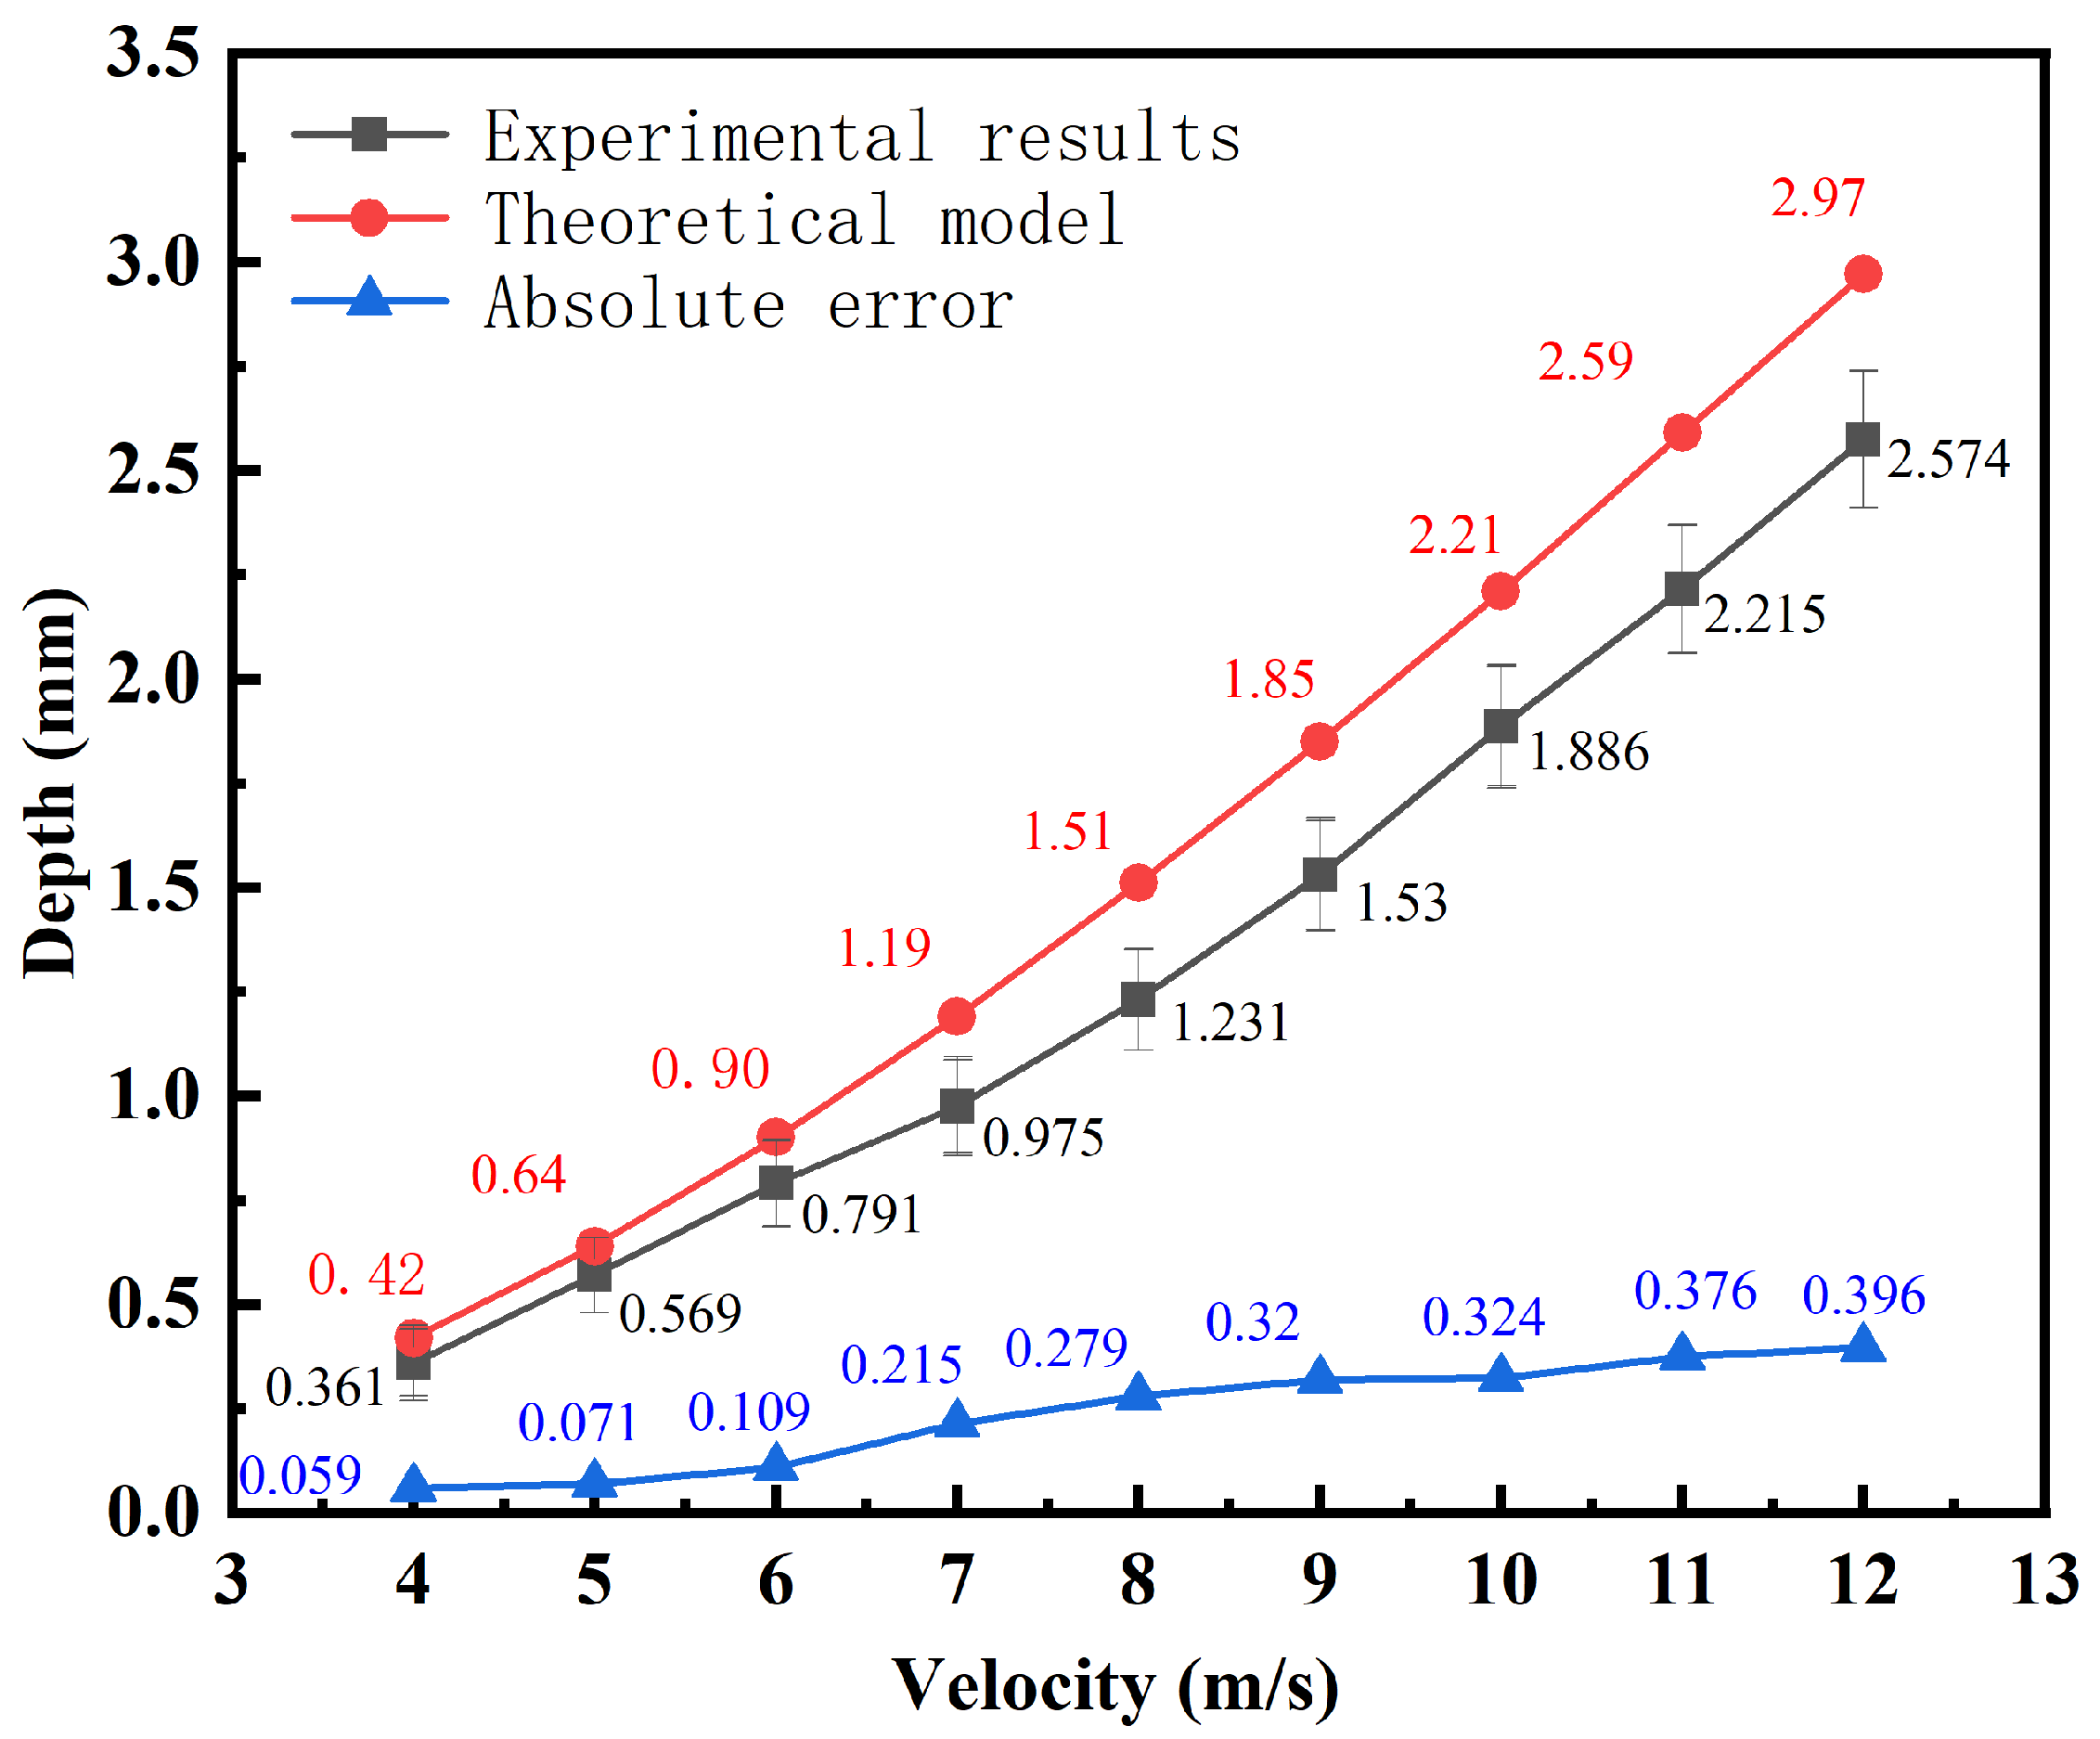
5.1. Discussion of Experimental Results

In this study, the experimental parameters were selected to align with those utilized in the simulation models. Post-impact of the flame jet on the glass material, the resultant full-surface deformations were meticulously photographed and measured. Figure 9 and Figure 10, respectively, illustrate the experimental outcomes obtained under nine distinct sets of parameters. Figure 9 presents the outcomes of nine distinct experimental configurations. Utilizing a surface profilometer (Taylor Hobson PGI), which has a measurement error that varies from 0.6% to 0.15% ± 3 μm, we ensured the accuracy of our experimental data. To mitigate the impact of measurement errors, each experimental condition was replicated a minimum of three times. The data sets were then consolidated, with the final results reflecting the mean values derived from these triplicate measurements. Figure 10 displays the experimental measurements captured by the surface profilometer, offering a detailed account of the surface topography.
The experimental data procured via the surface profilometer evince a direct correlation between the depression depth within the processing area and the escalation of the inlet velocity of the flame jet. Delving into the interaction dynamics between the flame jet and the glass substrate, it becomes evident that an augmented inlet velocity engenders an elevated transfer of thermal energy and momentum. Consequently, this intensification precipitates more pronounced variations in density and an increase in dynamic pressure at the processing locale. These combined effects culminate in the formation of a significantly deeper depression, underscoring the pivotal role of the flame jet’s velocity in shaping the glass material.
Upon juxtaposing the experimental outcomes with the numerical values obtained from the theoretical model, the discrepancies between the two datasets were ascertained, as depicted in Figure 11. Figure 11 delineates that the maximum absolute error attains a value of 0.396 mm, the minimum is recorded at 0.059 mm, and the average error is calculated to be 0.239 mm. These observations suggest a notable divergence between the empirical data and the model’s prognostications, with the variance escalating in tandem with the increment of the flame jet inlet velocity. Analysis shows that when the glass temperature exceeds the softening point, its surface tension becomes more significant, which has a greater impact on the flow and deformation of the material. As the flame jet velocity increases, the heat input increases, the softening of the glass deepens, and the surface tension-driven flow behavior becomes more complex. This complexity leads to increased model prediction errors.

5.2. Improved Model for Incorporating Surface Tension

Upon meticulous examination of the theoretical model’s computational outcomes for concave depth, it was observed that these results were consistently in excess of experimental observations. Such a discrepancy underscores the necessity for further refinement of the theoretical model, especially considering the complexities inherent in the flame jet forming process. This process involves the interaction of high-pressure, high-temperature gas streams with a dissimilar fluid, such as glass. A more nuanced analysis of the force equilibrium during the flame jet’s impact on the glass is imperative. This involves a detailed assessment of how the high-pressure, high-temperature gas flow interacts with the glass melt pool as the flame jet forms. Post-impact analysis of the concave regions on the glass surface by the flame jet reveals a sequence of events: the continuous impingement of the flame jet on the glass surface leads to localized heating and subsequent liquefaction. Upon liquefaction, internal hydrostatic pressure and surface tension act together to resist the surface deformation caused by the dynamic pressure of the flame jets. Upon reaching processing boundary conditions, a dynamic equilibrium is established at the concave regions. The force analysis at these sites is illustrated in Figure 12. However, Equation (15) derived in this study neglects the influence of surface tension on the changes in concave shape, resulting in these discrepancies. Therefore, this study will proceed with optimizing Equation (15) to enhance its accuracy. Combining Equation (15) with the surface tension model derived by FU et al., we can obtain [26].
1 2 p c l exp 2 [ x λ · r ] g U 2 ( r ) = γ + 2 σ c
where γ represents the internal static pressure of the liquid phase, specifically denoted as γ = ρ l g y , while σ denotes the surface tension, and c represents the minimum curvature radius at the lowest point.
The curvature radius can be calculated using the following formula [22].
c = y 2 / ( 112 h )
Substituting Equations (18) and (19) into Equation (15), the modified model is obtained as follows:
h · ( 1 + 448 σ h y ) 2 1 T ( y + h ) = y 2 · p c l · U 0 2 · k 2 · i 0
The comparison between the computed results of the modified model and experimental data is shown in Table 4. The comparison of absolute errors between the improved and original models is illustrated in Table 5. The improved model shows a reduction in absolute error by 50–53% compared to the original model. In the original model, as the oxy-hydrogen flame jet inlet velocity increases, the absolute error of the predictions also increases, resulting in less accurate predictions for higher inlet velocities and limited predictive range. The improved model shows a significant reduction in absolute error between predictions and experimental data; however, there is still considerable fluctuation in the errors. Additionally, as the inlet velocity of the flame jets increases, the absolute error continues to exhibit a noticeable upward trend. Therefore, further optimization of the model is necessary to enhance its predictive accuracy and stability.

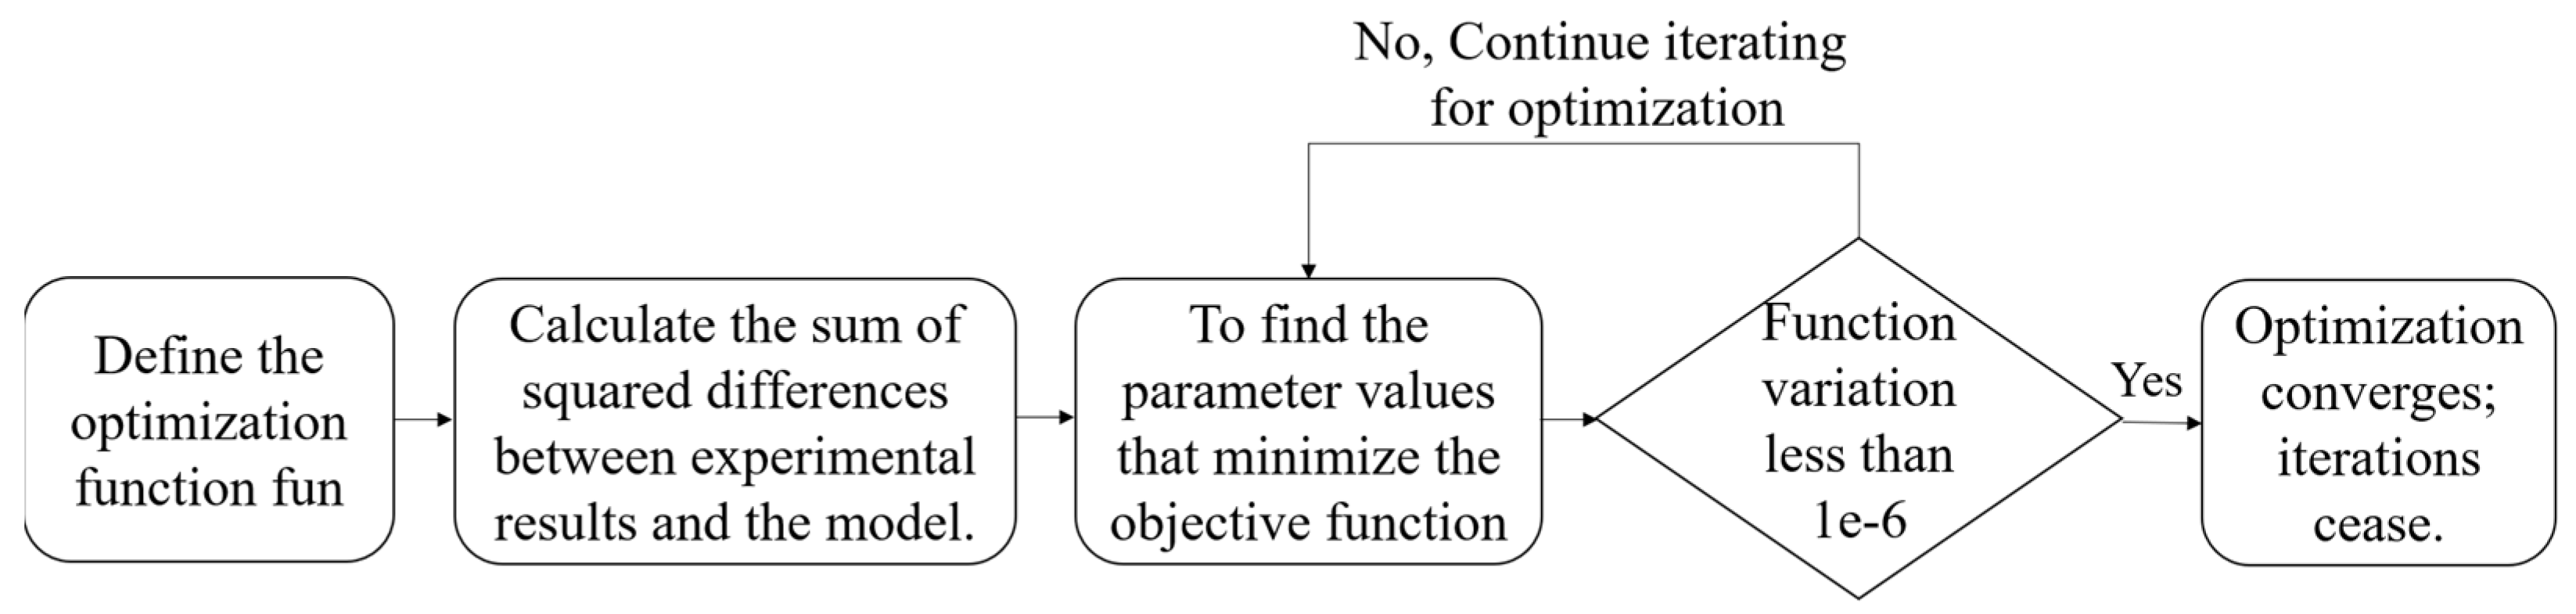
5.3. Optimization of the Theoretical Model

For the final optimized mathematical model established in this study, which includes a constant parameter k, adjustments and optimizations of this parameter will be conducted based on experimental results.
The iterative correction process is carried out using MATLAB R2024a software, specifically addressing a single-variable optimization problem with initial values specified in this study. The optimization problem is solved using the fminsearch function, which searches for the optimal solution within the parameter space to minimize the error between the objective function of optimization and experimental data. This approach aims to obtain parameter values that best fit the model to experimental data, thereby being suitable for optimizing the model in this study.
Based on nine sets of experimental data, this study employed the fminsearch function to determine the parameter that minimizes the objective function, thereby enhancing the model’s alignment with experimental data. The optimization process is illustrated in Figure 13. After 12 iterations of iterative refinement, the function’s change reduced to less than 1 × 10⁻⁶, indicating convergence of the optimization process and termination of iterations. The refined parameter k was found to be 1.892. Subsequently, the optimized model achieved a goodness of fit of 0.9632.
After obtaining the optimized model parameters, Formula (20) can be simplified. For the selected glass material in this study, with a surface tension of 0.06 N/m and a density of 2.5 g/cm3, the simplified relationship between the oxy-hydrogen flame jet inlet velocity and the depth on the processed glass surface is as follows:
h · ( 1 + h y ) 2 1 T ( y + h ) = U 0 2 0.56 · d 0 · ( p a i r i 0 ) 1 / 2
In this context, u0 represents the inlet velocity of the flame jets, h is the depth of the material indentation after processing, pair denotes the density of air, p0 is the density of the inlet fuel, y is the initial distance from the nozzle to the material being processed, and d represents the nozzle diameter. T(y + h) indicates the temperature at a specific distance point, which is calculated using one of Formulas 4 to 6 based on the processing area selected by the flame jets.
The comparison between the model’s computational results after iterative correction and the experimental results is shown in Table 6. The comparison of absolute errors between the model after iterative correction and the model without iteration is illustrated in Table 7.
After iterative corrections were applied to the model, a significant reduction in absolute error was observed. Compared to the improved model incorporating surface tension, the absolute error decreased by 49–66%. This enhancement allows for more accurate predictions of the impact of high oxy-hydrogen flame jet velocities and maintains the absolute error within a reasonable range, even at high inlet velocities. Furthermore, the absolute error decreases at even higher inlet velocities, which is critical for refining the processing mechanism of flame jets. Additionally, the fit between the corrected model and the experimental data has substantially improved, indicating that the iteratively corrected model more accurately represents the actual conditions, thereby increasing the model’s accuracy and reliability.

6. Conclusions

This study investigates the relationship between the indentation depth on the glass surface and the inlet velocity of flame jets through a combination of theoretical analysis, simulation, and experimentation. Firstly, a theoretical model was established, revealing that the inlet velocity of flame jets and the maximum indentation depth on the glass surface have a direct proportional relationship, and theoretical calculations were obtained. Subsequently, simulations were conducted to validate the accuracy of the theoretical model’s trend. Regarding the validation of the theoretical model, experiments were conducted to analyze the error between the experimental data and the theoretical model calculations. Surface tension was incorporated into the model to improve it, resulting in a 50–53% reduction in absolute error compared to the initial model. Finally, through iterative optimization using MATLAB, the improved model achieved an absolute error in the range of 0.009 to 0.069 mm. The optimized model calculation results indicate that the model significantly improves the accuracy in calculating the indentation dimensions on the glass surface subjected to flame jets. It more accurately describes the variation in concave depth on the glass blank surface after oxy-hydrogen jet processing, enriching the understanding of the flame jet processing mechanism. Furthermore, experimental data demonstrate that flame jets can induce significant deformation in the glass material, and this process is controllable, proving the feasibility of flame jet processing. This provides a theoretical foundation for flame jet processing.

Author Contributions

X.Q.: supervision, data curation. B.W.: funding acquisition. Y.Z.: writing—original draft preparation. X.Z.: project administration, resources. W.F.: methodology, software, validation, formal analysis, investigation, writing—review and editing. All authors have read and agreed to the published version of the manuscript.

Funding

This research was funded by the SCIENTIFIC RESEARCH PROJECT OF EDUCATION DEPARTMENT OF GUANGDONG PROVINCE (2022KCXTD029); GUANGDONG BASIC AND APPLIED BASIC RESEARCH FOUNDATION (2022A1515140070).

Data Availability Statement

Data will be made available on request.

Acknowledgments

This research was supported by the State Administration of Science, Technology, and Industry for National Defense. PRC.

Conflicts of Interest

The authors declare no conflicts of interest.

References

  1. Zhang, L.; Pan, J.; Zhang, Z.; Wu, H.; Yao, N.; Cai, D.; Xu, Y.; Zhang, J.; Sun, G.; Wang, L.; et al. Ultrasensitive skin-like wearable optical sensors based on glass micro/nanofibers. Opto-Electron. Adv. 2020, 3, 190022-1–190022-7. [Google Scholar] [CrossRef]
  2. Sa, B. Ferromagnetic Glass-Coated Micro-and Nanowires for Medical Application. Biomed. J. Sci. Tech. Res. 2021, 32, 25413–25417. [Google Scholar]
  3. Al-Buriahi, M.S.; Alzahrani, J.S.; Alrowaili, Z.A.; Olarinoye, I.; Sriwunkum, C. Recycling of waste cathode-ray tube glasses as building materials for shielding structures in medical and nuclear facilities. Constr. Build. Mater. 2023, 376, 131029. [Google Scholar] [CrossRef]
  4. Wang, S.; Kong, L.; Wang, C.; Cheung, C.F. Ultra-precision manufacturing of microlens arrays using an optimum machining process chain. Opt. Express 2023, 31, 2234–2247. [Google Scholar] [CrossRef]
  5. Liu, Y.; Tong, H.; Li, Y.; Chen, J. The effect of tool wear on the damaged layer thickness and tool wear rate in ultra-precision turning of quartz glass. J. Micromech. Microeng. 2023, 33, 095012. [Google Scholar] [CrossRef]
  6. Liu, Y.; Tong, H.; Liu, G.; Li, Y.; Tan, Q. Cutting model considering damage layer thickness for ultra-precision turning of quartz glass. The Int. J. Adv. Manuf. Technol. 2023, 126, 4087–4100. [Google Scholar] [CrossRef]
  7. Stamopoulos, A.; Di, I.; Di, G. Simulation of the thermoforming process of glass fiber–reinforced polymeric components: Investigation of the combined effect of the crosshead speed and material temperature. The Int. J. Adv. Manuf. Technol. 2021, 117, 2987–3009. [Google Scholar] [CrossRef]
  8. Bush, S.; Torres, F. Morphological characterisation of long glass fibre composites for the thermoforming process. Int. Polym. Process. 2022, 15, 208–214. [Google Scholar] [CrossRef]
  9. Gao, W.; Liu, N.; Jiao, Y.; Xie, X.; Zhang, L. Flame trajectory of a non-vertical turbulent buoyant jet flame. Appl. Energy Combust. Sci. 2021, 7, 100039. [Google Scholar] [CrossRef]
  10. Shmakov, A.; Kozlov, V.; Litvinenko, Y.; Pavlenko, A. Specific features of the flame structure of a pre-mixed hydrogen-oxygen mixture exhausting into air. Int. J. Hydrogen Energy 2024, 74, 121–127. [Google Scholar] [CrossRef]
  11. Wang, Q.; Yan, J.; Wang, B.; Chang, L.; Palacios, A. Experimental study on trajectory flame length and axial temperature distribution of inclined turbulent jet flames. Fire Saf. J. 2022, 131, 103623. [Google Scholar] [CrossRef]
  12. Ba, Q.X.; Zhao, Z.Y.; Zhang, Y.P.; Liu, Y.; Christopher, D.M.; Ge, P.; Li, X. Modeling of cryogenic compressed hydrogen jet flames. Int. J. Hydrogen Energy 2024, 51, 917–927. [Google Scholar] [CrossRef]
  13. Li, F.; Pan, J.; Zhang, C.; Quaye, E.K.; Shao, X. Structure and combustion characteristics of methane/air premixed flame under the action of wall. Energy Eng. J. Assoc. Energy Eng. 2021, 118, 1135–1154. [Google Scholar] [CrossRef]
  14. Gong, L.; Han, Y.F.; Zheng, X.Q.; Wang, H.; Mo, T.; Yao, Y.; Zhang, Y. Effect of distance of vertical barrier wall and release temperature on the hydrogen jet flame width and temperature distribution induced by impingement of ignited release of cryogenic hydrogen. Combust. Flame 2024, 259, 113133. [Google Scholar] [CrossRef]
  15. Schuhler, E.; Lecordier, B.; Yon, J.; Godard, G.; Coppalle, A. Experimental investigation of a low Reynolds number flame jet impinging flat plates. Int. J. Heat Mass Transf. 2020, 156, 119856. [Google Scholar] [CrossRef]
  16. Zhao, Q.; Li, H.; Lv, J.; Liu, X.; Zhang, F.; Jiang, S.; Ma, L.; Wang, C.; Ni, J.; Peng, G. Adhesive-free bonding fiber optic Fabry–Perot pressure sensor based on oxy-hydrogen flame welding and spiral tube. Opt. Commun. 2020, 476, 126307. [Google Scholar] [CrossRef]
  17. Jokiaho, T.; Santa-Aho, S.; Peura, P.; Vippola, M. Cracking and failure characteristics of flame cut thick steel plates. Metall. Mater. Trans. A 2020, 51, 1744–1754. [Google Scholar] [CrossRef]
  18. Zhao, X.Y.; Li, C.; Li, S.; Han, X.; Jiang, H. Mechanism study on the influence of combustion models and spray gun geometric parameters on high-velocity oxygen-fuel (HVOF) thermal spraying. J. Manuf. Process. 2023, 98, 173–185. [Google Scholar] [CrossRef]
  19. Cremers MF, G.; Remie, M.J.; Schreel, K.; De Goey, L.P. Heat transfer mechanisms of laminar flames of hydrogen + oxygen. Combust. Flame 2004, 139, 39–51. [Google Scholar] [CrossRef]
  20. Tang, J.; Zhang, Y.; Li, X.; Wang, Q.; Zhou, P.; Zhang, L.; He, Q.; Deng, H. Conformal polishing of a glass microlens array through oxyhydrogen flame-induced viscoelasticity flow at nano/microscale. J. Mater. Process. Technol. 2024, 328, 118420. [Google Scholar] [CrossRef]
  21. Houf, W.; Schefer, R. Analytical and experimental investigation of small-scale unintended releases of hydrogen. Int. J. Hydrogen Energy 2008, 33, 1435–1444. [Google Scholar] [CrossRef]
  22. Kang, Y.; Lu, T.; Lu, X.; Gou, X.; Huang, X.; Peng, S.; Ji, X.; Zhou, Y.; Song, Y. On predicting the length, width, and volume of the jet diffusion flame. Appl. Therm. Eng. 2016, 94, 799–812. [Google Scholar] [CrossRef]
  23. Mogi, T.; Horiguchi, S. Experimental study on the hazards of high-pressure hydrogen jet diffusion flames. Loss Prev. Proc. 2008, 22, 45–51. [Google Scholar] [CrossRef]
  24. Wang, C.; Ding, L.; Wan, H.X.; Ji, J.; Huang, Y. Experimental study of flame morphology and size model of a horizontal jet flame impinging a wall. Process Saf. Environ. Prot. 2021, 147, 1009–1017. [Google Scholar] [CrossRef]
  25. Veser, A.; Kuznetsov, M.; Fast, G.; Friedrich, A.; Kotchourko, N.; Stern, G.; Schwall, M.; Breitung, W. The structure and flame propagation regimes in turbulent hydrogen jets. Int. J. Hydrogen Energy 2011, 36, 2351–2359. [Google Scholar] [CrossRef]
  26. Fu, W.; Jiang, W.; Zhang, X. Calculation model of the concave mirror depth in gas jet forming of the mirror blank. Int. J. Adv. Manuf. Technol. 2023, 125, 1679–1687. [Google Scholar] [CrossRef]
  27. Banks, R.; Chandrasekhara, D. Experimental investigation of the penetration of a high-velocity gas jet through a liquid surface. J. Fluid Mech. 1963, 15, 13–34. [Google Scholar] [CrossRef]
  28. Bellucci, D.; Cannillo, V.; Sola, A. Coefficient of thermal expansion of bioactive glasses: Available literature data and analytical equation estimates. Ceram. Int. 2011, 37, 2963–2972. [Google Scholar] [CrossRef]
  29. Karasu, B.; Demirel, İ.; Aydın, S.; Dalkıran, M.; Lik, B. Past and present approaches to borosilicate glasses. El-Cezeri 2020, 7, 940–969. [Google Scholar]
Figure 1. The process of flame jet forming.
Machines 12 00765 g001
Figure 2. Diagram of the flame jet structure [22].
Machines 12 00765 g002
Figure 3. Diagram illustrating the division of the flame jet region.
Machines 12 00765 g003
Figure 4. Radial distribution diagram of the flame jet velocity.
Machines 12 00765 g004
Figure 5. Formation mechanism of flame jets.
Machines 12 00765 g005
Figure 6. Variation of indentation sectional morphology with flame jet parameters.
Machines 12 00765 g006
Figure 7. Comparison of simulation data with theoretical model calculations.
Machines 12 00765 g007
Figure 8. Experimental device for flame jet processing. (1) glass clamping device (2) numerical control panel (3) flame torch (4) height/distance adjuster (5) oxy-hydrogen flame jet generator.
Machines 12 00765 g008
Figure 9. Surface morphology after machining. (a) 4 m/s (b) 5 m/s (c) 6 m/s (d) 7 m/s (e) 8 m/s (f) 9 m/s (g) 10 m/s (h) 11 m/s (i) 12 m/s.
Machines 12 00765 g009
Figure 10. The experimental data measured by the surface contour profiler.
Machines 12 00765 g010
Figure 11. The experimental results compared with the theoretical model calculations.
Machines 12 00765 g011
Figure 12. Force balance diagram at the indentation.
Machines 12 00765 g012
Figure 13. Diagram of the model optimization process.
Machines 12 00765 g013
Table 1. Inlet Jet Parameters.
ParameterNumerical Value
Inlet gas velocity (m/s)4, 5, 6, 7, 8, 9, 10, 11, 12
nozzle height (Distance between flame spray gun nozzle and glass surface) (mm)20
experimental glass thickness (mm)5
flame gun nozzle diameter (mm)0.5
Table 2. Physical and chemical properties of high borosilicate glass [29] (all properties are at room temperature).
Softening temperature800 °C
linear expansion coefficient3.3 × 10−6 K−1
density2.23 t m−3
Specific heat0.9 J g−1 K−1
Thermal conductivity1.2 W m−1 K−1
Table 3. The chemical composition of high borosilicate glass [29].
SiO281%
Bi2O313%
Na2O4%
Al2O32%
Table 4. Deep data comparison of improved model and experiments.
Velocity (m/s)456789101112
Improved model (mm)0.4050.620.851.101.401.702.052.442.79
Experiment
data (mm)
0.3610.5690.7910.9751.2311.531.8862.2152.574
Table 5. Comparison of absolute errors between the improved model and the theoretical model.
Velocity (m/s)456789101112
Theoretical model (mm)0.0590.0710.1090.2150.2790.320.3240.3760.369
Improved
model (mm)
0.0450.0510.7910.9751.2311.531.8862.2152.574
Table 6. Comparison plot of model computed results after iterative refinement with experimental results.
Velocity (m/s)456789101112
Iteratively optimized model (mm)0.380.580.801.001.301.601.902.282.61
Experiment
data (mm)
0.3610.5690.7910.9751.2311.531.8862.2152.574
Table 7. Comparison of absolute errors in the model before and after iterative refinement.
Velocity (m/s)456789101112
Theoretical model (mm)0.0590.0710.1090.2150.2790.320.3240.3760.369
Improved
model (mm)
0.0450.0510.0590.1250.1690.170.1640.2250.216
Iteratively optimized model (mm)0.0190.110.0090.0250.0690.070.0140.0650.036
Disclaimer/Publisher’s Note: The statements, opinions and data contained in all publications are solely those of the individual author(s) and contributor(s) and not of MDPI and/or the editor(s). MDPI and/or the editor(s) disclaim responsibility for any injury to people or property resulting from any ideas, methods, instructions or products referred to in the content.

