Abstract
Errors affect the actual meshing process of gears, alter the actual wear pattern of the tooth profile, and may even impact the overall service life of machinery. While existing research predominantly focuses on individual errors or a narrow set of factors, this study explores the combined effects of multiple errors on tooth profile wear. A comprehensive gear wear prediction model was developed, integrating the slice method, lumped mass method, Hertz contact model, and Archard’s wear theory. This model accounts for initial tooth surface topography, thermal deformation, dynamic effects, and wear, establishing strong correlations between gear wear prediction and key factors such as tooth surface morphology, temperature, and vibration. Experimental validation demonstrated the model’s high accuracy, with relatively small deviations from the observed wear. Initial profile errors (IPEs) at different positions along the tooth width result in varying relative sliding distances, leading to differences in wear depth despite a consistent overall trend. Notably, large IPEs at the dedendum and addendum can influence wear progression, either accelerating or decelerating the wear process over time.
1. Introduction
Gears are critical components in the transmission systems of mechanical equipment [1,2]. Their actual operation is influenced by manufacturing errors, thermal deformation, and wear. Significant deviations in the tooth surface profile can negatively affect the meshing process, leading to increased gear vibration [3,4] and accelerated tooth surface wear. This creates a self-reinforcing cycle that severely shortens the service life of the gear. In low-speed, heavy-load machinery, such as wind turbines, it is difficult to achieve optimal lubrication, which exacerbates gear wear. Therefore, research on multi-factor coupled gear wear prediction is crucial for preventing accidents caused by gear wear and failure in mechanical equipment.
The Archard wear theory (AWT), which describes the sliding wear state based on the contact theory of micro-asperities, establishes the relationship between wear amount, contact pressure, and sliding distance [5]. Due to continuous advancements, the theory excels in describing contact stress and quantitatively predicting wear [5,6], leading to its widespread application in the wear prediction of various gears [6,7,8,9,10,11,12,13,14]. Given the impact of factors such as cutting tools and equipment accuracy during the gear machining process, actual tooth surfaces inevitably exhibit manufacturing errors [15,16,17,18], which encompass deviations in tooth surface geometry, pitch errors [19], and center distance [20] misalignments, thus deviating from the ideal tooth surface. Some scholars believe that these errors in the actual tooth surface can affect gear wear [21]. Consequently, MB Sánchez et al. [22] analyzed the influence of changes in tooth shape on the transmission error of spur gear surface wear. Based on Hertz contact theory and the Archard wear model, Wang Hongbing [23,24,25] and S Zhang et al. [14] analyzed the influence of tooth morphology changes on spur and helical gear tooth surface wear by considering the effects of lubrication and dynamic load. Kairan Zhang et al. [26] developed a real-time iterative model, grounded in the Archard equation, to simulate the wear evolution by continuously updating the equivalent curvature radius of the tooth surface. B Zhang et al. [27,28] considered the initial surface roughness of the tooth profile and used the Archard wear formula to simulate the evolution of tooth profile surface roughness during repeated meshing. H Liu et al. [29] proposed a model that integrates the contact interface characteristics of the tooth surface, mechanical properties, and residual stress gradients to investigate the competitive mechanisms in the wear process of wind power gear pairs. Shuai Mo et al. [28] and G Li et al. [30], employing fractal theory, developed theoretical models for tooth surfaces and wear prediction, elucidating the correlation between initial tooth surface roughness, wear depth, and meshing position.
Some scholars have proposed that the thermal deformation of gears, due to the inevitable generation of frictional heat during operation, affects gear wear. Wang Han [31], X Zhang, et al. [32], and Zhe Yuan et al. [33] combined the Archard wear calculation model with the contact surface flash temperature calculation method to explore the effects of temperature deformation and alignment error on gear load distribution, dynamics, and wear. Based on the Archard adhesive wear model, N Dong et al. [34,35] proposed a dynamic wear prediction model that couples thermal deformation and wear, realizing the correlation coupling of the constant temperature field, wear, and dynamics.
In summary, numerous researchers have examined how factors such as tooth surface roughness, friction, and contact morphology influence gear wear based on AWT. Gear manufacturing is influenced by various factors including machine tools, processes, and materials, and the initial profile errors (IPEs) of the gear tooth surface cannot be ignored. To improve prediction accuracy, some scholars have proposed using fractal theory to establish the actual tooth surface topography, which is a highly insightful approach. However, the tooth profile established using fractal theory still differs from the actual tooth profile. On the other hand, scholars have also conducted extensive studies on the coupling of thermal deformation error (TDE) and tooth surface wear. Although there are many existing studies on coupling wear prediction and the application of gear models is very broad; it can be observed that there are few relevant studies on wear prediction that couple the initial tooth surface topography, tooth surface wear, thermal deformation, and gear dynamics. The limited number of factors considered in these studies often results in less-accurate wear predictions, which can lead to unexpected failures of critical equipment.
To overcome these limitations, this study introduces a wear prediction model that incorporates the coupling effects of initial topography, thermal deformation, and gear dynamics. Tooth profile data were collected and processed, and IPEs were introduced. A dynamic model of the gear system was established, and the time-varying meshing stiffness (TVMS) was calculated to capture the interaction between gear dynamics and wear. Additionally, sliding distance and load distribution models were developed, considering the coupling between adjacent teeth and slices for predicting wear in standard involute spur gears. This study emphasizes wear under dry friction conditions, aiming to explore the extreme operational scenarios of gears without the mitigating effects of lubrication. The accuracy of the proposed model was validated through experimental studies, which combined gear wear measurements with data processing techniques.
In this article, Section 2 introduces the gear wear prediction model, detailing IPE extraction, the gear dynamics model, the TVMS model, the TDE model, the wear prediction model, and the equivalent wear experiment (EWE), along with a discussion of the results. Section 3 elaborates on the wear experiment and provides a further analysis of the findings. Finally, Section 4 presents the conclusions.
2. Gear Wear Prediction Model
2.1. Extraction of Gear Tooth Surface Topography
In this study, image measurement software and data processing technology are combined to obtain the overall profile data of the gear tooth surface using a digital stereo microscope. The linear regression optimization method (LROM) is employed to analyze the tooth surface profile, identifying deviations from the ideal profile, which are recorded as the IPE data. The flow chart for obtaining IPE data is shown in Figure 1. The parameters of the research object in this study are shown in Table 1. The gear is made of low-carbon mild steel, and the machining accuracy is classified as Grade 6, in accordance with the ISO 1328 [36] standard for gear manufacturing tolerances.
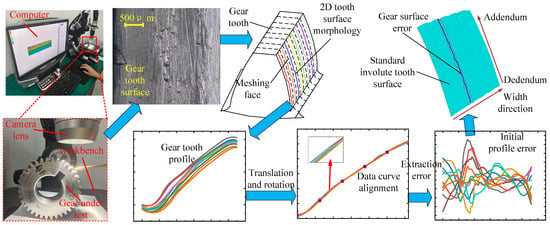
Figure 1.
Flow chart of IPE data acquisition.

Table 1.
Gear-specific parameters.
The digital stereo microscope used in this study was the VHX-6000 from KEYENCE (Osaka, Japan), as illustrated in Figure 1. The pristine gear intended for use in the experiment was placed on the workbench, and the gear’s position was adjusted to ensure clear images of the tooth meshing surface; the tooth dedendum area could be captured. The magnification of the lens was set to 150×, and the illumination on the tooth surface was optimized. Image processing software was utilized to reduce metal reflection effects, ensuring accurate capture of the tooth surface topography. The tooth surface topography images were then taken using the digital stereo microscope.
Due to the limitations of the digital stereo microscope, it was difficult to obtain the entire 3D profile data of the gear tooth surface directly. Consequently, only 2D (two-dimensional) profile data could be obtained by extracting profile lines. It was assumed that the 2D profile curve measured at each evenly divided section along the tooth width direction was representative of the surface topography of that region. Ten sets of two-dimensional profile data were measured at equal intervals along the tooth width direction, spanning from the dedendum to addendum, to construct the overall profile of a single meshing tooth surface. Each set of 2D profile curves of the gear contained more than 1000 data points, with measurement accuracy reaching the micron level.
Given the randomness in gear placement and the determination of the start and end points of the tooth surface 2D profile data, it was crucial to maintain a consistent gear placement position and consistent start and end positions for each set of data when capturing images of the tooth meshing surface. This consistency facilitated the acquisition of the overall initial morphology of the tooth surface and the preprocessing of the 2D profile data. Figure 2a illustrates ten curves, each representing original profile data obtained from equidistant measurements along the width direction of the same tooth. To process these 2D profile curves, the LROM was utilized, applying the minimum mean square error (MSE) as the loss function to evaluate the distances between different 2D profile curves. The optimal scaling factor and displacement for each tooth surface profile curve were calculated. By translating and rotating the 2D profile data of the tooth surface, the profile data points at different positions of the same tooth can be made to coincide. Figure 2b presents the data after mathematical alignment.
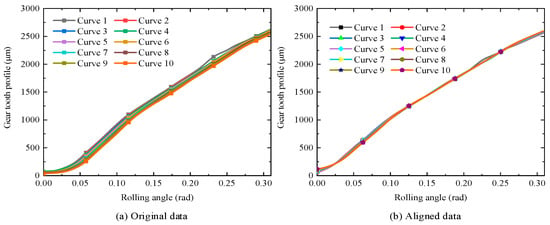
Figure 2.
Profile data alignment.
As illustrated in Figure 2, the processed 2D profile curves of the tooth surface largely coincide, although some variations are observed at different positions along the tooth width. The standard involute gear profile was generated based on the principles of standard involute spur gear formation. Using LROM, this standard profile was aligned with the 2D profile curve data, and the deviations from the standard involute were calculated as the IPE data.
Figure 3 illustrates the IPE of the 2D profiles obtained from equidistant measurements and subsequent processing along the width of the same tooth, corresponding to the ten profile curves shown in Figure 3. It can be observed that the IPE data of the tooth surface generally fall within ±20 μm. According to ISO 1328 [36] standards, the profile error for a sixth-level accuracy gear is typically between ±10 and ±20 microns (µm). Considering the relevant literature [15,16,17] and manufacturing handbooks [18], it is evident that gear profile errors are generally larger at the tooth addendum and dedendum positions due to tool wear and machining equipment accuracy. Therefore, the range of IPEs calculated using the method proposed in this study is reasonable and aligns with actual conditions.
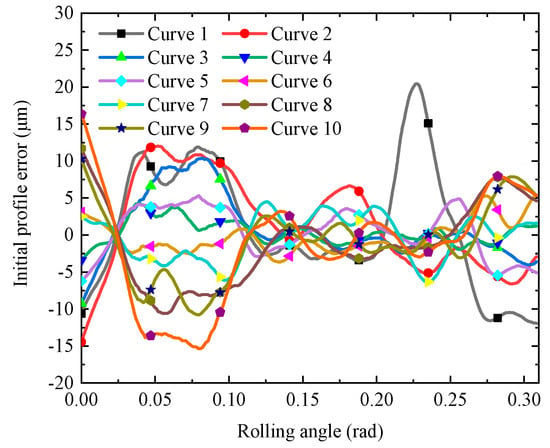
Figure 3.
IPEs of tooth surface.
2.2. Gear Dynamics Model
This study developed a dynamic model of a two-stage gear transmission system using the lumped mass method. The shaft and gear support stiffnesses are represented by spring-damper systems. The dynamic model is illustrated in Figure 4, and specific gear parameters are detailed in Table 1. Each lumped mass in the system features three degrees of freedom.
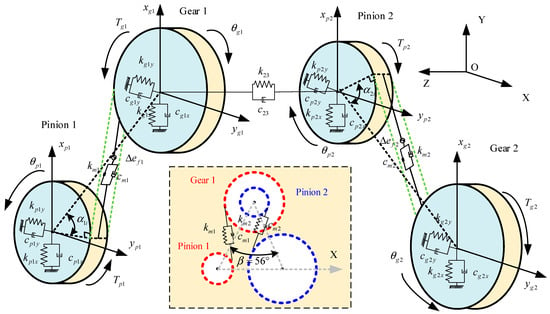
Figure 4.
Dynamic model.
In Figure 4, ‘p’ denotes the pinion, and ‘g’ denotes the gear. The differential equations of motion for gear meshing dynamics are derived using Newton’s second law, and the fourth-order Runge–Kutta method is applied to solve these equations.
In Equation (1), mij (i = p, g; j = 1, 2) represents the masses of the pinions and gears, respectively, and Iij (i = p, g; j = 1, 2) represents the moments of inertia of the pinions and gears, respectively. Λj = sign (Vpj − Vgj) (j = 1, 2) denotes the friction direction coefficient, where Vij (i = p, g; j = 1, 2) are the tangential velocities at the meshing points. µ denotes the friction coefficient, and (j = 1, 2) denotes the angle between the gear engagement line and the x-axis. The support damping coefficients cijk (i = p, g; j = 1, 2; k = x, y) are represented using Rayleigh damping for the solution. Tij (i = p, g; j = 1, 2) denotes the torque, and rbij (i = p, g; j = 1, 2) represents the base circle radius of the gears. Fmj (j = 1, 2) represents the meshing force, where
where , , , , and ξj represents the damping ratio. , . ρij (j = 1,2) represents the friction arm, and the method for calculating the friction arm is referenced in [34,35].
2.3. Gear TVMS Model
Due to the non-uniformity of the tooth surface resulting from IPEs, the wear depth of a single gear tooth will differ depending on its location along the width of the tooth. The gear slicing method (GSM) divides the gear teeth into several slices along the width direction, which aligns well with the research in this study. Utilizing the basic concept of GSM, a spur gear is approximated as a series of spur gear slices, and a stiffness calculation model considering the initial tooth surface topography is established. Using the potential energy method (PEM), the stiffness of the gear slices is calculated, with the gear tooth being modeled as a cantilever beam, resulting in a TVMS based on the geometric parameters of the tooth profile.
In Figure 5, B represents the tooth width, and ∆B represents the width of the spur gear slice. Each tooth can be segmented into several slices, where each slice can be considered a spur gear with a tooth width of ∆B. Fi represents the force on the ith tooth, and Fij denotes the load on the jth slice of the ith gear. The total potential energy of the gear tooth slice can be expressed by the following Equation (3):
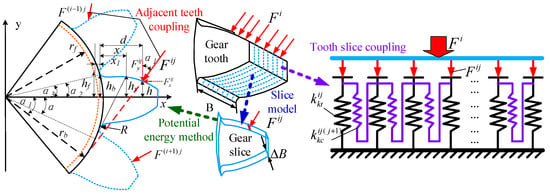
Figure 5.
Time-varying meshing stiffness model of the gear.
In Equation (3), , , , and represent the compressive elastic potential energy, shear elastic potential energy, Hertzian contact potential energy, and bending potential energy of the jth slice of the ith gear, respectively, with specific expressions referred to in references [34,35,37,38]. The total elastic potential energy of the ith gear cantilever beam can be expressed as follows:
The specific expression forms of flexure stiffness, shear stiffness, and compression stiffness of the tooth are cited in references [34,35,37,38]. Then, the stiffness of the jth slice of the ith gear can be expressed as follows:
Here, k = p, g; i = 1, 2; and j represents the slice number. To enhance the precision and effectiveness of stiffness calculations, an empirical formula is utilized for determining the Hertz contact stiffness of the gear slice.
According to Muskhelishvili’s theory [39], the fillet foundation of the gear plays a crucial role in determining the gear’s stiffness, which is difficult to ignore. Therefore, considering the effect of the fillet foundation of the gear on the gear stiffness, the stiffness of the gear fillet-foundation kkf is introduced based on references [34,35,37,38]. The coupling effects between gear teeth are significant and can be categorized into coupling between adjacent gear teeth and coupling between adjacent tooth slices. Based on the references, coupling models for adjacent teeth [37,38] and for adjacent tooth slices [40,41] are introduced, as illustrated in Figure 5. The coupling effect between different gear slices is also modeled as a spring, with the coupling stiffness of gear slices described in the references [37,38]. The coupling balance equation for the gear slices can be expressed as follows:
where represents the deformation of the jth slice of the ith gear.
In the meshing process of the gear, there are single-tooth contact (STC) and double-tooth contact (DTC), and the coupling stiffness of the gear tooth is expressed as follows:
In Equation (8), indicates the deformation of the gear teeth. m represents the logarithm of meshing teeth, and (k = p, g) is the fillet-foundation stiffness of the gear. ki can be expressed as follows:
In Equation (9), kkfab (k = p, g, a = 1, 2, b = 1, 2, a ≠ b) is the coupling stiffness between adjacent gear teeth, and Faj and Fbj represent the load of the jth slice of teeth a and b (a = 1, 2, b = 1, 2, a ≠ b). The TVMS of gears is shown in Figure 6.
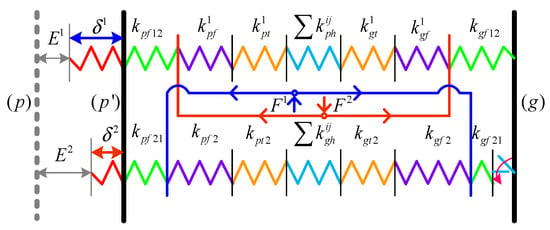
Figure 6.
Diagram of gear TVMS.
As shown in Figure 7a, the TVMS of the first and second stages of the gear transmission system is calculated. Figure 7b presents a comparison between the proposed method for calculating the TVMS of the first stage and the finite element method (FEM). The results indicate that the TVMS calculation method proposed in this study yields results that are in close agreement with those obtained from the extensively validated FEM [42,43]. This suggests that the proposed TVMS calculation method is accurate and reliable.
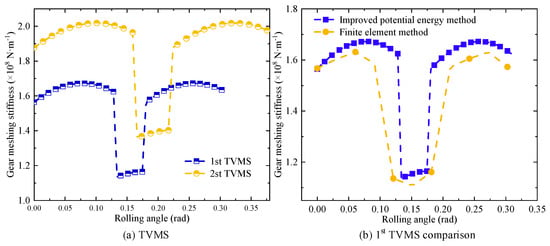
Figure 7.
TVMS result.
2.4. Gear Profile Thermal Deformation
After the mechanical system has been operating stably for a period of time, the internal and external heat exchange within the gear system reaches equilibrium, resulting in a stable thermal field. Due to thermal expansion, the radius of the gear’s base circle increases compared to its size at room temperature. The profile of the gear before and after thermal deformation is shown in Figure 8 [34,35].
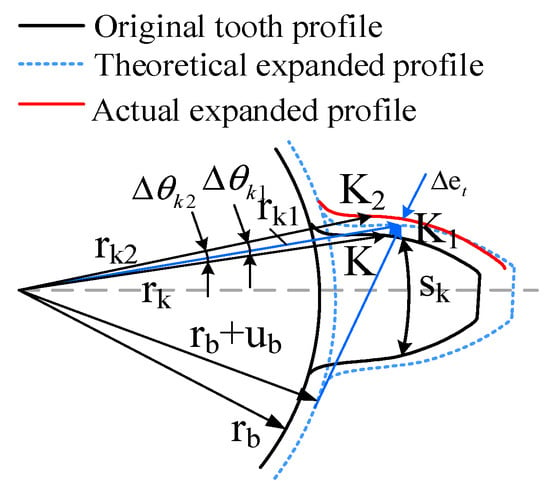
Figure 8.
Tooth profile before and after thermal deformation.
In Figure 8, K represents the initial contour curve point of the gear, K1 represents the corresponding point of the gear contour curve after thermal deformation, and K2 represents the gear contour curve point after actual thermal deformation. According to references [35], the gear contour curve point K2 after actual thermal deformation can be expressed as follows:
where represents the original base circle radius of the gear, represents the linear expansion of the base circle radius of the thermal expansion gear, and represents the expansion of the thickness of the gear teeth at point K. After thermal deformation, the gear contour deviates from the standard involute profile. Based on the actual gear contour curves observed after thermal deformation as reported in the literature [34,35], it can be expressed as follows:
In Equation (11), sp represents the tooth thickness at the pitch circle, and rp represents the pitch circle radius of the gear. The gear profile error caused by thermal deformation can be expressed as follows:
For all the tooth slices that make up the same gear tooth, this study assumes that the temperature variation in each tooth slice’s profile is uniform. Consequently, the thermal deformation of each gear tooth slice is identical and can be calculated using Equation (12).
Taking an initial temperature of 20 °C for the gear system as an example, the steady-state TDEs of the pinion and gear in the first stage transmission, as illustrated in Table 1, are depicted in Figure 9. These results match those from the reference [35], thereby validating the correctness of the reference.
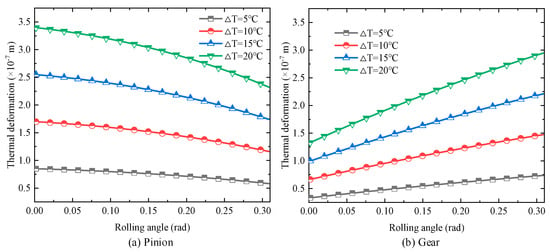
Figure 9.
The tooth profile is deformed by heat.
2.5. Gear Profile Wear Prediction Model
To investigate the effects of extreme conditions on gear wear, a wear prediction model is established for dry friction conditions. Utilizing the overall topography model of the tooth surface and the thermal deformation of the tooth profile, the Hertz contact model is combined with AWT to develop a prediction model for tooth surface profile wear. The gear tooth profile is discretized, with different slices of the same tooth having identical discretization points. The Hertz contact half-width ai corresponding to discrete points of the ith gear tooth profile can be calculated using the following Equation (13):
In Equation (13), Fi represents the meshing force received by the ith gear. For a tooth slice, Fi is replaced by the size of the meshing force Fij acting on the slices, represents the equivalent radius of the gear during meshing, and Ee represents the equivalent elastic modulus of the meshing gear, which is calculated by Equation (14) as follows:
where and represent the wear depth of the ith gear surface of the pinion and the gear, and and represent the IPE of the ith gear teeth of the pinion and gear. According to the AWT, the wear error can be expressed by the following Equation (16):
Here, K represents the dimensionless wear coefficient of the gear material, H represents the hardness of the gear material, p represents the pressure at the contact point of the gear, and s represents the relative sliding distance (RSD) of the meshing tooth surface. For specific expressions, refer to the literature [34,35,37,38]. Equation (16) indicates that higher pressure p results in more pronounced wear, similar to its effects on the wear coefficient k (k = K/H) and sliding distance s. Each instance of wear is independent and can be calculated using Equation (16). For discrete points on the gear tooth surface, the wear depth of the nth wear event can be calculated by the following Equation (17):
In Equation (17), hn−1 and hn, respectively, represent the wear depth of the (n − 1)th and nth meshing tooth surfaces, pn denotes the average contact pressure of the nth meshing tooth surfaces, and sn represents the sliding distance of the nth meshing tooth surfaces. Due to the coupling effect of the initial topography of the gear surface, tooth surface wear, and thermal deformation, the deformation of the meshing tooth pair may not be synchronized. Therefore, a feedback mechanism for tooth surface wear is established, as illustrated in Figure 10.
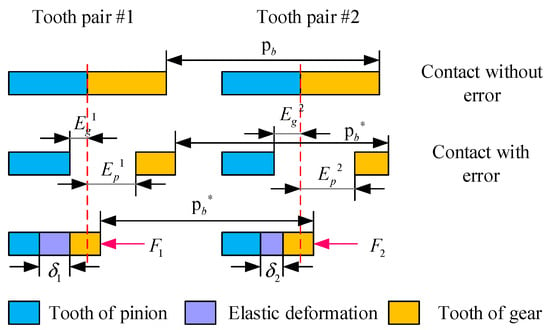
Figure 10.
Feedback mechanism of tooth surface wear.
In Figure 10, p and g represent the pinion and gear, respectively; Pb and Pb* denote the base pitch distances before and after thermal expansion. The relationship between tooth error and elastic deformation of meshing gears can be expressed as follows:
Equation (18), represents the overall geometric error of the gear tooth profile (n = p, g; i = 1.2, …), which is composed of the wear error , the IPE of the tooth surface, and the TDE , as follows:
2.6. Equivalent Wear Experiment
The contact between the gear meshing pair is characterized by line contact, featuring a combination of relative rolling and sliding motions, with wear predominantly caused by relative sliding. To reduce wear frequency and duration, the experiment gear was prepared using 45 mild steel, referring to ASTM G77-98 [44] “Standard Test Method for Ranking Resistance of Materials to Sliding Wear Using Block-on-Ring Wear Test”. Ignoring the influence of the rolling/sliding ratio—primarily because sliding is the main factor in gear wear—friction and wear of the gear teeth were simulated using a 45 mild steel metal ring and block, as illustrated in Figure 11.
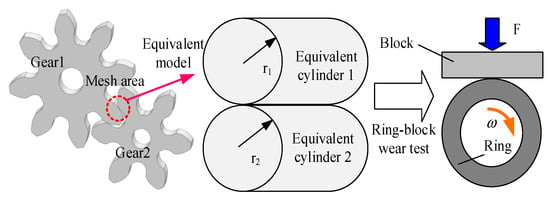
Figure 11.
Equivalent wear experiment.
The experiment was conducted at a room temperature of 20 °C to simulate gear wear under dry friction conditions in atmospheric environments. This method is also applicable in vacuum environments. The selection of sliding velocity, duration, and load parameters was based on two criteria: first, to ensure that the wear marks on the specimens were uniform and measurable, and second, to guarantee that the wear distance on each specimen was consistent. Higher rotational speeds corresponded to shorter wear durations and vice versa. Considering the varying load conditions of the transmission system and the presence of alternate double/single-tooth contact, three different load groups were selected for the experiments. The data from the EWE are shown in Table 2.

Table 2.
EWE data.
The HV-1000 hardness testing machine was used to measure the hardness and strength of the specimen, with the gear material hardness measured at 30 HRC, as illustrated in Figure 12a. The MR-H3A high-speed ring block friction and wear experimenting machine, manufactured by Beijing TIME High Technology Ltd. (Beijing, China), was employed to conduct the friction and wear experiments. The accuracy of the experiment force was ±1%, and the accuracy of the friction force measurement was ±2%, rendering the influence of the testing machine on the results negligible. As illustrated in Figure 12b, the friction coefficient was monitored in real time using an online monitoring system. Due to the low wear rate of the specimen, accurately measuring the wear volume is challenging. Therefore, a SuperView W1 3D profiler (topography repeatability 0.1 nm) was used to measure the wear marks on the specimen. The profiler requires the specimen to be placed flat, and the wear hole’s width, depth, area, and volume were measured based on the images of the wear holes, as illustrated in Figure 12c.
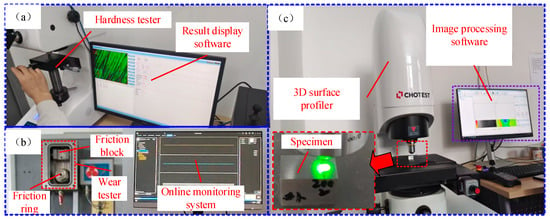
Figure 12.
EWE data acquisition: (a) Specimen hardness measurement; (b) friction and wear experiments; (c) Specimen wear mark treatment.
The friction coefficient of the block wear specimen can be continuously monitored in real time using the online monitoring system, as illustrated in Figure 13.
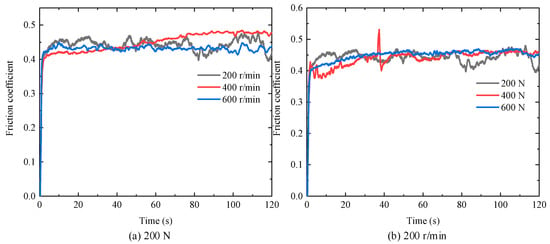
Figure 13.
Friction coefficient.
To achieve the wear pattern on the specimen is relatively uniform, the specimen was leveled, and a 3D profiler was utilized to measure the wear, obtaining parameters of the wear cavity including depth and area. An image of the wear depth is shown in Figure 14.
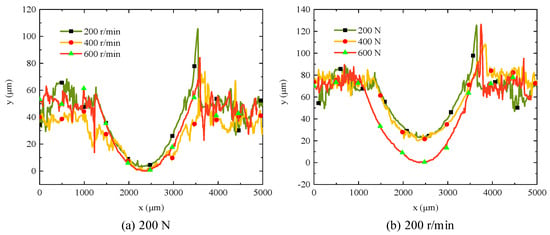
Figure 14.
Specimen wear depth.
The wear coefficient of the specimen is calculated by Equation (20) as follows:
where V represents the wear volume of the specimen, W represents the load of the specimen, ω represents the speed of the metal ring specimen, D represents the diameter of the metal ring specimen, and t represents the wear time of the specimen.
The wear volume, derived from the wear profile obtained through precise surface topography measurements, reflects the characteristics of the specimens, which exhibit a semicylindrical wear trace. To calculate the actual wear volume, the area of each wear pit was measured and integrated along the axial direction of the wear trace. This computed wear volume, along with other relevant parameters, was substituted into the formula to determine the wear coefficient under various operating conditions, as detailed in Table 3. Since the wear coefficient was not constant throughout the wear process, the values obtained represent the average of multiple independent measurements (repeated under identical experimental conditions).

Table 3.
Wear coefficient.
Combining the results of the friction coefficient, wear coefficient, and Table 3, it is observed that the wear coefficient of the specimen material is on the order of 10−14. Both the friction and wear coefficients vary with changes in pressure and sliding speed, but they do not follow the same trend. This discrepancy is due to changes in material properties and wear mechanisms at the contact surface under varying conditions. Under the experimental conditions, characterized by high sliding speeds on the tooth surface and relatively low contact pressure, the average friction coefficient (µi) is 0.43, and the average wear coefficient k is 6.74 × 10⁻¹⁴ m3/(N·m) of the measured results. In summary, the gear wear prediction process developed in this study is illustrated in Figure 15, which is adapted from reference [34].
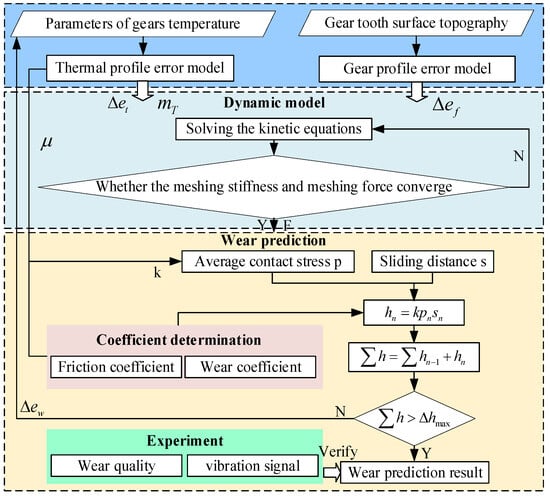
Figure 15.
Gear wear prediction process.
2.7. Discussion of Prediction Results
At a room temperature of 20 °C, with a pinion speed of 900 rpm and a load of 4 N·m, the sliding distance of the gear in the first stage of transmission is predicted, as illustrated in Table 1. The results are depicted in Figure 16.
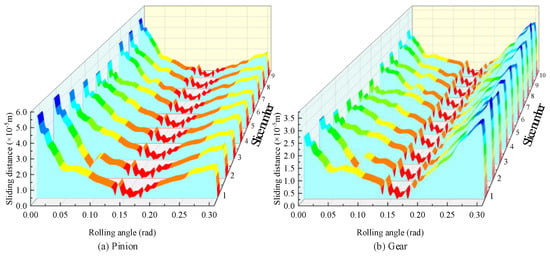
Figure 16.
Sliding distance.
As illustrated in Figure 15, the RSD of the pinion is initially large at the start of engagement, decreases continuously to reach a minimum near the pitch point, and then increases again before disengagement. However, the sliding distance upon exit is not as large as at initial engagement. The gear exhibits a mirror-symmetrical trend with an overall ‘√’ pattern. Although the gear’s sliding distance also follows a ‘√’ trend, it is smaller when entering engagement and larger when exiting. The sliding distances for different sections of the same tooth on both the pinion and gear follow a similar overall trend, with slight variations at different meshing positions. This indicates that the IPE of the gear affects the actual RSD.
In comparison with wear prediction models for transmissions that neglect temperature effects and initial tooth surface topography, the model presented in this research offers the advantage of comprehensively considering the effects of thermal deformation caused by temperature rise and the initial topography of the tooth surface on gear wear. The initial topography of the same gear tooth varies along the tooth width direction, resulting in different sliding distances at various positions. Notably, the sliding distances differ significantly at the addendum and dedendum of the gear tooth, as illustrated in Figure 17b. Traditional methods assume that the initial tooth surface topography is uniform along the width direction, as illustrated in Figure 17a. However, this assumption contradicts actual conditions, inevitably leading to less-accurate prediction results.
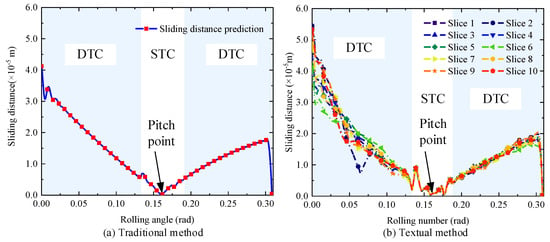
Figure 17.
Comparison of sliding distance.
Gear meshing force is discretized along the tooth profile, and the results of meshing forces on different slices of the same gear tooth are obtained after distribution, as illustrated in Figure 18. For different slices of a specific gear tooth, the overall trend in the distributed meshing force curves is similar. The meshing force is relatively small at the beginning of the meshing stage and remains relatively stable in the DTC zone as meshing progresses. When the meshing enters the STC zone, the assigned meshing force on the tooth surface increases abruptly, approximately doubling compared to the DTC zone. Upon returning to the DTC zone, the meshing force drops sharply and stabilizes in the subsequent meshing stages. Variations in the meshing force curves among different slices of the same gear tooth are attributed to differences in the tooth surface morphology. Considering the coupling stiffness between slices, the motion of different slices is interrelated, which further affects gear dynamics and wear.
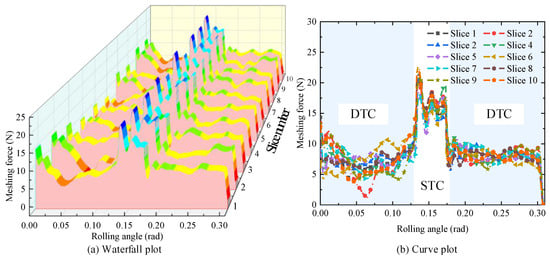
Figure 18.
Meshing force results.
After obtaining the meshing force, it is divided by the contact area to determine the stress distribution on the gear tooth surface. Similar to the meshing force, the overall trend in tooth surface pressure is consistent across different slices of the same gear tooth. However, due to the influence of the initial tooth surface morphology and wear, slight variations in tooth surface stress are observed among different slices. Taking the input speed of 900 rpm for the first-stage transmission pinion in Table 1 and a wear duration of 10 h as an example, the wear condition of the tooth surface after wear is predicted. After 10 h of operation, it is assumed that the meshing tooth surface of all pinions have experienced the same number of 540,000 wear cycles. The results of the wear prediction are shown in Figure 19.
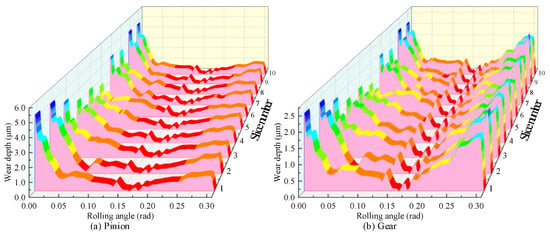
Figure 19.
Wear depth results.
The prediction results in Figure 19 indicate that, considering the effects of temperature and the initial topography of the tooth surface, the wear depth curves for different slices of the same gear tooth exhibit a similar overall trend, with slight differences in wear depth among slices. Wear is more pronounced near the dedendum and addendum of the pinion teeth, particularly at the dedendum. Moving from the dedendum to the addendum, the overall wear decreases, reaching a minimum at a rolling angle of 0.17 rad near the pitch point due to zero relative sliding speed and negligible wear. Significant wear occurs at the critical points of STC and DTC areas, where abrupt changes in gear TVMS cause substantial impacts and increased wear. As meshing continues, wear depth gradually increases towards the addendum. The gear exhibits similar wear patterns at both the addendum and dedendum, but the overall wear is less severe than that on the pinion due to fewer wear cycles experienced by the gear teeth.
Figure 20 illustrates a comparison between the wear prediction approach introduced in this study with a conventional model that omits consideration of IPE and TDE. While both models exhibit similar overall prediction trends and close results, the wear prediction model proposed in this study considers the influence of IPE and TDE, resulting in variations in wear at different positions along the tooth surface. By contrast, the traditional model assumes uniform wear along the tooth width, which deviates from the actual wear patterns observed during gear operation. Therefore, the proposed wear prediction model more accurately reflects real operational conditions, providing more precise calculations.
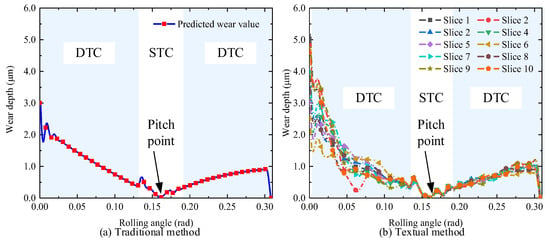
Figure 20.
Wear depth comparison.
3. Experimental Verification
To validate the gear wear prediction model that accounts for tooth surface morphology and temperature changes, gear wear experiments were conducted, as illustrated in Figure 21. The test bench consists of a power module, a drive motor module, a two-stage reducer module, a planetary reducer module, and a magnetic powder brake module. The motor is connected to the two-stage reducer via a coupling, and the gear parameters for the drive system are listed in Table 1. Given the heavy weight of the gear and the numerous teeth, the data volume for processing contour curve measurements is substantial. Therefore, the experiments primarily focused on the first-stage pinion in Table 1. The motor speed is controlled using a power controller, and the magnetic powder brake provides a constant load through a load controller, achieving an input speed of 900 rpm and a torque of 4 N·m for the first-stage pinion of the two-stage reducer, with room temperature maintained at 20 °C. To verify the accuracy of the proposed wear prediction method and expedite the experiment process, the gear wear experiments were conducted under dry friction conditions.
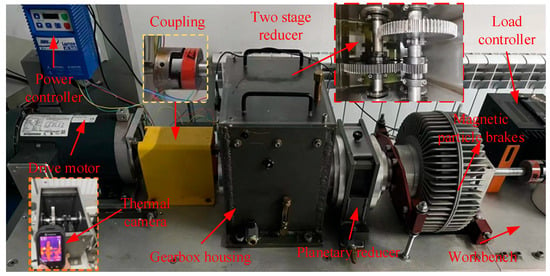
Figure 21.
Experimental bench.
During the operation of the first-stage pinion, data on the rise in tooth surface temperature were collected using a thermal camera. When the speed of the first pinion of the two-stage reducer is 900 rpm and the load is 4 N·m, the net increase in tooth surface temperature fluctuates around the mean value of 2.35 °C after continuous operation for one hour.
The wear experiment was conducted over a total of 40 h. Before the experiment, the gear’s mass was measured, and the tooth surface topography error was extracted. Every 10 h during the wear experiment, changes in gear mass were measured, and the tooth surface topography data were collected. After the experiment, the differences in tooth surface topography before and after wear were calculated.
3.1. Comparative Verification of Wear Mass
In this study, a high-precision electronic scale (model FA224) with a measurement accuracy of 0.0001 g was used to measure the gear mass. Table 4 presents the variations in gear mass. It should be noted that for every ten hours of wear testing, the gear mass was measured five times, and the mean value was calculated.

Table 4.
Gear mass data.
Analysis of the wear experiment indicates that as the test progresses, the gear mass consistently declines, with the rate of reduction decreasing over time. The gear mass changed rapidly during the first 20 h of the wear experiment and more slowly during the subsequent 20 h. During the initial 10 h of the wear test, the gear’s net mass loss amounted to 0.00996 g. Subsequently, every 10 h of continued testing showed a reduction in the gear’s net wear mass. In the last 30 to 40 h of the wear experiment, the net mass of the gear wear was only 0.00514 g.
To evaluate the accuracy of the wear prediction model against experimental data, the predicted wear results for the gear slice were integrated along the gear’s involute to determine the total wear mass of the slice. As illustrated in Figure 22, the wear mass calculation results of the gear wear prediction method proposed in this study were compared with the experiment results.
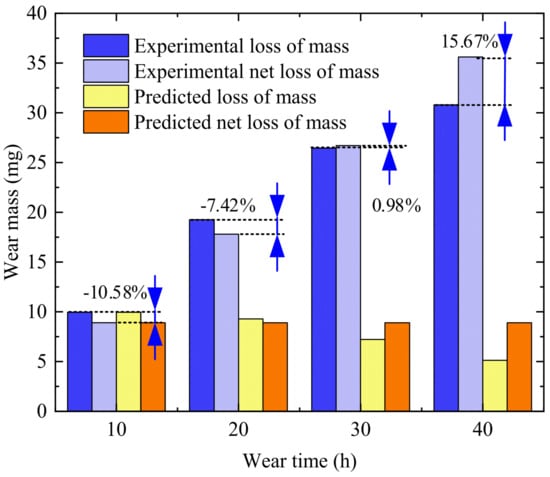
Figure 22.
Mass comparison.
A comparison between the measured and predicted gear wear values reveals that the predicted gear wear values presented in this study closely match the actual measurements obtained from the wear experiment. The wear prediction method proposed in this study obtained gear wear masses of 8.91 mg, 17.81 mg, 26.72 mg, and 35.63 mg at 10, 20, 30, and 40 h, respectively. The actual wear values of the gear measured by the wear experiment are 9.96 mg, 19.24 mg, 26.46 mg, and 30.80 mg, respectively, and the corresponding wear prediction errors are −10.58%, −7.42%, 0.98%, and 15.67%. Overall, the gear wear prediction method proposed in this study is relatively accurate. The discrepancy between the predicted and actual wear results is primarily attributed to the complexity and unpredictability of the wear coefficient’s variation during the actual wear process of the gears. The wear coefficient in the wear prediction model is determined through equivalent experiments and averaged, leading to certain differences between the predicted and actual wear results.
3.2. Comparative Verification of Wear Trends
To validate the trend accuracy of the wear prediction model, a comparison between the predicted tooth surface wear curve and the actual post-wear profile was conducted. Due to the randomness of gear placement during topography measurement, the measured gear profile data before and after wear display different angles and curve heights. Therefore, it is necessary to process the measured gear profile data first. This study uses LROM and MSE to translate, rotate, and truncate the 2D profile data of the tooth surface before and after wear, aligning the tooth profile data points of the same tooth surface. After adjusting the profile curves of the same gear teeth, the error minimization optimization method optimizes the error between the original minimized curve and the worn curve, including height difference and rotation angle. According to the principle of gear meshing, the wear amount at the meshing pitch point can be ignored. Therefore, assuming the wear amount at the meshing pitch point is zero, the profile curves of each gear tooth before and after wear are further processed to ensure they are equal at the pitch point position.
The profile curves of the gear teeth before and after wear were obtained using the aforementioned methods. The difference between the tooth profile curves before and after wear was calculated to determine the wear depth at various positions along the tooth profile, as illustrated in Figure 23a. Considering that all data processing procedures may introduce potential errors, which could affect the specific values of the wear depth results, the wear depth data were normalized by the maximum value for a clearer visualization of the wear trend along the tooth profile. Other data were scaled proportionally. As illustrated in Figure 23b below, this represents the wear curve for different slices of the same gear tooth, measured after 40 h of wear and normalized by the maximum value.
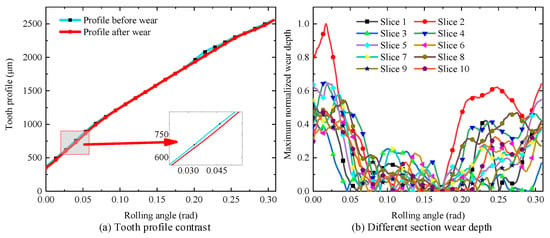
Figure 23.
Wear depth obtained based on the tooth profile.
To effectively demonstrate the wear patterns of the gear tooth, the wear measurements from various slices of the same tooth were averaged. Considering that there may be some variations in the wear amounts of different gear teeth and the large number of teeth on the pinion, this study presents the average wear amounts at various positions on gear teeth 1, 9, 18, and 27 after 40 h of wear to demonstrate the general trend in tooth surface wear. Figure 24a indicates the positions of the gear teeth shown. Figure 24b represents the average tooth surface wear depth curve, normalized by the maximum value, for the four gear teeth after 40 h of wear.
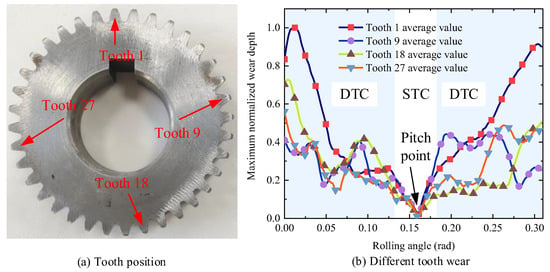
Figure 24.
Average wear at different locations.
Figure 24b shows that the wear trends in the gear teeth at different positions on the pinion are essentially consistent, with deeper wear observed at both the dedendum and addendum of the teeth. This observation aligns with the wear prediction results of the model proposed in this study. Additionally, it is evident that the wear depth varies among different gear teeth, which may be related to the specific position of each gear tooth and the details of their meshing conditions.
The wear depth of the same gear tooth at various stages was normalized relative to the maximum recorded value. Due to the large volume of data and space constraints, this study focuses on gear 1. The average wear curves of gear tooth 1 after 10 h, 20 h, 30 h, and 40 h of wear, normalized to the maximum value, are presented in Figure 25.
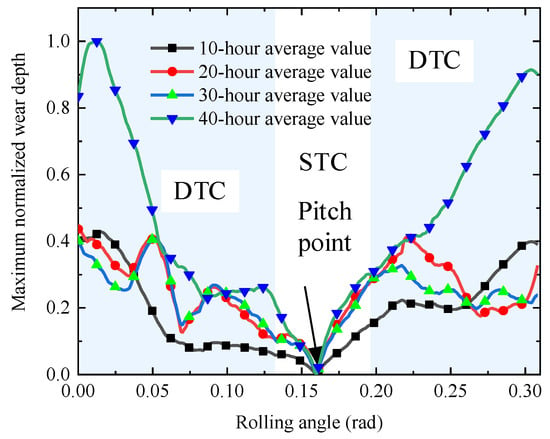
Figure 25.
Average wear of different wear times.
Figure 25 shows that as wear time increases, the depth of tooth wear continuously increases. At 10 h of wear time, the average wear depth of the tooth surface is minimal, with the average wear depth at the dedendum position normalized to 0.4. As the wear experiment progresses, the profile of the gear tooth surface changes, and the wear depth gradually increases. At 40 h, the average wear depth near the dedendum reaches its maximum value of 1.0. Additionally, the wear depth at the same position does not consistently increase with time. After 10 h, the wear depth at the dedendum of gear tooth 1 reaches 0.4. However, at 20 and 30 h, the average wear depth at the dedendum position shows little change. Significant changes in wear are observed at 0.0012 rad and 0.0020 rad on the tooth surface at these times. This validates that when the rolling angle is at the critical point between STC and DTC, the TVMS of the gear experiences a sudden change, resulting in greater impact and wear, consistent with the wear prediction results of this study.
When comparing the initial topography error of the tooth surface, significant errors are generally observed at the dedendum and addendum of the gear tooth, overlapping with regions of pronounced wear. The wear prediction results indicate that variations in wear amounts among different slices of the same gear tooth are influenced by the IPE of the tooth surface. This suggests that the initial topography affects gear tooth wear. Therefore, significant errors in the initial topography may affect gear wear due to the combined interaction of factors such as wear coefficient, load on the tooth surface, and RSD. The IPE can either promote or inhibit wear at the tooth addendum and dedendum.
4. Conclusions
This study introduces a novel gear wear prediction model specifically designed for standard involute spur gears operating under dry friction conditions. The model incorporates the effects of the initial tooth surface profile and temperature variations on the tooth profile. It considers the elastic interactions between adjacent gear teeth, as well as the variations in wear along the width of the tooth. By establishing a coupled relationship between the dynamic model, temperature, and tooth surface morphology, the model achieves a high degree of correlation between gear wear prediction and tooth surface morphology, temperature, and vibration. The reliability of the wear prediction model was validated through experimental wear tests. The detailed findings are summarized below:
- (1)
- The gear multi-factor coupling wear prediction model proposed in this study provides accurate wear prediction results. When compared with experimental results, the model reliably predicted wear mass, and the predicted wear depth along the tooth profile direction aligned with the actual wear trends observed in the experiments.
- (2)
- The initial topography error of the tooth surface affected the wear amount of the tooth surface. IPEs at different positions along the tooth width resulted in similar overall trends for the RSD at these positions, despite some differences. Similarly, while the overall trend in wear across different positions along the tooth width was consistent, subtle variations in wear depth occurred at these positions.
- (3)
- Areas with significant wear at the beginning of the experiment did not necessarily maintain prominent wear throughout the experiment. Once other protruding areas were worn down, it was possible for these initially worn areas to continue to exhibit noticeable wear once other protruding areas had been worn down. Conversely, areas with minimal wear at the start of the experiment could eventually exhibit more significant wear due to their relative protrusion as other areas were worn down.
- (4)
- Significant IPEs were present at the dedendum and addendum of gear teeth due to tool wear and machining equipment accuracy. These errors resulted in larger wear depth at these locations due to the combined effects of the material wear coefficient, load distribution, RSD, and IPE. Thus, the initial topography error can either promote or inhibit wear at the dedendum and addendum.
Author Contributions
J.Z. (Jingqi Zhang): Writing—review and editing, Methodology, Conceptualization. J.Z. (Jianxing Zhou): Writing—original draft, Data curation. Q.C.: Visualization, investigation and review. N.D.: Methodology, software, and review. H.J.: Supervision, validation, and review. Z.F.: Supervision, data collection and charting. All authors have read and agreed to the published version of the manuscript.
Funding
This work was financially supported by the Science and Technology Project of Xinjiang Uygur Autonomous Region (Grant No. 2022B01017-1), the Management Measures for the Central Government to Guide Local Science and Technology Development Funds (Grant No. ZYYD2024QY04), the Changji Prefecture Science and Technology Plan Project (Grant No. 2023Z02), and the Science and Technology Development Project of Xinjiang Uygur Autonomous Region (Grant No. 2022LQ03015).
Data Availability Statement
All data used to represent the results of this present work are available within this paper and upon reasonable request.
Conflicts of Interest
Zhong Fang was employed by Xinjiang Goldwind Science and Technology Co., Ltd. The remaining authors declare that the research was conducted in the absence of any commercial or financial relationships that could be construed as a potential conflict of interest.
References
- Boral, P.; Gołębski, R.; Kralikova, R. Technological Aspects of Manufacturing and Control of Gears—Review. Materials 2023, 16, 7453. [Google Scholar] [CrossRef]
- Jawaz, A.; Sumanta, P.; Padmanav, D. A comprehensive review on design and analysisof spur gears. Int. J. Interact. Des. Manuf. (IJIDeM) 2022, 17, 993–1019. [Google Scholar]
- Mohammed, O.D.; Rantatalo, M. Gear fault models and dynamics-based modelling for gear fault detection—A review. Eng. Fail. Anal. 2020, 117, 104798. [Google Scholar] [CrossRef]
- Chen, L.; Wang, D.; Liu, H.; Cheng, P.; Shao, C. Research on time-variant wear reliability of gear rack. In Proceedings of the 2017 Second International Conference on Electrical Engineering, Mechanical Engineering, and Automation (ICEME), Shanghai, China, 23–24 April 2017; China Academy of Machinery Science & Technology; China Productivity Center for Machinery: Beijing, China, 2017; p. 6. [Google Scholar]
- Aghababaei, R.; Zhao, K. Micromechanics of material detachment during adhesive wear: A numerical assessment of Archard’s wear model. Wear 2021, 476, 203739. [Google Scholar] [CrossRef]
- Sun, Y.; Li, Y.; Zhang, Q.; Qin, X.; Chen, K. Wear analysis and simulation of small module gear based on Archard model. Eng. Fail. Anal. 2023, 144, 106990. [Google Scholar] [CrossRef]
- Antonio Dorini, F.; Sampaio, R. Some results on the random wear coefficient of the Archard model. J. Appl. Mech. 2012, 79, 051008. [Google Scholar] [CrossRef]
- Liu, Y.; Zhang, C.; Zhang, Y.; Wu, J. Dynamic Analysis of High Contact Ratio Spur Gear Considering Surface Wear. Mech. Des. Manuf. 2024, 1–4. [Google Scholar] [CrossRef]
- Zhang, C. Analysis of Influence of Tooth Surface Wear on Dynamics of High Contact Ratio Spur Gear; Hefei University of Technology: Hefei, China, 2022. [Google Scholar] [CrossRef]
- Wang, H.; Tang, L.; Zhou, C.; Shi, Z. Wear life prediction method of crowned double helical gear drive in point contact mixed elastohydrodynamic lubrication. Wear 2021, 484, 204041. [Google Scholar] [CrossRef]
- Cheng, X.P. Study on Tooth Surface Wear of Spur Bevel Gear under Quasi-Static Condition; Fuzhou University: Fuzhou, China, 2019. [Google Scholar] [CrossRef]
- Lian, Z. Study on Wear Characteristics of the Cylindrical Gear with Variable Hyperbolic Circular-arc-Tooth-Trace; Lanzhou University of Technology: Lanzhou, China, 2021. [Google Scholar] [CrossRef]
- Chen, Q. Numerical Investigation on Tooth Surface Wear of a Nutation Drive with Double Circular-arc Spiral Bevel Gears; Fuzhou University: Fuzhou, China, 2021. [Google Scholar] [CrossRef]
- Zhang, S.; Yan, M.; Wang, Y. Interaction between gear surface wear and contact fatigue. J. Tribol. 2023, 145, 081702. [Google Scholar] [CrossRef]
- Chen, Z. Identification of Key Geometric Errors and Control of On-Machine Inspection Errors for CNC Gear Form Grinding Machine Tools; Yangzhou University: Yangzhou, China, 2023. [Google Scholar]
- Wang, Y.; Ma, X.; Zhao, J.; Chen, B.; Wang, Z. Influence of electrical parameters on tooth profile error for of non circular gear WEDM. J. Lanzhou Univ. Technol. 2024, 50, 36–43. [Google Scholar]
- Jing, Y.; Du, X.; Song, C.; Zhu, C.; Liao, D. Design and Tooth Profile Error Analysis of a Rigid Gear-Shaper Cutter with Double-Circular-Arc Harmonic Drive. J. Chongqing Univ. 2021, 44, 60–72. [Google Scholar]
- Litvin, F.L.; Fuentes, A. Gear Geometry and Applied Theory; Cambridge University Press: Cambridge, UK, 2004. [Google Scholar]
- Guo, F.; Fang, Z.D. A new algorithm to solve meshing-in impact considering the measured pitch error and to investigate its influence on the dynamic characteristics of a gear system. Int. J. Precis. Eng. Manuf. 2019, 20, 395–406. [Google Scholar] [CrossRef]
- Luo, Y.; Baddour, N.; Liang, M. Effects of gear center distance variation on time varying mesh stiffness of a spur gear pair. Eng. Fail. Anal. 2017, 75, 37–53. [Google Scholar] [CrossRef]
- Kahraman, A.; Bajpai, P.; Anderson, N. Influence of tooth profile deviations on helical gear wear. J. Mech. Des. 2005, 127, 656–663. [Google Scholar] [CrossRef]
- Sánchez, M.B.; Pleguezuelos, M.; Pedrero, J.I. Influence of profile modification on the transmission error of spur gears under surface wear. Mech. Mach. Theory 2024, 191, 105473. [Google Scholar] [CrossRef]
- Wang, H.; Zhou, C.; Hu, B.; Liu, Z. Tooth wear prediction of crowned helical gears in point contact. Proc. Inst. Mech. Eng. Part J J. Eng. Tribol. 2020, 234, 947–963. [Google Scholar] [CrossRef]
- Wang, H.; Zhou, C.; Lei, Y.; Liu, Z. An adhesive wear model for helical gears in line-contact mixed elastohydrodynamic lubrication. Wear 2019, 426–427 Pt A, 896–909. [Google Scholar] [CrossRef]
- Wang, H.; Zhou, C.; Wang, H.; Hu, B.; Liu, Z. A novel contact model for rough surfaces using piecewise linear interpolation and its application in gear wear. Wear 2021, 476, 203685. [Google Scholar] [CrossRef]
- Zhang, K.; Shen, R.; Hu, Z.; Tang, J.; Sun, Z.; Ning, A.; Yang, S. Dynamic modeling and analysis considering friction-wear coupling of gear system. Int. J. Mech. Sci. 2024, 275, 109343. [Google Scholar] [CrossRef]
- Zhang, B.; Liu, H.; Zhu, C.; Ge, Y. Simulation of the fatigue-wear coupling mechanism of an aviation gear. Friction 2020, 9, 1616–1634. [Google Scholar] [CrossRef]
- Mo, S.; Wang, L.; Hu, Q.; Cen, G.; Huang, Y. Coupling failure dynamics of tooth surface morphology and wear based on fractal theory. Nonlinear Dyn. 2023, 112, 175–195. [Google Scholar] [CrossRef]
- Liu, H.; Liu, H.; Zhu, C.; Tang, J. Study on gear contact fatigue failure competition mechanism considering tooth wear evolution. Tribol. Int. 2020, 147, 106277. [Google Scholar] [CrossRef]
- Li, G.; Wang, Z.H.; Zhu, W.D. Prediction of Surface Wear of Involute Gears Based on a Modified Fractal Method. J. Tribol. 2019, 141, 031603. [Google Scholar] [CrossRef]
- Wang, H. Study on Herringbone Gear Tooth Surface Wear Based on Irreversible Process Thermodynamics; Chongqing Jiaotong University: Chongqing, China, 2022. [Google Scholar] [CrossRef]
- Zhang, X.; Zhong, J.; Li, W.; Bocian, M. Nonlinear dynamic analysis of high-speed gear pair with wear fault and tooth contact temperature for a wind turbine gearbox. Mech. Mach. Theory 2022, 173, 104840. [Google Scholar] [CrossRef]
- Yuan, Z.; Fan, F.; Bai, X. Nonlinear dynamics analysis of a gear system considering tooth contact temperature and dynamic wear. Adv. Mech. Eng. 2022, 14, 16878132221121056. [Google Scholar] [CrossRef]
- Dong, N.; Cui, Q.; Zhou, J.; Tong, R.; Wang, H.; Lu, F. Study on wear evolution of spur gears considering dynamic meshing stiffness. J. Mech. Sci. Technol. 2023, 37, 3393–3408. [Google Scholar] [CrossRef]
- Dong, N.; Zhou, J.; Tong, R.; Cui, Q.; Kong, Y.; Shang, J.; Xiao, S. Study on the coupling relationship between wear and dynamics under steady uniform temperature field of planetary gear system. J. Mech. Sci. Technol. 2023, 37, 6405–6428. [Google Scholar] [CrossRef]
- ISO 1328-1:1995(E); Cylindrical Gears—ISO System of Accuracy—Part 1: Definitions and Allowable Values of Deviations Relevant to Corresponding Flanks of Gear Teeth: 1st ed. International Organization for Standardization: Geneva, Switzerland, 1995; pp. 1–27.
- Xie, C.; Hua, L.; Han, X.; Lan, J.; Wan, X.; Xiong, X. Analytical formulas for gear body-induced tooth deflections of spur gears considering structure coupling effect. Int. J. Mech. Sci. 2018, 148, 174–190. [Google Scholar] [CrossRef]
- Xie, C.; Hua, L.; Lan, J.; Han, X.; Wan, X.; Xiong, X. Improved analytical models for mesh stiffness and load sharing ratio of spur gears considering structure coupling effect. Mech. Syst. Signal Process. 2018, 111, 331–347. [Google Scholar] [CrossRef]
- Muskhelishvili, N.I. Some Basic Problems of the Mathematical Theory of Elasticity; Springer: Dordrecht, The Netherlands, 1953. [Google Scholar]
- Aydoğan, M.Ö. Dynamic Modelling and Analysis of Split-Torque Face-Gear Systems. Ph.D. Thesis, Middle East Technical University, Ankara, Turkey, 2022. [Google Scholar]
- Wang, Q.; Xu, K.; Huai, T.; Ma, H.; Wang, K. A mesh stiffness method using slice coupling for spur gear pairs with misalignment and lead crown relief. Appl. Math. Model. 2021, 90, 845–861. [Google Scholar] [CrossRef]
- Chen, R.; Zhang, J.; Zhou, J. Study on the meshing stiffness of spur gear considering contact characteristic of tooth surface. Mech. Transm. 2016, 40, 43–47, 53. [Google Scholar] [CrossRef]
- Wang, S.; Xieeryazidan, A.; Zhang, X.; Zhou, J. An improved computational method for vibration response and radiation noise analysis of two-stage gearbox. IEEE Access 2020, 8, 85973–85988. [Google Scholar] [CrossRef]
- ASTM G77-98; Standard Test Method for Ranking Resistance of Materials to Sliding Wear Using Block-on-Ring Wear Test. ASTM International: West Conshohocken, PA, USA, 2010.
Disclaimer/Publisher’s Note: The statements, opinions and data contained in all publications are solely those of the individual author(s) and contributor(s) and not of MDPI and/or the editor(s). MDPI and/or the editor(s) disclaim responsibility for any injury to people or property resulting from any ideas, methods, instructions or products referred to in the content. |
© 2024 by the authors. Licensee MDPI, Basel, Switzerland. This article is an open access article distributed under the terms and conditions of the Creative Commons Attribution (CC BY) license (https://creativecommons.org/licenses/by/4.0/).