Article

Effect of Roller Burnishing and Slide Roller Burnishing on Surface Integrity of AISI 316 Steel: Theoretical and Experimental Comparative Analysis

1
Department of Material Science and Mechanics of Materials, Technical University of Gabrovo, 5300 Gabrovo, Bulgaria
2
Department of Mechanical Engineering Equipment and Technologies, Technical University of Gabrovo, 5300 Gabrovo, Bulgaria
3
Department of Industrial Design and Textile Engineering, Technical University of Gabrovo, 5300 Gabrovo, Bulgaria
*
Author to whom correspondence should be addressed.
Machines 2024, 12(1), 51; https://doi.org/10.3390/machines12010051
Submission received: 12 December 2023 / Revised: 30 December 2023 / Accepted: 9 January 2024 / Published: 11 January 2024
(This article belongs to the Special Issue Recent Advances in Surface Processing of Metals and Alloys)

Abstract

:
The article presents a new method called slide roller burnishing (SRB) for the cold working of cylindrical surfaces on machine tools implemented with a novel multi-functional device. The machined material is chromium–nickel austenitic stainless steel. The deforming element is a toroidal roller whose axis crosses that of the workpiece. As a result, a relative sliding velocity occurs in the contact zone between the roller and the machined surface. The sliding velocity vector is set using the burnishing device. The theoretical background of SRB is presented. When the two axes are parallel, the well-known roller burnishing (RB) method is implemented. Thus, RB is a special case of SRB. Both processes are realized using the multi-functional burnishing device. The RB process was studied experimentally and optimized according to three criteria, based on the relationship between the surface integrity and operating behavior of the respective component, to achieve three processes: smoothing, hardening, and mixed burnishing. Using the optimal RB parameters obtained, the dependence of the results of SRB on the crossing angle was investigated and optimized. A comparative analysis was performed between the optimized RB and SRB processes (respectively for their three variants: smoothing, hardening, and mixed) based on geometrical and physical–mechanical characteristics of the surface integrity. The main advantage of the SRB is that it provides smaller height roughness parameters (improvement by 42%) and a higher surface microhardness (improvement by 7%) than RB.

1. Introduction

One of the methods used for the finishing processing of metal components is static surface cold working (SCW), based on plastic deformation of the surface and near-subsurface layers. SCW reduces the height parameters of roughness, increases the surface microhardness, and introduces compressive residual stresses (RSs) at a depth of approximately 0.8 mm [1]. Any method implementing static SCW is a type of burnishing method and includes one or more deforming elements that perform a relative movement toward the machined surface and have a hardness much greater than that of the surface [2]. According to the type of contact between the deforming element and the treated surface, burnishing methods fall into two groups: with sliding friction contact or with rolling contact. The slide burnishing (SB) method is implemented via sliding contact, whereas roller burnishing (RB) and ball burnishing (BB) are implemented via rolling contact (Figure 1). The deforming elements for RB and BB are, respectively, rollers (the working surface is usually cylindrical, barrel-shaped, or toroidal) and balls. Both methods implement one of two processes: roller burnishing or deep rolling, according to the Ecoroll classification [1]. The aim of the former process is a strong reduction of the height parameters to achieve a mirror-like surface. The latter process aims primarily at maximum strain hardening, resulting in maximum surface microhardness and maximum compressive RS distributed to maximum depth from the surface layer. The choice of process (roller burnishing or deep rolling) depends on the desired operational behavior of the respective metal component in accordance with the known relationship between the finishing, the surface integrity, and the operating behavior [3]. The SB method, depending on the processed material and the purpose of the corresponding metal component, can also implement different processes: smoothing, hardening, or mixed [4].
Few studies have focused on comparing SB, RB, and BB according to the criteria of surface integrity characteristics and operational behavior of components processed using these methods. An extensive study and comparison of SB (implemented with a spherical-ended diamond insert) with RB and deep rolling processes was carried out in [5], in which they were used to process unhardened 41Cr4 steel. It was found that SB (with a burnishing force of 300 N) achieves lower roughness, higher surface microhardness, and higher fatigue strength at room temperature than RB (300 N) and deep rolling (1300 N) processes at equal governing factors (except for burnishing force). Due to sliding friction contact, SB achieves greater equivalent plastic deformation of the surface and near-subsurface layers, which causes greater strain hardening. As a result, the surface microhardness and introduced compressive RS (in absolute value) are greater, leading to greater (low-, high-, and mega-cycle) fatigue strength. However, these beneficial effects of SB are most pronounced for unhardened steel components operating under normal service conditions. At high temperatures, RS relaxation is decisive. For example, in an AISI 304 steel component, the compressive RS (measured for both the austenitic and martensitic phases due to the presence of strain-induced α′-martensite) introduced by SB with a spherical-ended diamond insert is reduced from 50% to 0% from the surface layer to a depth of up to 0.1 mm after heating at a temperature of 450 °C for two hours [6]. At greater depth, the RS distribution remains nearly constant. To increase the fatigue life of hardened steel components operating at high temperatures, low-plasticity burnishing (LPB) with dynamic adaptive control was developed [7]. The LPB process is implemented using the BB method with a hydrostatic sphere, but the equivalent plastic strain of the surface layer is kept below 5%. Thus, the introduced RS remains stable even at a temperature of 600 °C [8,9]. However, the present study focuses on the burnishing of components operating at normal temperatures and, in particular, chromium–nickel austenitic stainless steel operating at a temperature below 350 °C, given the propensity of these steels to intergranular corrosion, as well as the so-called “brittleness at 475 °C” [10].
Numerous authors have conducted extensive research on using conventional burnishing technologies to improve the surface integrity and operating behavior of chromium–nickel austenitic stainless steels. For instance, RB was employed to improve the surface integrity and wear resistance of 316L steel components [11], and to finish the surfaces of holes in 304 steel [12]. Improvement of the corrosion behavior of 304L steel by a hybrid process (RB and cryogenic cooling) was demonstrated in [13]. The effects of BB with a hydrostatic sphere, implemented with a deep rolling process, on the fatigue behavior of 304 steel specimens were studied in [14,15,16,17,18,19]. Nanostructuring BB with a hydrostatic ball of 316L steel was implemented in [20]. BB with a hydrostatic sphere was applied in [21] to improve the wear resistance of 316L steel. Improvement of the surface integrity of 317 and 321 steel components via SB was demonstrated in [22,23,24,25]. The effect of SB on the fatigue strength of 304 steel was investigated in [6].
In the conventional RB method, the motion of the deforming roller relative to the machined surface is a superposition of pure rolling and rectilinear translation parallel to the workpiece axis. Thus, the contact spot (between the deforming element and workpiece) moves along a helical line described on the surface being burnished. The angle of inclination of the screw line depends only on the diameter of the workpiece and the feed rate. Similarly, in the SB method, the tip of the deforming diamond (or other hard material) insert moves in a helical line along the treated surface. The kinematics of both methods (RB and SB) greatly limit their ability to create different surface textures. However, if the axis of the deforming roller with a toroidal working surface crosses the workpiece axis, a relative sliding velocity will occur between the roller and the machined surface. The magnitude and direction of this velocity can be varied widely by adjusting the crossing angle. Thus, SB is implemented instead of the familiar RB method. The new method is called slide roller burnishing (SRB). The present study provides a theoretical and experimental comparison of RB and SRB processes. The objects of comparison are the main characteristics (roughness, microhardness, and RS) of the surface integrity of processed AISI 316 steel cylindrical samples. Figure 2 shows a flow chart of the investigations.

2. Theoretical Background

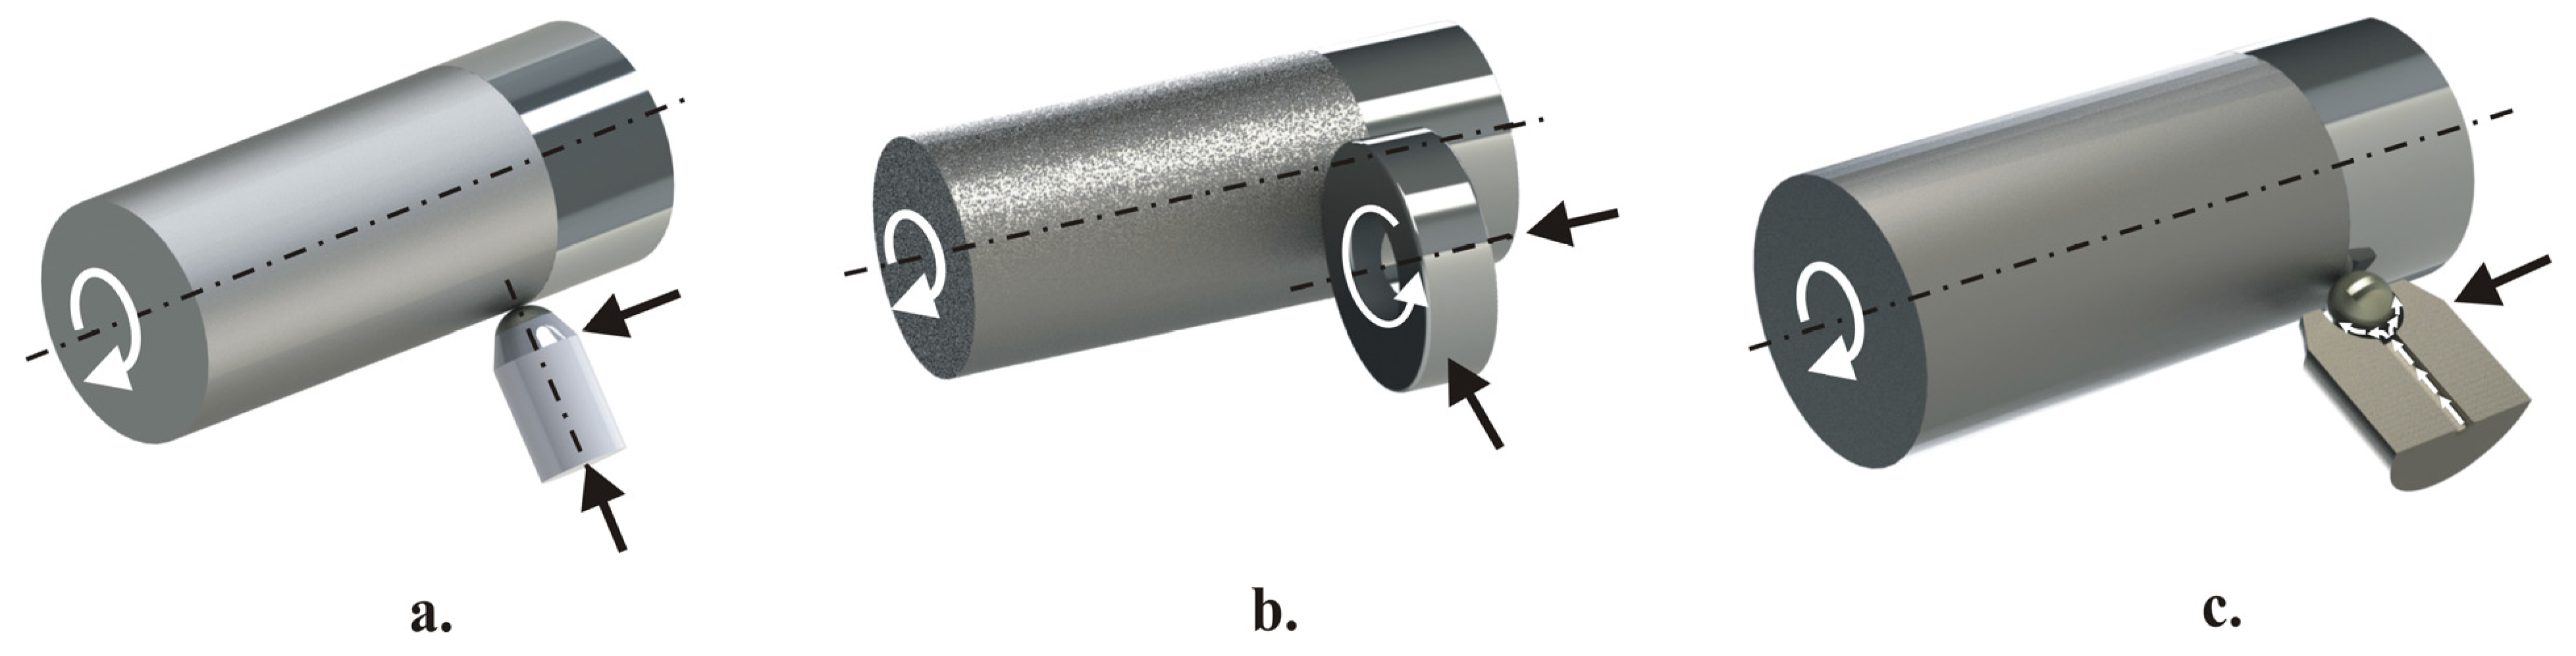
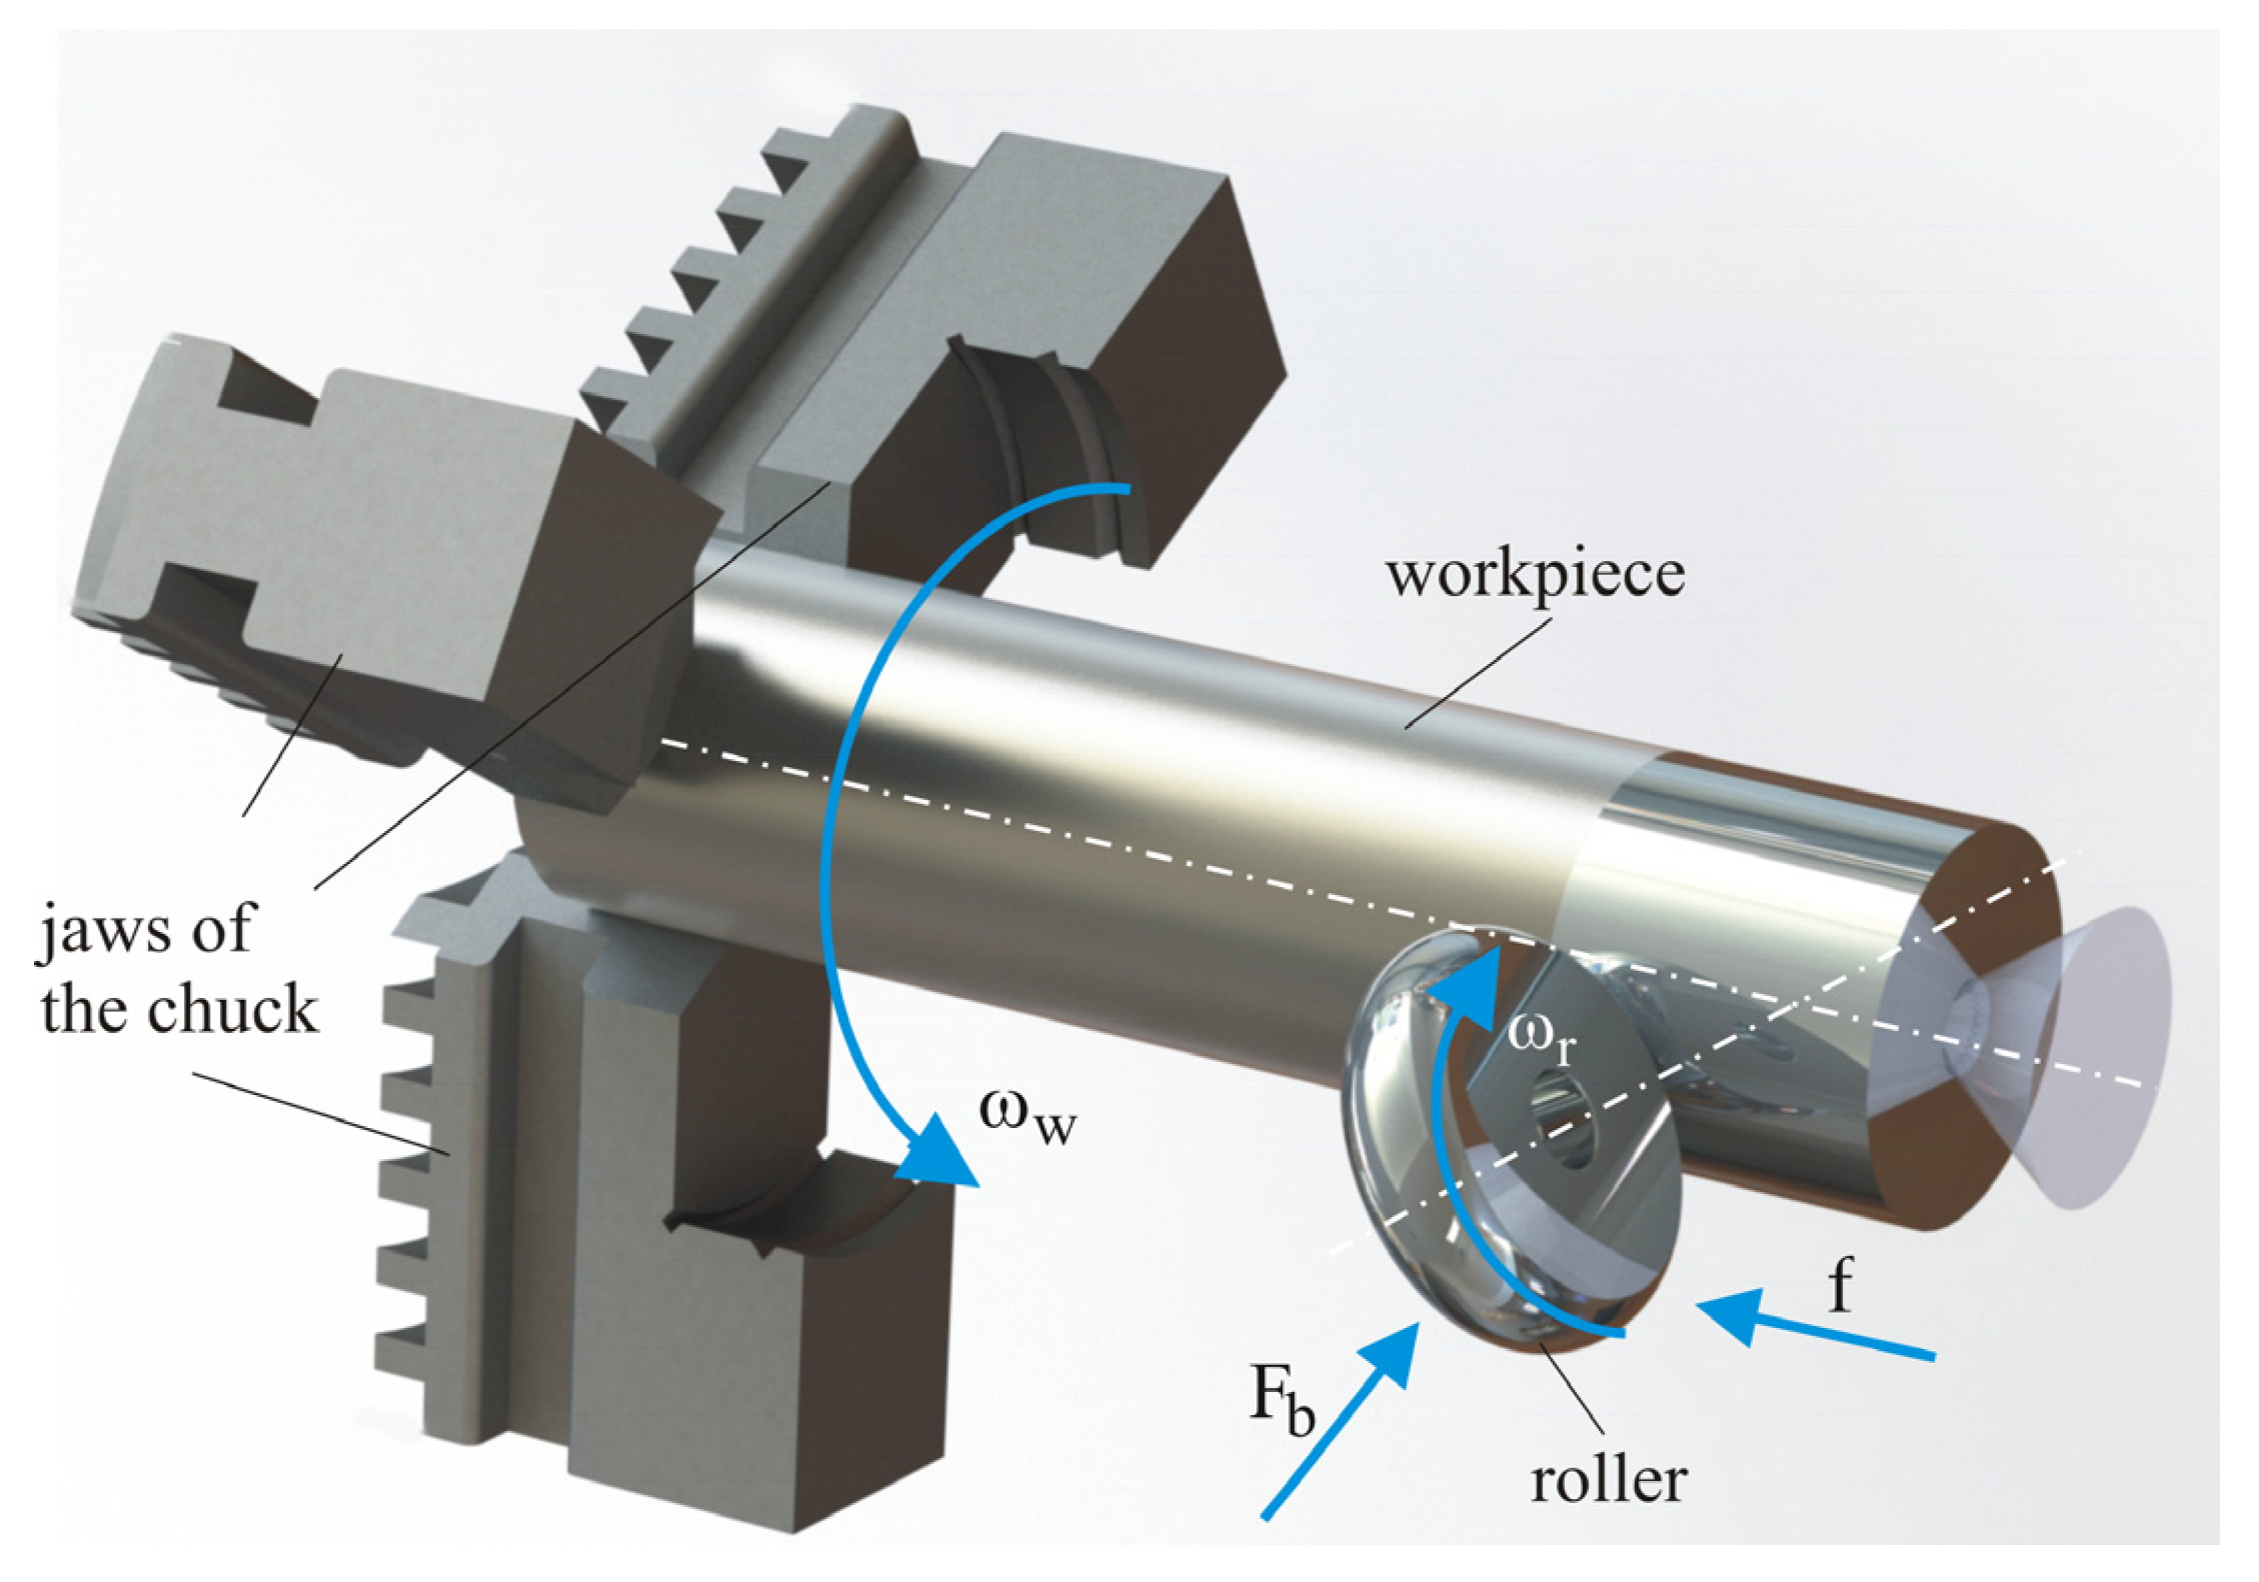
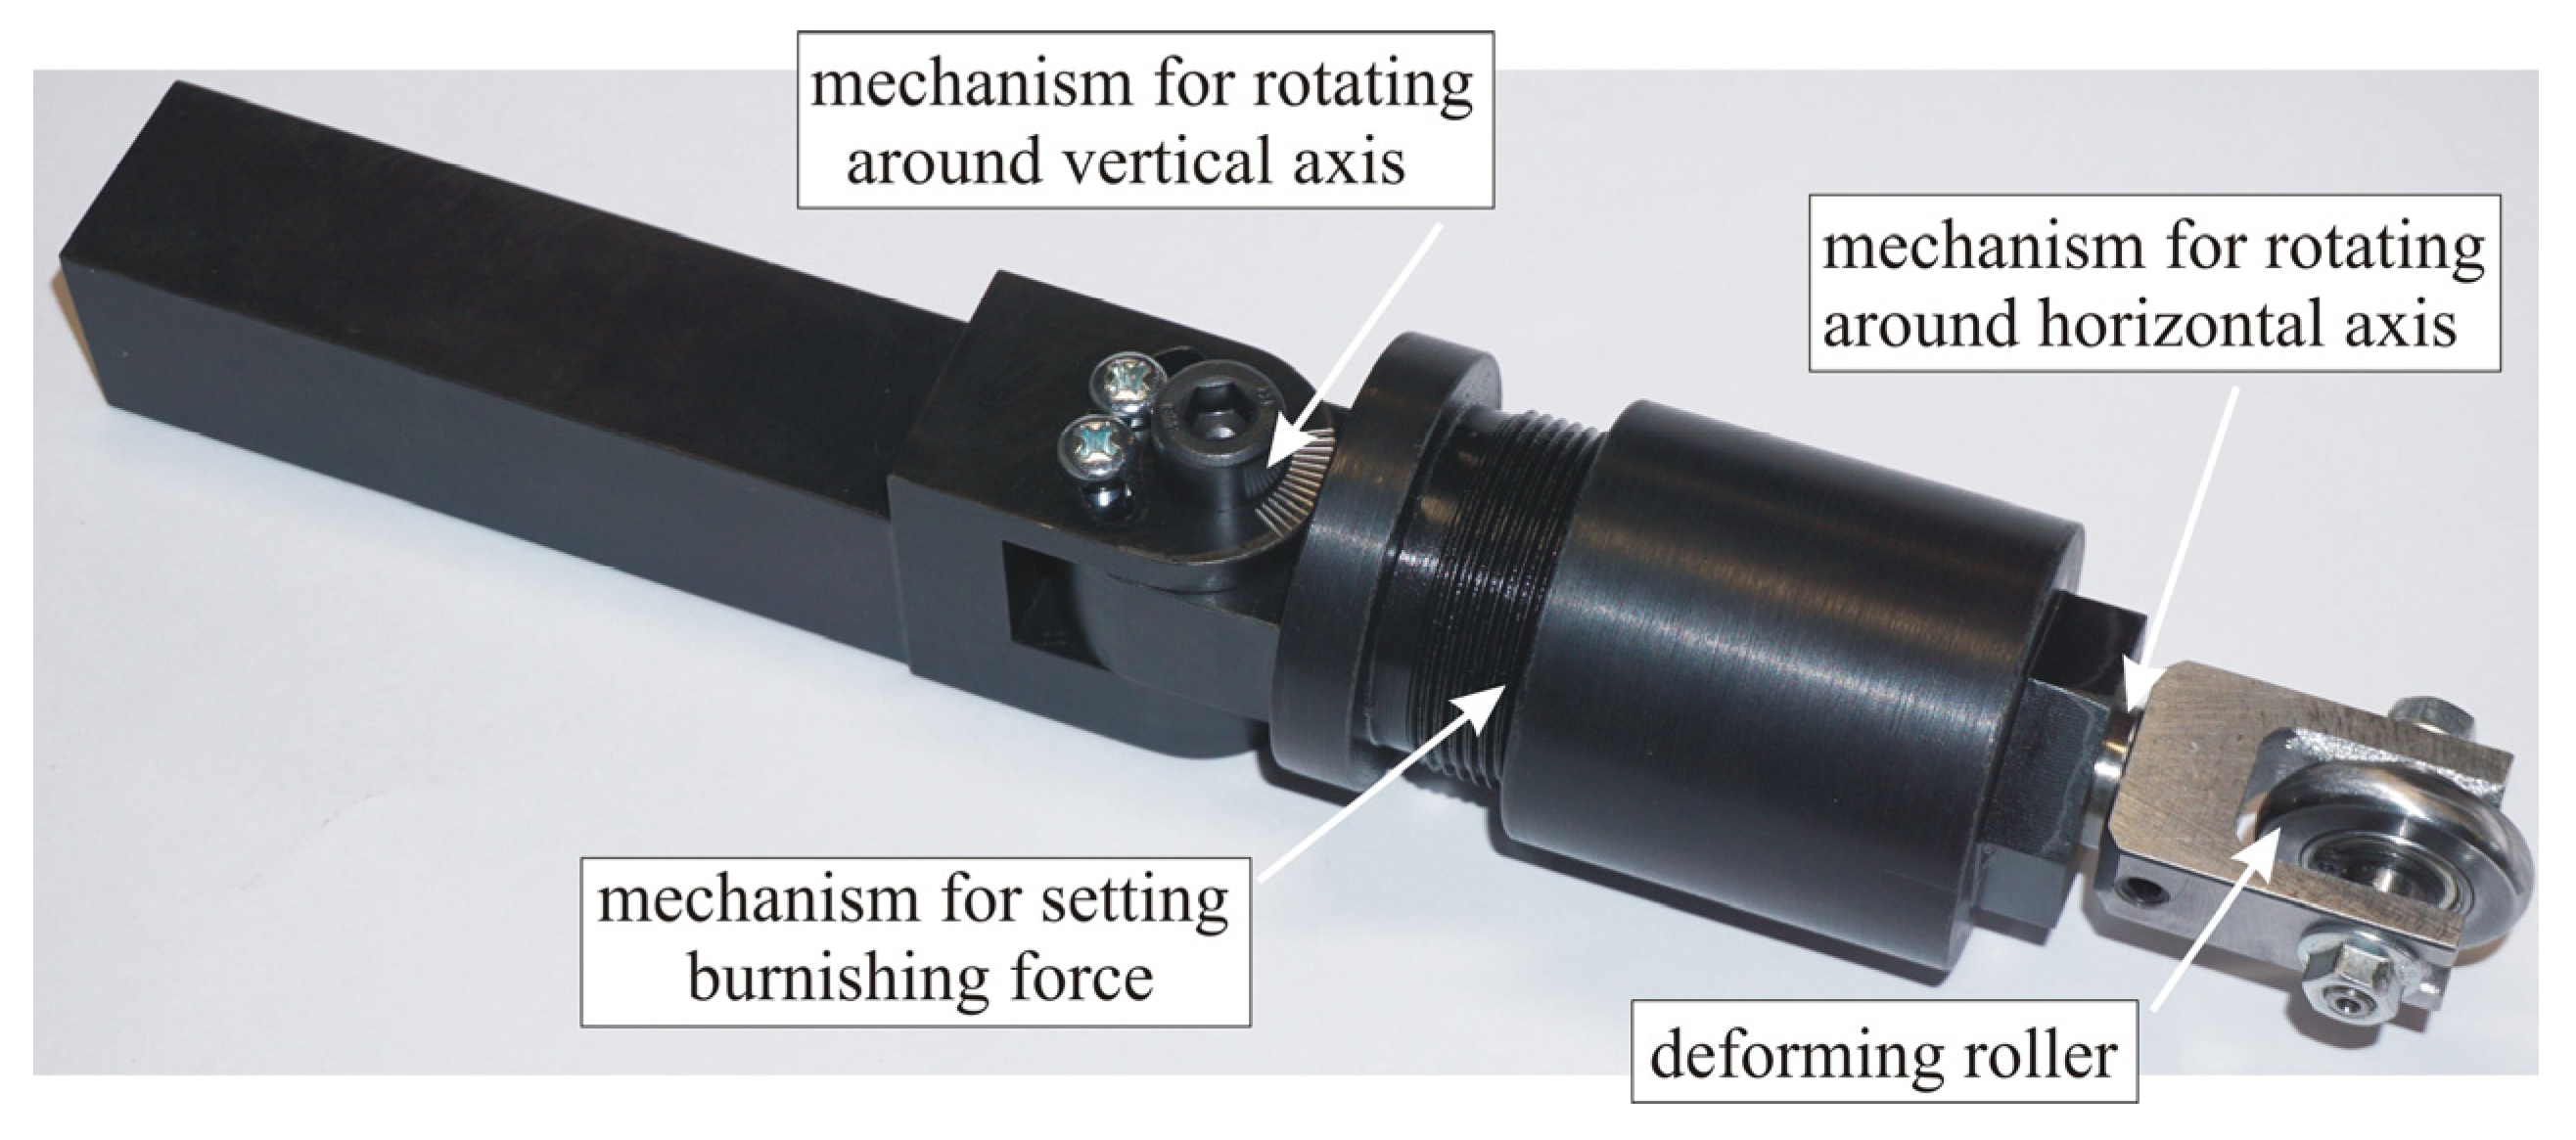
2.1. Implementation of SRB

The implementation of the SRB process on a lathe is shown in Figure 3. The workpiece, driven by the machine spindle, rotates about its own axis with an angular velocity ω w . The deforming toroidal roller is pressed against the workpiece with a force (the burnishing force) in a direction perpendicular to the axis of the workpiece. The axis of the deforming roller crosses the axis of the workpiece at an angle α , such that 0° < α < 90° (see Figure 4). As a result of the contact between the roller and the machined surface, the roller rotates around its own axis with an angular velocity ω r . The feed movement is carried out by the roller, which moves translationally, parallel to the axis of the workpiece.

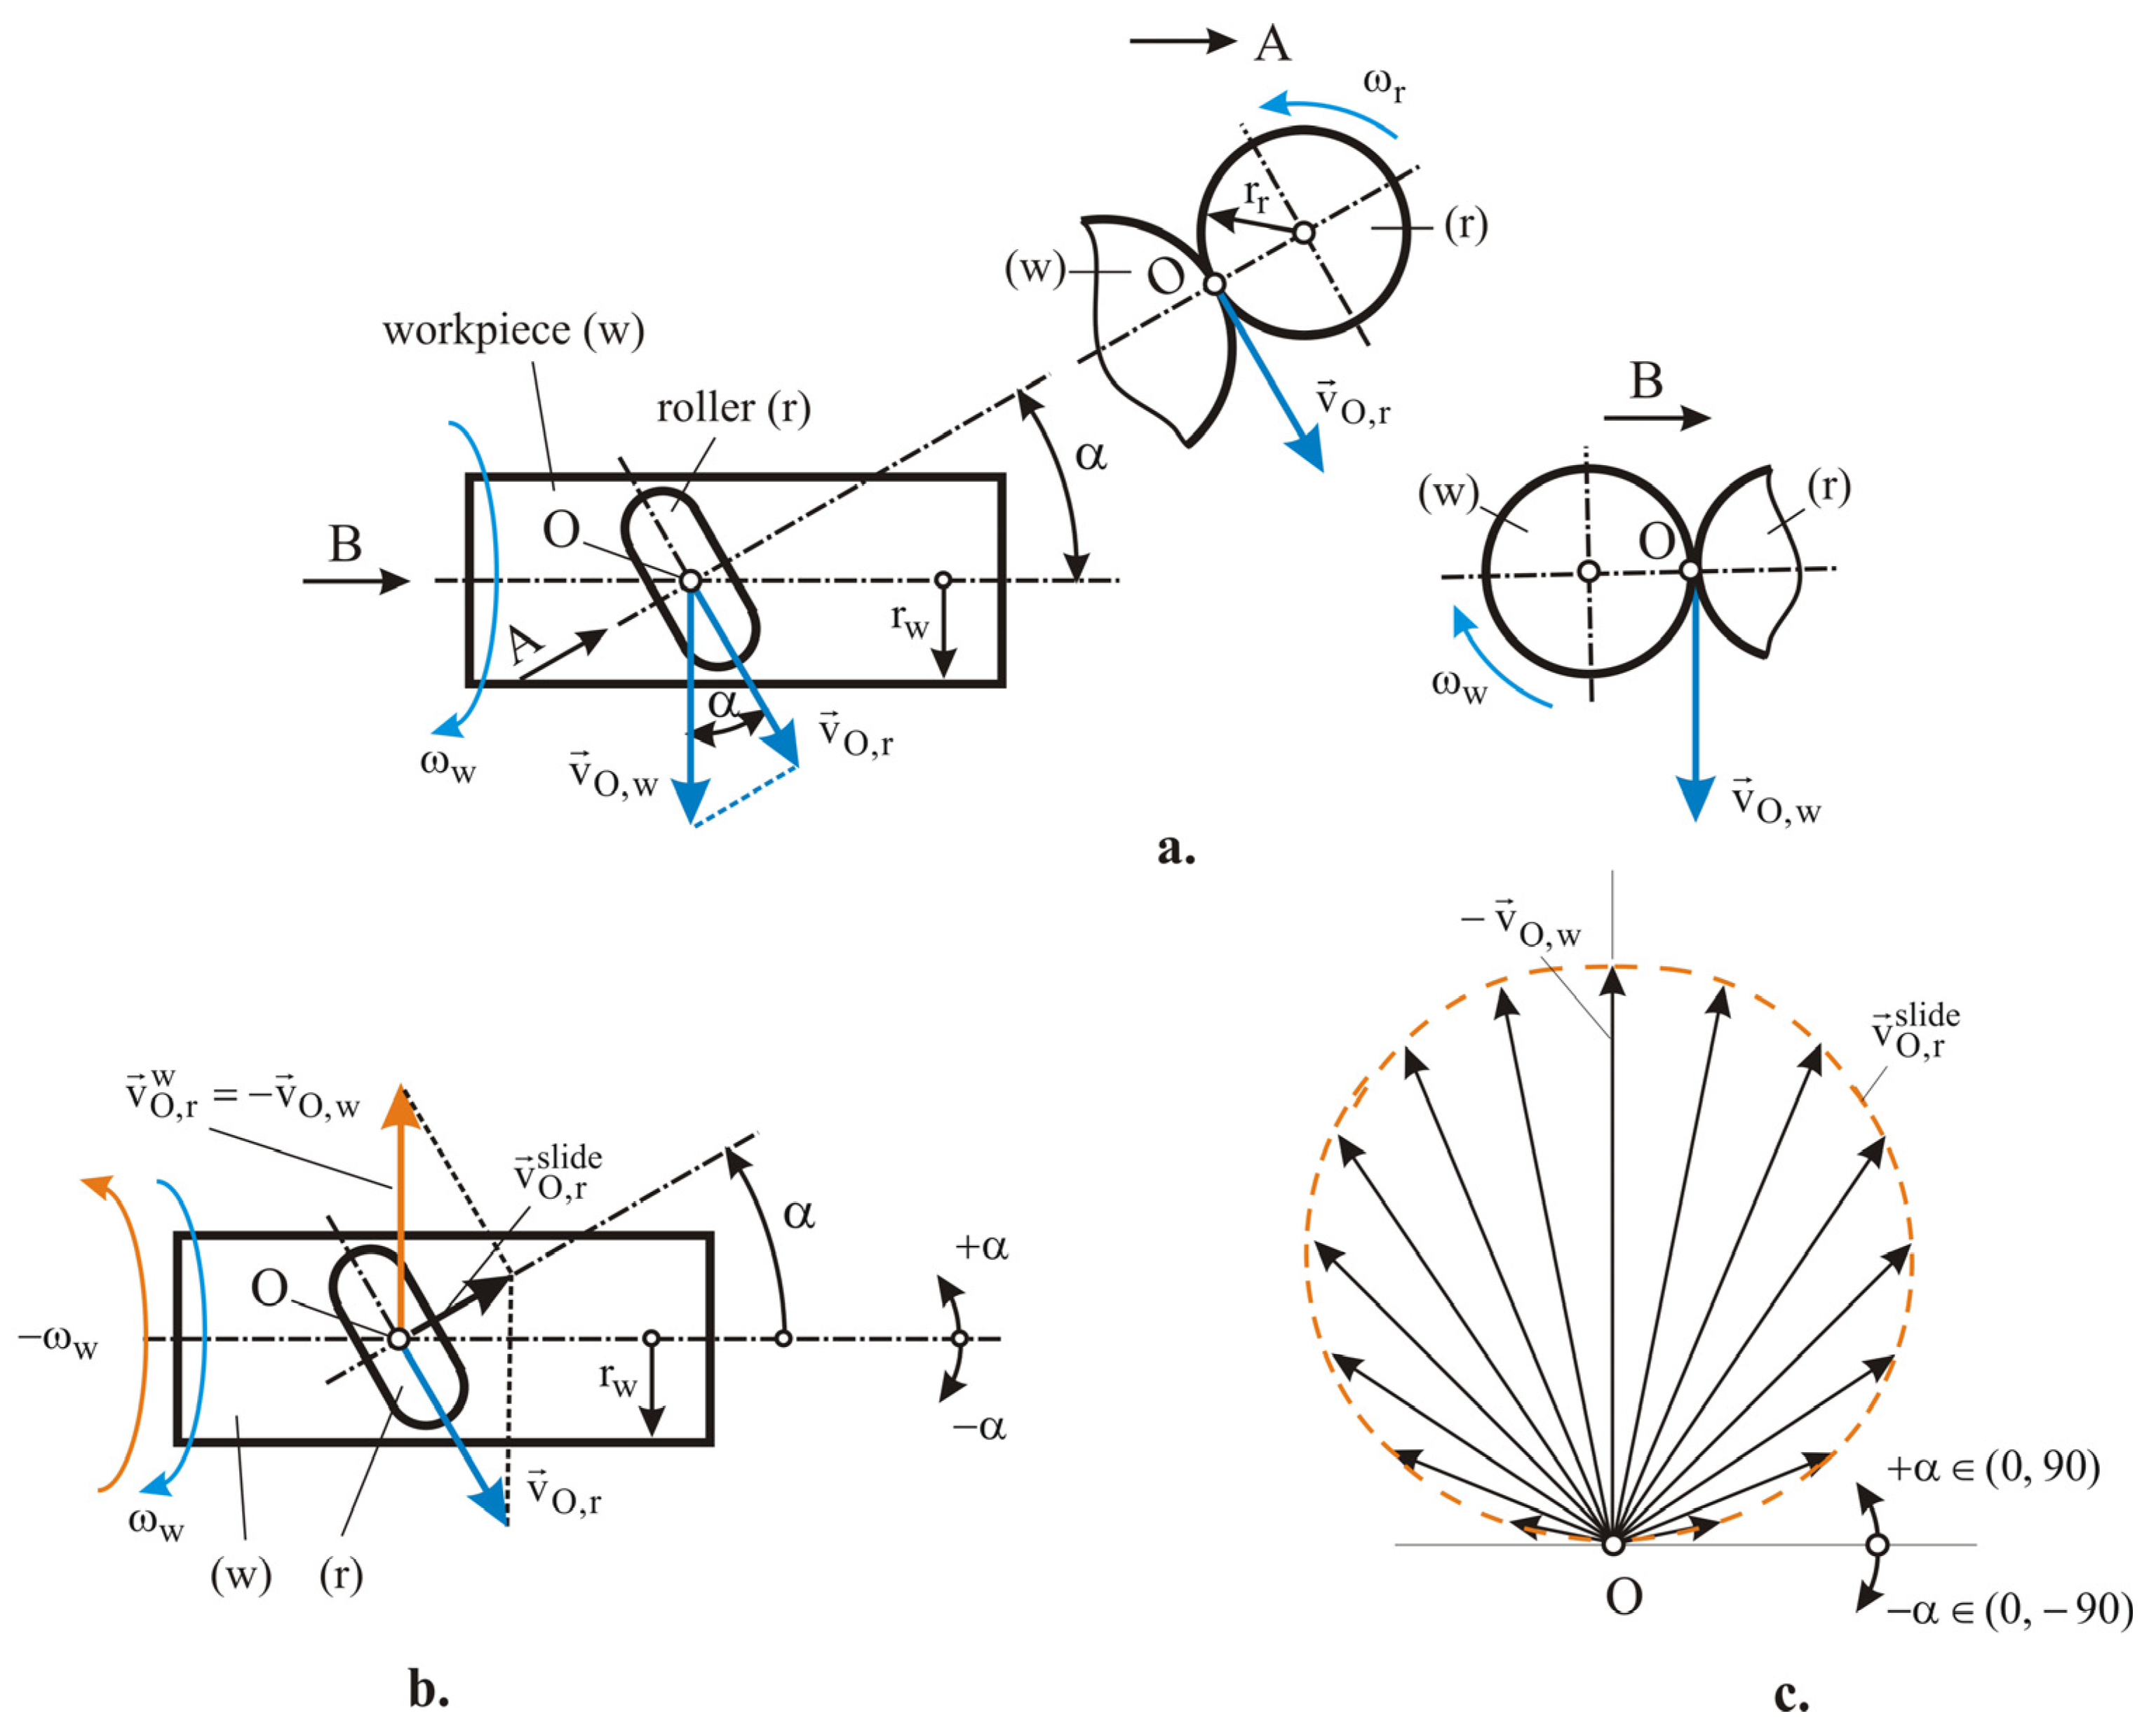
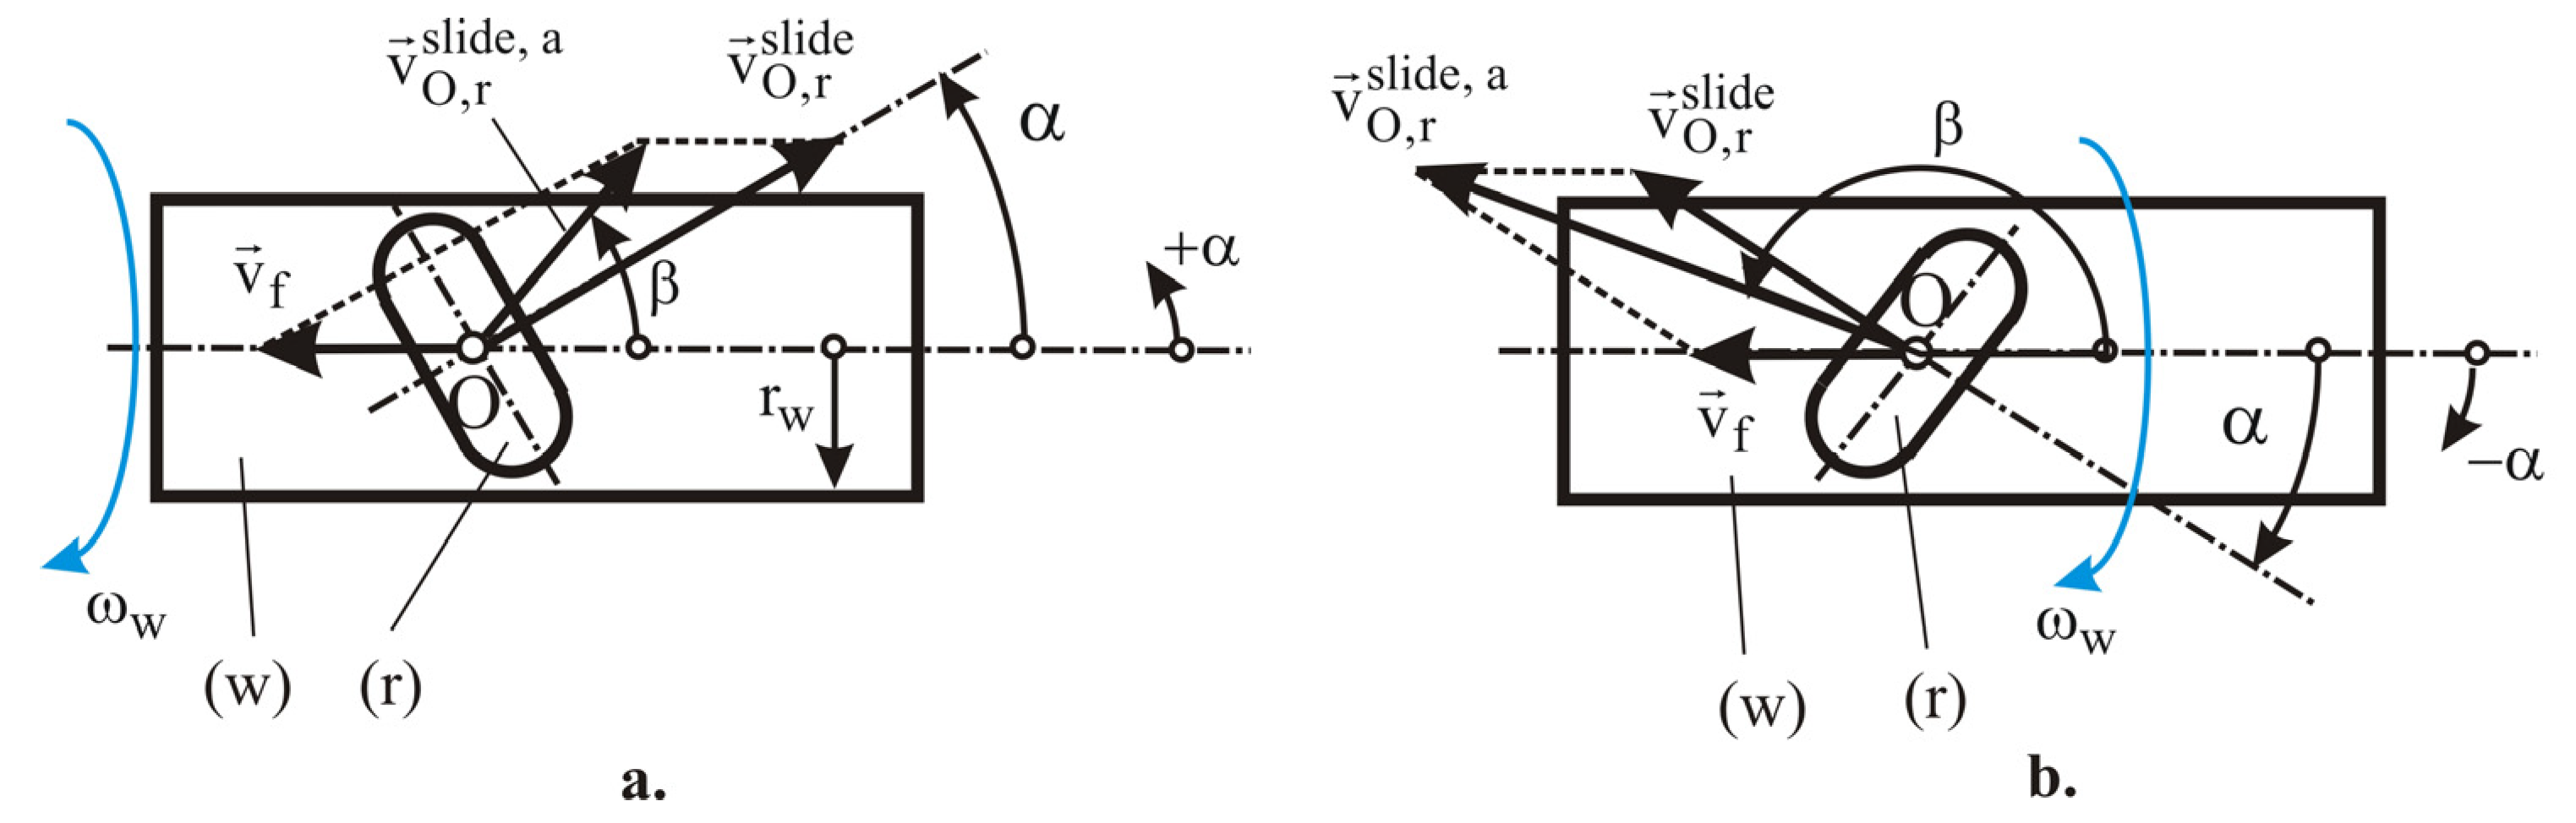
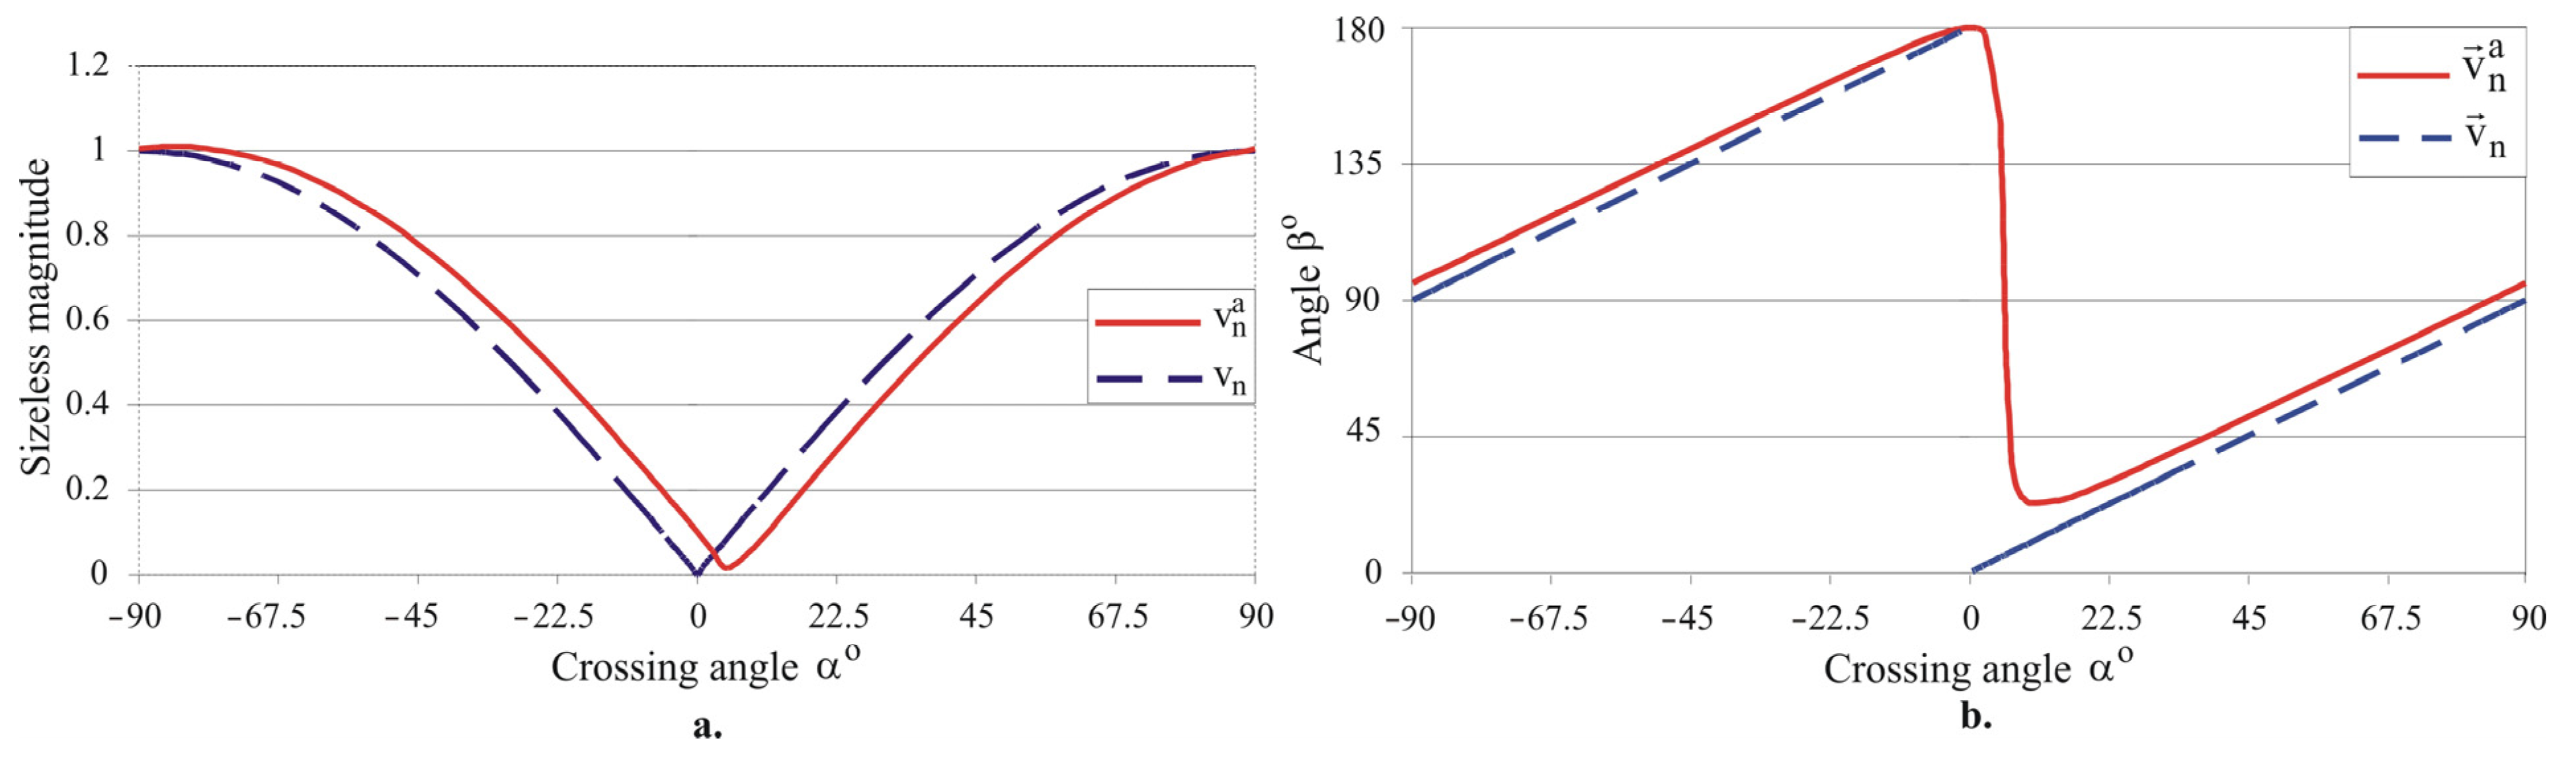
2.2. Kinematics of the Main Motion of SRB

The kinematics of the main motion of the SRB method (when the feed motion is turned off) are shown schematically in Figure 4a. Point O is the center of contact between the deforming roller r and the workpiece (w). The velocity of point O, considered as a point on the periphery of the workpiece, has magnitude
v O , w = ω w r w ,
where r w is the workpiece radius. The magnitude of the velocity of point O, considered as a point on the equatorial circle of the toroidal surface of the roll, is
v O , r = ω r r r ,
where r r is the radius of the equatorial circle. The relationship between the magnitudes of the two velocities is
v O , r = v O , w cos α .
If an angular velocity ω w is imparted to the deforming roll–workpiece system (Figure 4b), the workpiece will be stationary and the deforming roller will rotate about the axis of the workpiece with an angular velocity ω w , whereby it will simultaneously rotate about its own axis with an angular velocity ω r . Then, the velocity of point O belonging to the deforming roller is a vector sum of two components:
v O , r s l i d e = v O , w + v O , r ,
The resulting vector v O , r s l i d e is the sliding velocity of the roller relative to the workpiece. From the velocity triangle (Figure 4b), it follows for the magnitude of the sliding velocity that
v O , r s l i d e = v O , w sin α .
The slide velocity magnitude diagram is shown in Figure 4c. When α = 0°, the axes of the workpiece and the roller are parallel. The roller performs clean rolling (without slipping) with respect to the machined surface of the workpiece, i.e., the method implemented is RB. When α = ± 90°, the workpiece and roll axes are orthogonally crossed, the roller is stationary, and the sliding velocity is maximal in magnitude: it is equal to the speed of a peripheral point of the workpiece. In this case, the SB method is performed. For all other cases (0° < α < 90°), the SRB method is implemented. Therefore, the RB and SB method are both special cases of the SRB method.

2.3. Kinematics of SRB with Feed Motion Included

The kinematics of the SRB method with feed motion included are shown schematically in Figure 5.
The velocity v f of the roller during the feed motion has a magnitude
v f = n f ,
where n is the frequency of rotation of the workpiece (the number of revolutions per unit time) and f is the feed rate (the displacement per revolution). The absolute sliding velocity v O , r s l i d e , a is the vector sum
v O , r s l i d e , a = v O , r s l i d e + v f .
For brevity, the sliding velocities v O , r s l i d e and v O , r s l i d e , a are denoted by v and v a , respectively. For their magnitudes, it follows that
v O , r s l i d e = v ,
v O , r s l i d e , a = v a .
Taking into account (5), (8) and (9), and the geometrical dependences shown in Figure 4, for the magnitude of the absolute sliding velocity, it follows that
v a = v O , w 2 sin 2 α + v f 2 v O , w v f sin 2 α .
It is appropriate to normalize v and v a to unity:
v n = v v O , w = sin α ,
v n a = v a v O , w = sin 2 α k v sin 2 α + k v 2 ,
where (taking into account that ω w = π n 30 )
k v = v f v O , w = 30 f π r w .
The angle β between the absolute sliding velocity vector v a and the workpiece axis is:
β = arccos v cos α v f v a = arccos sin α cos α k v sin 2 α k v sin 2 α + k v 2 .
Figure 6 shows the change in the magnitudes of the absolute sliding velocity v a and sliding velocity v depending on the crossing angle α when f = 0.1 m m / r e v and r w = 9.55 m m . The following conclusion can be drawn: excluding the small crossing angles ( 0 < α 5°), the feed motion has little effect on the magnitude and direction of the sliding velocity v , i.e., the absolute sliding velocity v a is not significantly different from the sliding velocity v . The difference decreases with decreasing feed f and workpiece radius r w ; see (11)–(13).
It should be noted that in the known implementations of SB (with spherical- or cylindrical-ended diamond or another material), the sliding velocity v is always perpendicular to the workpiece axis, which limits the range of surface textures that can be obtained. In contrast to SB, SRB allows the variation of the angle β within a wide range, and hence a greater variety of surface textures.

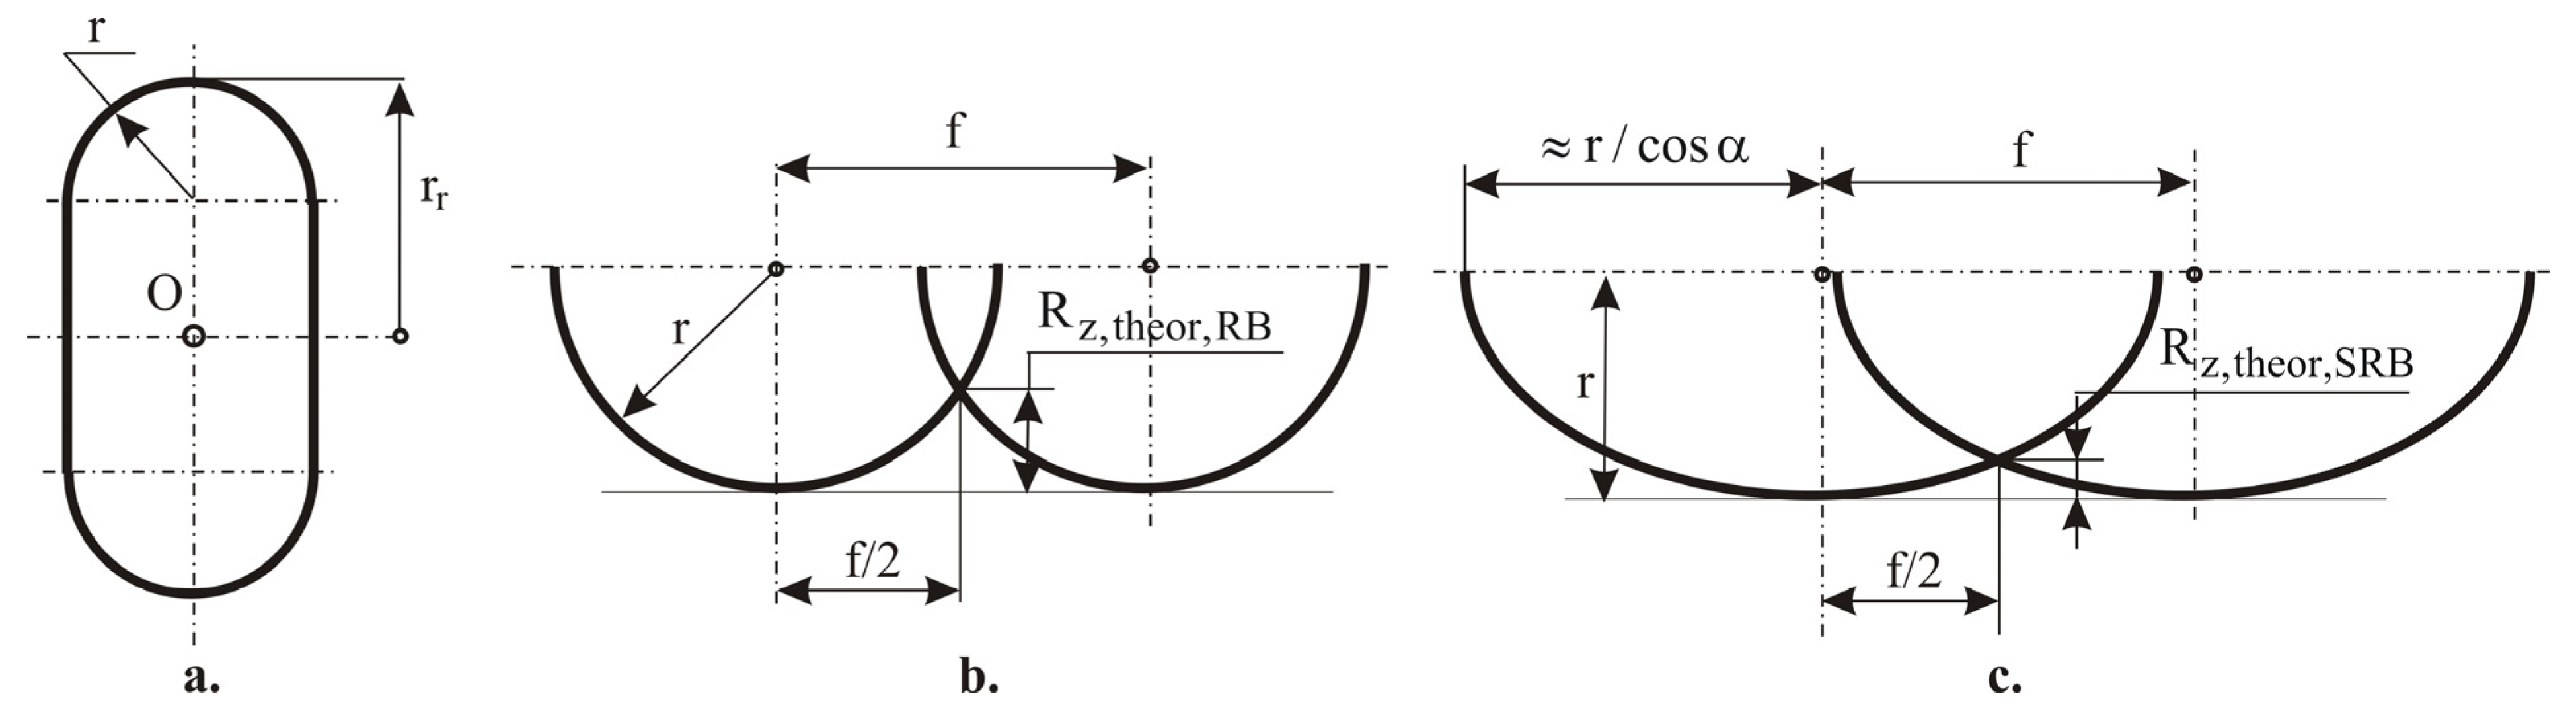
2.4. Theoretical Roughness

The so-called kinematic (theoretical) surface roughness depth R z , t h e o r is defined based on two consecutive positions of the deforming roller for one complete rotation of the workpiece around its axis (Figure 7). The distance, measured along the axis of the workpiece, between the two positions of the roll is numerically equal to the feed rate f. The theoretical surface roughness depth at the RB process is
R z , t h e o r , R B f 2 8 r .
where r is the radius of the working toroidal surface of the deforming roller and f is the feed rate.
When the axes of the deforming roller and the workpiece are crossed, the section of the working toroidal surface of the deforming roller with a plane containing the axis of the workpiece is, to a first approximation, an ellipse with a major semi-axis a = r cos α and a minor semi-axis b = r . Then, the theoretical surface roughness depth for the SRB process is:
R z , t h e o r , S R B f cos α 2 8 r .
Comparing (15) and (16) shows that, for the same magnitudes of the governing factors of the two processes and the same roller geometry, SRB achieves smaller integral roughness height parameters.

3. Experimental Setup and Conditions
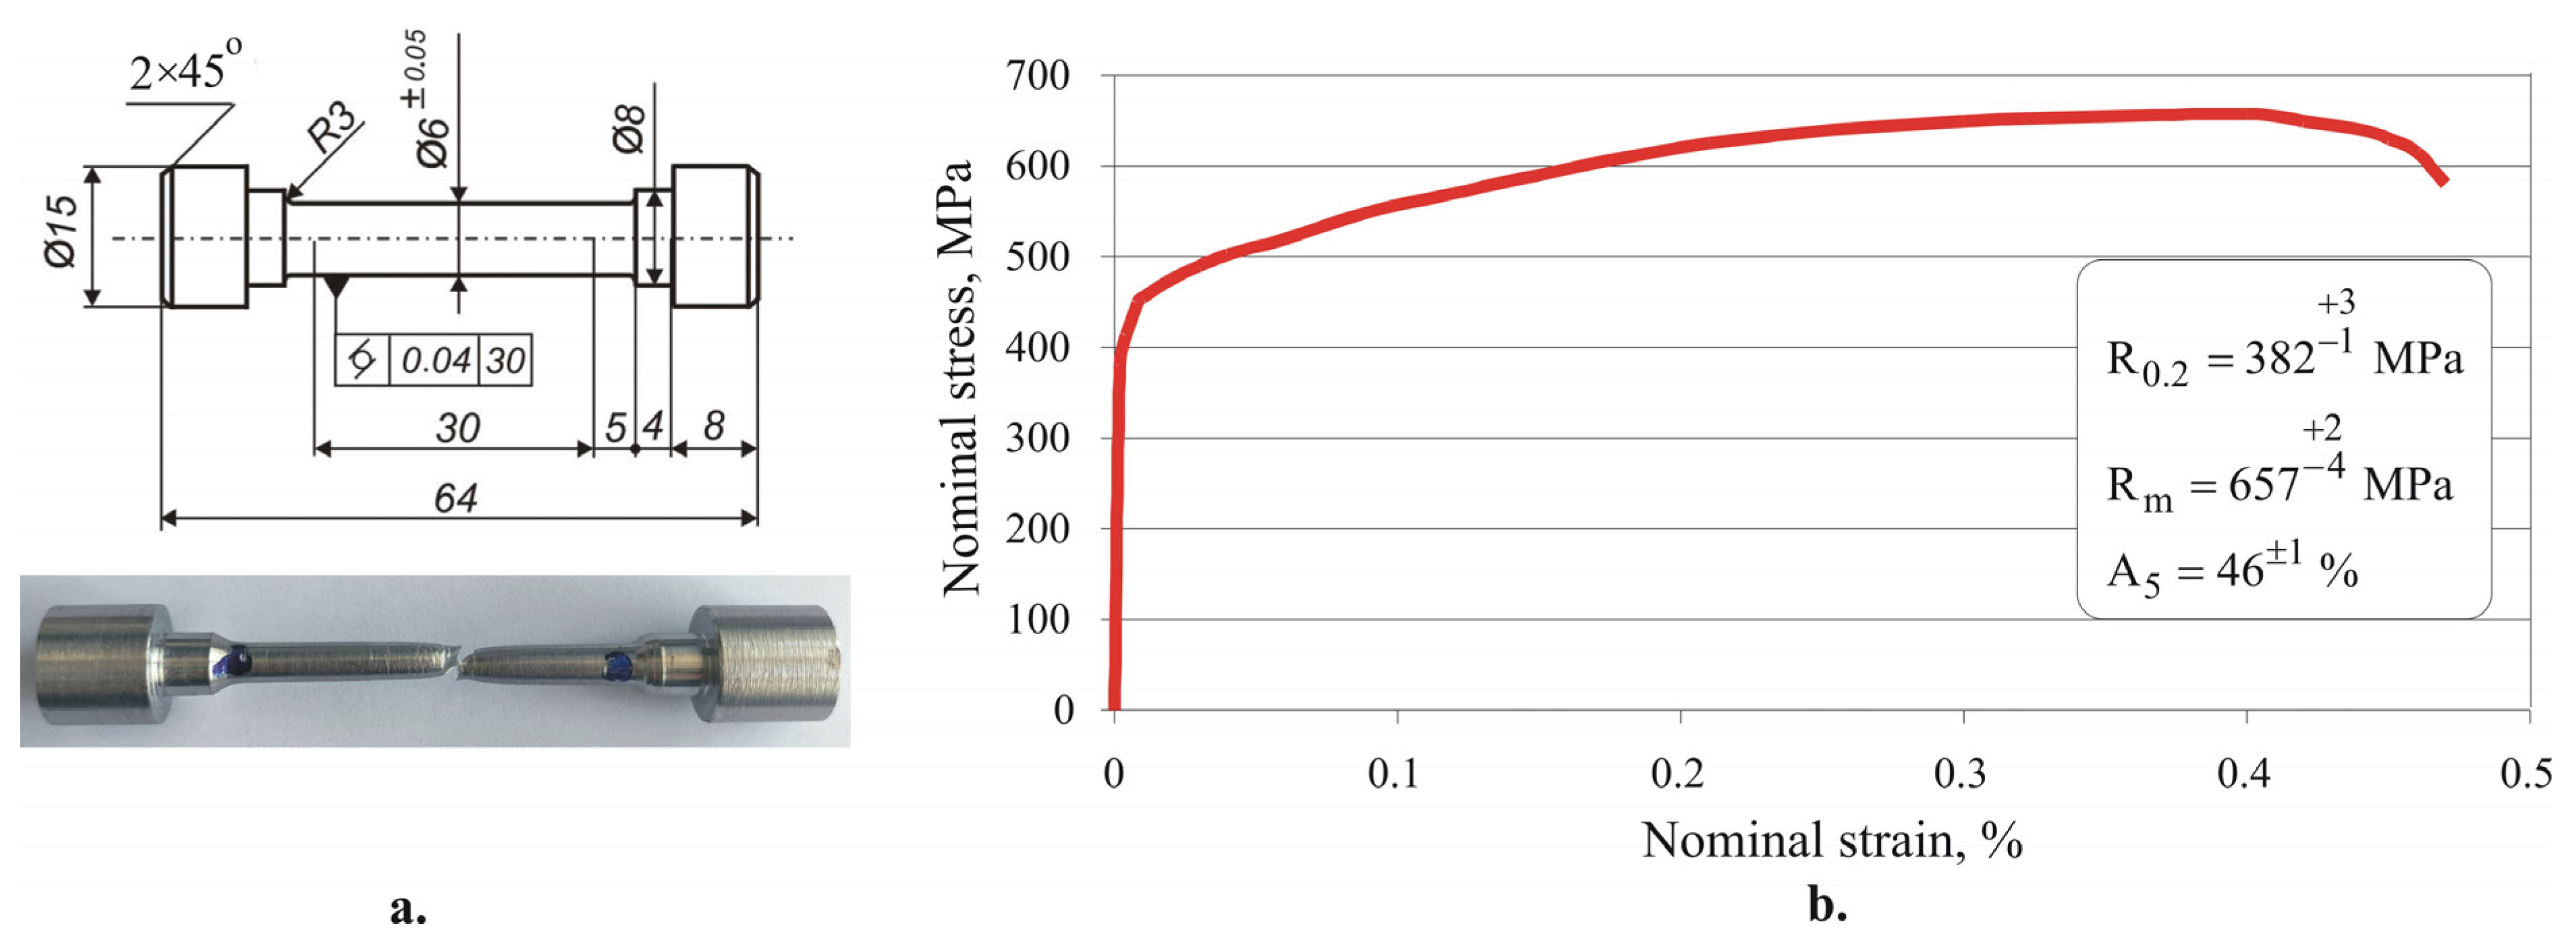
3.1. Material

AISI 316 chromium–nickel austenitic stainless steel was obtained in the form of rolled bars with a diameter of 30 mm. The material was used in the as-received state. The chemical composition in weight percentages was established via optical emission spectrometer. Tensile tests at room temperature were conducted with a Zwick/Roell Vibrophore 100 testing machine using three specimens. The hardness was established with a ZWICK/Indentec–ZHVµ-S tester. Spherical-ended indenter with diameter of 2.5 mm, loading of 63 kg, and holding time of 10 s was used.

3.2. Burnishing Methods Implementation

RB and SRB were implemented on an Index Traub CNC lathe using a multifunctional burnishing device, as shown in Figure 8. The required burnishing force is set in advance by means of the shrinkage of an axial spring with linear performance situated in the device. For this purpose, the axial displacement of the cylindrical nut is coordinated with the spring characteristic. The deforming toroidal roller is then brought into contact with the workpiece at its centerline and normal to the surface being burnished. The device is fed into the workpiece an additional 0.05 mm to allow the toroidal roller to become disengaged from the stop in the device. Thus, an elastic contact between the deforming roller and surface being treated is provided. All deforming rollers had the same radii on their equatorial circles: r r = 13 m m (see Figure 7).
Each specimen had an outer diameter of 30 mm, a thickness of 25 mm, and a central hole of 14 mm diameter. A group of specimens was positioned and fixed on a cylindrical mandrel (Figure 9). Each package was clamped to one side into the chuck and supported on the other side. Turning and burnishing were carried out in a single clamping process for the purposes of (1) minimizing the concentric run-out in burnishing and (2) ensuring the same initial roughness (before burnishing) of all samples in the group. The governing factors were the radius r (see Figure 7) of the working toroidal surface of the deforming roller, the burnishing force F b , and the feed rate f. RB and SRB were implemented using Vasco 6000 lubricant. The one-factor-at-a-time method and the planned experiment were conducted sequentially.

3.3. Measurement of Surface Integrity Characteristics

The roughness parameters were measured using a Mitutoyo Surftest SJ-210 surface roughness tester. The roughness parameters were obtained as average values from measurements of six equally spaced specimen generatrices. A ZHVµ Zwick/Roell microhardness tester was used to measure the surface microhardness. The measurement conditions were a 10 s holding time and 0.1 kgf loading. Twelve measurements were conducted for each specimen. The final surface microhardness magnitude for each specimen was the center of clustering of the twelve measurements. The RS distribution was measured with a Bruker D8 Advance X-ray diffractometer using the sin 2 ψ method and a least-squares fitting procedure. More detailed information on the measurement is provided in Table 1.

4. Experimental Results and Discussion

4.1. Material Characteristics

The chemical composition of the AISI 316 steel used in this work is shown in Table 2. The remaining chemical elements (with a total content of 0.0382 wt%) are Zr, Se, B, Sn, Pb, and Al. The specimen geometry and tensile tests results ( σ ε diagram and main mechanical characteristics) are shown in Figure 10. The measured hardness was 215HB.

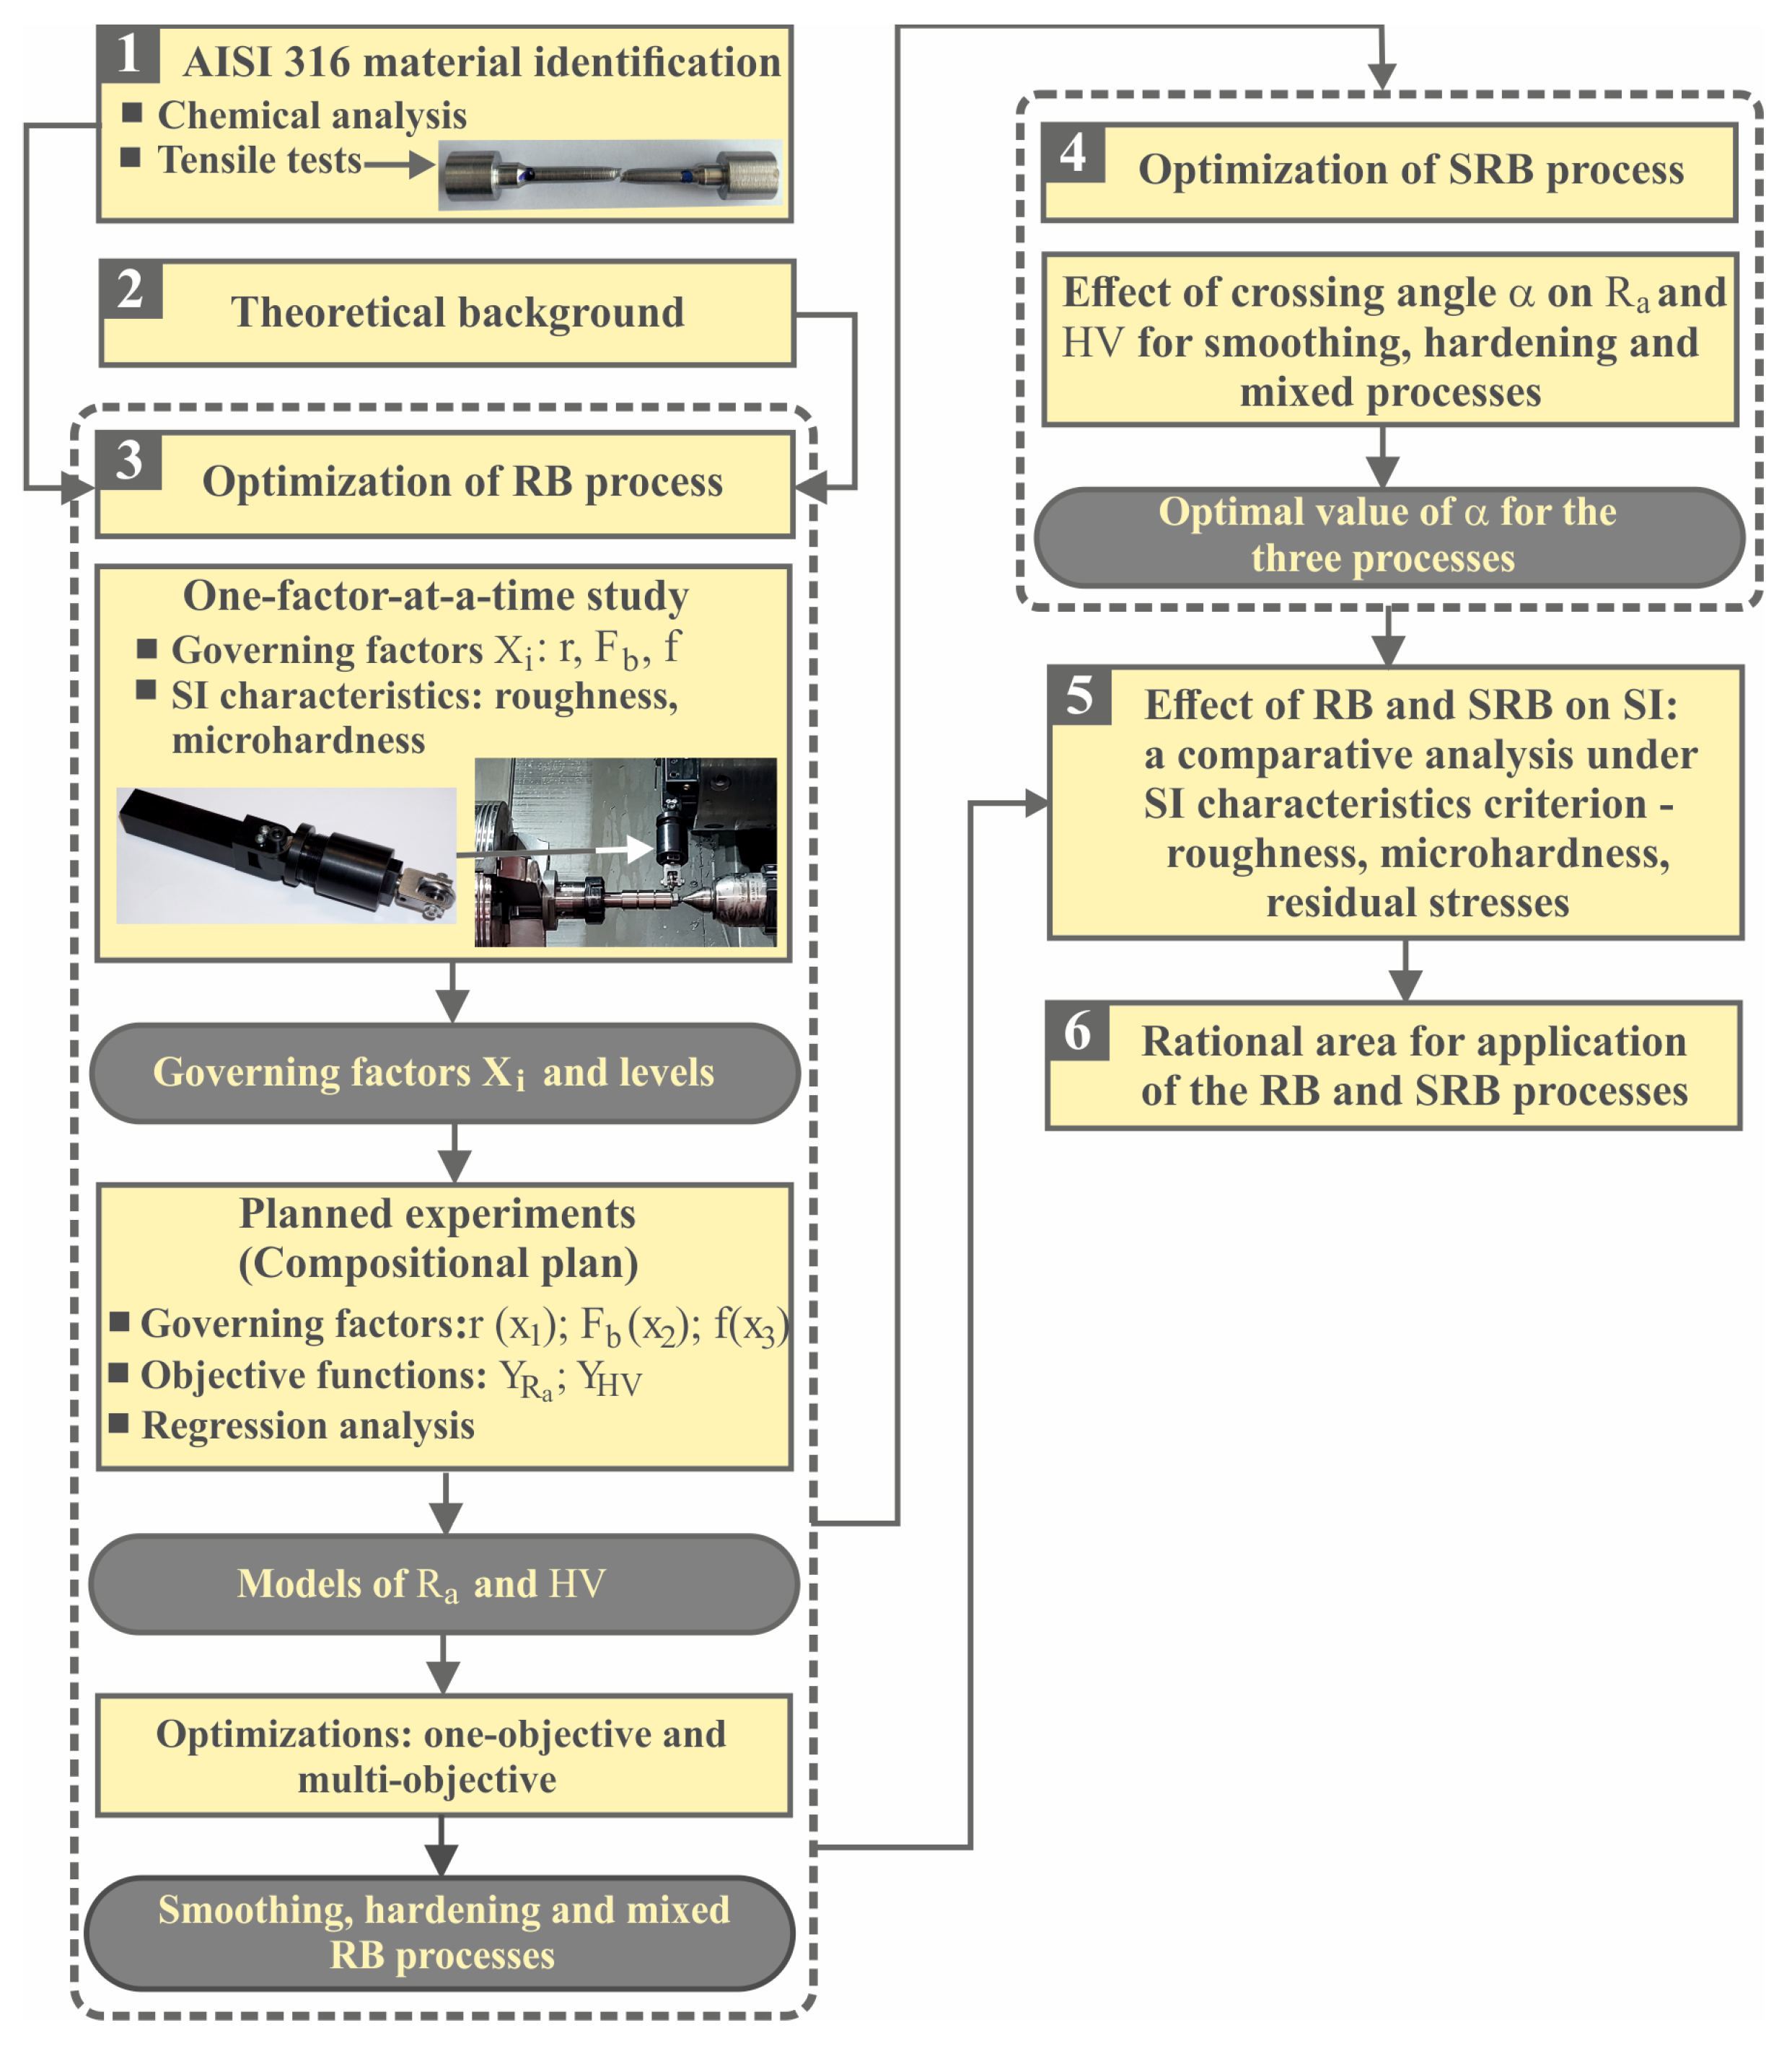
4.2. Optimization of RB Process

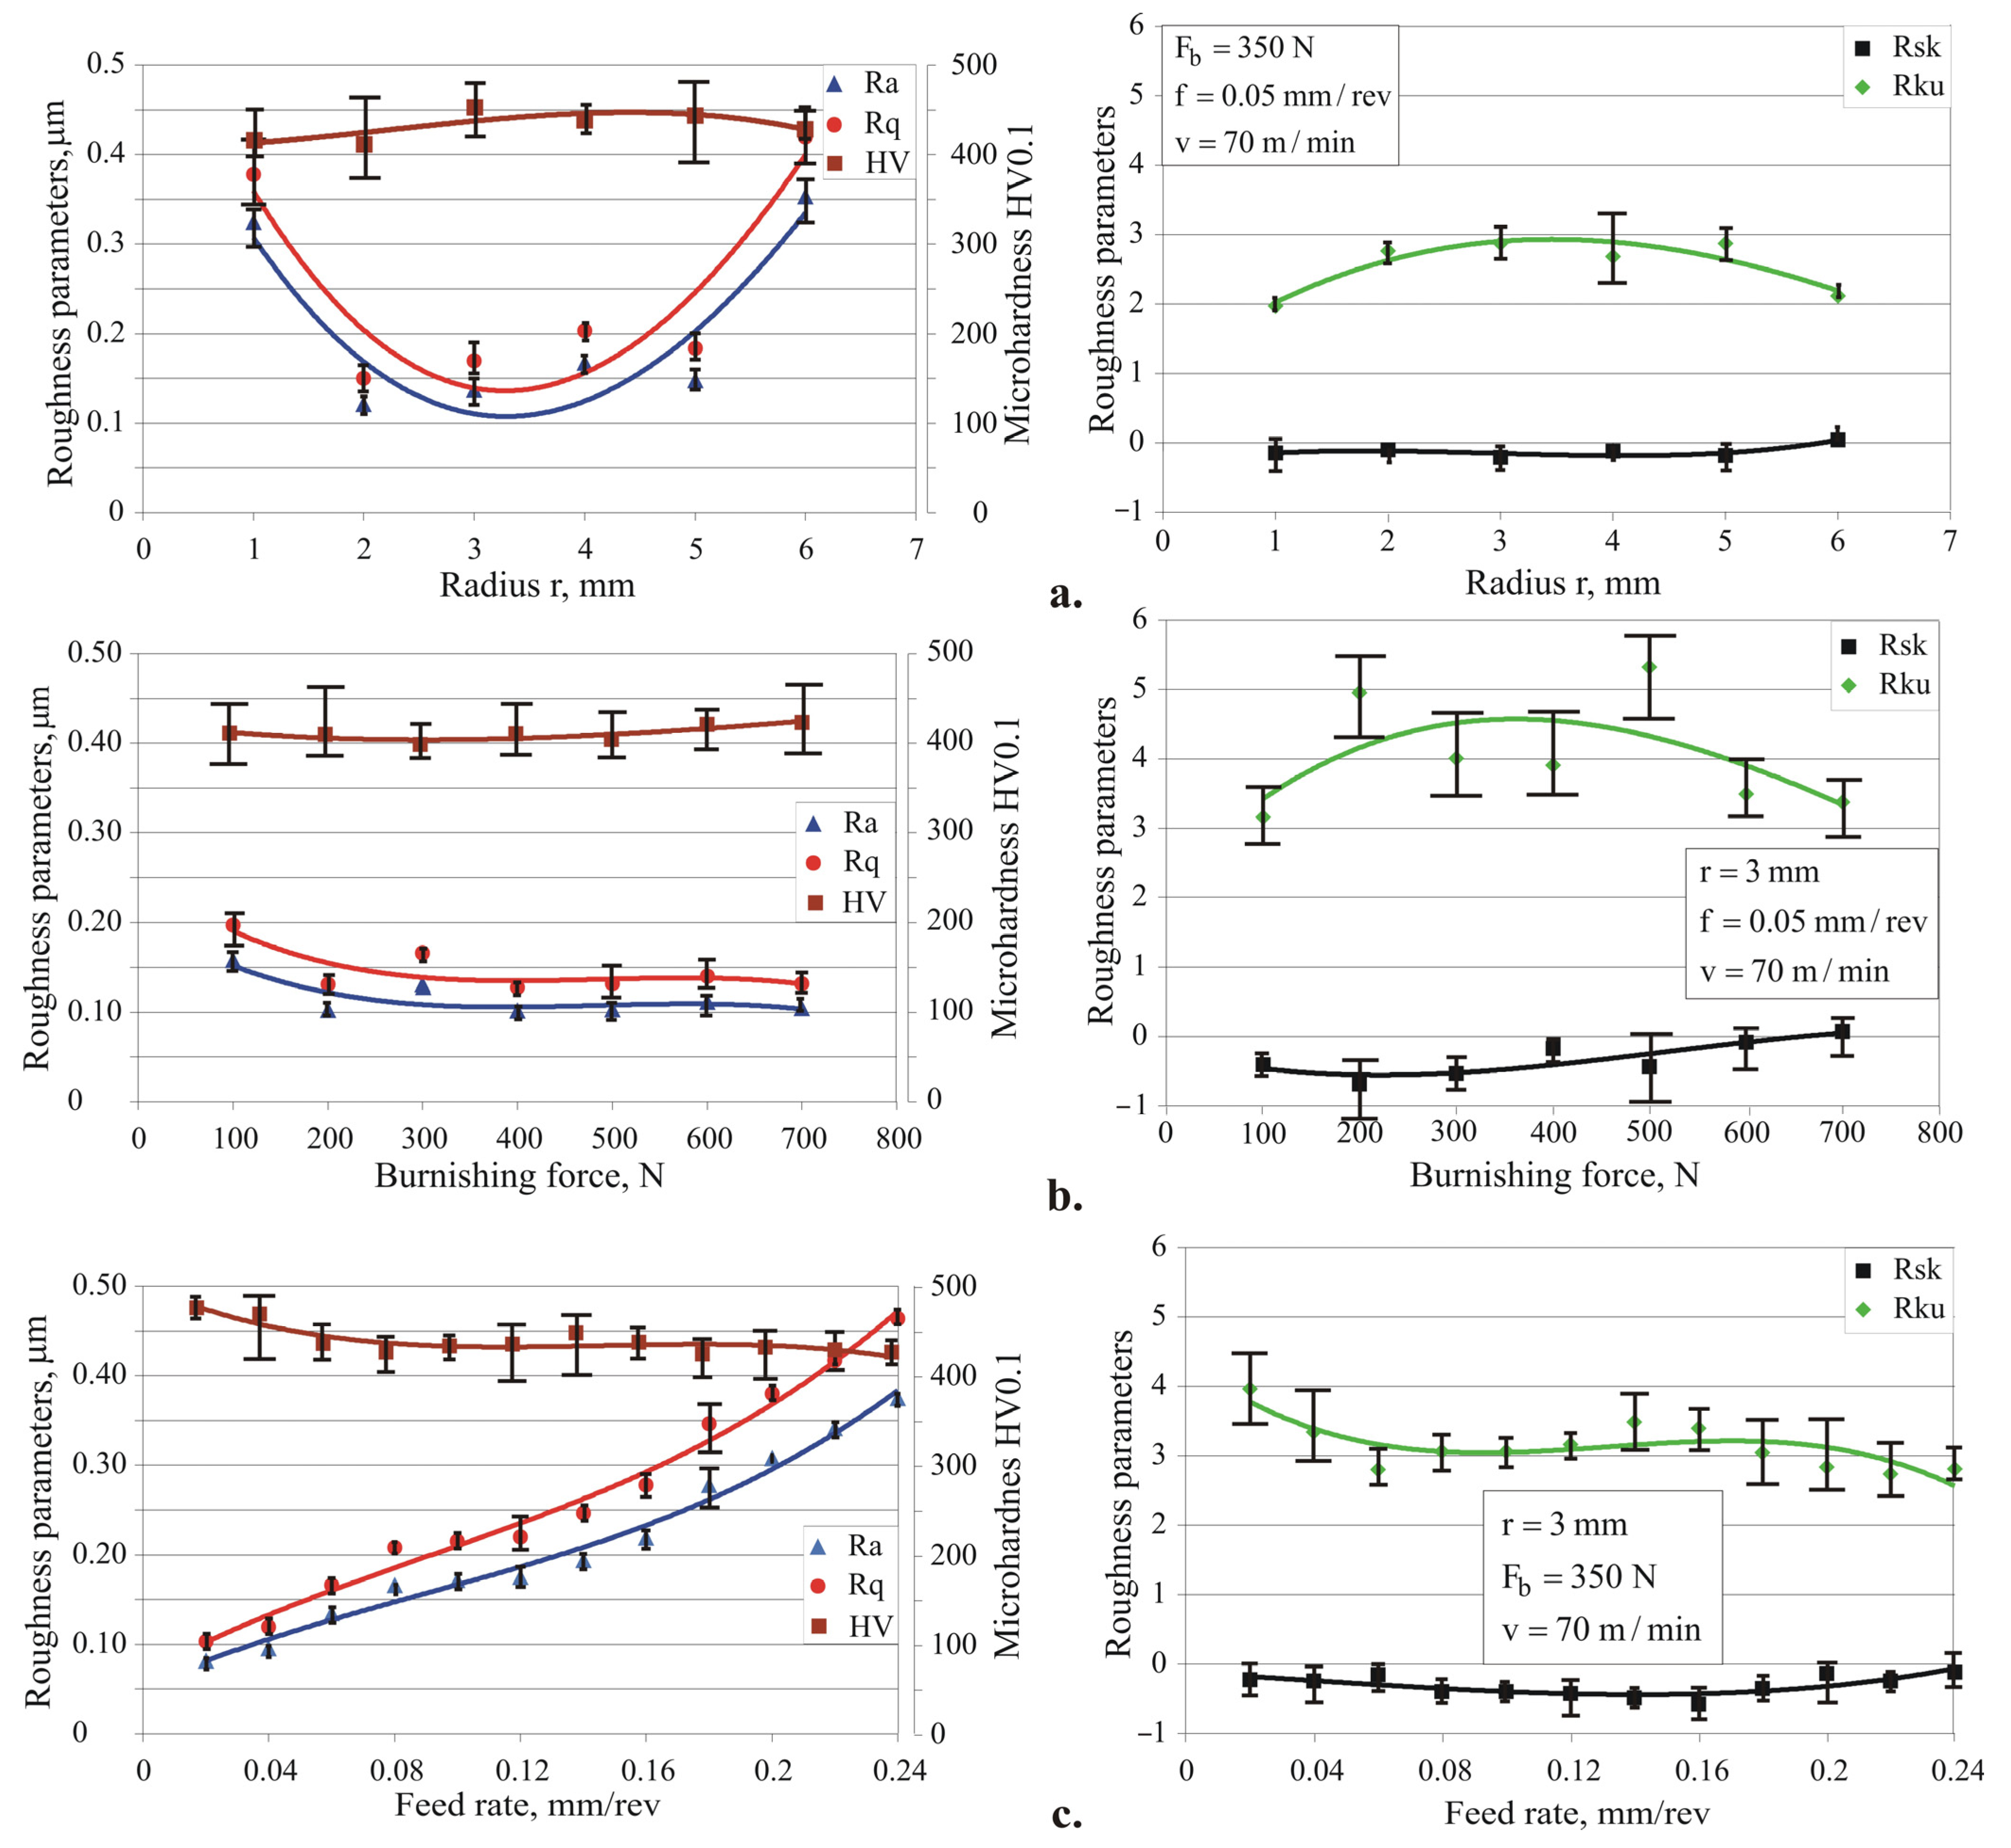
4.2.1. One-Factor-at-a-Time Study

The effect of each of the three governing factors of the RB process on the roughness and surface microhardness was studied. The objects of study were the two integral height roughness parameters R a and R q , as well as the two shape roughness parameters, the skewness R s k and kurtosis R k u . The average initial roughness (after turning) was R a i n i t = 0.479 μ m and was achieved with the following turning parameters: feed rate f = 0.05 m m / t r , depth of cutting a p = 0.2 m m , and cutting speed v = 60 m / m i n . A TCMX110204WP carbide cutting insert was used. The influence of the radius r is illustrated in Figure 11a. The radius values in the range of 2 to 5 mm provide an integral height parameter R a under 0.17 μ m , a kurtosis R k u close to 3, and a negative skewness R s k . Radii of 1 mm and 6 mm were excluded in further studies. Figure 11b visualizes the effect of burnishing force on the five selected surface texture characteristics. The integral height roughness parameters R a and R q decrease when the burnishing force increases (albeit weakly), whereas the skewness increases but remains negative. The kurtosis takes a value greater than four for a burning force in the interval 200–500 N. As expected, microhardness shows a tendency to increase with burnishing force. Figure 11c depicts the effect of the feed rate on the five investigated surface texture characteristics, of which R a and R q increase with the feed rate. This effect is more pronounced for R q when the kurtosis trend is decreasing. The skewness remains negative, showing minimum values in the middle of the feed rate interval.
Compared with the height roughness parameters, the microhardness is less strongly affected by the radius (Figure 11a) and the burnishing force (Figure 11b). A minimum feed rate ensures maximum surface microhardness and a steady trend of decreasing microhardness with increasing feed rate is observed. A possible explanation is the cyclic loading in the vicinity of each point of the processed surface due to the presence of the so-called overlapping effect [26]. The smaller the feed rate compared with the radius, the stronger this effect becomes. However, some of the observed trends may change if the values of the fixed factors in the one-factor-at-a-time experiment are altered. Therefore, a planned experiment is necessary.

4.2.2. Planned Experiment
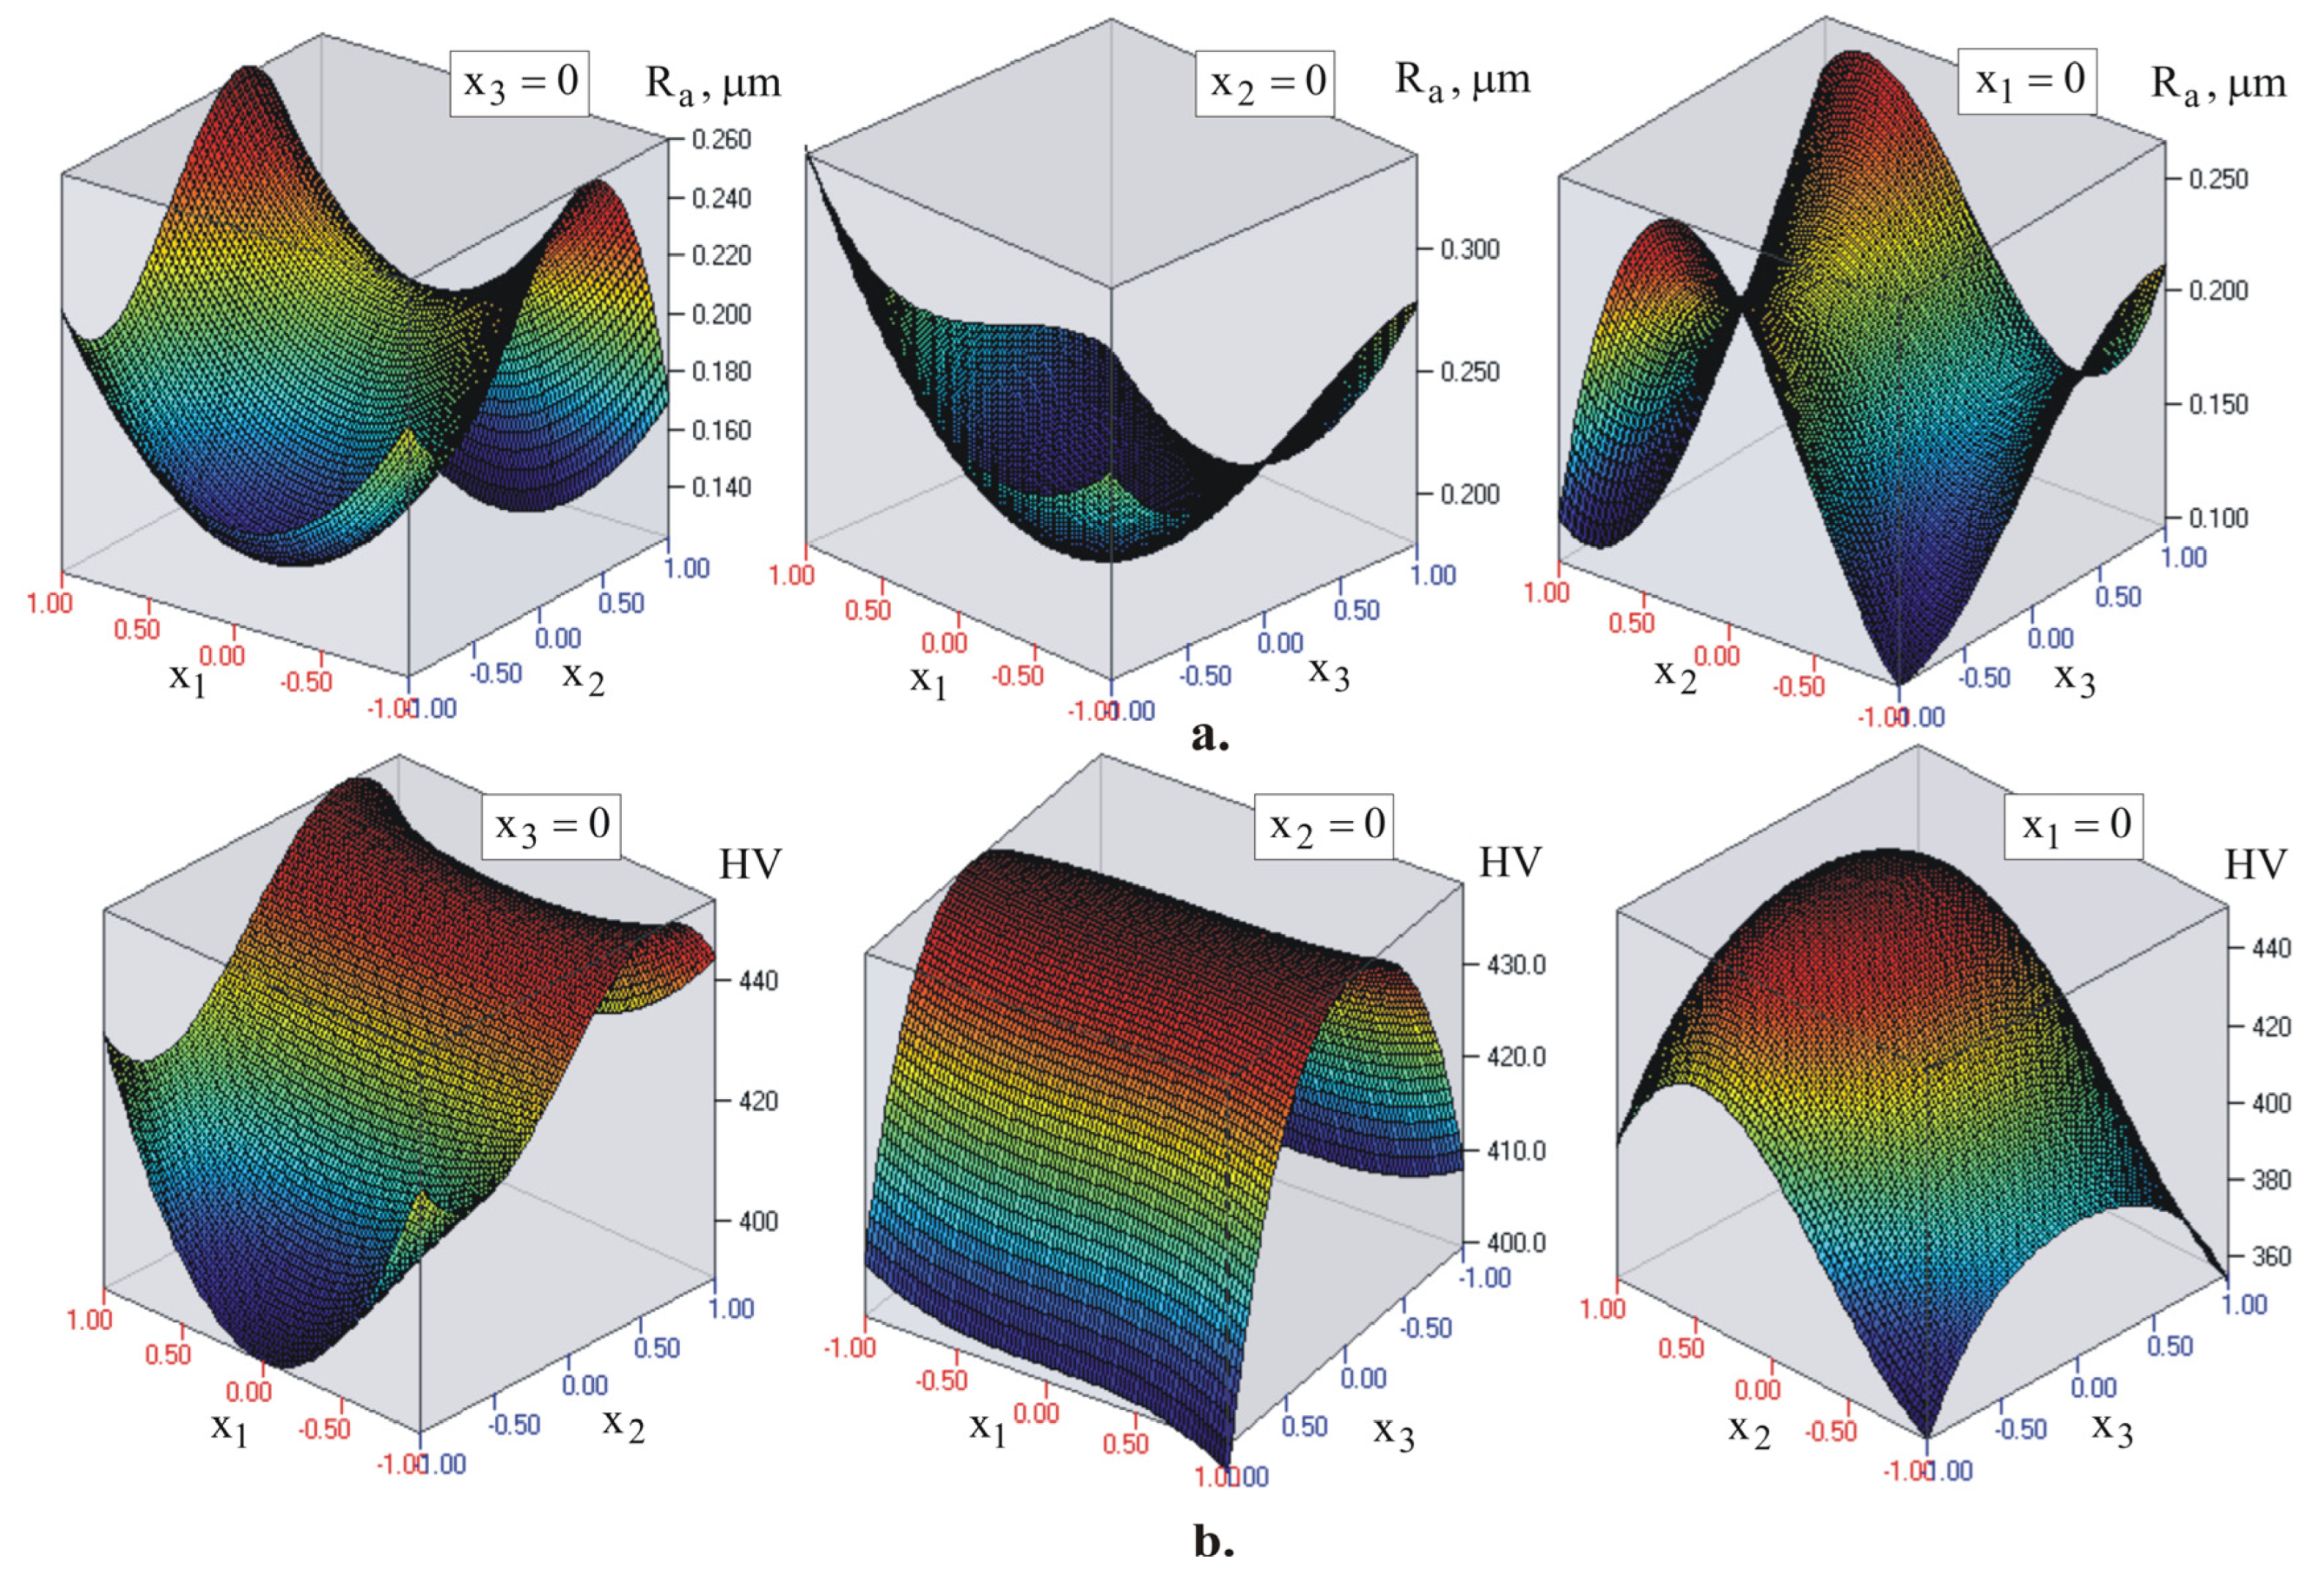
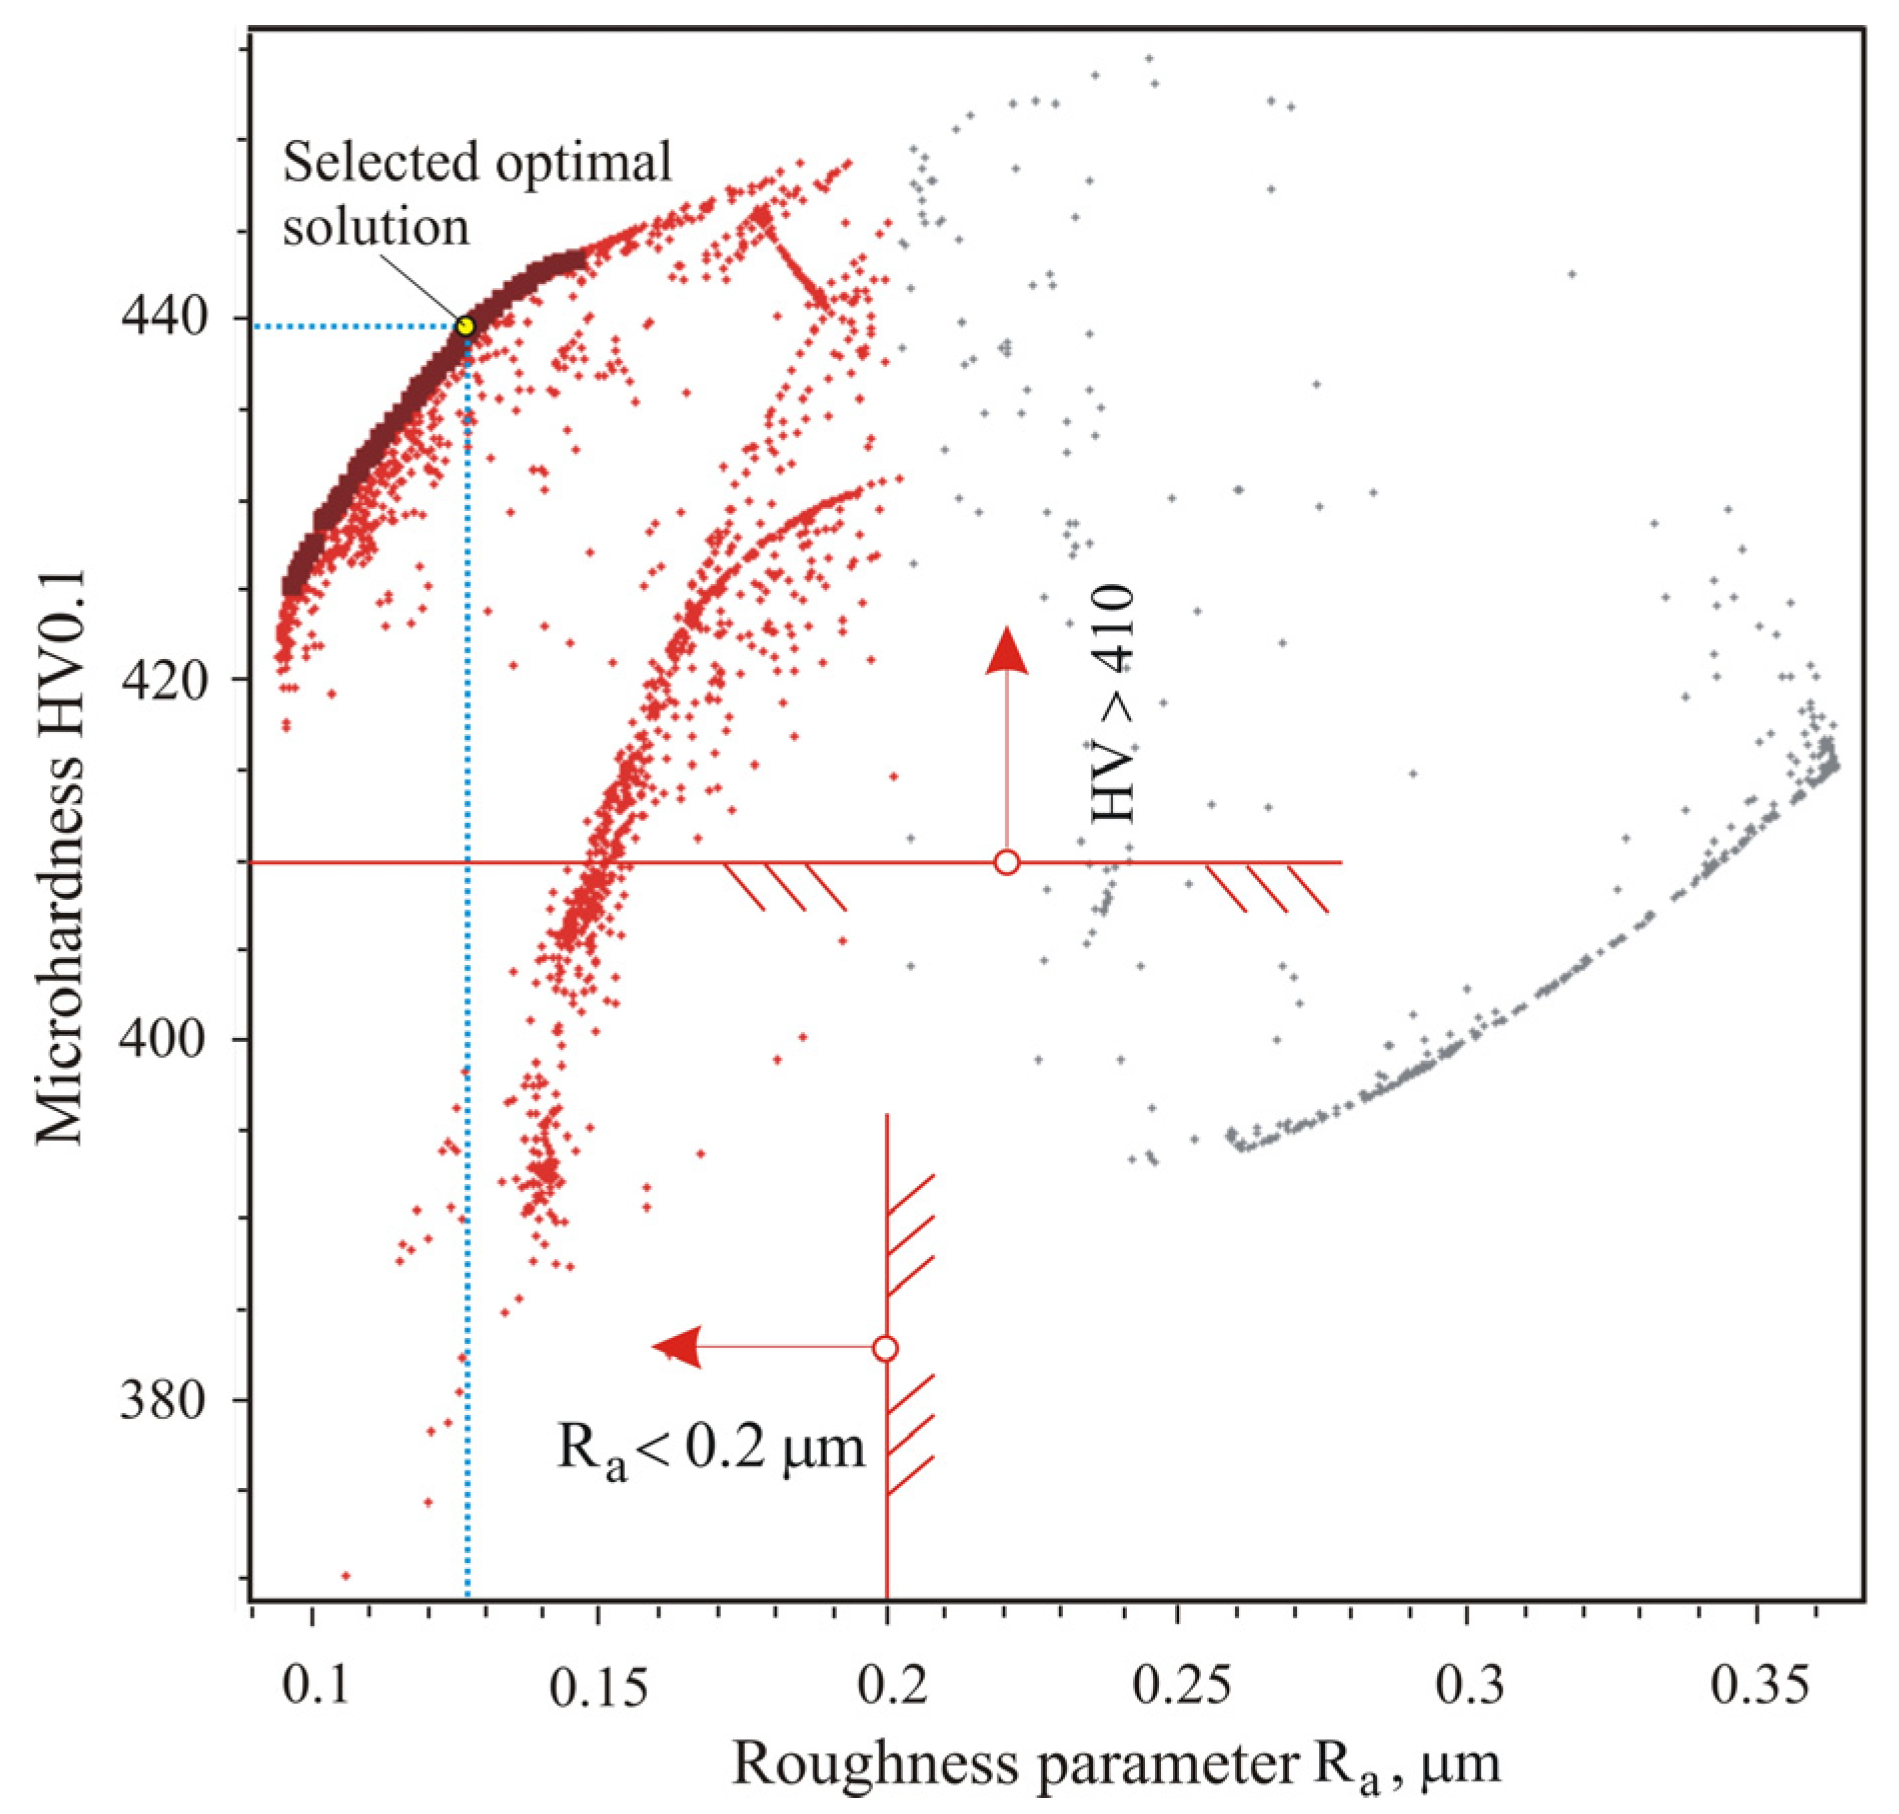
The levels of the governing factors are based on the outcomes of the one-factor-at-a-time study and are listed in Table 3. The dependence between the governing factors in natural x ~ i and coded x i form is
x i = 2 x ~ i x ~ 0 , i x ~ max , i x ~ min , i .
where x ~ max , i , x ~ 0 , i , and x ~ min , i are the upper, middle, and lower levels of the i-th factor in natural coordinates, respectively.
The objective functions are the integral height roughness parameter and the surface microhardness selected based on the results from the one-factor-at-a-time study. Given the wide ranges of variation of the governing factors (Table 3), a fourth-order central composition plan was chosen for the planned experiment. Table 4 lists the experimental outcomes from the planned experiment.
Analysis of variance (ANOVA) was carried out using QStatLab version 6.1.1.3 [27] to study the significance of the governing factors. The ANOVA main effects are shown in Figure 12. The burnishing force ( x 2 ) exerts the strongest influence on the roughness parameter R a (Figure 12a) and the surface microhardness HV0.1 (Figure 12b). The second most important factor is feed rate ( x 3 ). The influence of the radius ( x 1 ) is the weakest. The minimum value of R a is obtained when all three governing factors are simultaneously maintained at the second level: x 1 = 0.333 and x 2 = x 3 = 0.5 . The maximum microhardness is obtained when the three governing factors simultaneously occupy the fourth level: x 1 = 0.333 and x 2 = x 3 = 0.5 .
Regression analyses were conducted using QStatLab. The approximating polynomials were of order no higher than four, i.e., with one lower than the number of levels of the governing factors:
Y k X = b 0 + i = 1 m b i x i + i = 1 m 1 j = i + 1 m b i j x i x j + i = 1 m b i i x i 2 + . . . , k = 1 , 2 , . . . q , . . . .
where X is the vector of the governing factors, m is the number of governing factors, and q is the number of objective functions.
Table 5 lists the coefficients of regression. A graphical visualization of the models is shown in Figure 13. The models confirm the conclusions drawn based on the ANOVA regarding the influence of the governing factors on the roughness parameter R a and the microhardness. The magnitudes of the objective functions calculated with (18) for the experimental design points are shown in Table 4. The comparison with the experimental results shows good agreement.

4.2.3. Optimization

The three processes that can be implemented with the RB method are smoothing, hardening, and mixed RB. The first of these achieves a minimum value of the integral height parameter R a . The goal of the second process is to maximize the surface microhardness. Mixed RB achieves compromise values of R a and the surface microhardness. Finding the optimal values of the governing factors for the first two processes requires solving single-objective optimization problems, i.e., finding the minimum value of the objective function Y R a and respectively finding the maximum value of the objective function Y H V , whereby the governing factors are varied in the defined factor space. However, the radius changes discretely and takes values according to Table 3. Therefore, instead of minimizing or maximizing the Y R a or Y H V value, respectively, another approach was applied. Based on the ANOVA, points 15 and 22 were selected from the experiment plan, for which the magnitudes of the governing parameters provide minimum roughness and maximum microhardness, respectively. These combinations of governing factors are only compromise optimal rather than optimal. A multi-objective optimization problem needs to be solved to realize a mixed RB process: Y R a m i n and Y H V m a x with the constraints on the governing factors shown in Table 3. The following functional constraints are also defined: R a < 0.2 μ m and H V > 410 . The decision was made with the nondominated sorting genetic algorithm [28] using QstatLab. The compromise optimal solution was selected from the Pareto front. Figure 14 illustrates the Pareto front and the chosen compromise optimal solution. Table 6 provides detailed information regarding the solution results for the three optimization tasks.

4.3. SRB Investigation

4.3.1. Formulation of the Study

As a result of the RB optimization, the optimal values of the governing factors for the three RB processes, smoothing, hardening, and mixed, were obtained (see Table 6). Using the governing factors of each of the three processes, SRB was implemented with different values of the crossing angle α. The specimens had the same shape and dimensions as those used for the RB research and optimization (see Figure 9). The subject of the research is the variation of the roughness parameter R a and surface microhardness HV0.1 as a function of the crossing angle α. When α = 0°, the RB process is implemented, and the obtained results for R a and HV0.1 represent an experimental verification of the results obtained from the optimizations in Section 4.2.3. For each of the three RB processes (smoothing, hardening, and mixed), the optimal values of the governing factors are used to implement SRB and an optimal value of α is selected.

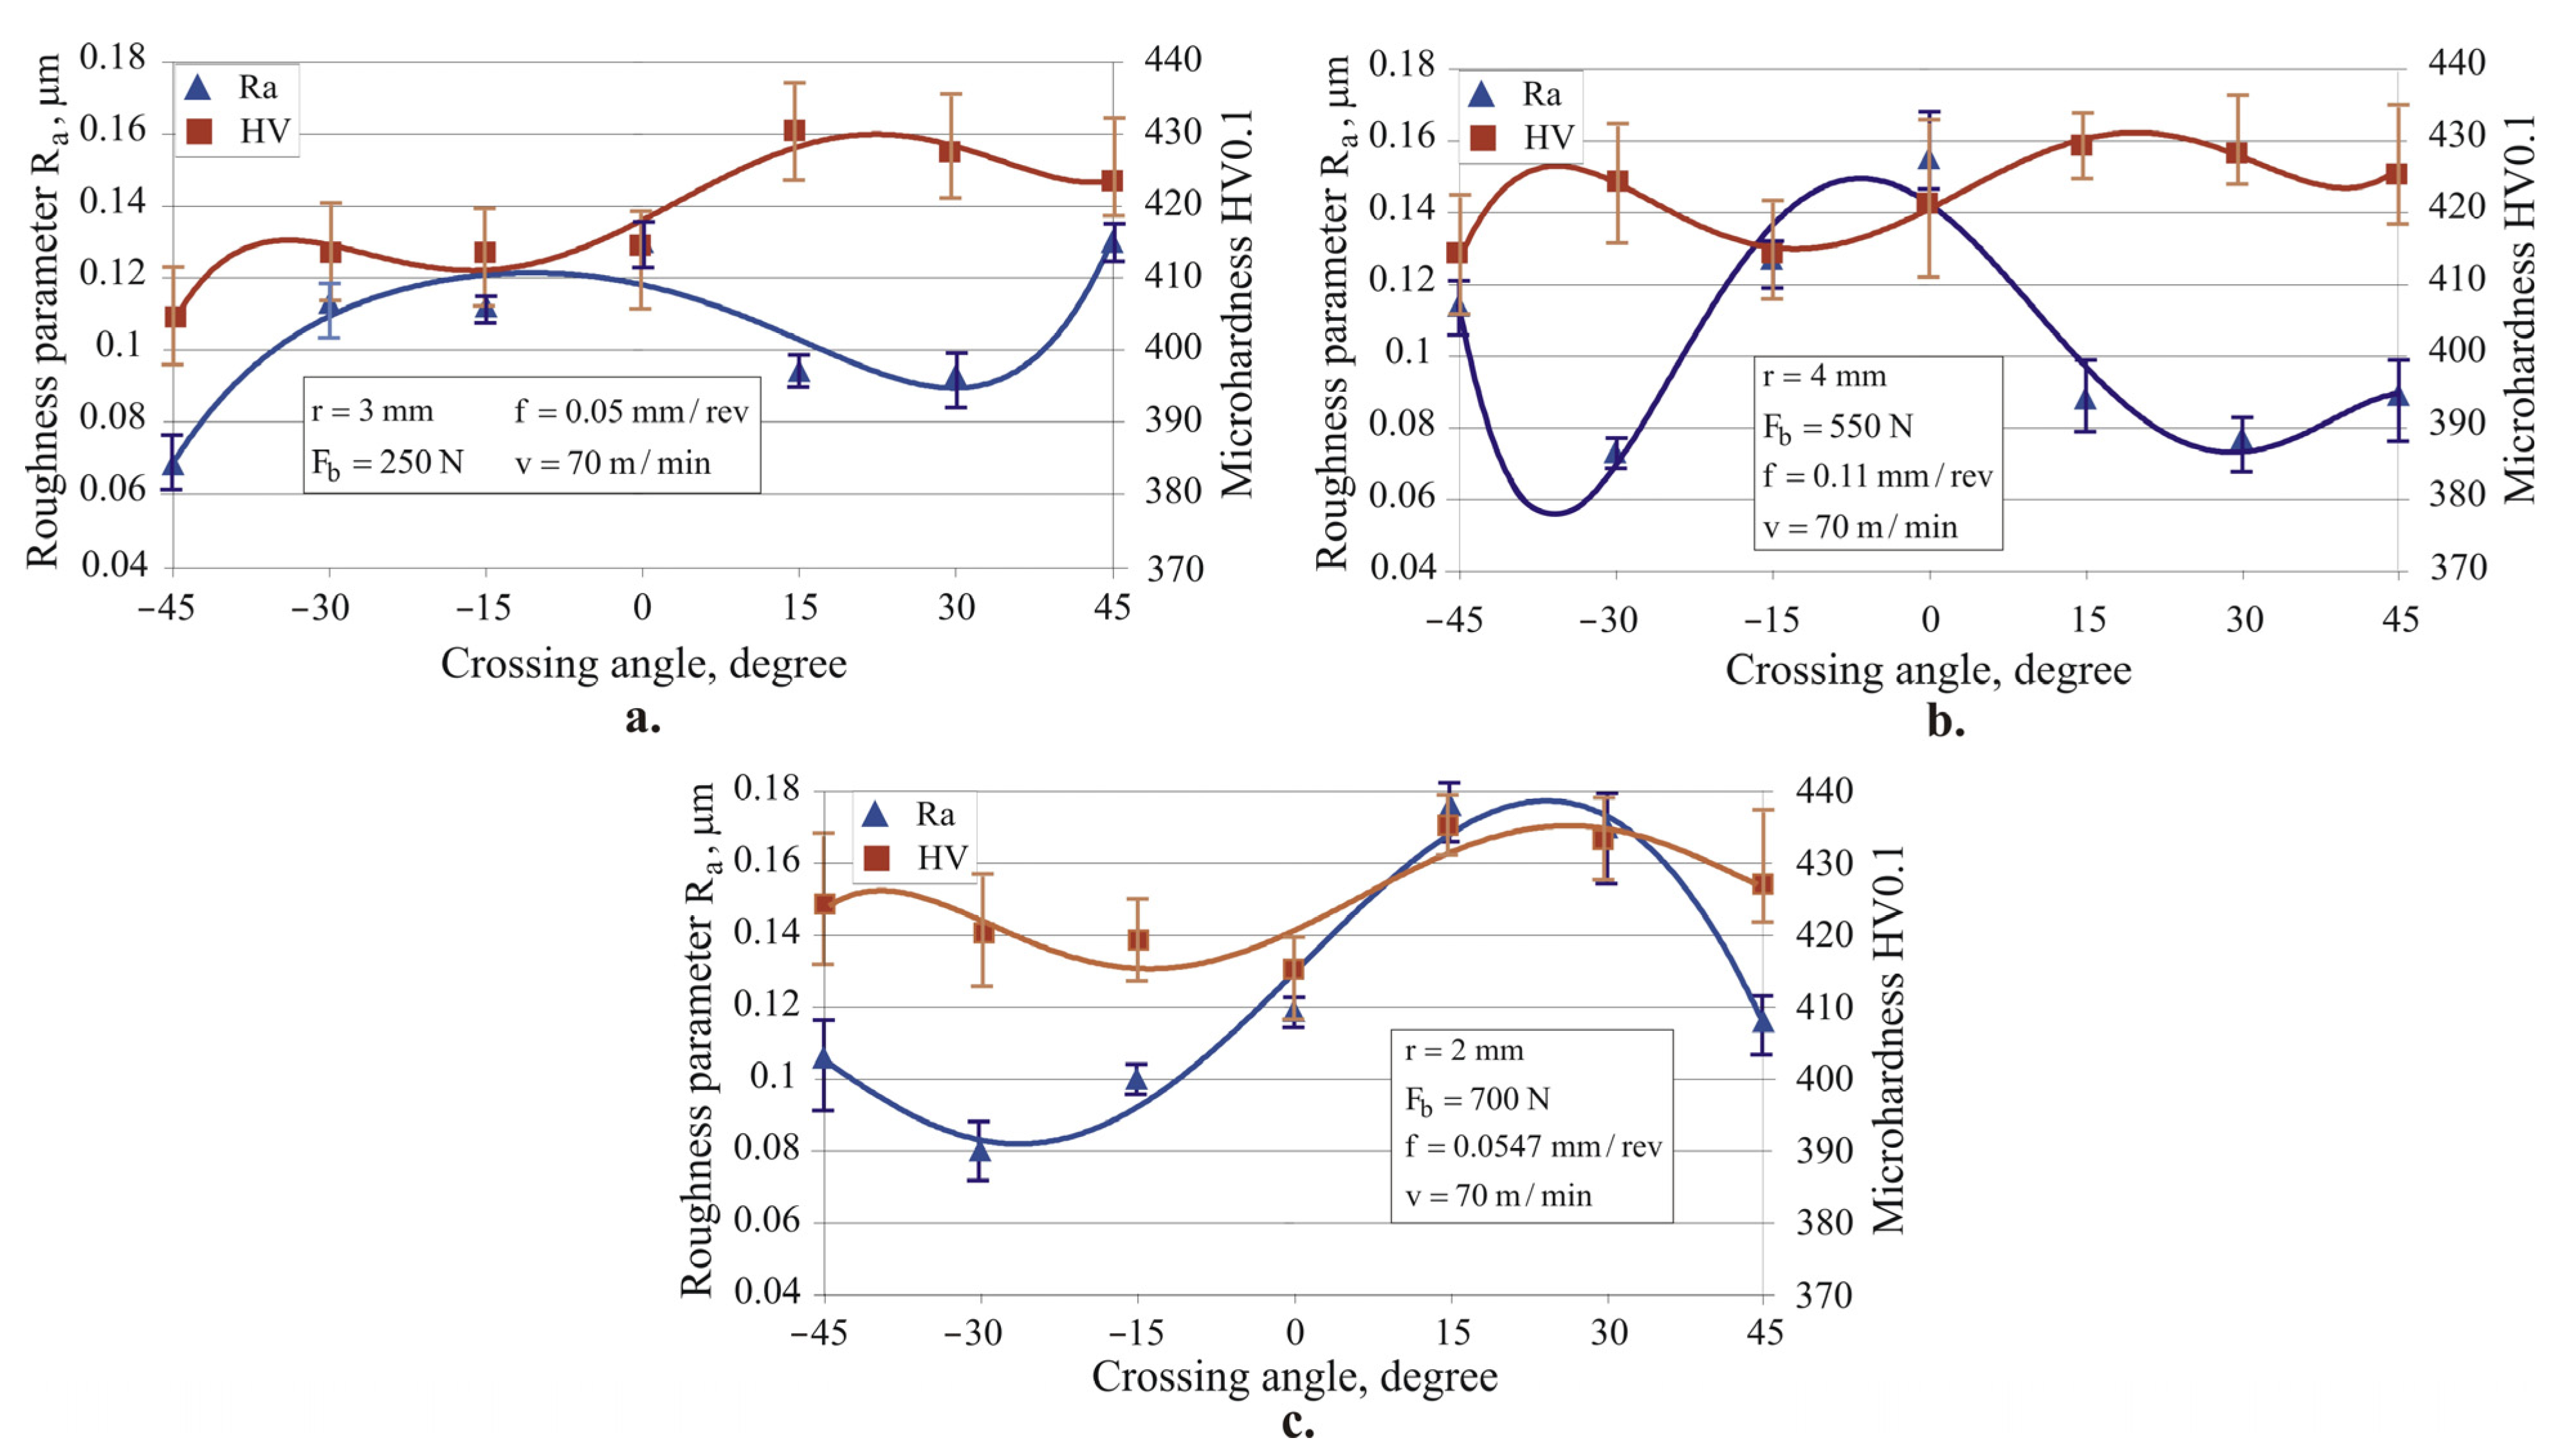
4.3.2. Effect of Crossing Angle on the Roughness Parameter Ra and Microhardness

The effect of the crossing angle on the roughness parameter R a and surface microhardness HV0.1 is illustrated in Figure 15. For all values of α (except for two experimental points in Figure 15c), SRB achieves a significantly lower roughness parameter R a compared with the RB process, i.e., when α = 0°. The largest reduction, by more than a factor of two, was obtained for the hardening process. It is well known that there is a positive correlation between the roughness height parameters R a and R z . Therefore, the experimental results obtained for R a confirm the theoretical justifications in Section 2.4 for a smaller kinematic roughness in the SRB process.
For all α values (except for one experimental point in Figure 15a and two points in Figure 15b), SRB increases the surface microhardness HV0.1. This is due to the greater equivalent plastic deformation of the surface layer, and hence greater strain hardening.
Based on the obtained results for R a and HV0.1 (Figure 15), the following values of the crossing angle α were selected for the three processes: for smoothing SRB, α = 45° (Figure 15a), since the main objective is to minimize the height roughness parameters, and for hardening and mixed SRB processes, α = 30° (Figure 15b,c), since high microhardness is combined with the inherent main advantage of SRB, namely lower roughness. From this point of view, the identification of smoothing, hardening, and mixed SRB processes is conditional.

4.4. Effect of RB and SRB on Surface Integrity: Comparative Analysis

4.4.1. Formulation of the Study

Two samples were selected for each of the three processes (see Figure 15). One was treated with RB ( α = 0°) and the other with SRB with the crossing angle values chosen in Section 4.3.2. A comparison of the surface integrity characteristics (roughness parameters, microhardness HV0.1, and residual axial and hoop stress distributions) was performed for each pair of samples.

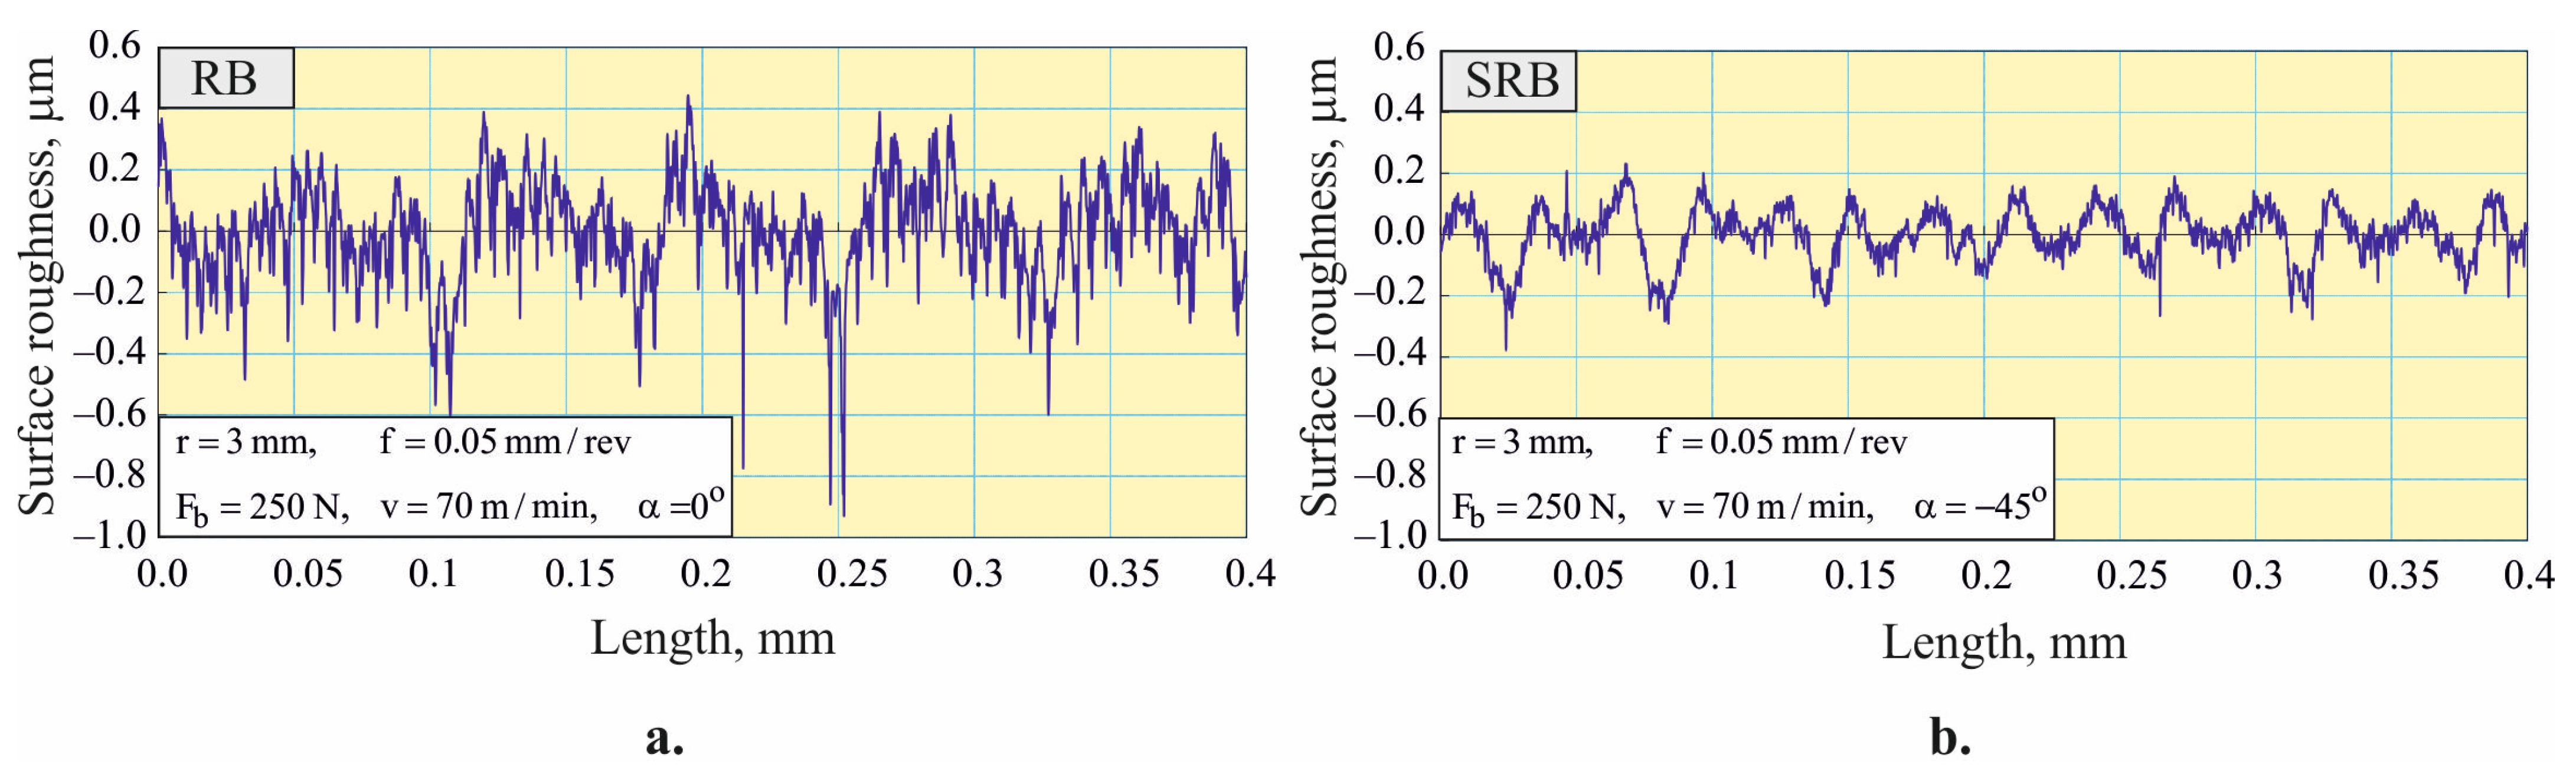
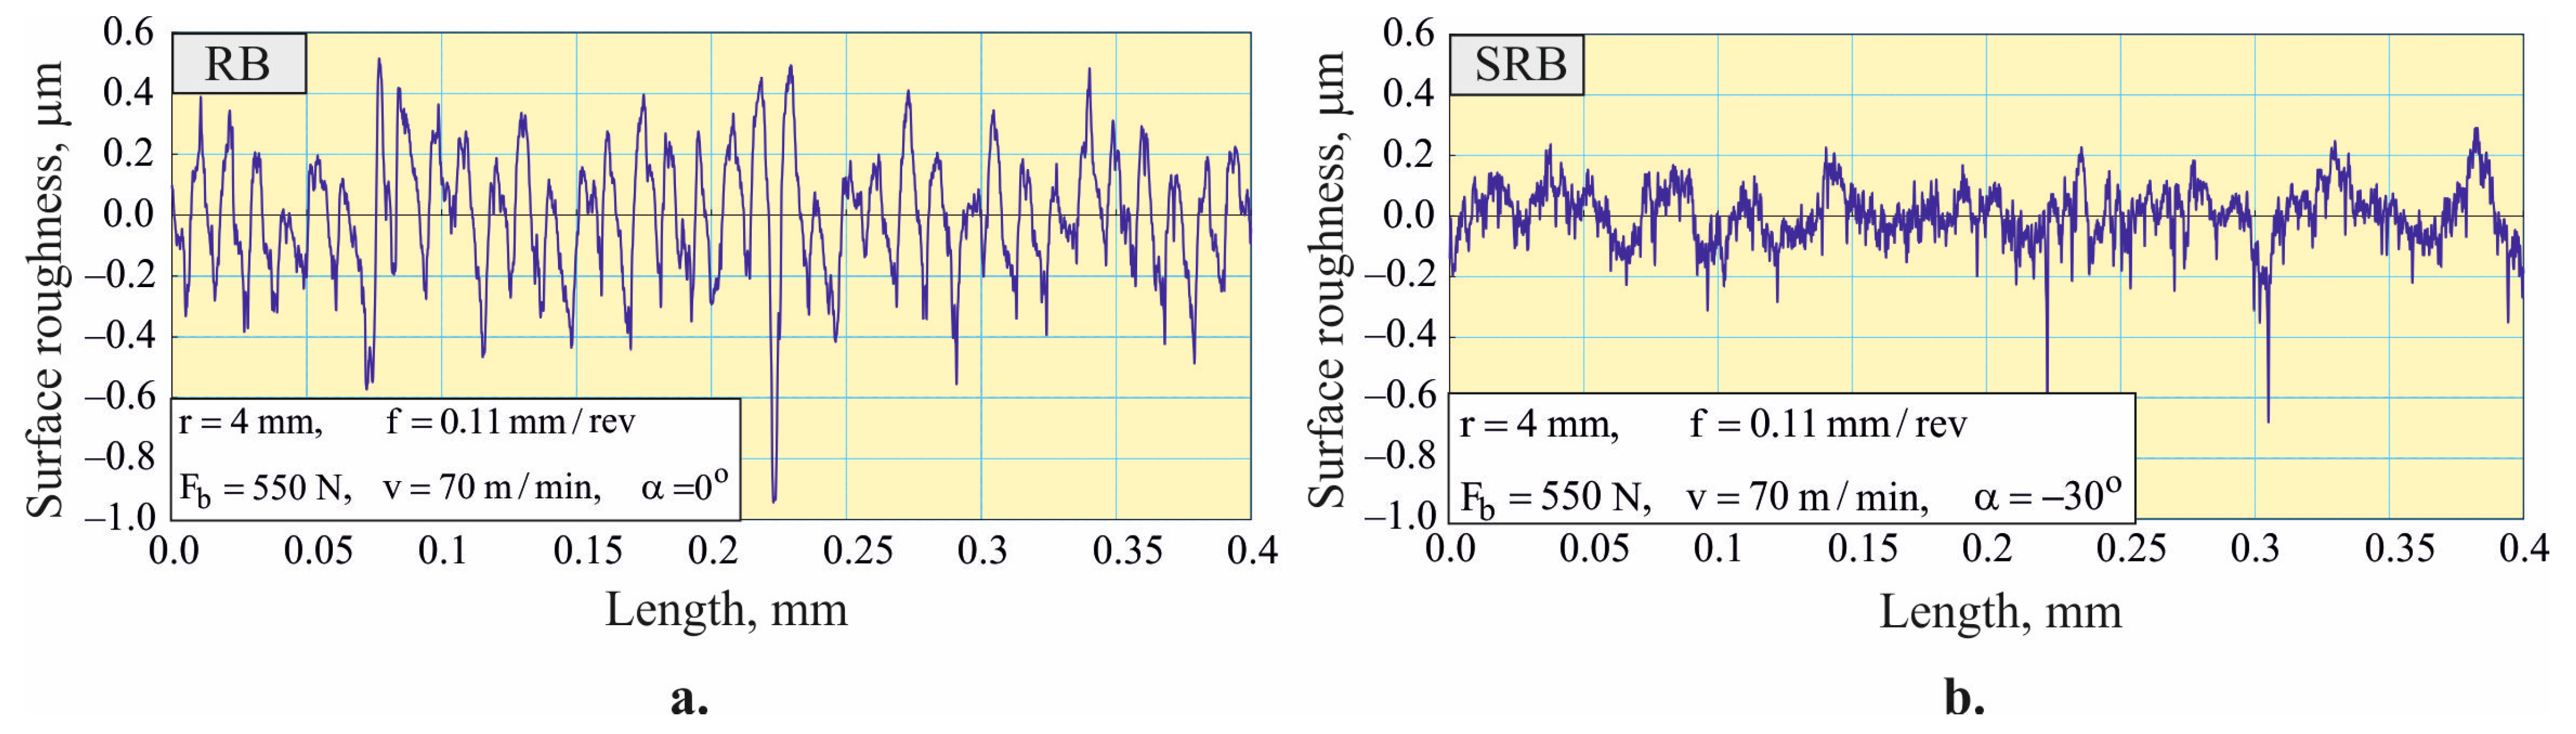
4.4.2. Smoothing Process

A comparison of the 2D roughness parameters and surface microhardness obtained via smoothing RB and SRB processes is shown in Table 7. The height roughness parameters obtained via smoothing SRB demonstrate the great potential of this process for minimizing roughness. The integral height parameters R a and R q are reduced by a factor of approximately two, whereas the local height parameters R p and R v , as well as the family of functional parameters R k , are reduced by an even greater factor. Significantly lower values of height roughness parameters after SRB are a prerequisite for reducing friction [29] and improving fatigue behavior [30,31] and corrosion resistance [32], compared with RB. The shape parameters, skewness R s k and kurtosis R k u , are important indicators of tribological behavior because they characterize the distribution and shapes of peaks and valleys. It is known that a surface texture characterized by a negative skewness ( R s k < 0 ) and a higher kurtosis (>3) improves lubrication and reduces friction [23,33]. This effect is mainly due to the dominance of deep valleys when R s k < 0 . These valleys act as micro-reservoirs that hold the lubricant. In this respect, the smoothing SRB process provides negative skewness and kurtosis with a value close to three (Table 7). Smoothing SRB leads to a slight reduction (by 2.4%) in the surface microhardness compared with smoothing RB (Table 7). A comparison of the evaluation profiles obtained via the smoothing RB and SRB processes is shown in Figure 16.
Figure 17 illustrates the distribution of RS introduced by the RB and SRB smoothing processes. Both methods introduce significant compressive RS at depths greater than 0.5 mm. The axial RS introduced by RB in the surface layer and in subsurface layers up to a depth of 0.05 mm is greater in absolute value. In contrast, the SRB introduces larger absolute compressive hoop RS at a depth of up to 0.15 mm. Since both RSs slow down the formation and development of fatigue macro-cracks, it is difficult to predict which of the two smoothing processes is more effective at improving fatigue strength.

4.4.3. Hardening Process

A comparison of the 2D roughness parameters and surface microhardness obtained via hardening RB and SRB processes is shown in Table 8. The larger equivalent plastic strain during hardening SRB provides two effects: a more favorable combination of shape roughness parameters from the point of view of improving tribological behavior in boundary and mixed friction conditions ( R s k = 0.531 and R k u = 5.04 ), and a visible increase in microhardness relative to hardening RB.
It is important to note that hardening SRB does not change the integral 2D height roughness parameters R a and R q significantly in comparison with smoothing SRB, and for the remaining 2D height roughness parameters, a slight deterioration is observed. This shows that the smoothing effect is highly pronounced for both smoothing and hardening SRB. The comparison of evaluation profiles obtained via hardening RB and SRB processes (Figure 18) confirms this advantage of SRB.
Summing up, all the surface integrity characteristics obtained via hardening SRB have improved values compared with hardening RB (Table 8). These results show the technological capabilities of hardening SRB to simultaneously provide favorable height and shape roughness parameters and surface microhardness. Therefore, the hardening SRB process can be used to significantly improve the tribological, fatigue, and corrosion behavior of AISI 316 steel components.
Figure 19 depicts the RS distribution due to the RB and SRB hardening processes. For both hardening processes, the depth of the compression zone is greater than 0.5 mm, for both axial and hoop RS. A comparison with Figure 17 shows that hardening processes provide a greater depth for the compressive zone. The larger equivalent plastic strain results in larger surface compressive RSs for both RB and SRB. RB introduces greater compressive axial RS at depths up to 0.09 m m , after which the trend changes in favor of SRB. Conversely, the SRB introduces larger compressive hoop RS into the surface and subsurface layers at depth 0.3 mm . Similar to the smoothing processes, it is difficult to predict based only on the RS distribution which of the two methods (RB or SRB) is more effective at enhancing fatigue strength.

4.4.4. Mixed Process

Table 9 shows a comparison of the 2D roughness parameters and surface microhardness obtained via the mixed RB and SRB processes. The surface integrity characteristics after mixed SRB are close to those obtained after hardening SRB, with a slight deterioration of the R a and R q height roughness parameters. The same trends are observed as with hardening SRB, but mixed SRB provides a more favorable combination of shape roughness parameters: the skewness parameter is negative, but with a larger absolute value ( R s k = 0.763 ), and the kurtosis parameter is larger ( R k u = 5.748 ). The surface microhardness HV0.1 obtained via mixed SRB decreases slightly (by 4 units) relative to the hardening SRB. Therefore, the hardening and mixed SRB processes provide very similar surface integrity characteristics. A comparison of the evaluation profiles obtained via mixed RB and SRB processes is shown in Figure 20.
Figure 21 shows the distribution of RS introduced by the RB and SRB mixed processes. For both of these, the same trends are observed regarding the depth and intensity of the compressive zones, as in the case of hardening processes (see Figure 19). The experimental RS distributions obtained for the three processes (smoothing, hardening, and mixed) confirm the effectiveness of single-toroidal RB and SRB at introducing a deep zone with high compressive RS in AISI 316 steel components.

5. Conclusions

A new method called SRB and a multi-functional device for the surface cold working of cylindrical outer surfaces have been developed. The deforming element is a toroidal roller whose axis crosses that of the workpiece. SRB is based on the well-known single-toroidal RB, in which the axes of the roll and the workpiece are parallel. The two methods were applied to the cold working of AISI 316 steel outer cylindrical surfaces. The main advantage of the SRB is that it provides smaller height roughness parameters and a higher surface microhardness than RB. The major new findings are as follows:
  • The new method was investigated theoretically and experimentally. Based on the theoretical background of SRB, it was established that RB is a special case of SRB. Due to the crossing axes of the deforming roller and workpiece, a relative sliding velocity occurs in the contact zone between the roller and the machined surface. The direction of the sliding velocity vector depends on the size of the crossing angle and is set by the new burnishing device. This makes it possible to realize a desired surface texture. When the two axes are parallel, the well-known RB method is implemented. The relationship between the finishing and the surface integrity characteristics was investigated for both methods.
  • Three combinations of optimal sizes of RB governing factors were found, with which three processes were realized: smoothing, hardening, and mixed. Using the same three combinations of governing factor sizes, the optimal crossing angle values for the SRB were found. The distinctions between smoothing, hardening, and mixed processes were found to be largely irrelevant to SRB, as with all three combinations of governing factors, SRB achieved roughness and microhardness values within a narrow range. For instance, the roughness parameter R a and microhardness HV0.1 remained within the ranges (0.068–0.080) µm and (404–424) HV0.1, respectively.
  • It was established that the implementation of the SRB process with a crossing angle of α = 30° (for hardening and mixed) and α = 45° (for smoothing) reduces the roughness parameter (0.068–0.080 µm) of AISI 316 steel samples by a factor of about two compared to the basic smoothing, hardening, and mixed RB processes (0.117–0.163 µm). Therefore, the smoothing is a mandatory effect in SRB, regardless of the equivalent plastic strain degree. The minimization of all the height roughness parameters via SRB should significantly improve the fatigue life and corrosion resistance of the components.
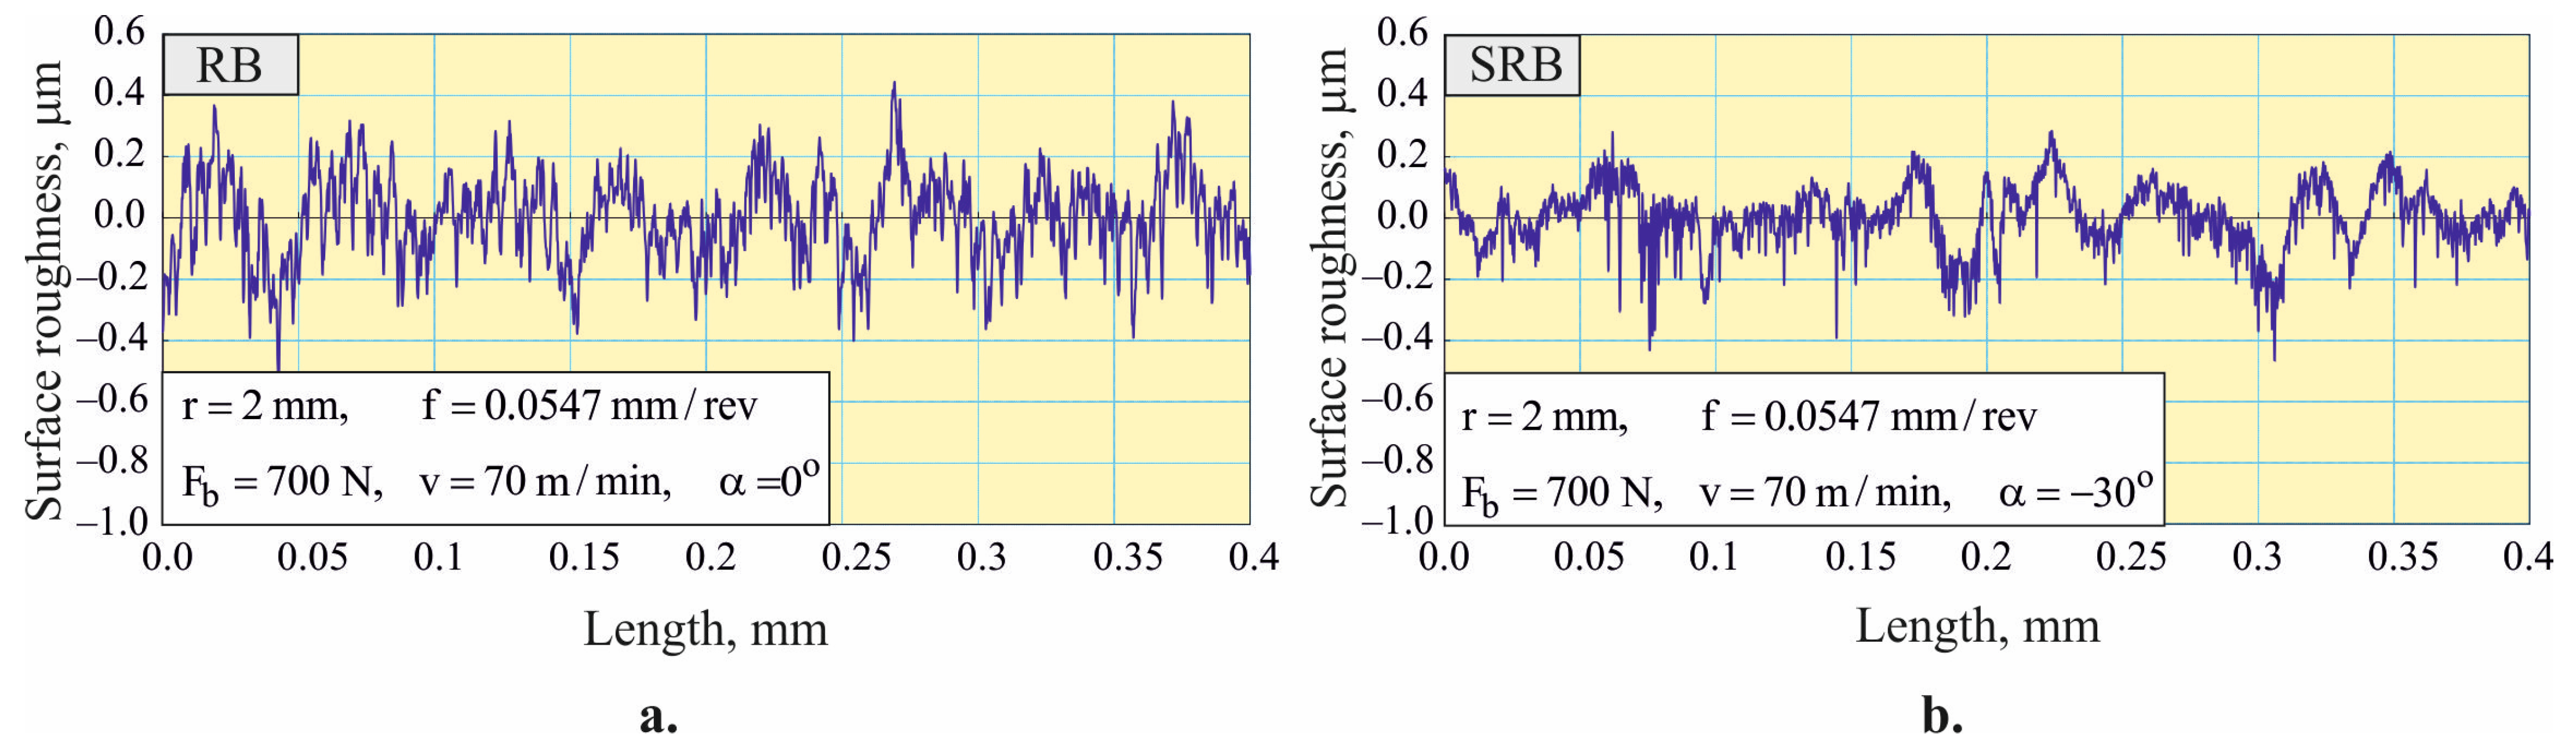
  • Both the RB and SRB processes provide a favorable surface texture characterized by negative skewness and a kurtosis close to or greater than three. This effect is more pronounced in SRB than in RB, when the strain hardening is greater. Therefore, SRB implemented as a hardening or mixed process is particularly suitable for improving the tribological behavior of AISI 316 steel components under boundary and mixed friction conditions.
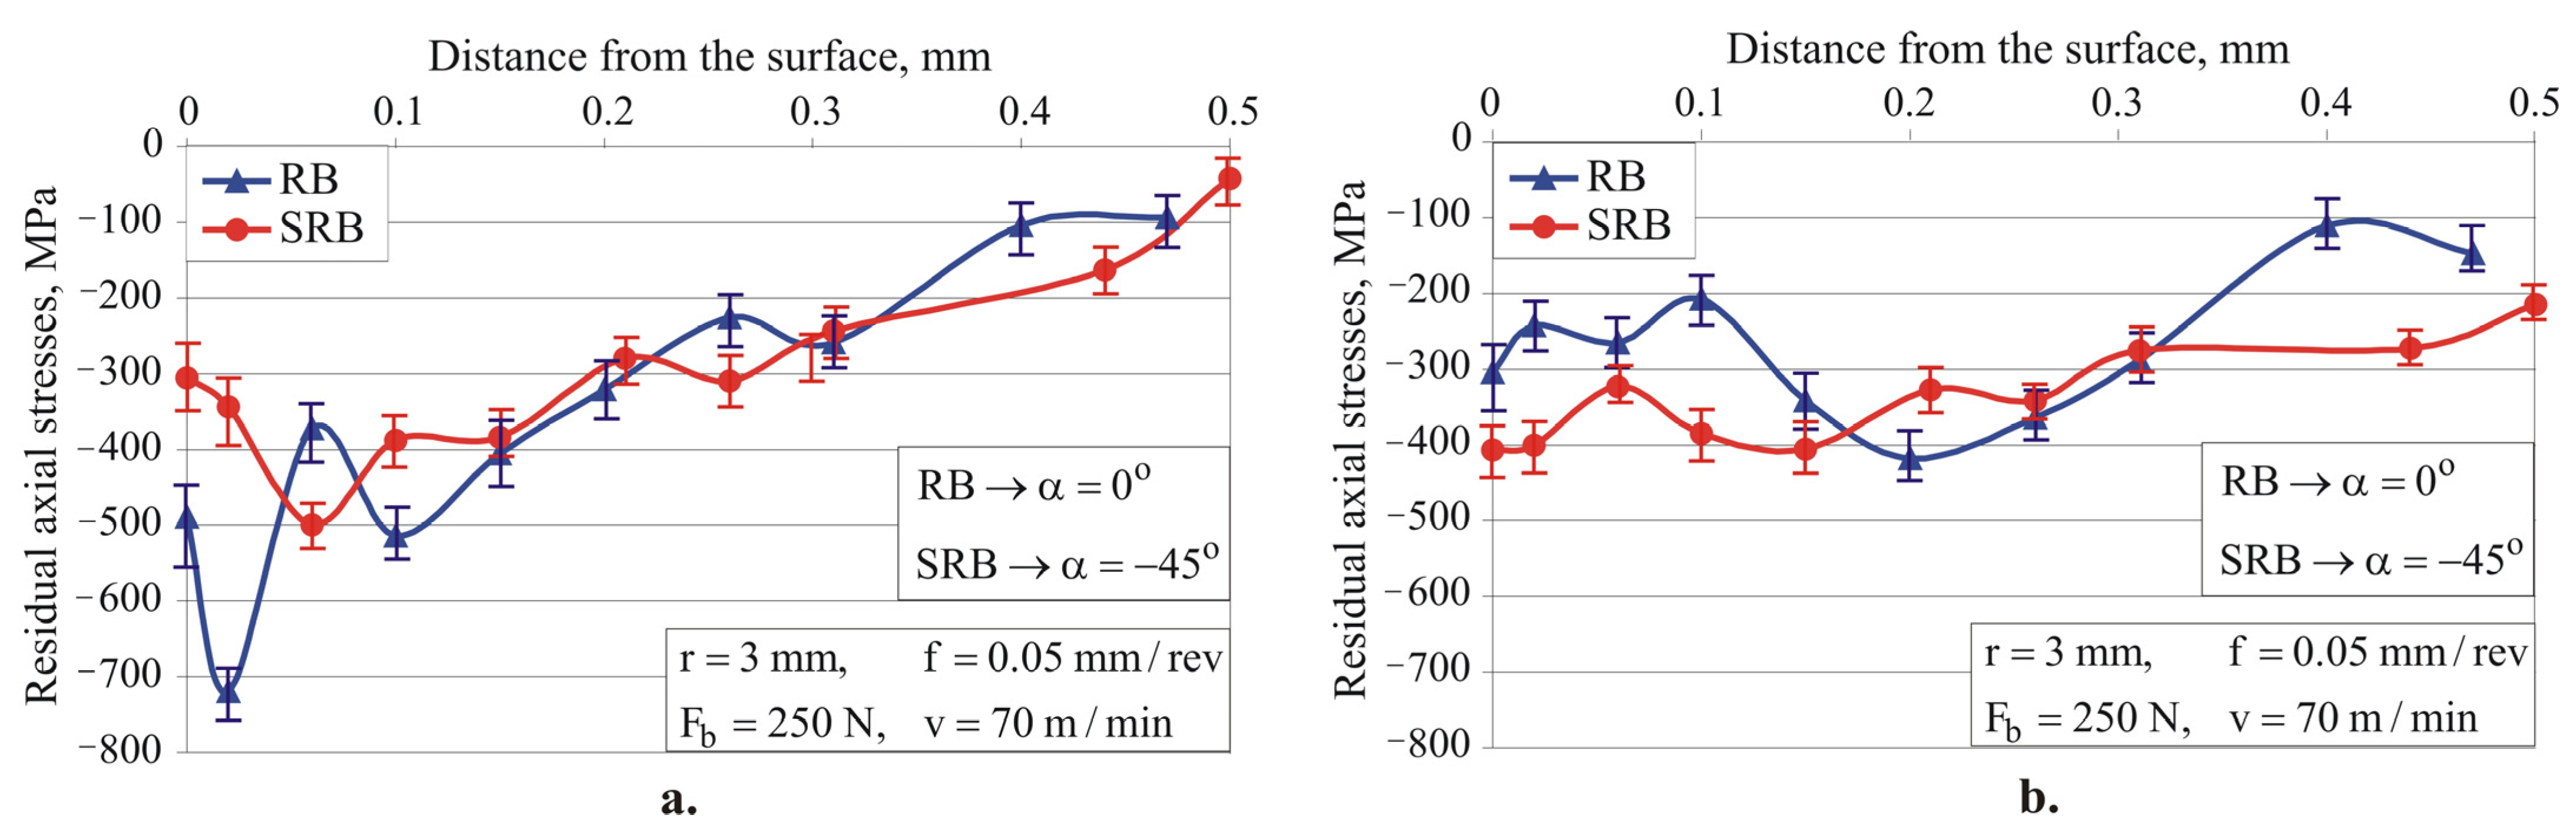
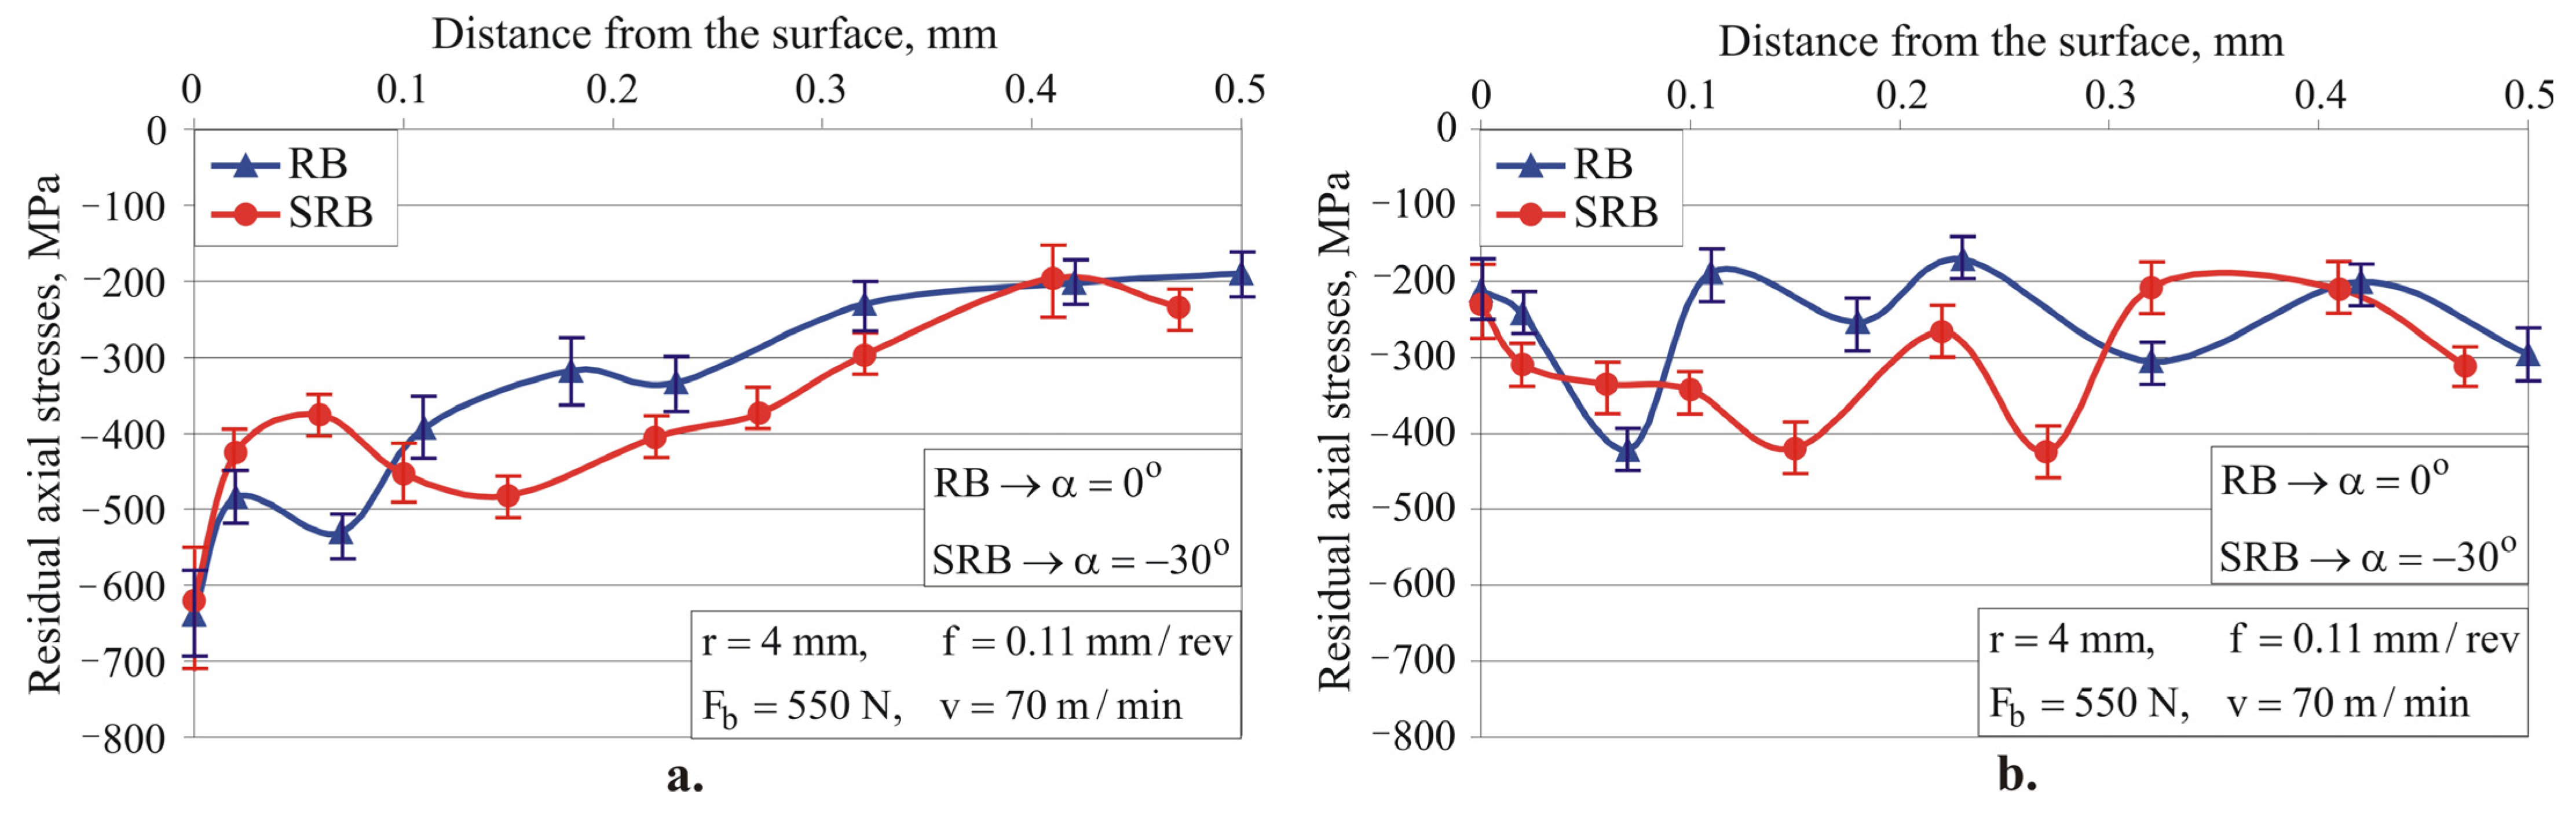
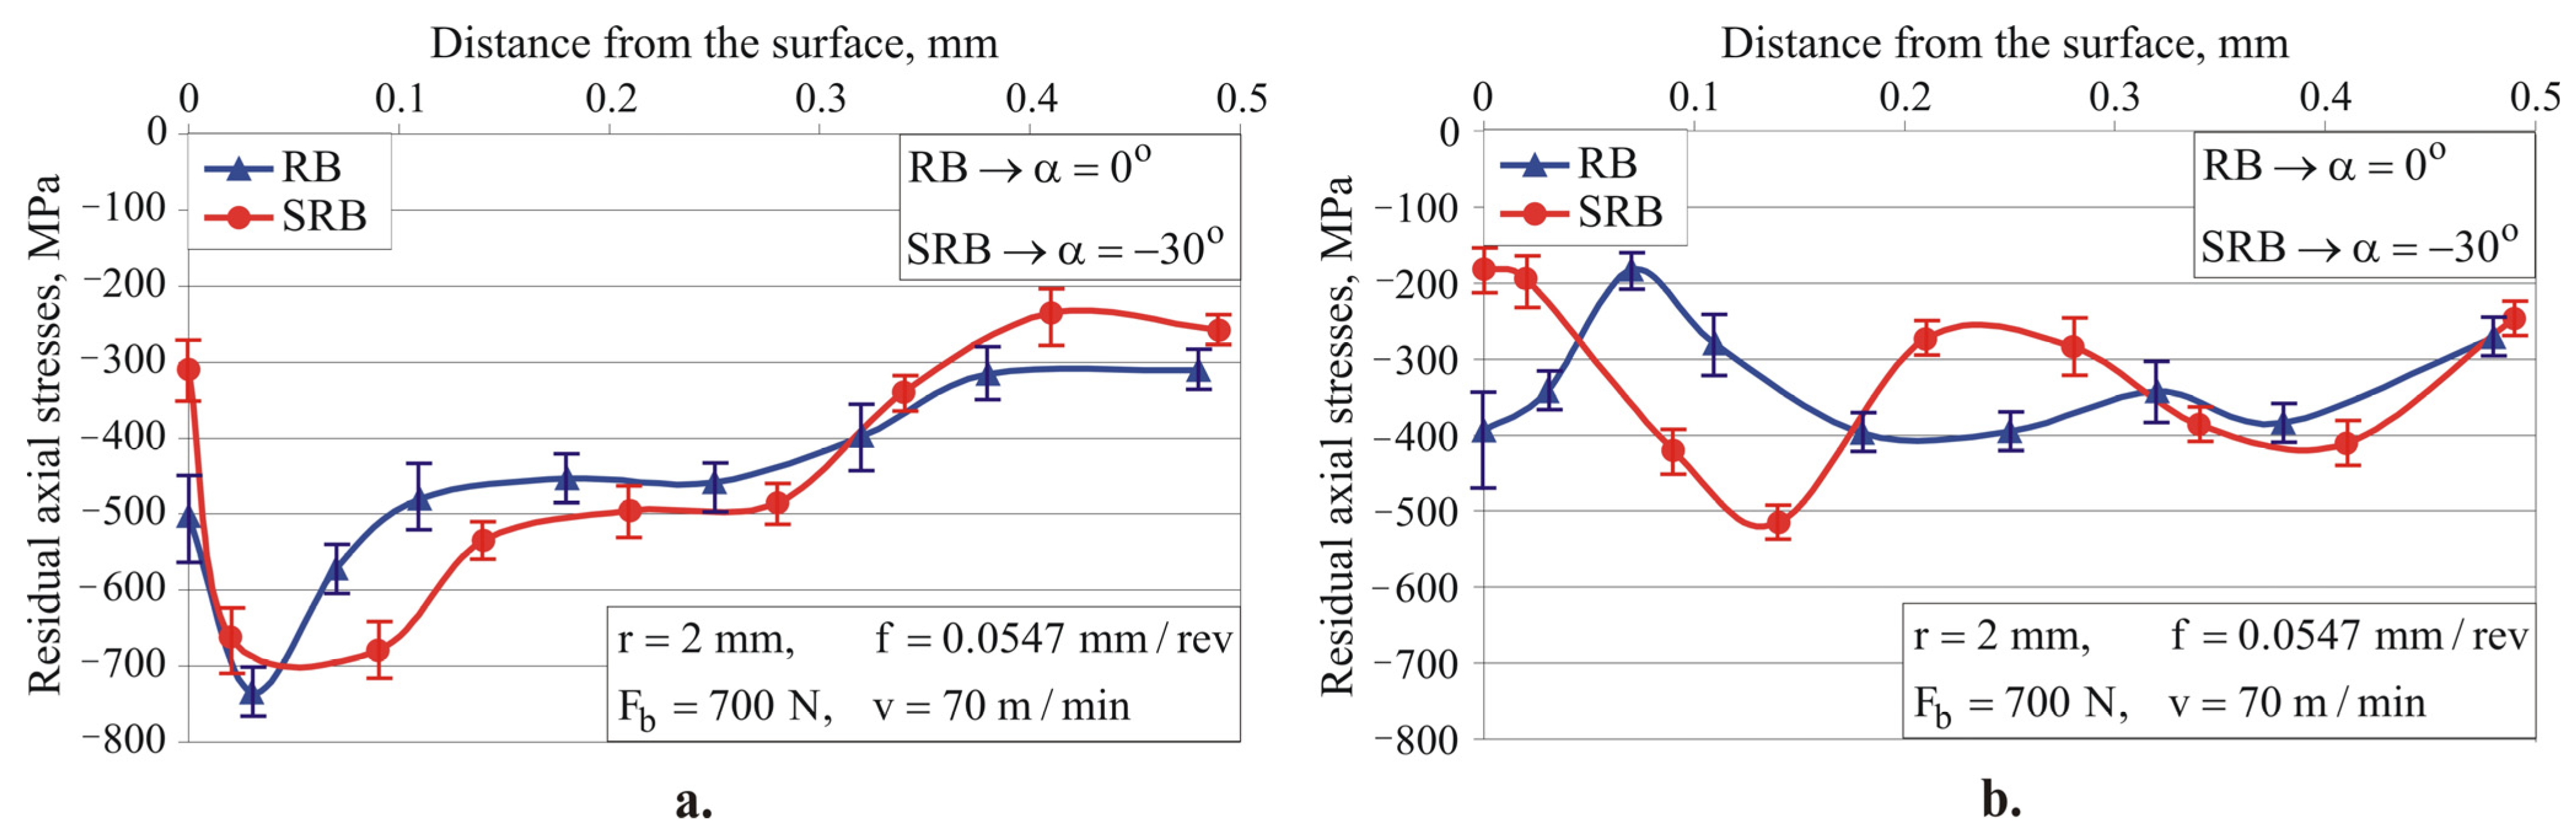
  • Single-toroidal RB and SRB (for all three implementation options: smoothing, hardening, and mixed processes) introduce significant compressive RS at a depth greater than 0.5 mm. However, on the basis of only RS distribution, it is not possible to predict which of the two methods is more effective at enhancing fatigue strength.
  • Both single-toroidal RB and SRB provide substantial improvement in the investigated surface integrity characteristics, but SRB has a significant advantage in terms of roughness and microhardness. On the basis of only roughness, microhardness, and RS distribution, it is difficult to predict the operational behavior (wear under dry friction conditions and fatigue) of machined components, since the microstructure and orientation of the surface texture are important surface integrity characteristics. Therefore, to establish which of the two methods provides better operational behavior, additional studies of the relationships between the surface integrity characteristics and the wear resistance and fatigue behavior are necessary.

Author Contributions

Conceptualization, J.M. and G.D.; methodology, J.M. and G.D.; software, J.M. and G.D.; validation, J.M., G.D., A.A. and V.D.; formal analysis, G.D. and J.M.; investigation, A.A., V.D., K.A., P.D., G.D. and J.M.; resources, J.M. and G.D.; data curation, J.M. and G.D.; writing—original draft preparation, J.M. and G.D.; writing—review and editing, J.M. and G.D.; visualization, J.M., G.D., A.A. and V.D.; supervision, J.M. and G.D.; project administration, J.M. and G.D.; funding acquisition, J.M. and G.D. All authors have read and agreed to the published version of the manuscript.

Funding

This research was supported by the European Regional Development Fund within the OP. “Science and Education for Smart Growth 2014–2020”, Project CoC “Smart Mechatronics, Eco- and Energy Saving Systems and Technologies”, No. BG05M2OP001-1.002-0023.

Data Availability Statement

Data are contained within the article.

Conflicts of Interest

The authors declare no conflicts of interest.

References

  1. Catalogue, E. Tools and Solutions for Metal Surface Improvement; Ecoroll Corporation Tool Technology: Milford, OH, USA, 2006. [Google Scholar]
  2. Korzynski, M. Slide diamond burnishing. In Nonconventional Finishing Technologies; Polish Scientific Publishers: Warsaw, Poland, 2013; pp. 9–33. [Google Scholar]
  3. Dwivedi, D.K. Surface Engineering. In Enhancing Life of Tribological Components; Korzynski, M., Ed.; Springer: New Delhi, India, 2018; ISBN 978-81-322-3779-2. [Google Scholar]
  4. Korzynski, M. Modelling and experimental validation of the force-surface roughness relation for smoothing burnishing with a spherical tool. Int. J. Mach. Tools Manuf. 2007, 47, 1956–1964. [Google Scholar] [CrossRef]
  5. Maximov, J.T.; Duncheva, G.V.; Anchev, A.P.; Dunchev, V.P. Slide burnishing versus deep rolling—A comparative analysis. Int. J. Mach. Tools Manuf. 2020, 110, 1923–1939. [Google Scholar] [CrossRef]
  6. Maximov, J.T.; Duncheva, G.V.; Anchev, A.P.; Dunchev, V.P.; Argirov, Y.B. Effect of Diamond Burnishing on Fatigue Behaviour of AISI 304 Chromium-Nickel Austenitic Stainless Steel. Materials 2022, 15, 4768. [Google Scholar] [CrossRef]
  7. Prevey, P.S. Burnishing Method and Apparatus for Providing a Layer of Compressive Residual Stress in the Surface of a Workpiece. U.S. Patent 5826453, 27 October 1998. [Google Scholar]
  8. Prevey, P.S. The effect of cold work on the thermal stability of residual compression in surface enhanced IN718. In Proceedings of the 20th ASM Materials Solutions Conference & Exposition, St. Louis, MO, USA, 10–12 October 2000. [Google Scholar]
  9. Prevey, P.S.; Ravindranath, R.; Shepard, M.; Gabb, T. Case Studies of Fatigue Life Improvement Using Low Plasticity Burnishing in Gas Turbine Engine Applications. J. Eng. Gas Turbines Power 2006, 128, 865–872. [Google Scholar] [CrossRef]
  10. Balevski, A.T. Metal Science; Technika: Sofia, Bulgaria, 1988. (In Bulgarian) [Google Scholar]
  11. Tugay, I.O.; Hosseinzadeh, A.; Yapici, G.G. Hardness and wear resistance of roller burnished 316L stainless steel. Mater. Today Proc. 2021, 47, 2405–2409. [Google Scholar] [CrossRef]
  12. Akkurt, A. Comparison of roller burnishing method with other hole surface finishing processes applied on AISI 304 austenitic stainless steel. J. Mater. Eng. Perform. 2011, 20, 960–968. [Google Scholar] [CrossRef]
  13. Gharbi, K.; Ben Moussa, N.; Ben Rhouma, A.; Ben Fredj, N. Improvement of the corrosion behavior of AISI 304L stainless steel by deep rolling treatment under cryogenic cooling. Int. J. Adv. Manuf. Technol. 2021, 117, 3841–3857. [Google Scholar] [CrossRef]
  14. Juijerm, P.; Altenberg, I. Fatigue performance enhancement of steels using mechanical surface treatments. J. Met. Mater. Miner. 2007, 17, 59–65. [Google Scholar]
  15. Juijerm, P.; Altenberg, I. Fatigue performance of high-temperature deep-rolled metallic materials. J. Met. Mater. Miner. 2007, 17, 37–41. [Google Scholar]
  16. Munoz-Cubillos, J.; Coronado, J.J.; Rodriguez, S.A. Deep rolling effect on fatigue behaviour of austenitic stainless steels. Int. J. Fatigue 2017, 95, 120–131. [Google Scholar] [CrossRef]
  17. Nikitin, I.; Altenberger, I.; Scholtes, B. Effects of deep rolling at elevated and low temperatures on the isothermal fatigue of AlSl304. Altern. Process. 2005, 70, 185–190. [Google Scholar]
  18. Nikitin, I.; Altenberger, I. Comparison of the fatigue behaviour and residual stress stability of laser-shock peened and deep rolled austenitic stainless steel AISI 304 in the temperature range 25–600 °C. Mater. Sci. Eng. A 2007, 465, 176–182. [Google Scholar] [CrossRef]
  19. Nikitin, I.; Scholtes, B.; Maier, H.J.; Altenberger, I. High temperature fatigue behaviour and residual stress stability of laser-shock peened and deep rolled austenitic steel AISI 304. Scr. Mater. 2004, 50, 1345–1350. [Google Scholar] [CrossRef]
  20. Tadi, A.J.; Hosseini, S.R.; Semiromi, N.M. Formation of surface nano/ultrafine structure using deep rolling process on the AISI 316L stainless steel. Mater. Sci. Eng. Int. J. 2017, 1, 88–93. [Google Scholar] [CrossRef]
  21. Yilmaz, H.; Sadeler, R. Impact wear behaviour of ball burnished 316L stainless steel. Surf. Coat. Technol. 2019, 363, 369–378. [Google Scholar] [CrossRef]
  22. Korzynski, M.; Dudek, K.; Korzynska, K. Effect of slide diamond burnishing on the surface layer of valve stems and the durability of the stem-graphite seal friction pair. Appl. Sci. 2023, 13, 6392. [Google Scholar] [CrossRef]
  23. Korzynski, M.; Dudek, K.; Kruczek, B.; Kocurek, P. Equilibrium surface texture of valve stems and burnishing method to obtain it. Tribol. Int. 2018, 124, 195–199. [Google Scholar] [CrossRef]
  24. Korzynski, M.; Dudek, K.; Palczak, A.; Kruczek, B.; Kocurek, P. Experimental models and correlations between surface parameters after slide diamond burnishing. Meas. Sci. Rev. 2018, 18, 123–129. [Google Scholar] [CrossRef]
  25. Skoczylas, A.; Zaleski, K.; Matuszal, J.; Ciecielag, K.; Zaleski, R.; Gorgol, M. Influence of slide burnishing parameters on the surface layer properties of stainless steel and mean positron lifetime. Materials 2022, 15, 8131. [Google Scholar] [CrossRef] [PubMed]
  26. Maximov, J.T.; Duncheva, G.V.; Anchev, A.P.; Ganev, N.; Dunchev, V.P. Effect of cyclic hardening on fatigue performance of slide burnishing components made of low-alloy medium carbon steel. Fatigue Fract. Eng. Mater. Struct. 2019, 42, 1414–1425. [Google Scholar] [CrossRef]
  27. Vuchkov, I.N.; Vuchkov, I.I. QStatLab Professional, version 6.1.1.3; Statistical Quality Control Software, User’s Manual; QStatLab: Sofia, Bulgaria, 2009. [Google Scholar]
  28. Deb, K.; Pratap, A.; Agarwal, S.; Meyarivan, T. A fast and elitist multiobjective genetic algorithm: NSGA-II. IEEE Trans. Evol. Comput. 2002, 6, 182–197. [Google Scholar] [CrossRef]
  29. Pawlus, P.; Reizer, R.; Wieczorowski, M. Functional Importance of Surface Texture Parameters. Materials 2021, 14, 5326. [Google Scholar] [CrossRef]
  30. Alang, N.A.; Razak, N.A.; Miskam, A.K. Effect of Surface Roughness on Fatigue Life of Notched Carbon Steel. Int. J. Eng. Technol. IJET-IJENS 2011, 11, 161–163. [Google Scholar]
  31. Li, C.; Dai, W.; Duan, F.; Zhang, Y.; He, D. Fatigue Life Estimation of Medium-Carbon Steel with Different Surface Roughness. Appl. Sci. 2017, 7, 338. [Google Scholar] [CrossRef]
  32. Whitehouse, D.J. Handbook of Surface and Nanometrology; CRC Press: Boca Raton, FL, USA, 2011. [Google Scholar]
  33. Sedlacek, M.; Podgornik, B.; Vizintin, J. Correlation between standard roughness parameters skewness and kurtosis and tribological behavior of contact surface. Tribol. Int. 2012, 48, 102–112. [Google Scholar] [CrossRef]
Figure 1. Burnishing methods: (a) slide burnishing; (b) roller burnishing; and (c) ball burnishing.
Machines 12 00051 g001
Figure 2. Flow chart of the investigations.
Machines 12 00051 g002
Figure 3. Implementation of slide roller burnishing—general view.
Machines 12 00051 g003
Figure 4. Kinematics of SRB (feed motion is turned off): (a) absolute motions; (b) relative motion of the deforming roller to the workpiece; and (c) diagram of the unit-normalized sliding velocity vector.
Machines 12 00051 g004
Figure 5. Kinematics of SRB (feed motion is turned on): (a) 0° < α < 90°; (b) −90° < α < 0°.
Machines 12 00051 g005
Figure 6. Variation of the characteristics of the absolute sliding velocity depending on the crossing angle α : (a) magnitude normalized to unity and (b) angle β .
Machines 12 00051 g006
Figure 7. Visualization of the theoretical surface roughness depth: (a) roller geometry; (b) RB process; and (c) SRB process.
Machines 12 00051 g007
Figure 8. Burnishing device.
Machines 12 00051 g008
Figure 9. RB process implementation on Index Traub CNC lathe.
Machines 12 00051 g009
Figure 10. Tensile test outcomes: (a) specimen geometry and photo and (b) nominal stress–nominal strain diagram and main mechanical characteristics.
Machines 12 00051 g010
Figure 11. Influence of the radius (a), burnishing force (b), and feed rate (c) on the roughness height and shape parameters, and surface microhardness.
Machines 12 00051 g011
Figure 12. ANOVA main effects: (a) roughness parameter R a , μ m and (b) microhardness HV0.1.
Machines 12 00051 g012
Figure 13. Graphical visualization of the models: (a) roughness parameter R a and (b) microhardness.
Machines 12 00051 g013
Figure 14. Generated Pareto front.
Machines 12 00051 g014
Figure 15. Effect of crossing angle on roughness parameter R a and microhardness HV0.1: (a) smoothing, (b) hardening, and (c) mixed processes.
Machines 12 00051 g015
Figure 16. Evaluation profiles: (a) RB and (b) SRB smoothing processes.
Machines 12 00051 g016
Figure 17. Residual stress distribution due to smoothing processes: (a) axial and (b) hoop.
Machines 12 00051 g017
Figure 18. Evaluation profiles: (a) RB and (b) SRB hardening processes.
Machines 12 00051 g018
Figure 19. Residual stress distribution due to hardening processes: (a) axial and (b) hoop.
Machines 12 00051 g019
Figure 20. Evaluation profiles: (a) RB and (b) SRB mixed processes.
Machines 12 00051 g020
Figure 21. Residual stress distribution due to mixed processes: (a) axial and (b) hoop.
Machines 12 00051 g021
Table 1. Characteristics of the residual stress X-ray measurement.
Measuring DeviceBruker D8 Advance Diffractometer
X-ray tubeLong focus Cr–Kα
Crystallographic planeFe(γ)–(220)
Diffraction angle (2θ)128.78° (124°–133°)
Measuring methodOffset coupled TwoTheta/Theta (sin2ψ method)
Scan modeContinuous PSD fast
X-ray detectorSSD160-2 (1D scanning)
Collimator spot sizeStandard Φ1.0 mm
Measurement time for single scanApprox. 35 s
Elastic constant s1−1.352 × 10 6  
Elastic constant 1/2s26.182 × 10 6
Voltage30 kV
Current40 mA
Step size0.5°
Time for step1 s
Table 2. Chemical composition (in wt%) of the tested AISI 316 austenitic stainless steel.
FeCSiMnPSCrNiNbTiMoCuCoWV
67.30.03840.1691.750.03540.00818.39.350.03580.00522.030.5590.2030.10.078
Table 3. Levels of the governing factors.
Governing FactorsNaturalCoddedLevels
Radius of the roller
toroidal surface
r, mm x 1 233.545−1−0.33300.3331
Burnishing force F b , N x 2 100250400550700−1−0.500.51
Feed rate f , m m / r e v x 3 0.020.050.080.110.14
Table 4. Experimental plan and outcomes.
x 1 x 2 x 3 R a ,
  μ m
R a ,   μ m
Scattering
Y R a ,
μ m
H V H V
Scattering
Y H V
++
1−1−1−10.1330.0140.0080.1395397.62624392.11
21−1−10.1580.0060.0030.16244023221400.23
3−11−10.1070.0140.0260.1194406.62029406.13
411−10.2610.0220.0150.2454416.11916414.26
5−1−110.2800.0060.0110.2783397.12930400.23
61−110.2540.0080.0070.2554388.02729392.11
7−1110.3470.0180.0410.3614413.92032414.26
81110.2360.0480.0190.2353404.21725406.13
9−1000.2450.0120.0130.2404437.92133438.60
101000.2690.0300.0320.2404439.33534438.60
110−100.1800.0030.0060.1559390.41724390.40
120100.1470.0060.0080.1229427.21832427.20
1300−10.2700.0330.0380.2459404.21313403.60
140010.2100.0150.0050.18594032422403.60
15−0.333−0.5−0.50.1060.0050.0050.1428400.41633406.20
160.333−0.5−0.50.1410.0110.0120.1509403.72526406.35
17−0.3330.5−0.50.2300.0160.0150.20574202244444.72
180.3330.5−0.50.1680.0110.0150.2224436.12628444.87
19−0.333−0.50.50.1440.0080.0040.1654400.33625406.35
200.333−0.50.50.1710.0280.0110.1572420.71418406.20
21−0.3330.50.50.2140.0310.0200.2369457.12930444.72
220.3330.50.50.2190.0250.0230.22024661425444.87
Table 5. Regression coefficients.
b 0 b 2 b 11 b 22 b 33 b 222 b 333 b 3333
Y R a 0.1855440.0844170.054893−0.0461490.030350−0.100917−0.0300000
Y H V 438.600046.91700−29.8000−22.6117−28.51700−12.3883
b 13 b 112 b 123 b 223 b 233 b 1113 b 1122
Y R a −0.0372390−0.0257900.0879530.03225000
Y H V 0−11.3875000−4.063329.3875
Table 6. Compromise optimal values.
Process x 1 * r * , m m x 2 * F b * , N x 3 * f * , m m / r e v R a * , μ m H V *
Smoothing−0.3333−0.5250−0.50.050.106400.4
Hardening0.33340.55500.50.110.219466
Mixed−1217000.42120.05470.127439.1
Table 7. Comparison of the surface integrity characteristics obtained via smoothing RB and SRB processes.
ProcessSurface Integrity Characteristics
2D Roughness ParametersMicrohardness
R a
μm
R q
μm
R p
μm
R v
μm
R s k R k u R k
μm
R p k
μm
R v k
μm
HV0.1
RB0.1300.1670.3880.672−0.5694.3480.4160.1460.231414
SRB0.0680.0830.1820.245−0.2212.6500.2120.0560.100404
Table 8. Comparison of the surface integrity characteristics obtained via hardening RB and SRB processes.
ProcessSurface Integrity Characteristics
2D Roughness ParametersMicrohardness
R a
μm
R q
μm
R p
μm
R v
μm
R s k R k u R k
μm
R p k
μm
R v k
μm
HV0.1
RB0.1630.2020.4660.631−0.2483.4170.5550.1530.223421
SRB0.0730.0930.2250.420−0.5315.0400.2330.0880.137424
Table 9. Comparison of the surface integrity characteristics obtained via mixed RB and SRB processes.
ProcessSurface Integrity Characteristics
2D Roughness ParametersMicrohardness
R a
μm
R q
μm
R p
μm
R v
μm
R s k R k u R k
μm
R p k
μm
R v k
μm
HV0.1
RB0.1170.1450.3420.429−0.2742.9070.3810.1220.172415
SRB0.0800.1050.2170.441−0.7635.7480.2380.0770.175420
Disclaimer/Publisher’s Note: The statements, opinions and data contained in all publications are solely those of the individual author(s) and contributor(s) and not of MDPI and/or the editor(s). MDPI and/or the editor(s) disclaim responsibility for any injury to people or property resulting from any ideas, methods, instructions or products referred to in the content.

