Article

Prediction of Self-Loosening Mechanism and Behavior of Bolted Joints on Automotive Chassis Using Artificial Intelligence

1
TOFAŞ Türk Otomobil Fabrikası A.Ş, Bursa 16058, Türkiye
2
Automotive Engineering Department, Bursa Uludağ University, Bursa 16059, Türkiye
*
Author to whom correspondence should be addressed.
Machines 2023, 11(9), 895; https://doi.org/10.3390/machines11090895
Submission received: 30 June 2023 / Revised: 27 July 2023 / Accepted: 28 July 2023 / Published: 9 September 2023
(This article belongs to the Section Robotics, Mechatronics and Intelligent Machines)

Abstract

:
The tightening torque values considered in the assembly of vehicle subparts are of great importance in terms of connection safety. The torque value to be selected is different for each bolted joint type with respect to mechanical features. While the tightening torque value is an important indicator, the bolt preloading value is always a more reliable parameter in terms of whether a secure tightening can be achieved or not. For this reason, when it is desired to create reliable joints, the preloading value that the tightening torque input will create on the connection package should be calculated well. This study presents an integrated approach using Taguchi method (TM) and neural network (NN) to predict the self-loosening mechanism of bolted joints in automotive chassis engine suspension connections. External loading acting on the joints of the engine suspension was collected from bench tests. NN was applied to establish the relationship between controlled factors and loosening rate. The results showed that the proposed approach can be used to predict mechanism of self-loosening and behavior of bolted joints without additional tests, and it is possible to make predictions with very low error rates using artificial intelligence techniques.

1. Introduction

The tightening torque and clamp loading values in the assembly of vehicle chassis subparts are of great importance in terms of bolted joint safety. This is due to the possibility that any loosening or unraveling situation may cause a crash. There are some examples that are recorded due to loosening of fasteners, resulting in death and injury [1,2,3]. Connections tightened with lower torque values than necessary may loosen over time due to external axial and radial dynamic loading. Excessive bolt elongation, wear on bolt–nut threads, or plastic deformations due to normal and shear stresses in the connected parts can be seen in bolted joints which are tightened to higher torque values than the safety limit [4]. Therefore, different tightening torque values should be applied for each bolted connection type with different mechanical properties.
Fasteners are exposed to multiple repetitive vibrations throughout their lifetime. This may cause self-loosening of the fasteners. While the behavior of bolts under static tensile and shear forces is well understood, their behavior under dynamic loading such as vibration is not well understood. Many theories are developed to explain how a bolt and nut interact under vibrating loads. While these theories have proven helpful in understanding bolt–nut interaction, none are adequate to predict bolt loosening [5]. Kandreegula et al. [6] developed a new innovative wedge washer to increase the loosening resistance of automotive fasteners. Datta and Dittur [7] calculated the minimum bolt preloading required to detect the loosening resistance of the automotive suspension links and to eliminate the bolt loosening tendency in the link under certain variable loads. Gürsel and Yarkın [8] calculated the tightening torque values of the chassis bolted joints, considering the lower and upper torque control limits. They verified the robust joint structure with road test results by tightening the connections to the most suitable torque, meeting the design criteria.
Several research studies investigating the loosening behavior of bolted connections are given in literature. Liu et al. [9] carried out experimental tests to obtain a piecewise function characterizing the overall shear curve of bolted joints under transverse loading. The parameters of joint loosening at various stages were analyzed and discussed on the basis of experimental results, which can assist in the design and use of bolted connections. The single-shot multi-box detector (SSD) algorithm was used to train the image datasets. Huang et al. [10] classifies various detection methods as sensor-based, image-based, and percussion-based methods and systematically summarized their research progress. The sensor-based method inserts or attaches sensors to the mechanical structure with bolted connections and provides loosening detection by exploiting the variation in the measurement parameters of the sensors. Guo et al. [11] defined a new method for the early looseness state of bolted joint beams on the basis of generalized variable mode decomposition (GVMD), and a similarity index was proposed. Eraliev et al. [12] studied early-stage bolt loosening detection using machine learning classifiers for a multi-bolt structure using a vibration-based method.
In the literature, experimental axial vibration, torsional vibration, and transverse vibration tests were carried out in some studies on self-loosening of bolted joints. Goodier and Sweeney [13] conducted axial vibration tests at various force ranges in their test rigs to loosen bolted connections and developed some equations for loosening nuts. They found rotation in the relaxation direction at very small angles for bolted connections under axial vibration. Later, Sauer et al. [14] performed the same work as Goodier and Sweeney under a more practical vibration instead of quasi-static loading and obtained greater relaxation rates. During testing, they showed that used nuts were more prone to loosening than new ones. Gambrel [15] investigated the effects of axial vibration, lubricant effect, and fastener pitch parameters on joint loosening. It is seen that axial vibration did not have a significant effect on joint loosening.
Hess and Davis [16,17] investigated the behavior of connections under axial harmonic vibration and found a rotational path in both tightening and loosening directions. Hess also developed theoretical models to explain the behavior of bolt self-loosening [17,18,19,20]. Clark and Cook [21] repeated the same work of Goodier and Sweeney on the threaded blind hole connection instead of the bolt–nut connection, and no loosening was found. They found that, below a certain value, cyclic oscillation would not cause the bolt to loosen, while angular displacement had a limiting value. Sakai [22] theoretically investigated the relaxation behavior of bolted connections and calculated the critical rotational slip and relaxation angles between the parts connected under torsional vibration. Junker [23] revealed that transversal vibration creates a much more serious loosening condition than axial vibration for bolted joints. The loosening of the bolts after transversal vibration was much higher than that of axial vibration.
The researchers found that fasteners with a hole diameter that is too large for the screw diameter self-loosen faster. They also found that high-frequency vibration causes less self-relaxation than low-frequency vibration, because higher frequency will give the fastener less slip time per cycle [24]. Finkelston [25] performed similar vibration tests on the device designed by Junker and investigated the effect of bolt pitch-to-loosening ratio. There were other studies in the 1970s and 1980s that expanded Junker’s work [26,27,28,29]. The purpose of these studies was to reveal fasteners that are ineffective in resisting loosening.
Bhattacharya et al. [30] compared the vibration resistance of various locking fasteners. The vibration resistance of chemically locking solutions is better than all washer types, with the nylok nut coming after chemically locking fasteners. Dravid et al. [31] investigated the plain washer effectiveness against spring washer and no washer usage. As a result of experimental tests, it was shown that the spring washer performs worse than the plain washer, and the resistance of the joint to loosening increases when the applied torque increases. Yokoyama et al. [32] investigated the self-loosening mechanism in bolted joints subjected to axial loading using three-dimensional finite element analysis. The relations between the nut rotation angle and the applied torque were verified with experimental tests. Dinger et al. [33] investigated the effect of critical slips on under head of the bolt and threads. A 3D numerical simulation model was created and validated with experimental tests. The friction effect was considered in all contact areas. Liu et al. [34] found that torsional deformation in threads leads to the relative slip in high-strength bolts. A 3D finite element model was established to display the behavior of bolt threads under shear deformation. Izumi et al. [35] investigated the tightening and loosening processes of fasteners using the three-dimensional finite element method. Loosening due to shear force was initiated when full thread slippage was achieved before bolt head slippage. It was suggested that a design modification of fasteners is required.
In this study, rigid counter singular loosening performances of fasteners were examined. Junker’s theories and standardized test methods such as DIN 65151 [36] and DIN 25201 [37] are effective in terms of performance evaluation for single bolt and nut types. However, the rigid conditions in the Junker test approach are not suitable for automobile chassis bolted joint structures since the working conditions of the bolted joints on a vehicle are different, and external loading acting on the joints has variable frequency.
Although, in the literature, there are several studies determining the mechanism of self-loosening and behavior of bolted joints, there are only few studies which used intelligent approaches to predict the behavior of bolted joints. Some neural networks and optimization-based studies are usually introduced by estimating the outputs and optimizing the parameters in the case of black-box objective functions, which are expensive and time-consuming to evaluate. A neural network (NN) is often used to fully represent the complex relationship between inputs and outputs of the problem [38]. Khaw et al. [39] showed that it is possible to increase the benefit of NN design using TM. TM and NN methods are often used together in solving problems with multiple parameter inputs. TM uses orthogonal arrays (OAs) to design NNs, which reduces design and development times when building an NN model. Many benefits can come from using this method for neural network design. Lin [40] conducted a study using the Taguchi method (TM), along with the artificial neural network (NN) and genetic algorithm (GA) methods, to optimize the lap joint quality of aluminum pipe and flange in the automotive industry. Kechagias et al. [41] applied the artificial neural network (NN) method to estimate the cutting forces and average surface roughness in turning for Ti–6Al–4V alloy material using Taguchi method-assisted experimental design (DOE).
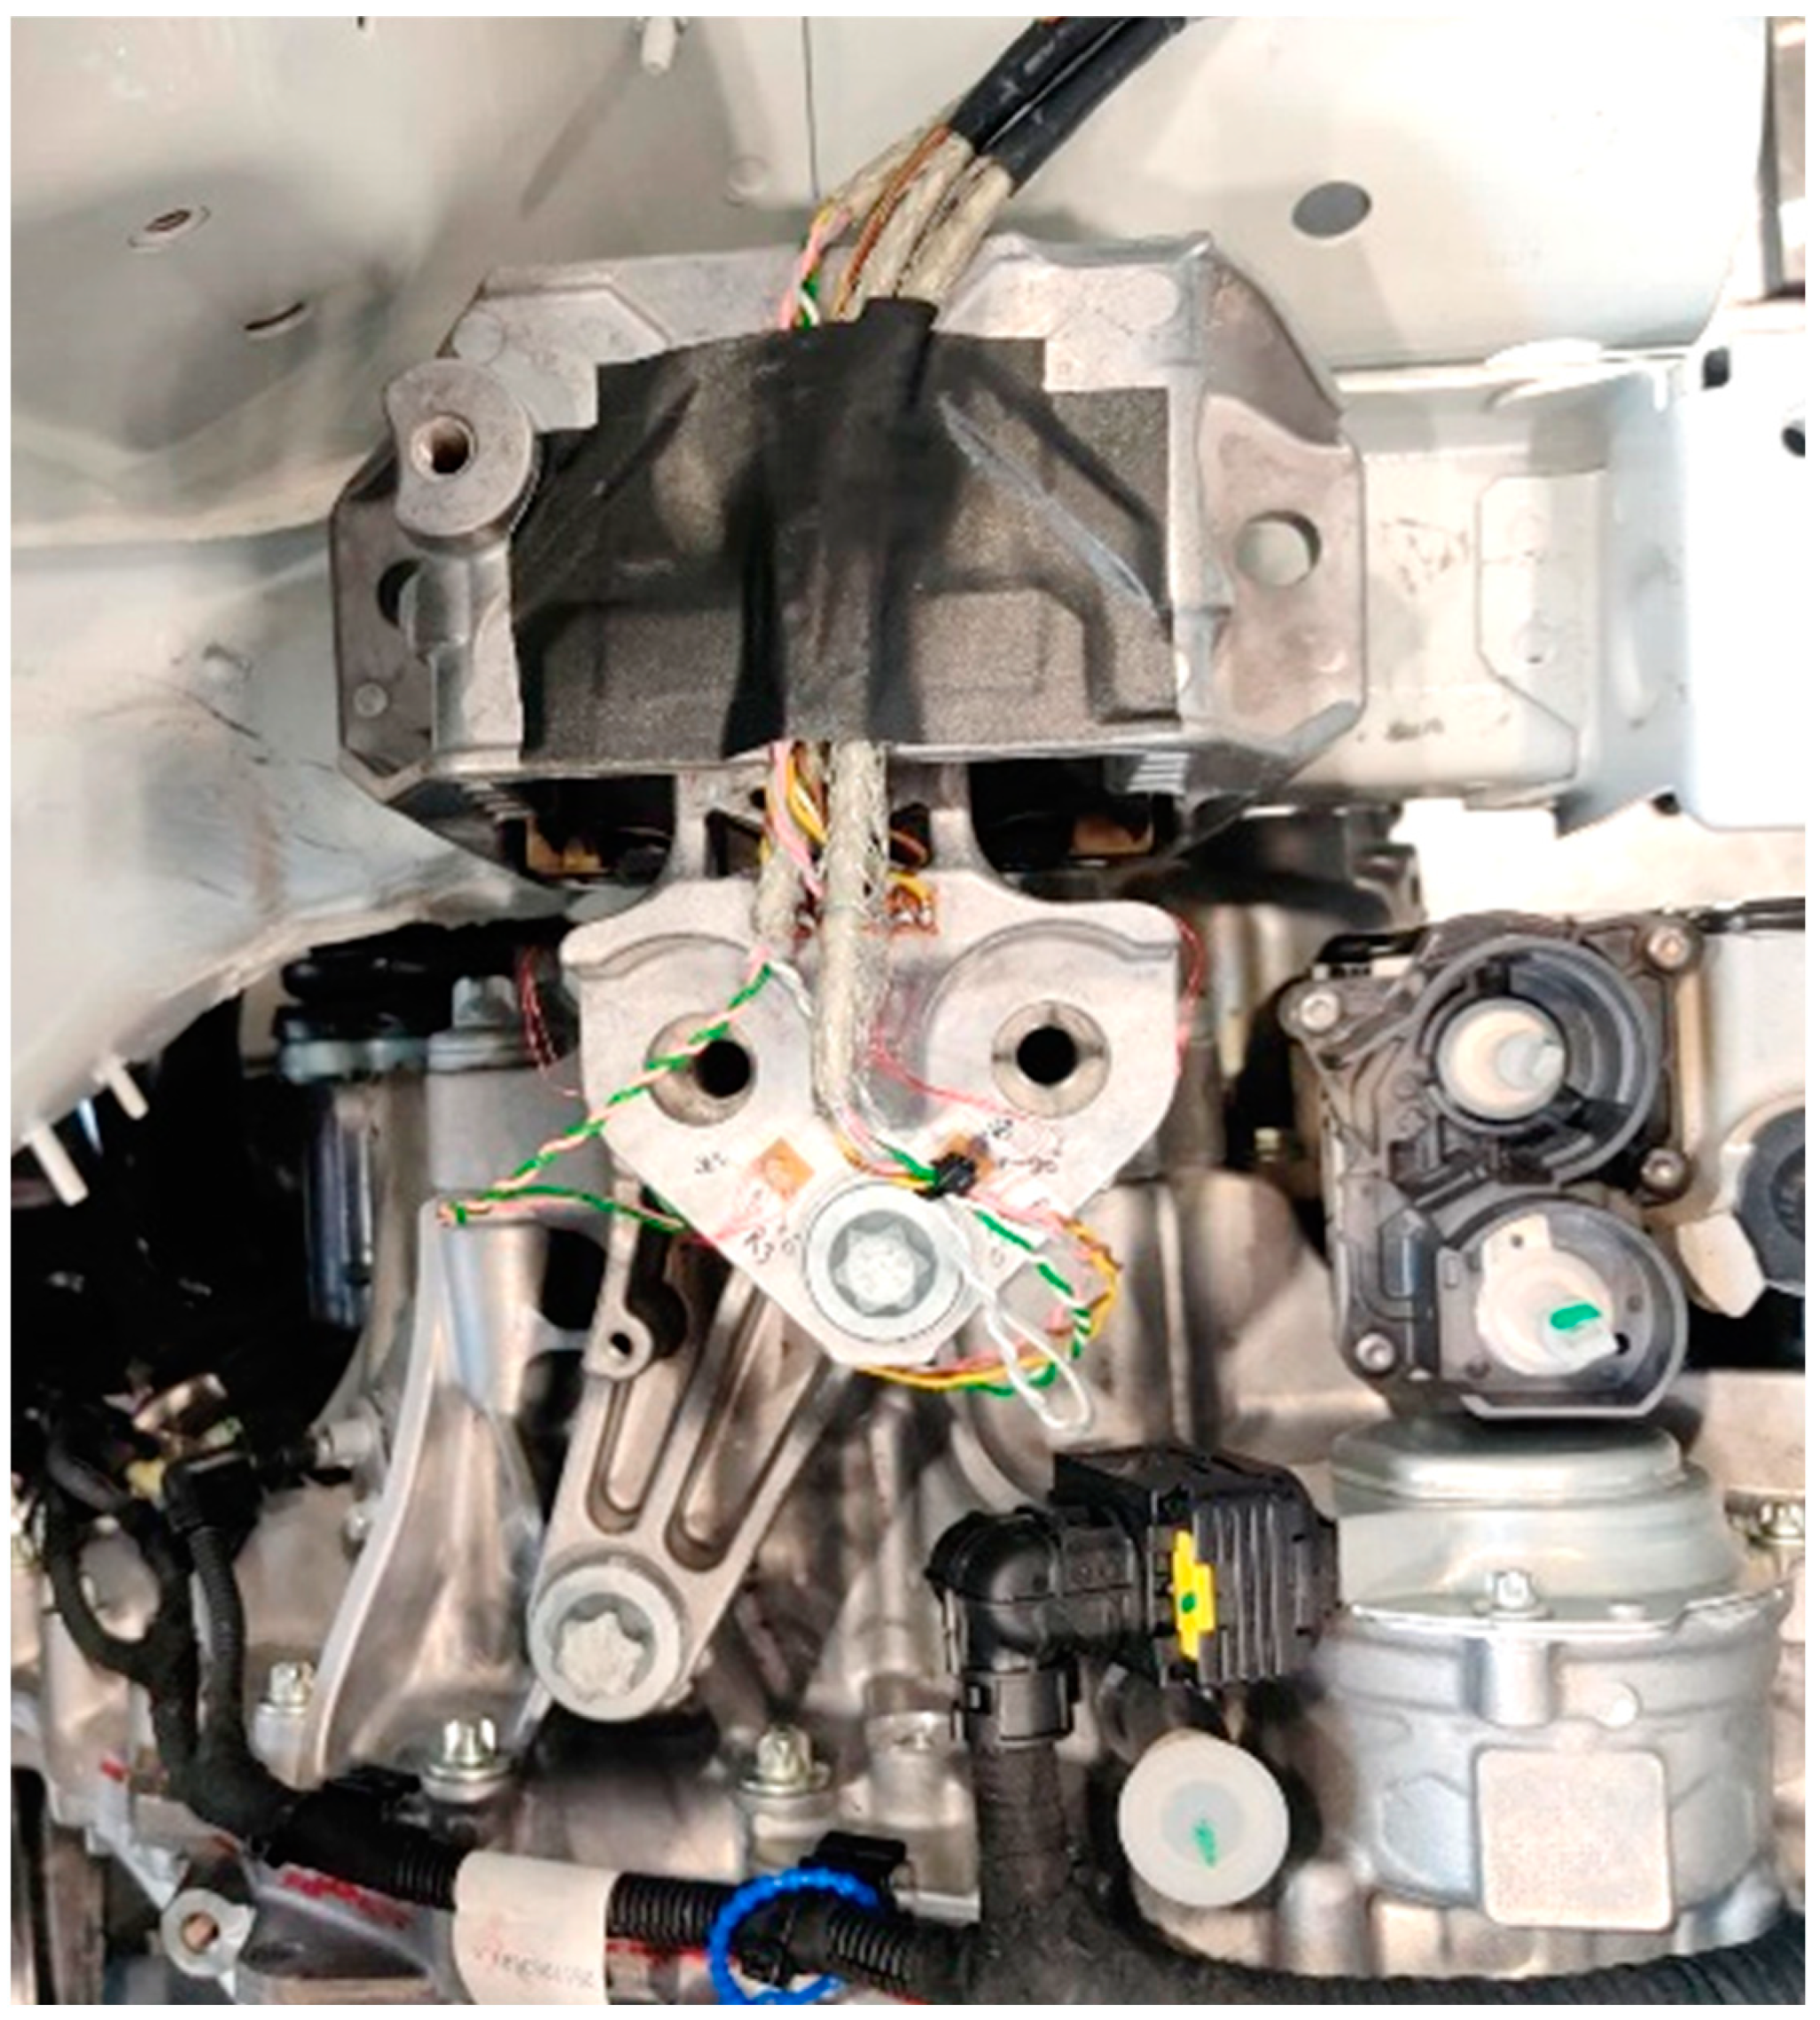
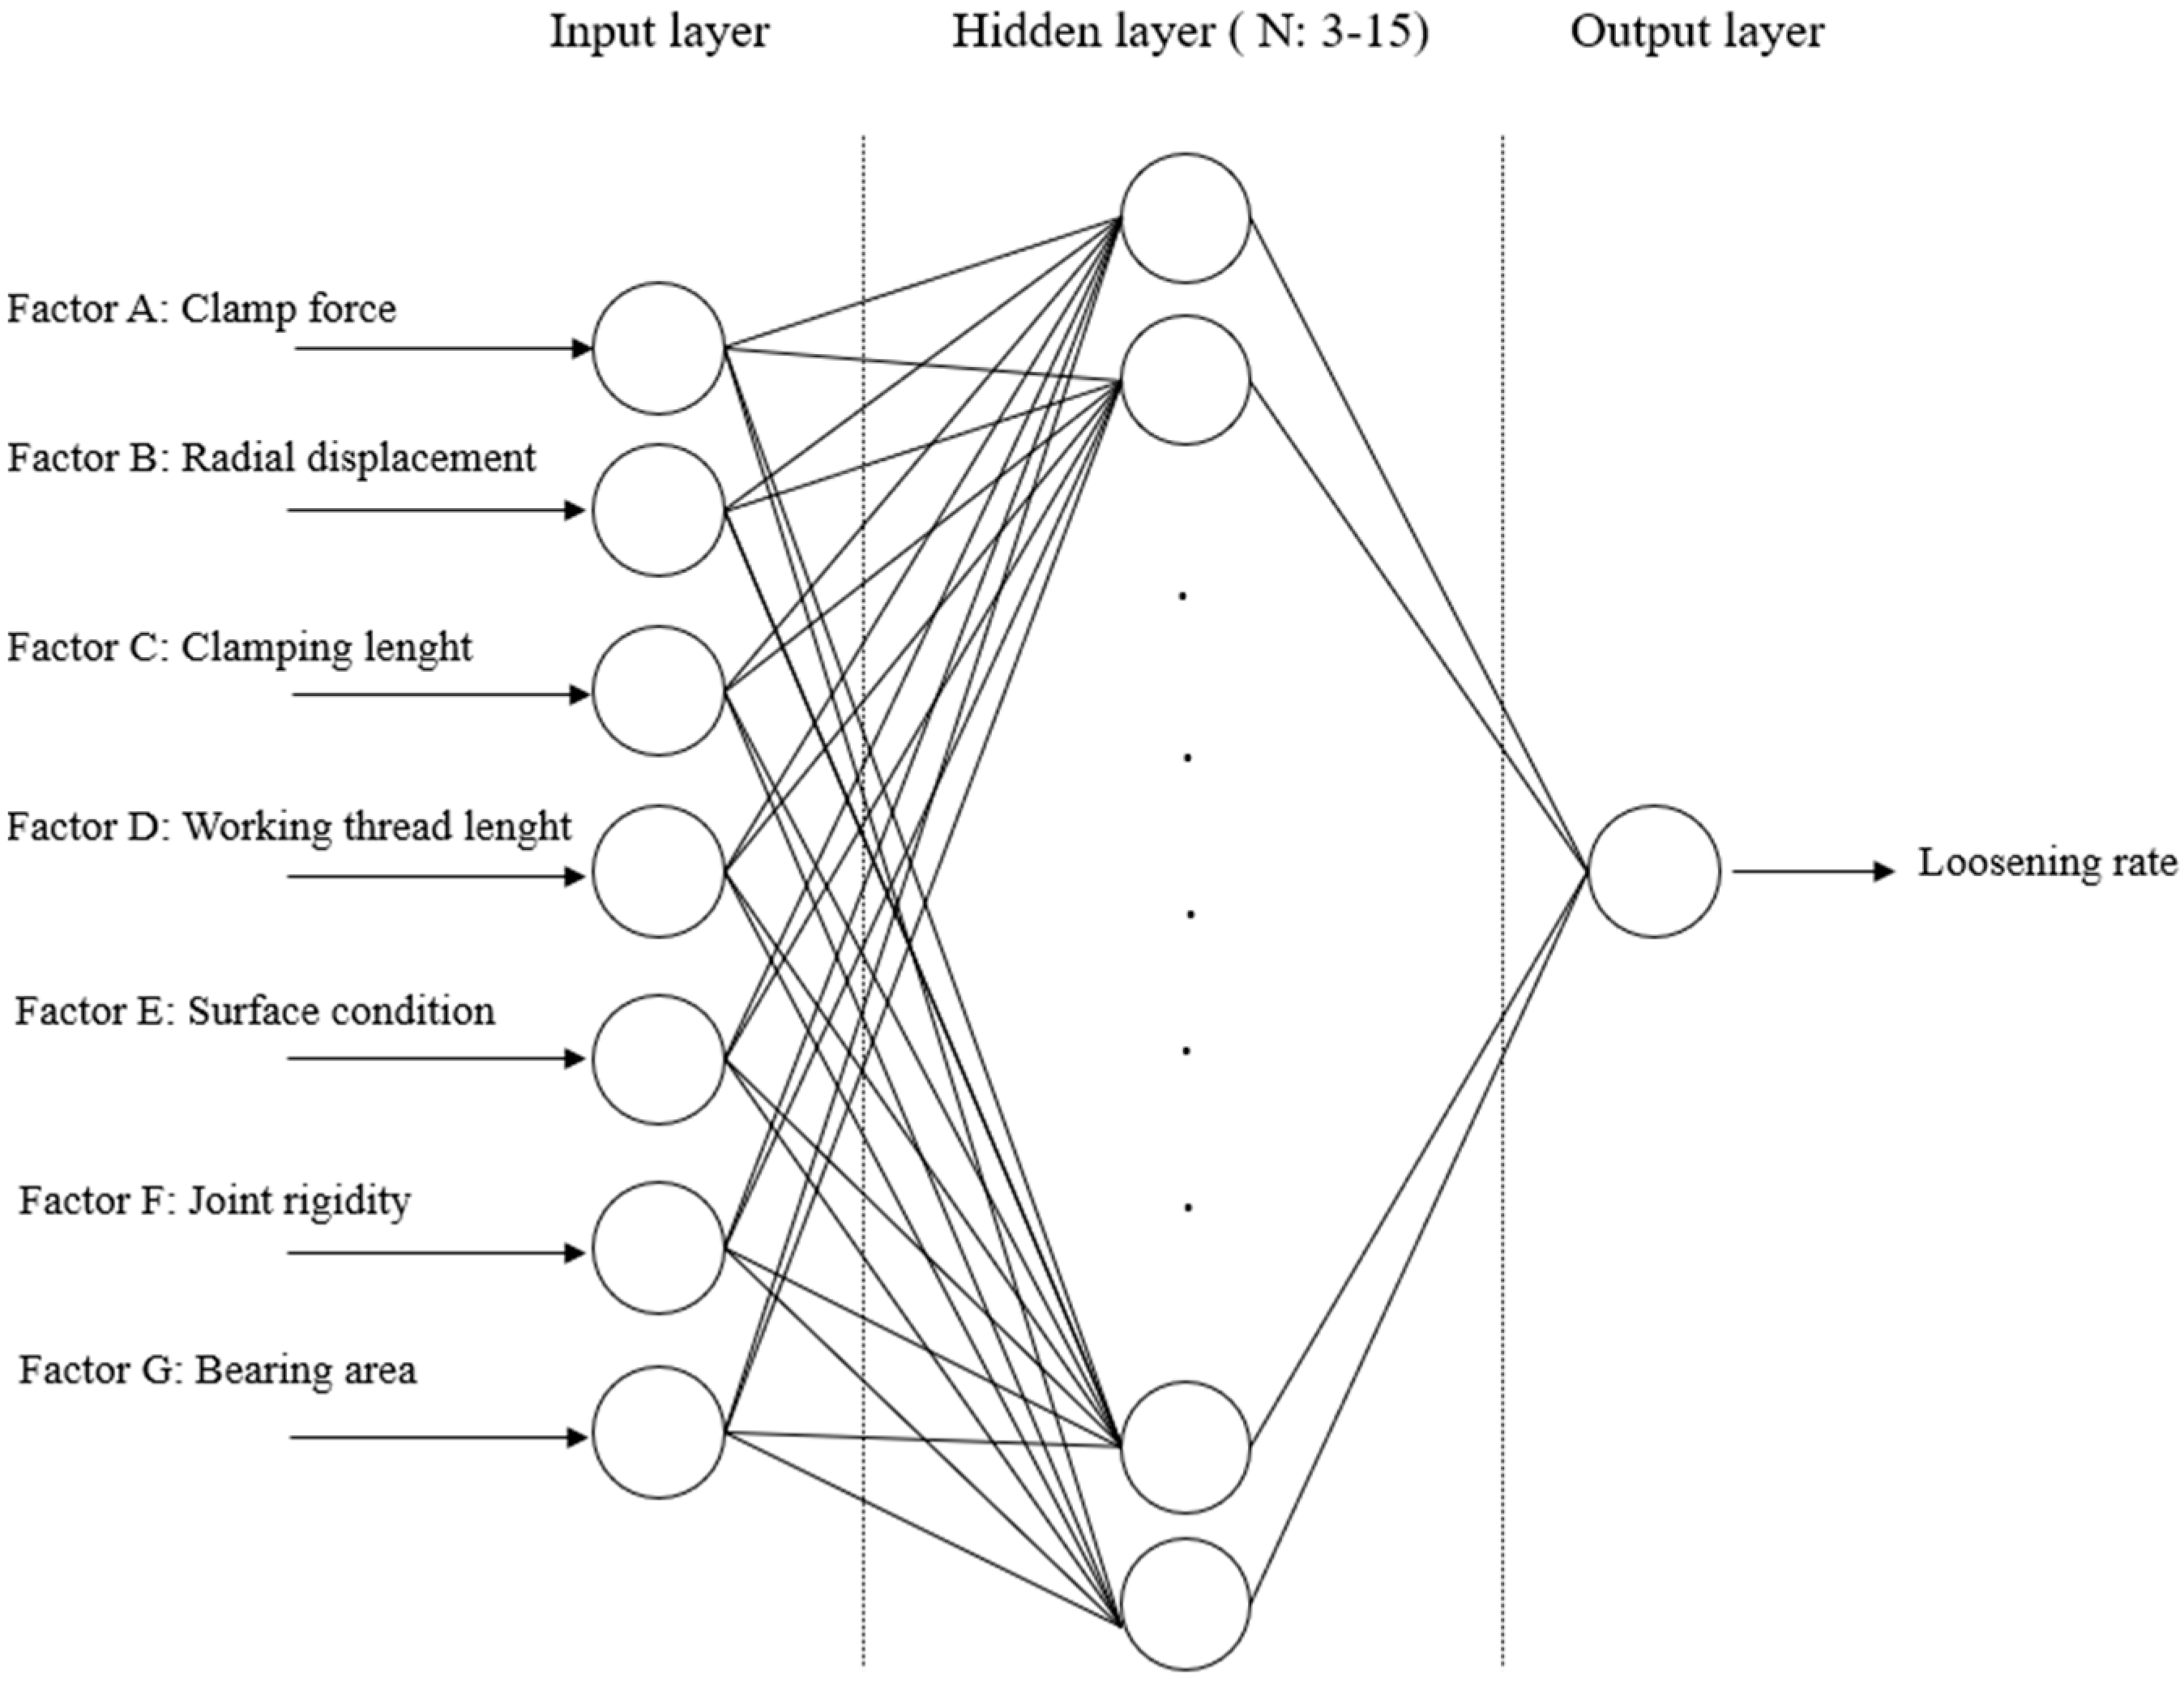
In this study, an artificial neural network is proposed to predict the mechanism of self-loosening and behavior of bolted joints on automotive chassis engine suspension connections. It is one of the pioneering research studies using a neural network to determine the mechanism of self-loosing and behavior of bolted joints on automotive chassis engine suspension connections.
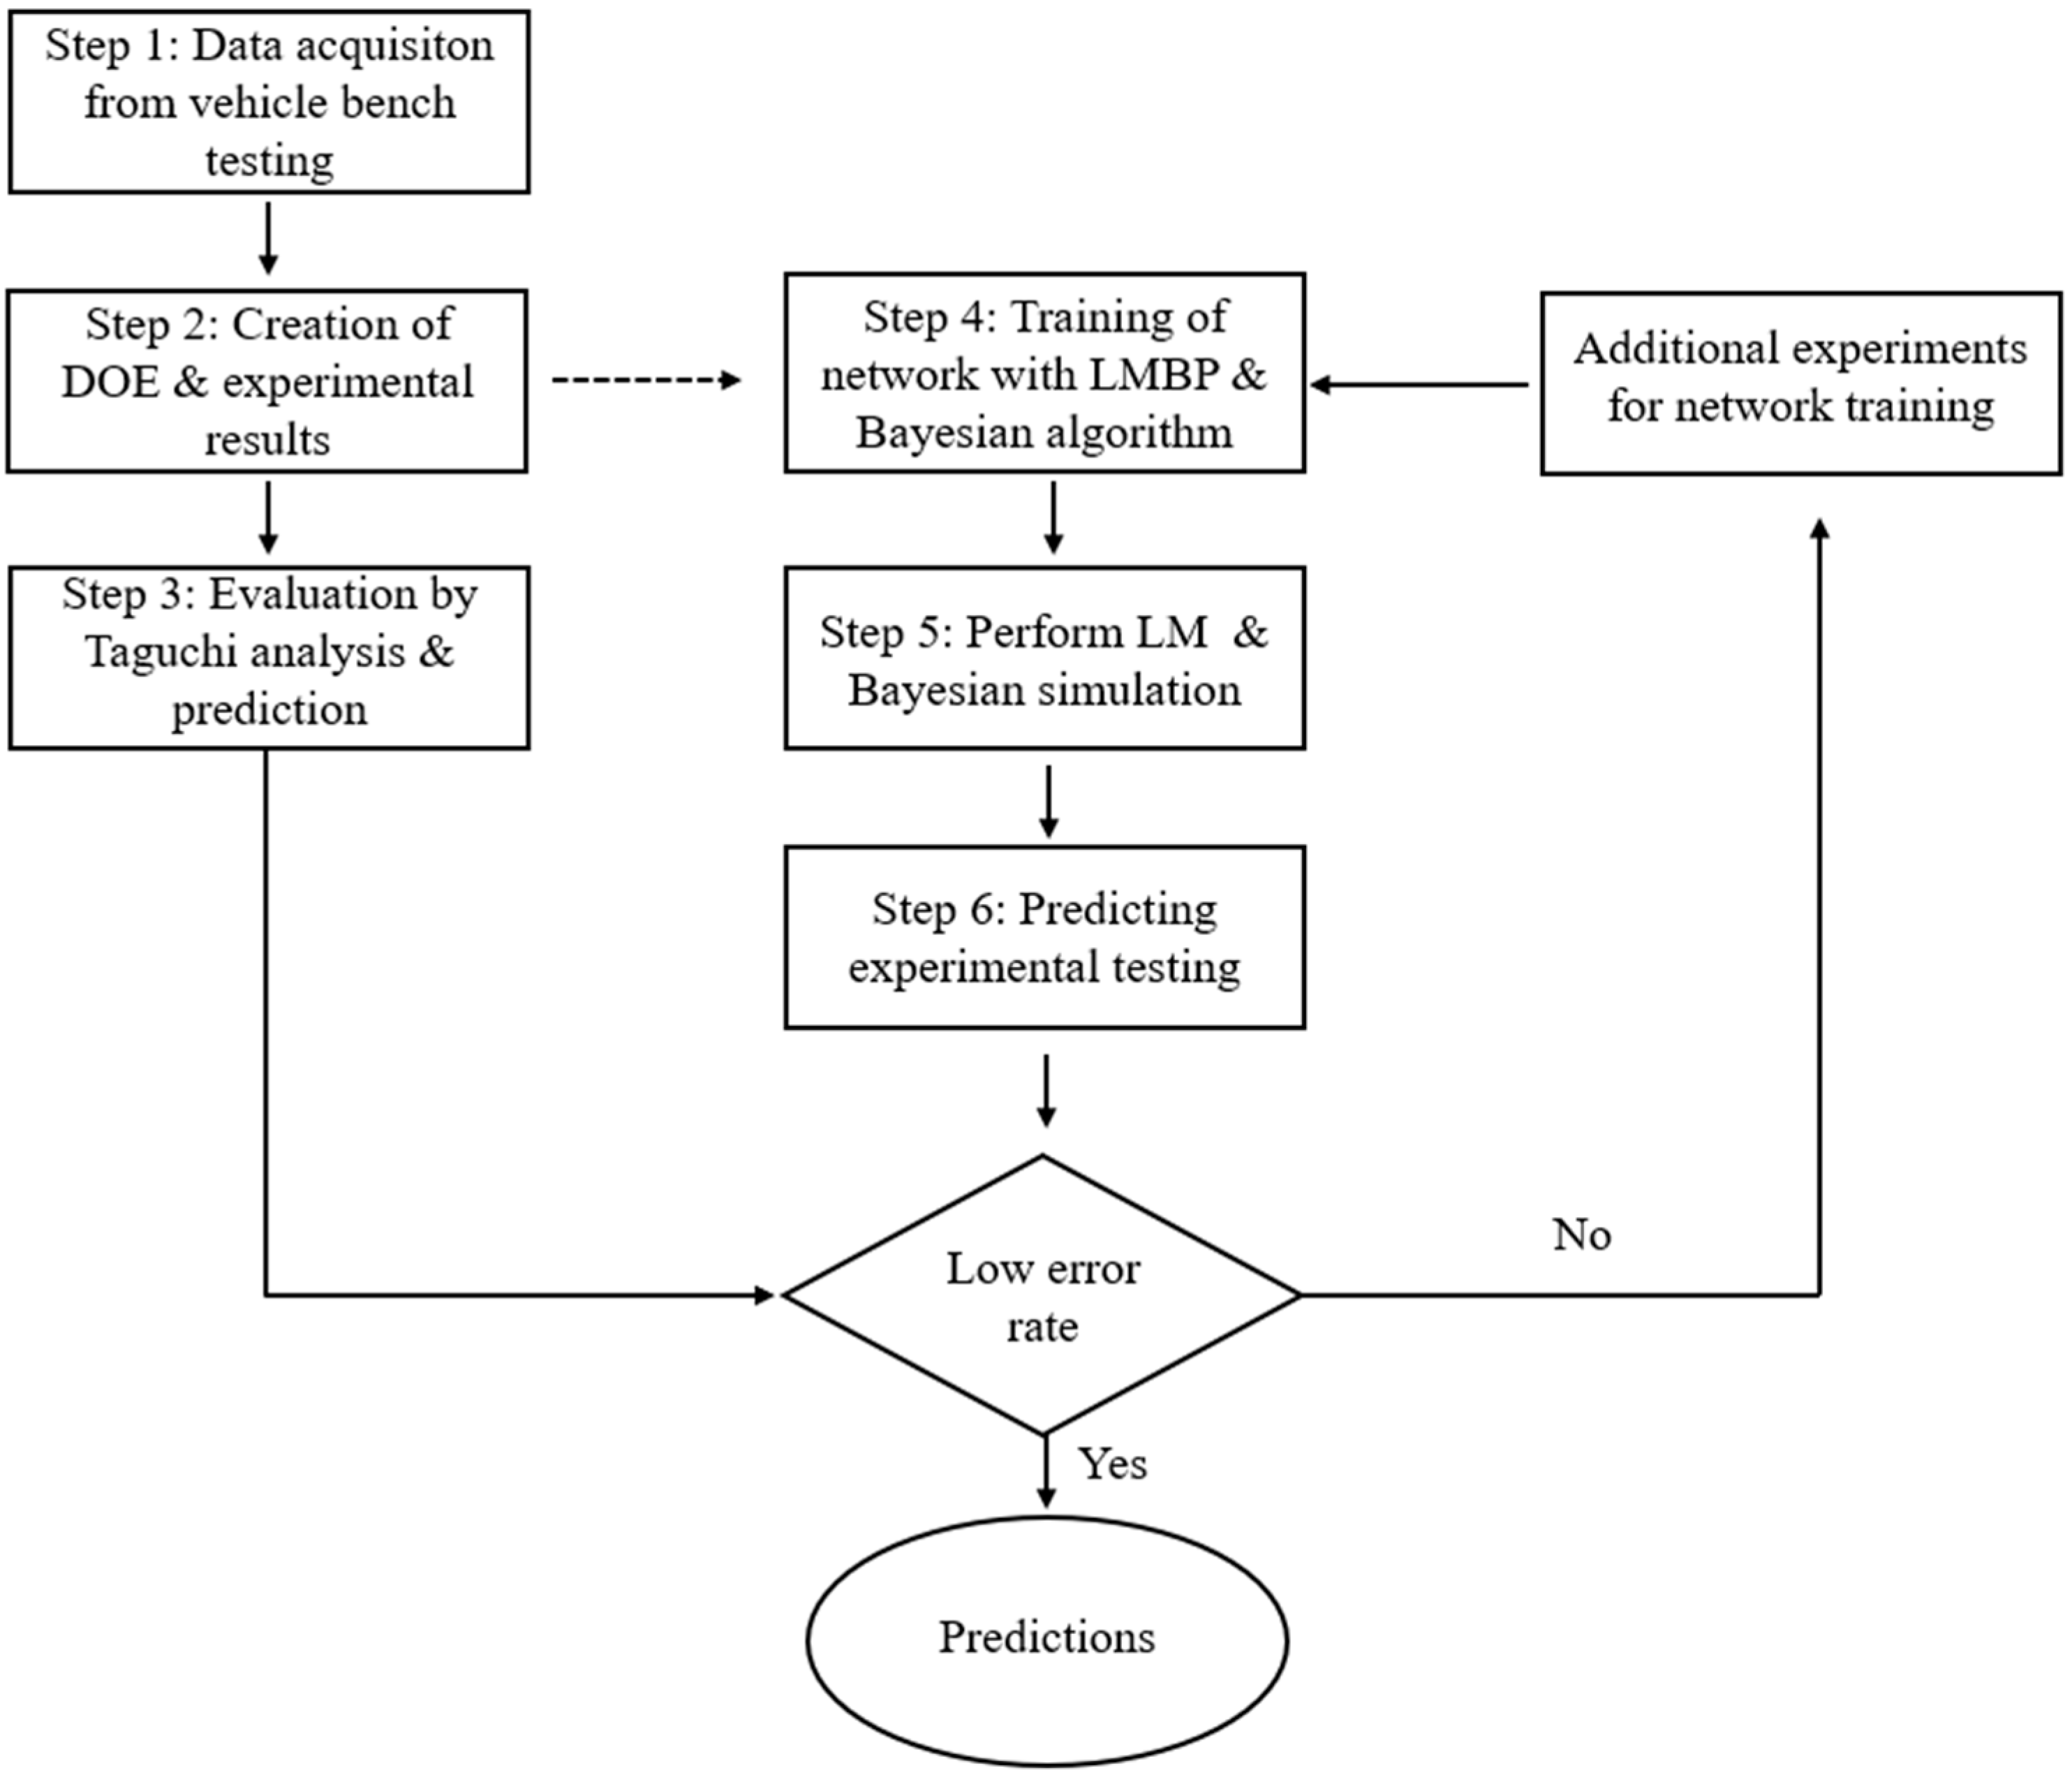
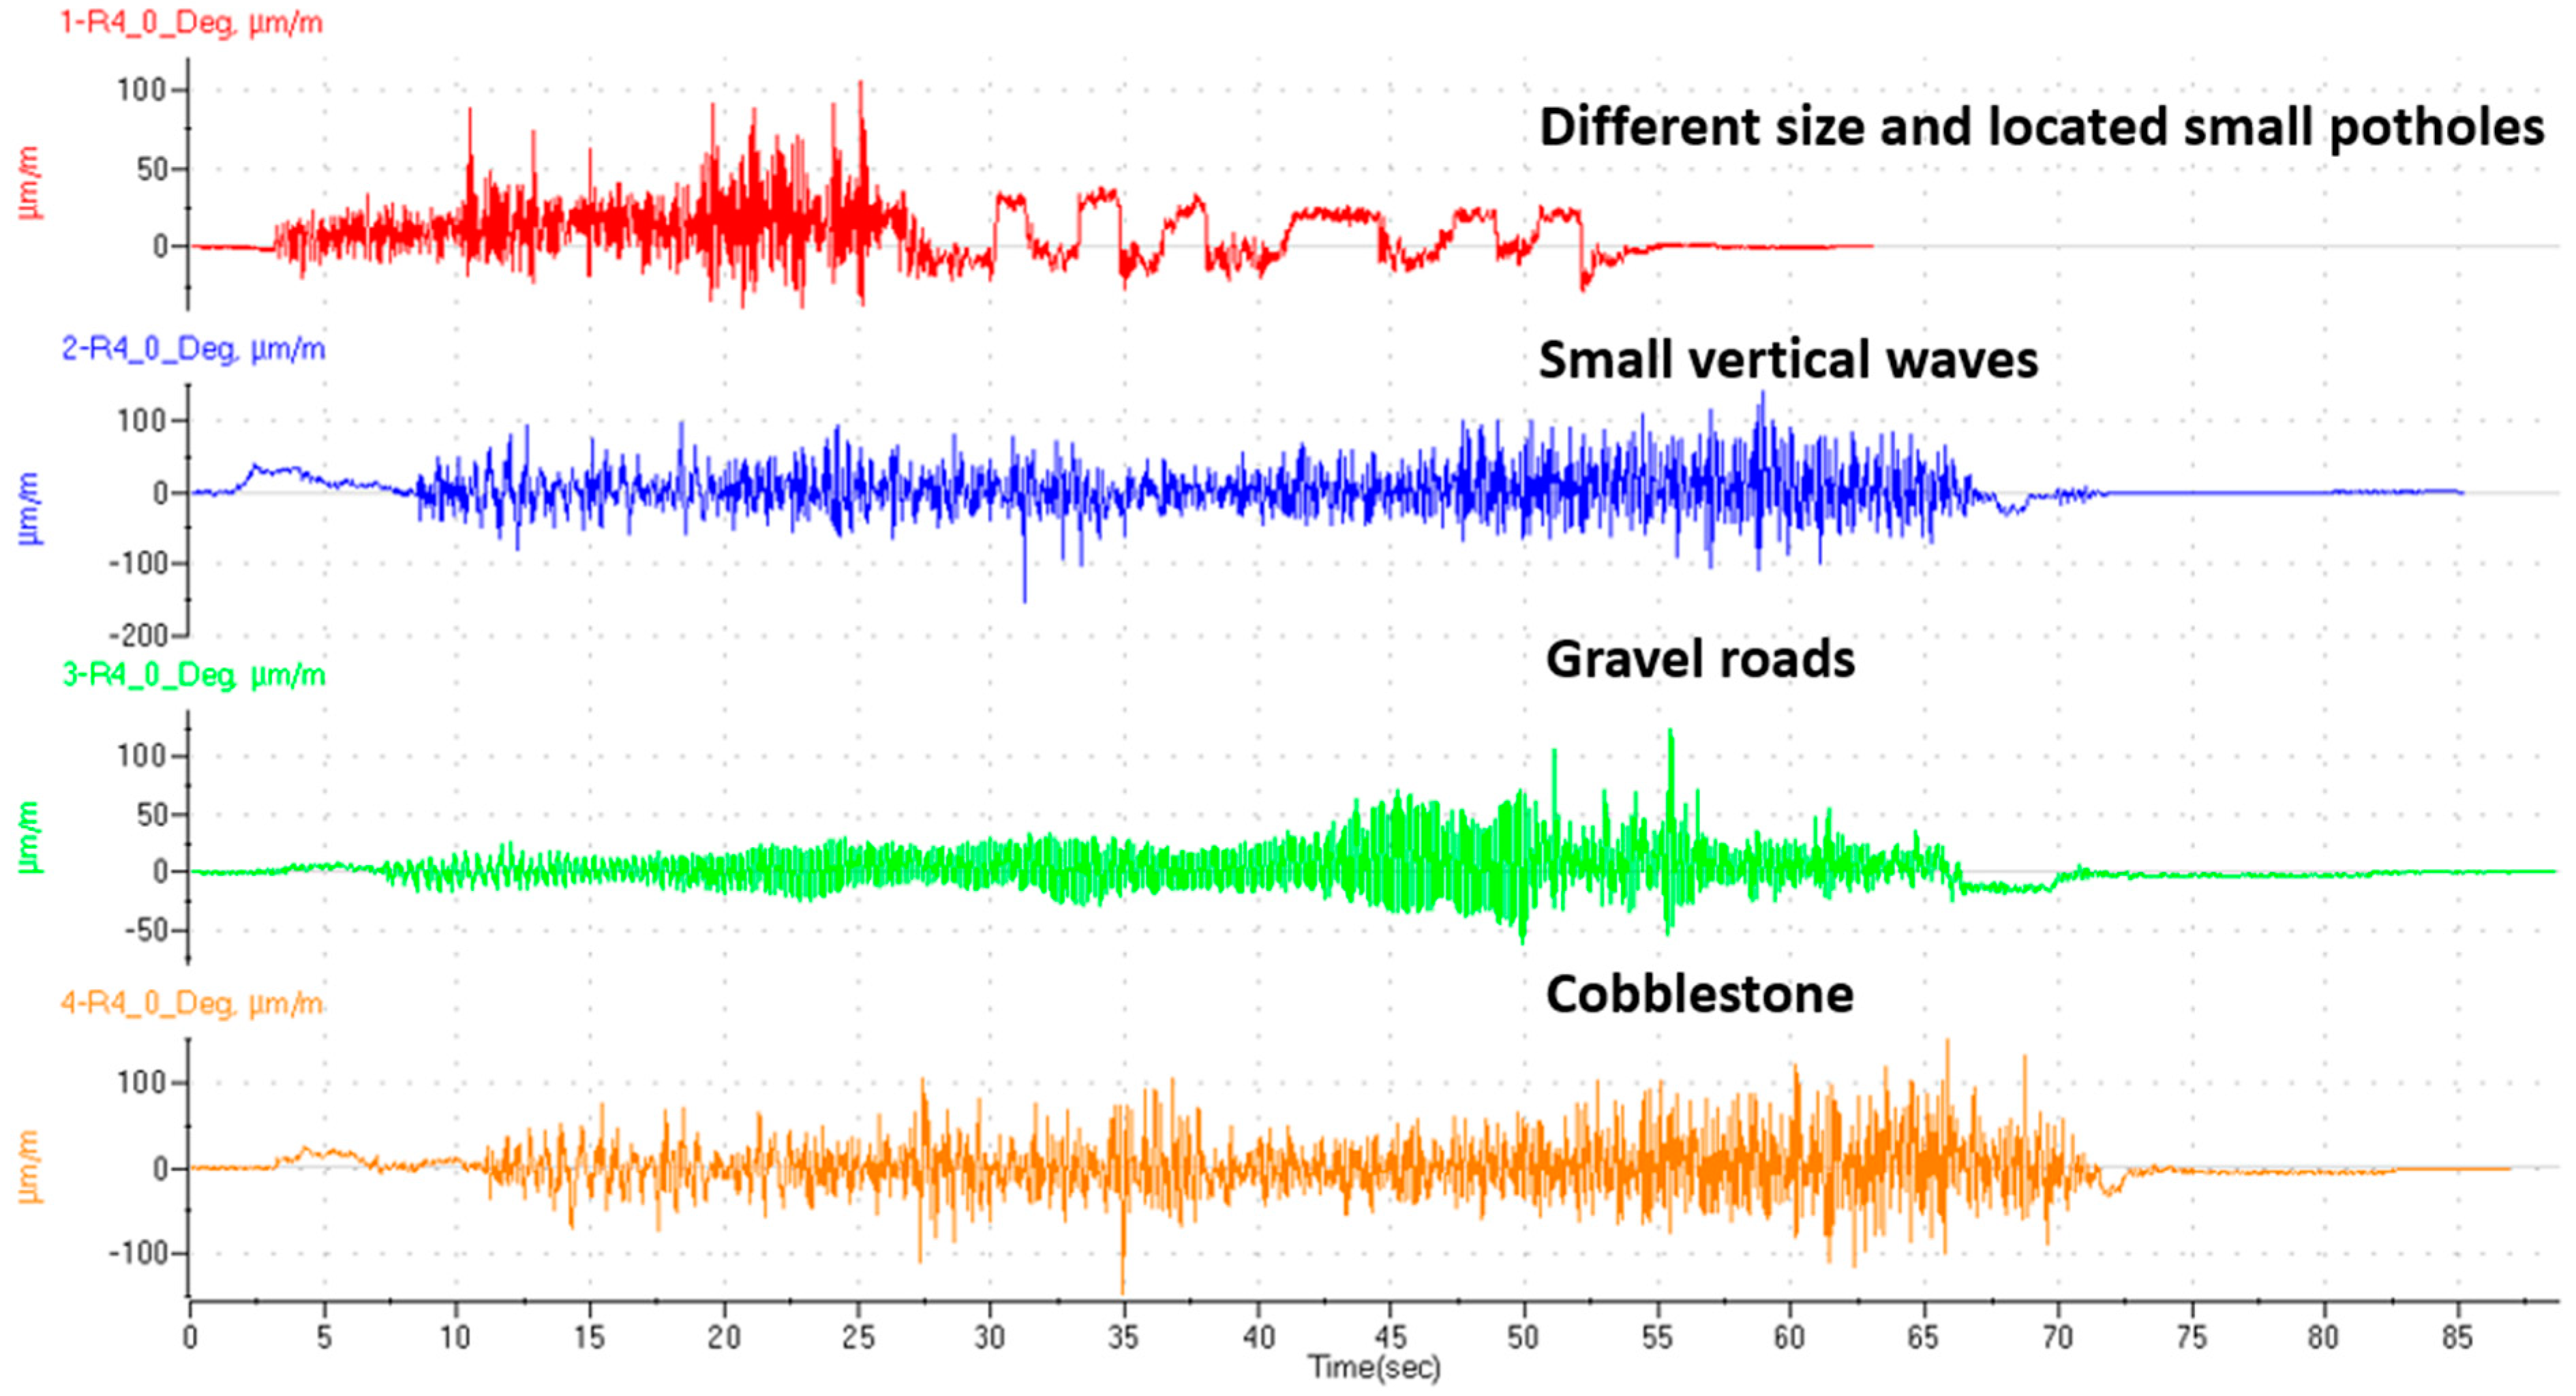
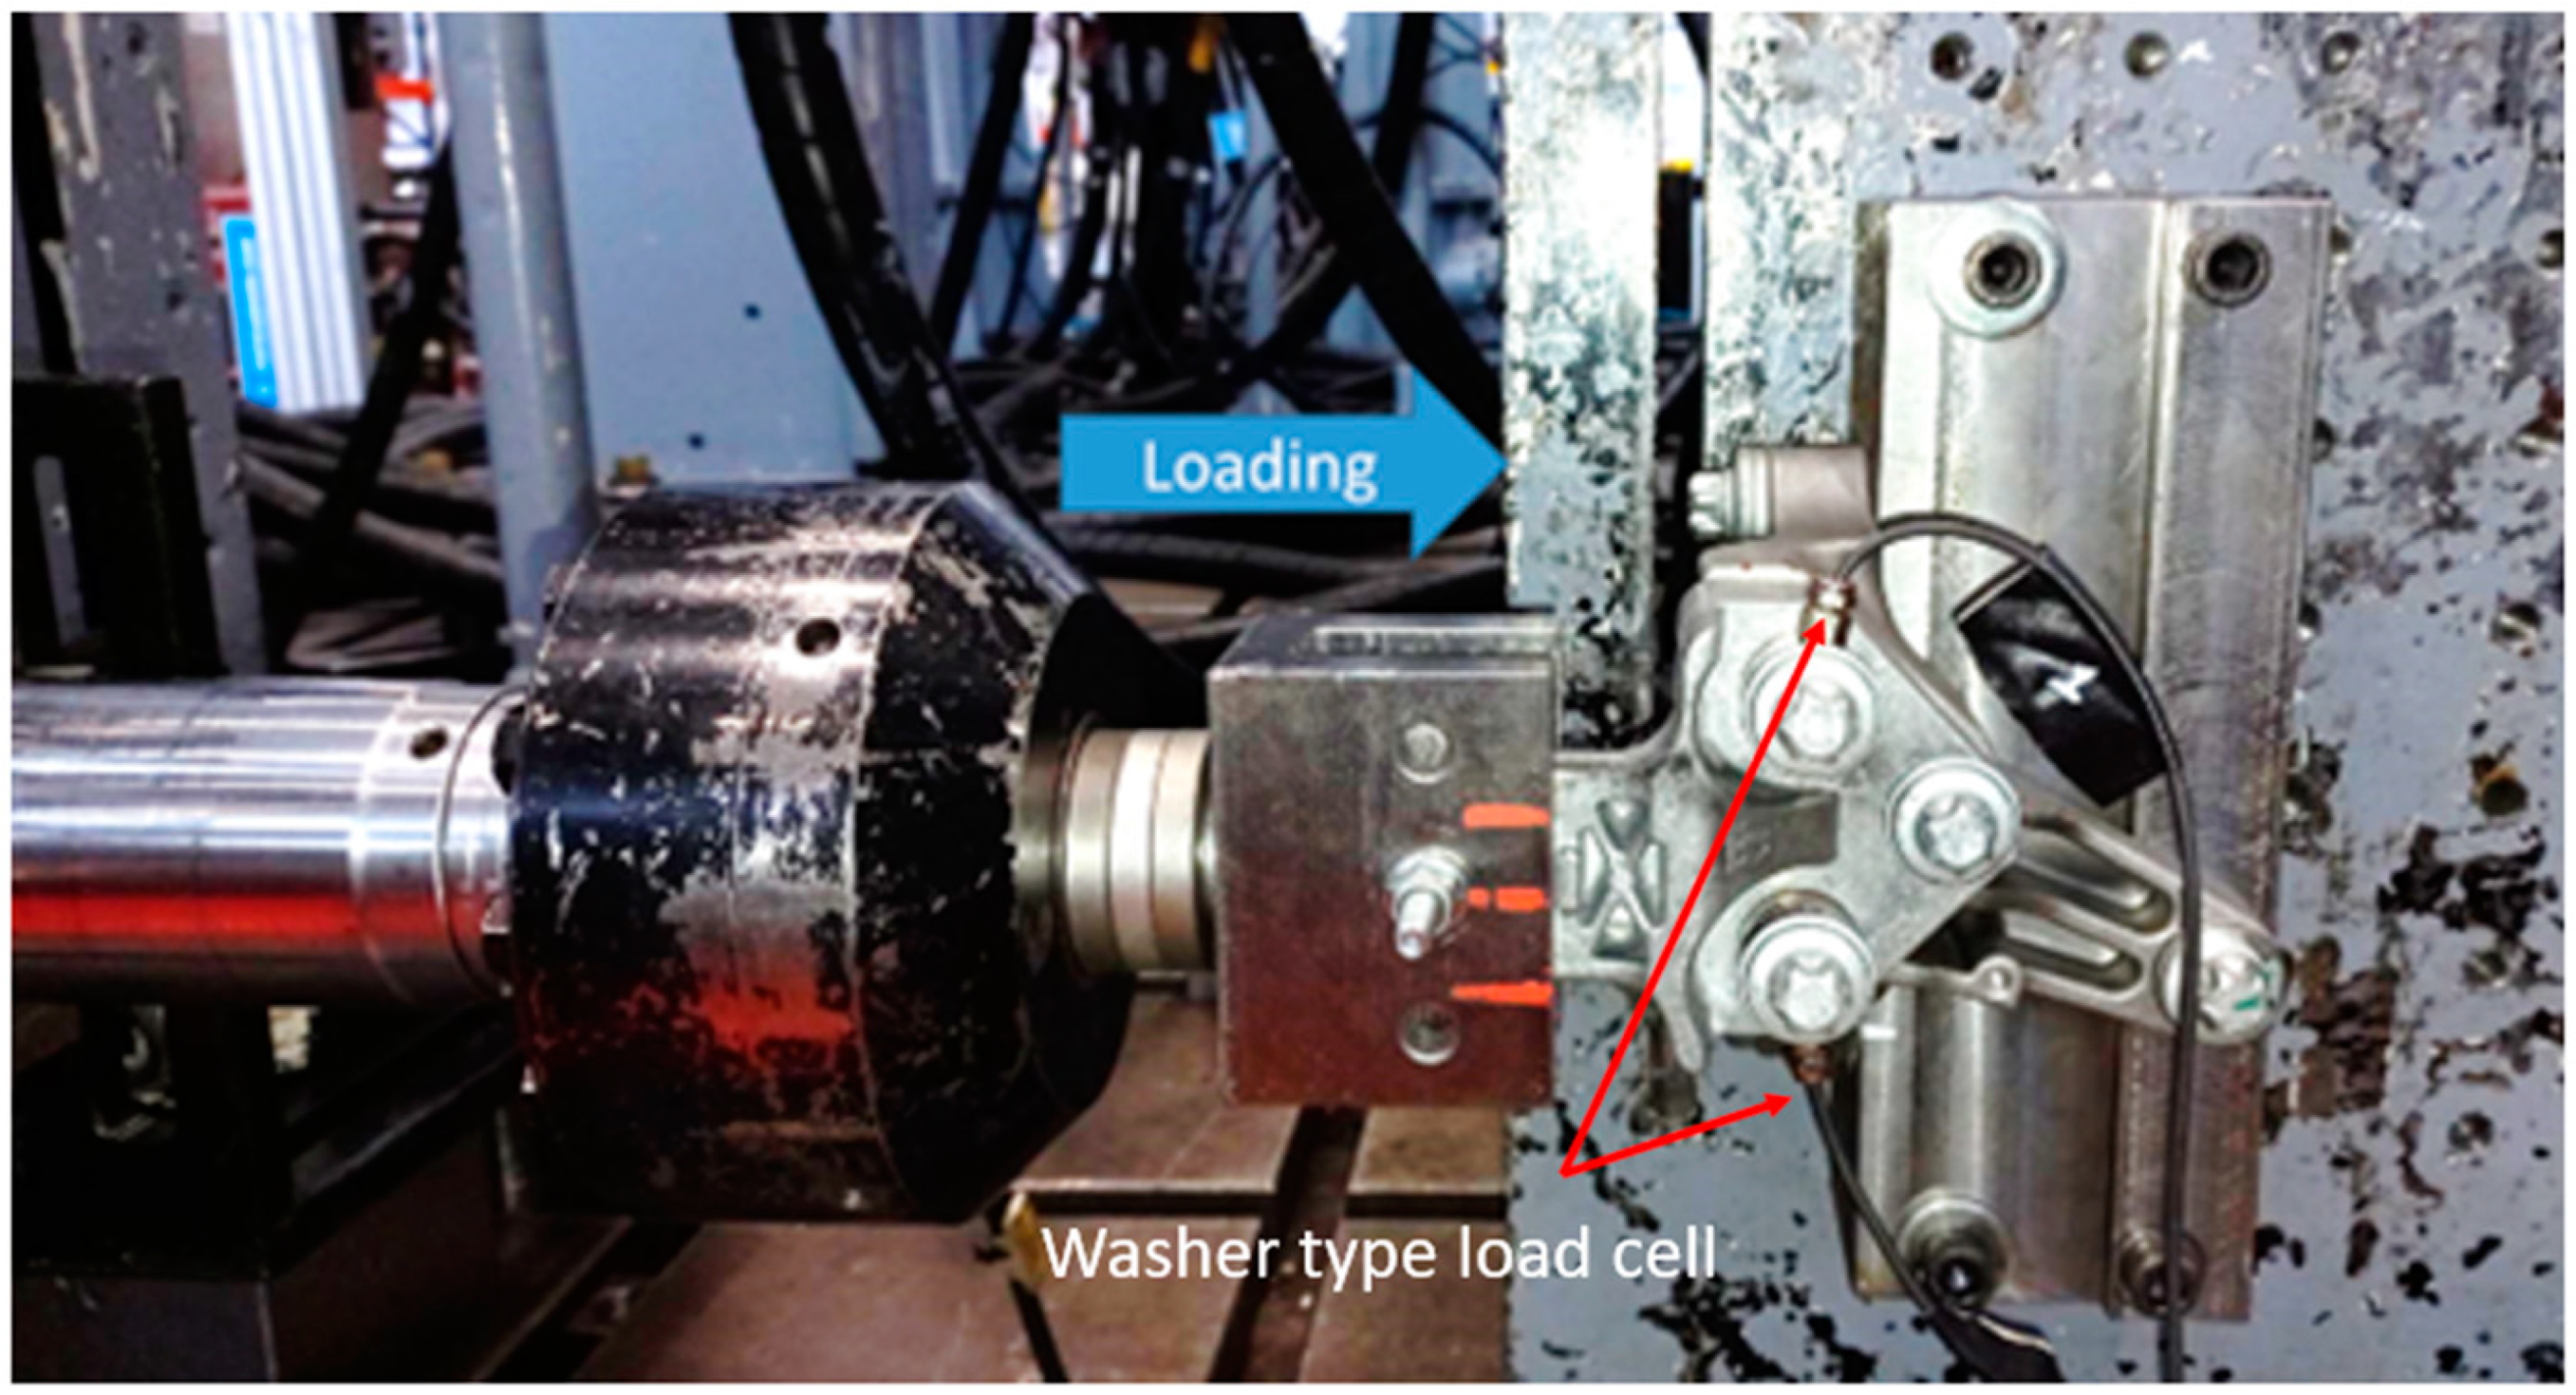
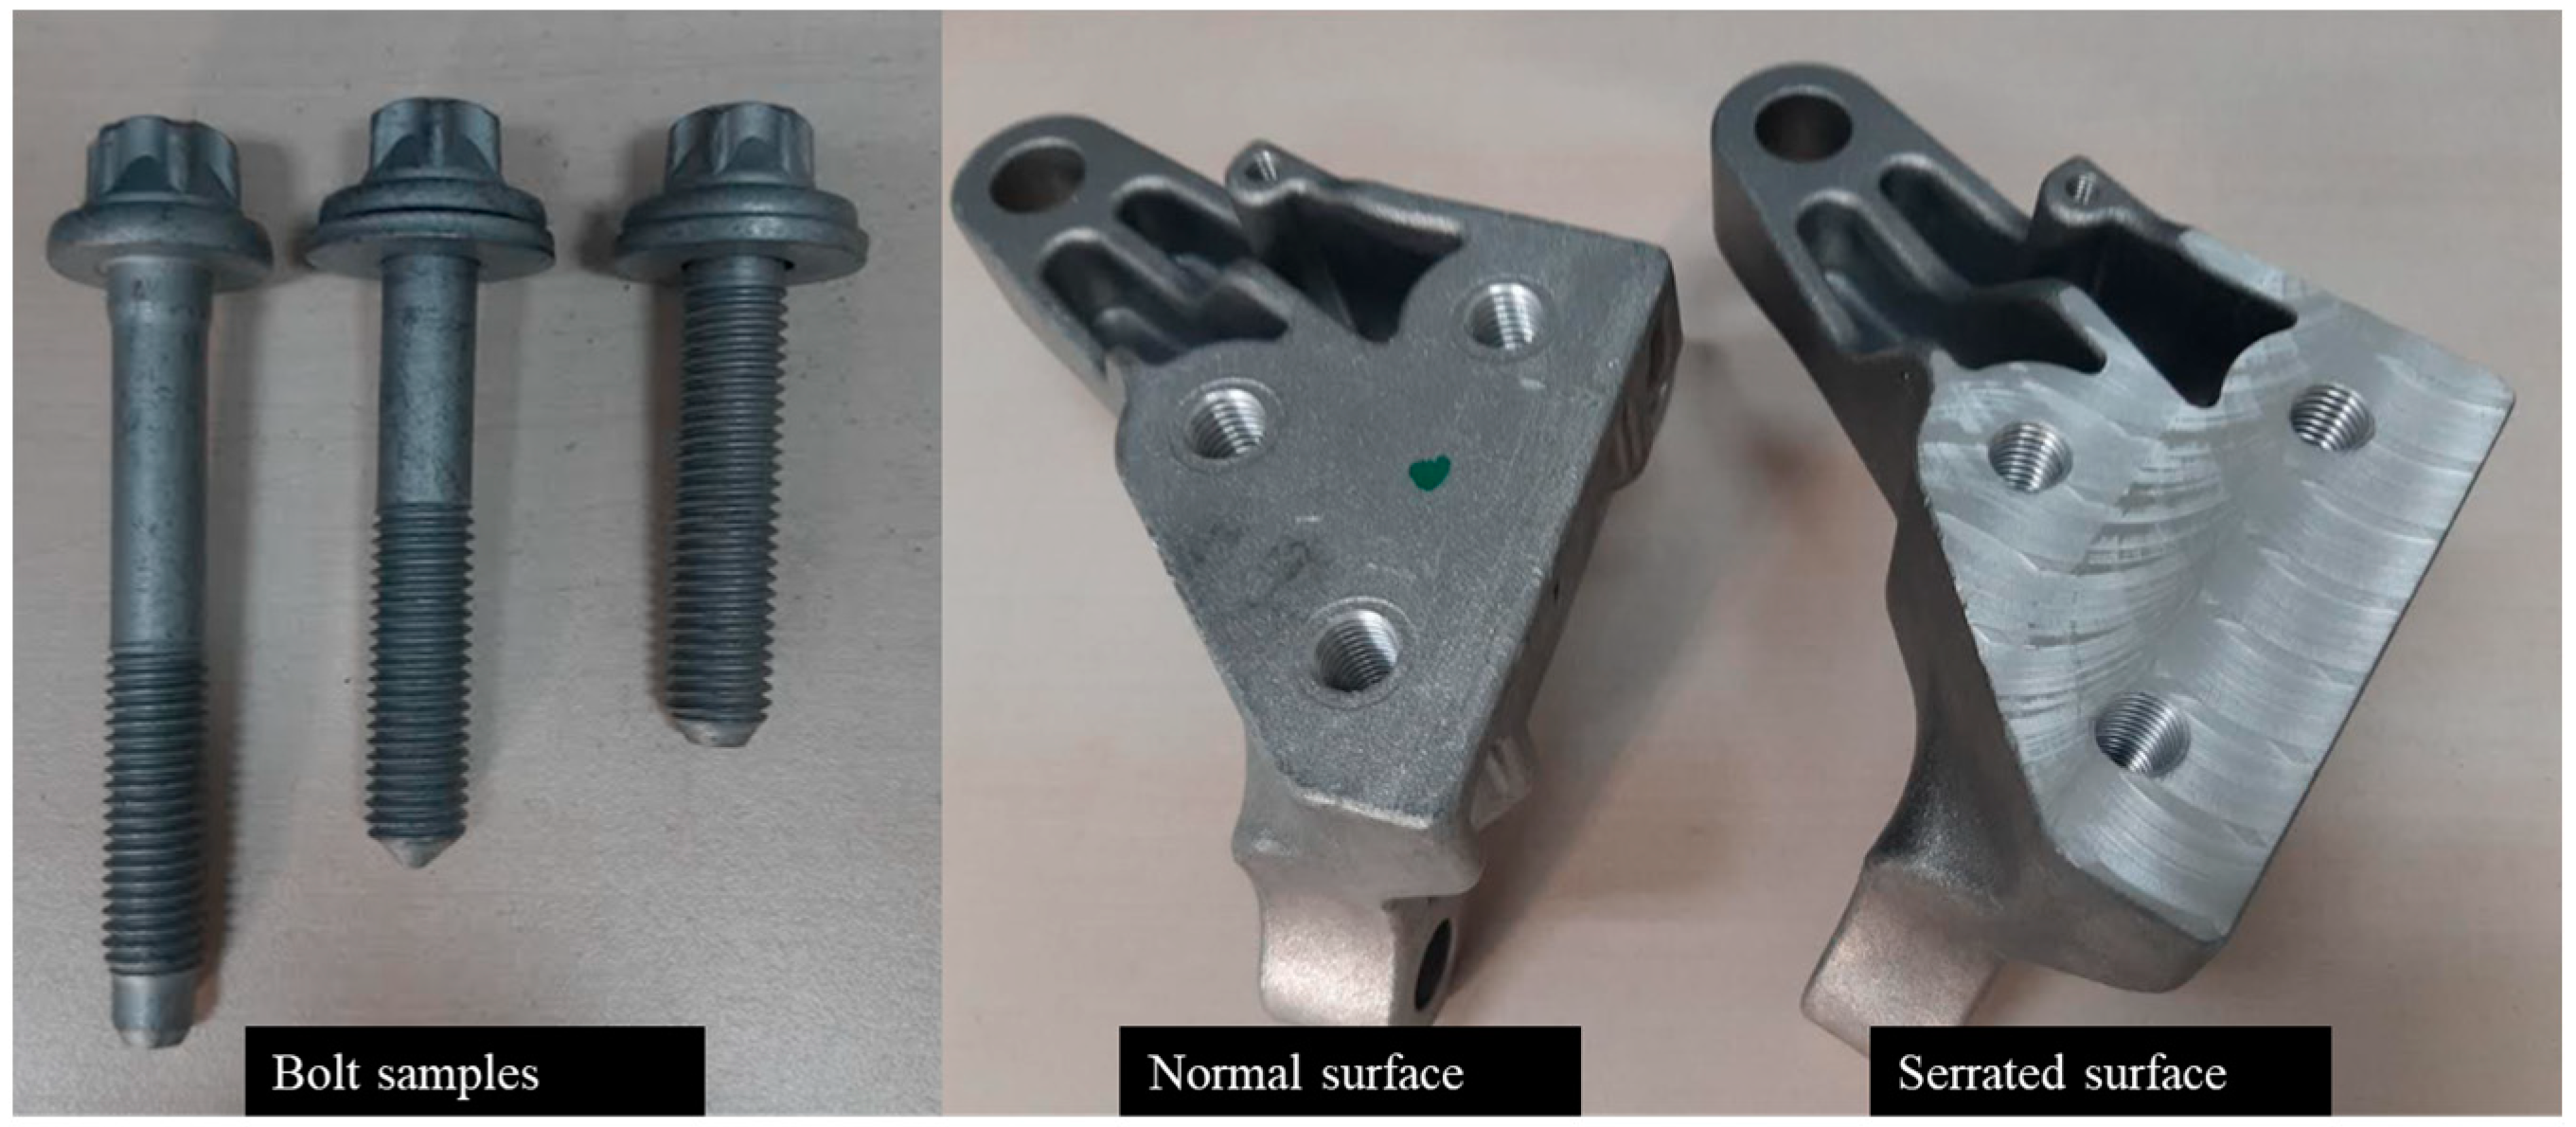
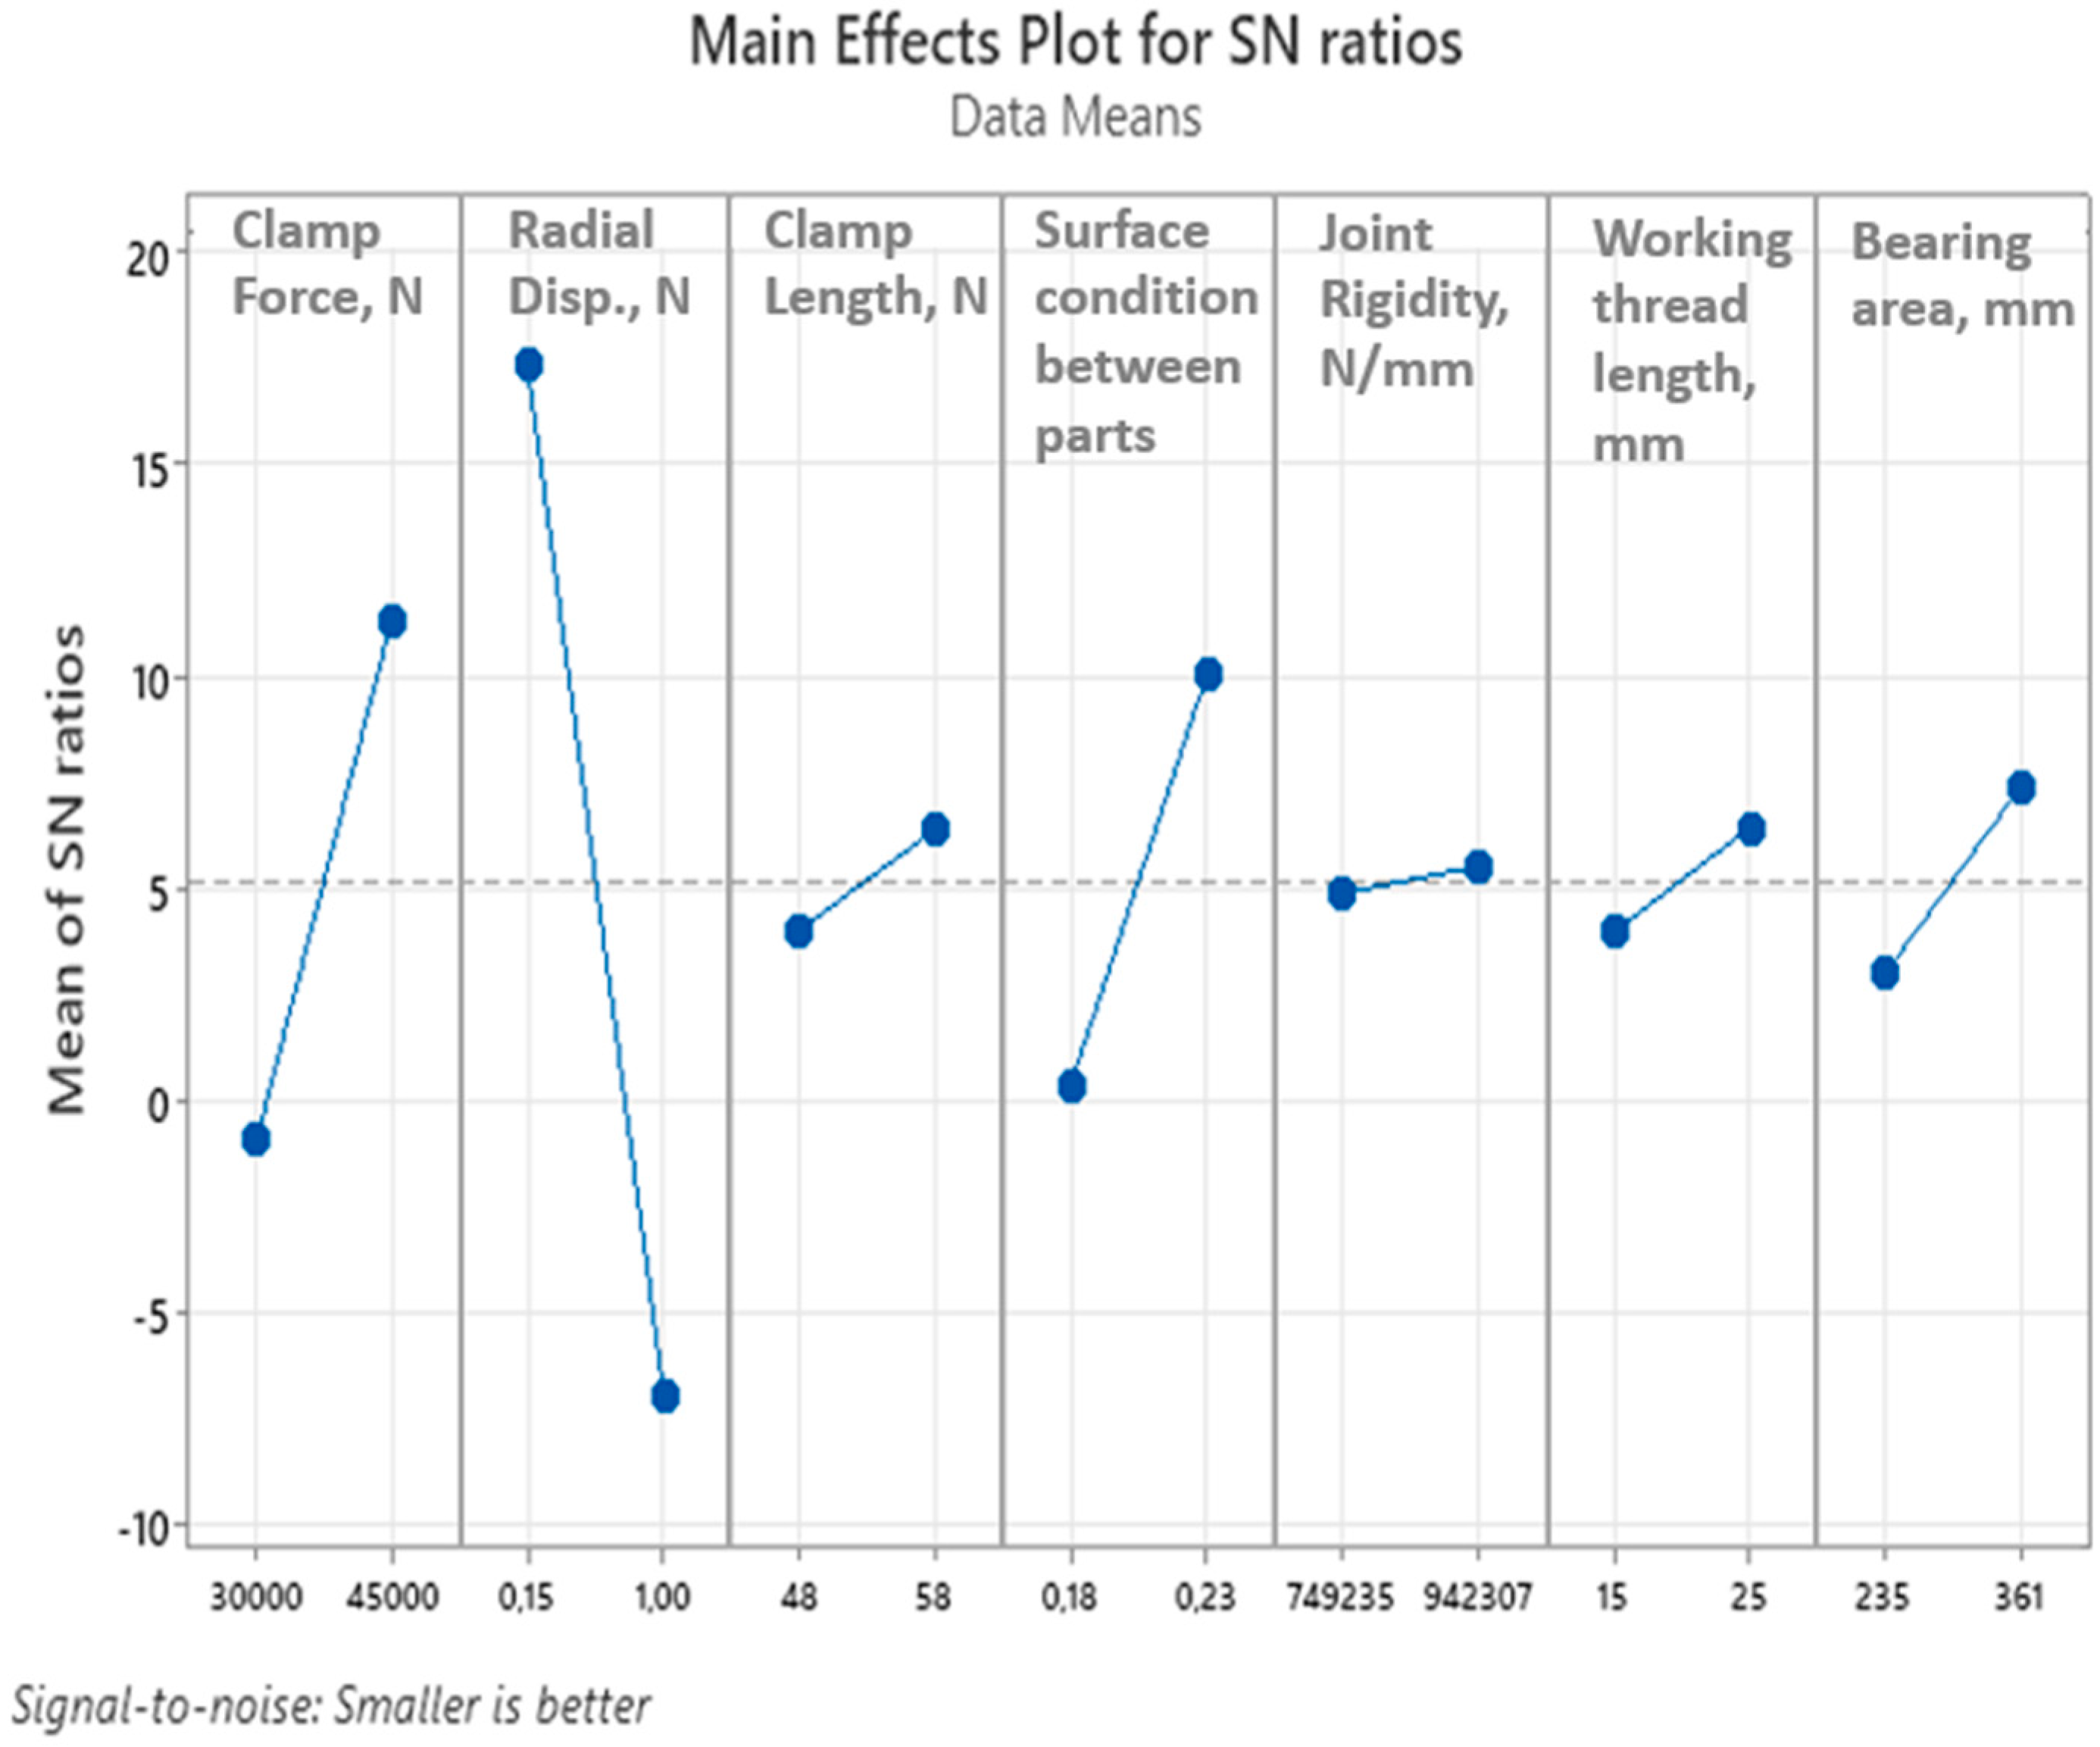
The proposed approach consists of three stages. In the first stage, external loading values are collected from bench testing acting on the joints. It is a specific test only for engine suspension joints. In the second stage, TM experiments with actual joint conditions are performed to obtain training and test data for the NN. Seven controlled factors influencing the torque–clamping loading relationship and bolt loosening rate are divided into two levels, and 16 Taguchi tests are conducted. In the third stage, NN is performed with the Levenberg–Marquardt and Bayesian regularization algorithms to create the relationship between the controlled factors and the loosening rate. The MSE (mean squared error) values are calculated to evaluate the prediction errors of NN. By evaluating all the factors that may influence the loosening of the bolted joint, an experimental set is created using the Taguchi method, and physical transverse vibration tests are carried out for the same connection structure with the vehicle. In the experimental design, horizontal vibration displacements are determined by evaluating the vehicle bench test data. In this way, the vibration tests in the experimental design are performed on the basis of the vibration data of the real connections. The outputs after the physical experiments are evaluated to determine the signal-to-noise ratios and the rank of the most influential parameters.
The results showed that the proposed approach can be used to predict the mechanism of self-loosening and behavior of bolted joints without additional tests, and it is possible to make predictions with very low error rates using artificial intelligence techniques. This will reduce the high development costs resulting from the test requirements due to the modifications and improvements that will occur on bolted joints.

2. Experiments

External loading data acting on an engine suspension joint are collected using real road signals on a bench test system to determine the horizontal vibrations in a Taguchi-integrated DOE. Then, the test setup, a discussion of the Taguchi methods, test parameters and their levels, and test specimens are provided. The flowchart of the proposed approach is given in Figure 1.
In Step 2, the loosening rates (kN/cycle) are obtained through monoaxial vibration tests according to different parameters defined. Taguchi analysis and predictions are made for the same parameters and different levels in Step 3 using the data from Step 2. The same test results are evaluated using the LMBP and/or Bayesian algorithms in parallel in Step 4, the data are trained, and the prediction method is applied with the help of a neural network. In this study, both methods are applied separately, and the estimation rates are compared.

2.1. Data Measurement from Bench Test and Test Setup

Defining the radial displacement levels for experimental design, strain gauges were applied to the vibrating connected part, which was close location of the bolted joints. Four strain gauges were applied for analysis of the movements in joints. Linear strain tensors were used for the measurement, and a quarter bridge was used for the analysis. The gauges were described as R1 and R2 for linear and R3 and R4 for the rosette strain gauges in Table 1.
In addition, a washer type loadcell (HBM KMR 100 kN) was mounted to see the clamping load levels. Strain gauge locations are given in Figure 2.
A multiaxial simulation table (MAST), which is shown in Figure 3, was used for the data acquisition and measurements for the aluminum casting engine mount component. The vehicle front end was mounted to the test bench plate, and half shafts were mounted to the torque input fixture to apply the real change gear moments. The road load data accelerations from the table were applied to the vehicle front end. Then, during these movements, responses were acquired and analyzed. In addition, using the MAST test bench seat with dashboard structural durability, NVH tests could be performed up to 150 Hz input level. The model of the table was an MTS Model 353.20 Square Hexapod Multiaxial Simulation Table (MAST™) with two torque input fixtures (TIFs). Analog signals were collected from the system for the hydraulic system, and displacement control was implemented by checking the analog input feedbacks. The MAST test bench used six different servo-hydraulic actuators to give the road input, which was collected from the proving ground. In addition, two individual servo-hydraulic actuators were used for the torque inputs to the half shaft. The system enabled performing engine mount durability tests by applying the operational loading configuration while controlling different outputs. The system was used as the input to control itself via acceleration. To check the convergence between the road and bench responses, main outputs were the engine mount body side, engine mount engine side, and front body rail accelerations, as well as the torque strut load and half shaft torque. In addition, to follow the fastener deformation level, the component response was collected by means of strain gauges. In the end, the system allowed the movement of test specimens in six degrees of freedom: X, Y, and Z relative movements and roll, pitch, and yaw angular movements. The vehicle front end and vehicle engine were located on the test bench. Four different road profiles were applied to the test bench, and the deformation levels were acquired.
The instrumented part was located over the gearbox mounting support bracket as shown in Figure 4.
When the data acquisition was completed, each sensor strain level was analyzed as presented in Figure 5.
In Table 2, maximum and minimum strain levels are given. These results were the input for the monoaxial loading test.
The monoaxial test was set up according to the channel R4_ 0_Deg, whereby the Y-axis of the movement and strain results were the most severe. The highest radial deformation acting on the connection under bench conditions was 150 µε. The minimum radial displacement value of 0.15 mm was set in the monoaxial servo-actuator, which obtained similar deformations for R3_0_Deg and F4_0_Deg channels with respect to MAST. The maximum level was determined as 1 mm to accelerate the loosening rates and to prevent the parts from being subjected to fatigued fracture before loosening. Above 1 mm level of displacement from actuator, we tried some tests, and some cracks were observed on the parts. The aim was to see the loosening performance of the bolted joints between 0.15 mm and 1 mm radial displacement. The monoaxial test was set as the Y-axis, as shown in Figure 6. All fasteners were tightened directly to the 30,000 and 45,000 N target clamping loads with a torque wrench, which are given in Table 3 by checking the load value of the washer type loadcell, as shown in Figure 6. Displacements were applied by the MTS hydraulic actuator to the specimen, and an HBM MGC-Plus data acquisition system was used for data acquisition; analysis of the data was completed using the Catman HBM data acquisition software (catmanAP 5.4.2.11 version).

2.2. Design of Experiments—Taguchi Method

The Taguchi method (TM) is a popular experimental design method in the industry and optimizes parameter design with less experimentation. The parameter design of TM aims to reduce the effects of environmental conditions as much as possible and to obtain robust results [42]. According to Taguchi, there are two different types of parameters that can be explored: design parameters and noise parameters. Design parameters are those that the designer controls. Noise parameters are parameters over which the designer has no control [43].
The Taguchi method can be used to determine the optimum settings of design factors to make the neural network insensitive to noise factors. The design of the proposed neural network using the Taguchi method includes the following steps:
(1)
Identification of design factors and determination of objective functions to be achieved;
(2)
Description of the experiment set and data analysis procedure;
(3)
Making test sets and obtaining the results;
(4)
Determination of optimal design parameters that maximize signal tone;
(5)
Performing validation experiments for validation.
In this study, seven controlled factors were selected and divided into selected levels. The tests were carried out with M12 × 1.75 × 10.9 bolts whose geometric properties were the same except for the length. The coefficient of friction, which is the noise factor, was chosen in the range of 0.10–0.16 to avoid deviation. During monoaxial testing, 0.15 mm and 1 mm radial amplitudes were conducted at 6 Hz frequency level. Apart from seven controlled parameters, the bolt pitch was not included in the test parameters because its effect is well known [44]. Furthermore, the locking nuts and tests were not included, because it was conducted for only blind hole applications, and its positive effects were known from the literature [30]. The tribological lubricant effect was not included in the tests because the use of various oil-treated bolts is almost nonexistent.

2.3. Test Specimens

Metal and aluminum washers, serrated lower female thread parts, and connecting parts with the hole diameter and thickness adjusted were produced to provide the Taguchi levels determined such as clamping length, bearing area, joint rigidity, and surface conditions between parts. The serrated surface of the lower female thread part was processed to increase the friction coefficient of the surface. All materials were renewed after each test. Test specimens are given in Figure 7 and Figure 8.

2.4. Test Matrix

Taguchi’s orthogonal sequences were determined as the most useful sequence to be used for the experiment using the L16 (27) sequence. L16 was a specially designed array used to determine only the main effects of parameters. No interactions between parameters were investigated. The interaction effect becomes more complicated when considering the effects of more than two parameters.

3. Experimental Results and Data Analysis

Monoaxial vibration tests were carred out with the same parts used in the vehicle to accurately simulate the vehicle condition of the investigated joint. Sinusoidal cyclic signals of 0.15 mm and 1 mm were applied during tests. A total of 16 tests were carried out within the scope of Taguchi experimental design, and three additional tests were applied at the minimum, maximum, and nominal levels of Taguchi levels. Each experiment was stopped when the joint loosened 30% of its preload. In two experiments, 30% bolt loosening did not occur, whereby loosening was assumed at 1,000,000 cycles. As the output of the tests, the loosening rate values (N/cycle) were obtained. All values were exported from catmanAP 5.4.2.11 software to the MATLAB after data acquisition, and the curve fitting tool was used to define the loosening rate through controlled parameters using the design of experiment approach. Level values and levels for tests can be seen for controlled parameters for individual tests in Table 3.

3.1. Taguchi Analysis

A Taguchi L16 (2)7 orthogonal experimental design matrix was established in the experimental test, and the signal/noise ratios (S/N), mean values, and effect rank were shared for each input parameter, as given in Table 4 and Table 5. The signal-to-noise ratio is a measure of robustness, which can be used to determine the input factor that minimizes the effect of noise on the response. The S/N ratio is an output that compounds the mean and variance. The aim in robust design is to diminish the sensitivity of a control characteristic to noise factors. Minitab 18 software was used to perform the Taguchi analysis.
A “smaller is better” characteristic was used to judge performance. This is convenient for objectives aimed at diminishing the output or minimizing the target such as the bolt loosening rate.
The signal-to-noise (S/N) ratio was calculated for each factor level combination. The formula for the smaller-is-better S/N ratio using log base 10 is as follows:
S N = 10 log 1 n   i = 1 n y i 2 ,
where y is the response for a given factor level combination, and n is the number of responses in the factor level combination.
The average effect of the radial displacement parameter at Level 2 was −6.9680 dB, while the average effect at Level 1 was 17.3620 dB. The difference between the two levels was 24.33 dB. It can be observed that the radial displacement parameter was a very influential factor on the response, i.e., the loosening rate.
The difference between the levels of the joint rigidity parameter was very small (0.6426 dB), indicating that this parameter had very little or no effect on the response.
Table 4 and Table 5 express that the degree of effect of the selected parameters such as radial displacement, clamp force, and surface condition was high. A small modification in these parameters would cause a significant change in loosening rates. An experiment using Level 1 radial displacement, Level 2 clamp force, and Level 2 surface condition would work best to minimize the loosening rates. Figure 9 and Figure 10 expressed the main effects of signal-to-noise ratios and means.
The loosening rates of Tests 17, 18, and 19, as indicated in Table 3, were predicted, and the prediction error rates according to the physical test results are shown in Table 6.
In the next section, loosening rates are evaluated using the LMBP and BO approaches, and the prediction error rates are determined for Tests 17, 18, and 19.

3.2. Neural Network with Levenberg–Marquardt and Bayesian Regularization Algorithms

A neural network is an artificial intelligence technique which is usually used to establish the relationships between inputs and outputs of black-box processes. NNs are widely used to solve complex problems with hidden layers by performing nonlinear matching between inputs and outputs [40]. Yu et al. [45] revealed a neural Taguchi network with a genetic algorithm by establishing a backpropagation network using Taguchi experiments to estimate the relationship between input and outputs. The genetic algorithm was then applied to optimize the extrusion blow molding process. Su and Chiang [46] proposed a combined approach using a neural network and genetic algorithm to optimize the wire bonding procedure. Yu et al. [47] investigated the small angle detection method of bolt loosening in a wooden structure using deep learning and machine vision technology. Çallı et al. [48] proposed an artificial neural network model considering the directed energy deposition (DED) process parameters. It has been shown that the proposed NN–GA is a capable method for creating topology-based geometrical patterns and process parameters for hybrid manufacturing technologies.
In this study, an ANN model was developed to determine the error rates to predict the loosening rates by creating LM and BR algorithms depending on the experimental results related to the bolt loosening problem. ANN was used as a surrogate model to examine the effects of the variables. The surrogate-based prediction and optimization methods play an important role in prediction and optimization processes, especially when the process model is complex and established using computationally expensive simulations and tests in case of uncertainties [49,50].
MATLAB R2020a was used to develop the ANN model, which is composed of three layers as given in Figure 11. The neural network model had seven input neurons, 3–15 neurons in the hidden layer, and one output neuron. Figure 11 presents the topology of the 7–3:15–1 network. Factors A to G were as follows: clamp force, radial displacement, clamping length, surface condition between parts, joint rigidity, working thread length, and bearing area, respectively.
Mean squared error (MSE) values were examined to find the best ANN structure. The ANN model was designed with 30 data points, which were obtained via the design of experiments. A total of 70% and 15% of these points are used for training and testing [51]. Cross-validation is a statistical technique to evaluate networks by partitioning the data into subsets of specified ratios. In this study, the leave-one-out method for cross-validation was used by partitioning the data into subsets, which were the data used for the test, validation, and neural network model training [51,52]. The ANN model and predictions were saved in this study. The reason for choosing MSE and R-value is to prevent overfitting and increase accuracy. R-values (Pearson correlation coefficients) were recorded for training and testing, as given in Table 7 and Table 8. For high accuracy of the model, the R-value should be as close to 1 as possible. All R-values for NN architectures were calculated between 0.91 and 0.98. The training was realized with Bayesian regularization, and the performance is was in terms of the mean squared error (MSE) and Pearson coefficient of determination (R), as shown in Table 8.

4. Result and Discussions

The experimental test results are given in Table 3. The first 16 results were used for training and cross-validation, and the remaining three results were used for the test. One result was left out for cross-validation, and the remaining 15 results were used for training. The number of epochs was chosen as 20 for both approaches. The regularization parameter was chosen as 0.5 for Levenberg–Marquardt backpropagation modeling. The training value represents the learning status of the algorithm, which is the difference between outputs and training status. The MSE (mean squared error) represents the error for each architecture. The learning rate parameters were set as MATLAB default values, i.e., 0.001 for LM and 0.005 for BR. Although the experimental results were trained using LM, BR, and scaled conjugate gradient (SCG), training with LM and BR gave better results. In this study, in addition to the number of epochs, the learning rate was also changed, and experiments were conducted by choosing five, eight, 10, 15, or 20 epochs and choosing different learning rates for each epoch on the basis of improvements in the results without overfitting to find the best neural network. LM gave the best results with the 7–5–1 architecture. LM is a widely used and recommended training algorithm for most problems. In this study, SCG was not a proper training algorithm for the bolt loosening prediction problem. BR gave the best results with the 7–13–1 architecture. Although BR gave better results than LM in some other cases, the LM method is ideal for the bolt loosening problem. Lastly, the prediction error rates were computed for both algorithms, as shown in Table 7 and Table 8. In the case of Taguchi analysis, Tests 17, 18, and 19 were computed with error rates of 7.5%, 13.4%, and 2.8%, respectively. However, the neural network model with a 7–5–1 architecture achieved predictions with better error rates, especially for Tests 17 and 18 at 0.11% and 2.45%, while test 19 was computed at a 3.17% error rate. Although the error rate using the Taguchi method was better for Test 19, the error rate using the neural network was not much different from the Taguchi estimation method. The results show that a neural network approach gave quite good results to predict the bolt loosening analysis as indicated in Table 9.
In traditional product development processes, joint design and design validation processes take a long time and involve many repetitive test plans. Loosening tests take at least 1 week; moreover, in the case of unexpected situations, the tests must be repeated. The proposed method enables an experimental-based calculation and estimation approach, reducing the loosening test requirement by approximately 50% with respect to MAST testing, which is regularly carried out in product development. In this way, improvements can be achieved in terms of time and cost for the durability tests to be carried out for new fastener development, as well as cost reduction and mitigation studies.

5. Conclusions

In this study, an approach using the Taguchi method (TM) and neural network (NN) was developed to predict the self-loosening mechanism of bolted joints in automotive chassis engine suspension connections. It represents a pioneering study using neural networks to predict the self-loosening mechanism and to determine the behavior of bolted joints in automotive chassis engine suspension connections.
In the proposed study, instead of Junker vibration tests, which are commonly used in the literature, a monoaxial vibration bench was used to simulate in exact same on-vehicle bolted joint structure to perform radial vibration tests. External loading values acting on the joints of the engine suspension were collected from bench tests for experimental design. They were determined using actual joint conditions to obtain training and test data for the NN. Seven controlled factors influencing the torque–clamping load relationship and bolt loosening rate were considered.
The contributions of this study in the field of self-loosening and the behavior of bolted joints are as follows:
(i)
It we found that the radial displacement, clamp load, and surface conditions of connected parts were the parameters with the greatest influence on the self-loosening mechanisms of bolted joints.
(ii)
The radial displacement acting on a bolted joint had a major effect on the loosening of bolted joints among all factors. According to this superiority, if a joint is subjected to a high radial displacement, it is important to determine other influential parameters to prevent loosening.
(iii)
According to Taguchi analysis, increasing the clamp load, working thread length between male and female threads, bearing area, and serrated surface condition between the connected parts would reduce the loosening rate of the bolted joints. No significant effect of joint rigidity on loosening rate was found.
(iv)
The results showed that the proposed approach can be used to predict the mechanism of self-loosening and the behavior of bolted joints without additional tests. Thus, it is possible to make predictions with very low error rates using artificial intelligence techniques. This brings advantages in terms of time and cost.

Author Contributions

Conceptualization, B.G. and F.Ö.; methodology, B.G. and F.Ö.; software, B.G., Ö.Ş. and O.Y.; validation, B.G.; investigation, B.G.; data curation, B.G., Ö.Ş. and O.Y.; writing—original draft preparation, B.G.; writing—review and editing, B.G. and F.Ö. All authors have read and agreed to the published version of the manuscript.

Funding

This research received no external funding.

Data Availability Statement

Not applicable.

Acknowledgments

The authors would like to express their gratitude to TOFAŞ Türk Otomobil Fabrikası A.Ş. for the physical test facilities.

Conflicts of Interest

The authors declare no conflict of interest.

Nomenclature

LMLevenberg–Marquardt
TMTaguchi method
DOEDesign of experiment
NNNeural network
BRBayesian regularization
MASTMultiaxial simulation table
SSDSingle-shot multi-box detector
GMVDGeneralized variable mode decomposition

References

  1. Evans, W.M. United States Air Force Aircraft Accident Investigation Board Report. 2015. Available online: www.airandspaceforces.com (accessed on 29 June 2023).
  2. Knight, I.; Dodd, M.; Grover, C.; Bartlett, R.S.; Brightman, T. Heavy Vehicle Wheel Detachment: Frequency of Occurrence, Current Best Practice and Potential Solutions, TRL Limited Report: PPR086. 2010. Available online: www.vgls.vic.gov.au (accessed on 29 June 2023).
  3. RAIB. Rail Accident Report, Derailment at Greyrigg 23 February 2007. Available online: www.assets.publishing.service.gov.uk (accessed on 29 June 2023).
  4. Monville, J.M. Optimal tightening process of bolted joints. Int. J. Simul. Multi. Des. Optim. 2016, 7, A4. [Google Scholar] [CrossRef]
  5. Bickford, J.H. An Introduction to the Design and Behavior of Bolted Joints, 4th ed.; CRC Press: Boca Raton, FL, USA, 2008. [Google Scholar]
  6. Kandreegula, S.K. Innovative Approach of Wedge Washer to Avoid Bolt Loosening in Automotive Applications. SAE Int. J. Passeng. Cars Mech. Syst. 2018, 11, 45–52. [Google Scholar] [CrossRef]
  7. Datta, S.; Dittur, P. Quantification of Clamp Loss and Subsequent Loosening of Automotive Hub-Knuckle Joints under Time-Varying Proving Ground Loading. SAE Technical Paper 2020-01-0181. 2020. Available online: www.sae.org (accessed on 29 June 2023).
  8. Gürsel, K.T.; Yarkın, T. Otomobillerin Şasi Montajlarında Cıvata Sıkma Limitlerinin Saptanması. J. Polytech. 2014, 17, 193. [Google Scholar]
  9. Liu, Z.; Zheng, M.; Guo, J.; Chu, H.; Yan, X.; Ying, L. Experimental Study on Performance Characterization of Bolted Joint Under Transverse Loading. Measurement 2021, 182, 109608. [Google Scholar] [CrossRef]
  10. Huang, J.; Liu, J.; Gong, H.; Deng, X.; Deng, A. Comprehensive review of loosening detection methods for threaded fasteners. Mech. Syst. Signal Process. 2022, 168, 108652. [Google Scholar] [CrossRef]
  11. Guo, Y.; Zhang, Z.; Yang, W.; Cao, J.; Gong, T. Early bolt looseness state identification via generalized variational mode decomposition and similarity index. J. Mech. Sci. Technol. 2021, 35, 861–873. [Google Scholar] [CrossRef]
  12. Eraliev, O.; Lee, K.H.; Lee, C.H. Vibration-Based Loosening Detection of a Multi-Bolt Structure Using Machine Learning Algorithms. Sensors 2022, 22, 1210. [Google Scholar] [CrossRef]
  13. Goodier, J.N.; Sweeney, R. Loosening by vibration of threaded fastenings. Mech. Eng. 1945, 67, 798–802. [Google Scholar]
  14. Sauer, J.; Lemmon, D.; Lynn, E. Bolts: How to prevent their loosening. Mach. Des. 1950, 22, 133–139. [Google Scholar]
  15. Gambrell, S.C. Why bolts loosen? Mach. Des. 1968, 40, 163–167. [Google Scholar]
  16. Hess, D.P.; Davis, K. Threaded components under axial harmonic vibration Part 1: Experiments. J. Vib. Acoust. Trans. ASME 1996, 118, 417–422. [Google Scholar] [CrossRef]
  17. Hess, D.P.; Basava, S. Variation of clamping force in a single-bolt assembly subjected to axial vibration. Am. Soc. Mech. Eng. Des. Eng. 1998, 90, 97–102. [Google Scholar]
  18. Hess, D.P.; Sudhirkashyap, S.V. Dynamic loosening and tightening of a single bolt assembly. J. Vib. Acoust. Trans. ASME 1997, 119, 311–316. [Google Scholar] [CrossRef]
  19. Rashquinha, I.A.; Hess, D.P. Modelling nonlinear dynamics of bolted assemblies. Appl. Math. Model. 1997, 21, 801–810. [Google Scholar] [CrossRef]
  20. Basava, S.; Hess, D.P. Bolted joint clamping force variation due to axial vibration. J. Sound Vib. 1998, 210, 255–265. [Google Scholar] [CrossRef]
  21. Clark, S.K.; Cook, J.J. Vibratory Loosening of Bolts, Society of Automotive Engineering Paper No. 660432. 1966, pp. 1–10. Available online: www.sae.org/publications/technical-papers/content/660432/ (accessed on 29 June 2023).
  22. Sakai, T. Investigations of bolt loosening mechanisms, 1st Report. Bolts of transversely loaded joints. Bull. JSME 1978, 21, 1385–1390. [Google Scholar] [CrossRef]
  23. Junker, G.H. New criteria for self-loosening of fasteners under vibration. Soc. Automot. Eng. 1969, 78, 314–335. [Google Scholar]
  24. Nassar, S.A.; Housari, B.A. Self-loosening of threaded fasteners due to cyclic transverse loads. In Proceedings of the ASME Pressure Vessels and Piping Conference, Denver, CO, USA, 17–21 July 2005. [Google Scholar]
  25. Finkelston, R.J. How much shake can bolted joints take? Mach. Des. 1972, 44, 122–128. [Google Scholar]
  26. Pierce, M.B. A Study of Vibration-Resistant Fasteners. SAE Paper 730825. 1973. Available online: www.sae.org (accessed on 29 June 2023).
  27. Eccles, W. Tribological aspects of the self-loosening of threaded fasteners. Ph.D. Thesis, University of Central Lancashire, Lancashire, UK, 2010. [Google Scholar]
  28. Eccles, W.; Sherrington, I.; Arnell, R.D. Towards an understanding of the loosening characteristics of prevailing torque nuts. Sage J. 2010, 224, 483–495. [Google Scholar] [CrossRef]
  29. Dick, S.J. Vibrational loosening of threaded fasteners—Effect of Various corrosion resistant finishes. Austin Rover Rep. 1984, 84, 11–50. [Google Scholar]
  30. Bhattacharya, A.; Sen, A.; Das, S. An investigation on the anti-loosening characteristics of threaded fasteners under vibratory conditions. Mech. Mach. Theory 2010, 45, 1215–1225. [Google Scholar] [CrossRef]
  31. Dravid, S.; Yadav, J.; Kurre, S. Comparison of loosening behavior of bolted joints using plain and spring washers with full-threaded and plain shank bolts. Int. J. Mech. Based Des. Struct. Mach. 2021. [Google Scholar] [CrossRef]
  32. Yokoyama, T.; Olsson, M.; Izumi, S.; Sakai, S. Investigation into the self-loosening behavior of bolted joint subjected to rotational loading. Eng. Fail. Anal. 2012, 23, 35–43. [Google Scholar] [CrossRef]
  33. Dinger, G.; Friedrich, C. Avoiding self-loosening failure of bolted joints with numerical assessment of local contact state. Eng. Fail. Anal. 2011, 18, 2188–2200. [Google Scholar] [CrossRef]
  34. Liu, B.; Li, Y.; Wang, Y.; Zhang, C.; Chu, H. Analysis of self-loosening behavior of high strength bolts based on accurate thread modelling. Eng. Fail. Anal. 2021, 127, 105541. [Google Scholar] [CrossRef]
  35. Izumi, S.; Yokoyama, T.; Iwasaki, A.; Sakai, S. Three-dimensional finite element analysis of tightening and loosening mechanism of threaded fastener. Eng. Fail. Anal. 2005, 12, 604–615. [Google Scholar] [CrossRef]
  36. DIN 65151; Aerospace Series—Dynamic Testing of the Locking Characteristics of Fasteners under Transverse Loading Conditions (Vibration Test). 2002. Available online: www.din.de/de (accessed on 29 June 2023).
  37. DIN 25201-1; Design Guide for Railway Vehicles and Their Components in Bolted Joints—Part 4: Securing of Bolted Joints. 2015. Available online: www.din.de/de (accessed on 29 June 2023).
  38. Su, C.T.; Chiu, C.C.; Chang, H.H. Parameter design optimization via neural network and genetic algorithm. Int. J. Ind. Engineering 2000, 7, 224–231. [Google Scholar]
  39. Khaw, J.F.; Lim, C.B.C.; Lim, L.E.N. Optimal design of neural networks using Taguchi method. Neurocomputing 1995, 7, 225–245. [Google Scholar] [CrossRef]
  40. Lin, H. Optimizing the auto-brazing process quality of aluminum pipe and flange via a Taguchi-Neural-Genetic approach. J. Intell. Manuf. 2012, 23, 679–686. [Google Scholar] [CrossRef]
  41. Kechagias, J.; Tsiolikas, A.; Arteris, P.; Vaxevanidis, N. Optimizing ANN performance using DOE: Application on turning of a titanium alloy. MATEC Web Conf. 2018, 178, 01017. [Google Scholar] [CrossRef]
  42. Taguchi, G.; Elsayed, E.A.; Hsiang, T.C. Quality Engineering in Production Systems; McGraw-Hill: New York, NY, USA, 1989. [Google Scholar]
  43. Peace, G.S. Taguchi Methods: A Hands-on Approach; Addison-Wesley Publishing Company: Reading, MA, USA, 1993. [Google Scholar]
  44. Nassar, S.A.; Housari, B.A. Effect of thread pitch and initial tension on the self-loosening of threaded fasteners. J. Press. Vessel. Technol. Trans. ASME 2006, 128, 590–598. [Google Scholar] [CrossRef]
  45. Yu, J.C.; Chen, X.X.; Hung, T.R.; Thibaut, F. Optimization of extrusion blow molding processes using soft computing and Taguchi’s method. J. Intell. Manuf. 2004, 15, 625–634. [Google Scholar] [CrossRef]
  46. Su, C.T.; Chiang, T.L. Optimizing the IC wire bonding process using a neural networks/genetic algorithms approach. J. Intell. Manuf. 2003, 14, 229–238. [Google Scholar] [CrossRef]
  47. Yu, Y.; Liu, Y.; Chen, J.; Jiang, D.; Zhuang, Z.; Wu, X. Detection Method for Bolted Connection Looseness at Small Angles of Timber Structures based on Deep Learning. Sensors 2021, 21, 310. [Google Scholar] [CrossRef]
  48. Çallı, M.; Albak, E.İ.; Öztürk, F. Prediction and optimization of the design and process parameters of a hybrid DED product using artificial intelligence. Appl. Sci. 2022, 12, 5027. [Google Scholar] [CrossRef]
  49. Pfrommer, J.; Zimmerling, C.; Liu, J.; Karger, L.; Henning, F. Optimisation of manufacturing process parameters using deep neural networks as surrogate models. Procedia CIRP 2018, 72, 426–431. [Google Scholar] [CrossRef]
  50. Jin, R.; Chen, W.; Simpson, T.W. Comparative studies of metamodelling techniques under multiple modelling criteria. Struct. Multidiscip. Optim. 2001, 23, 1–13. [Google Scholar] [CrossRef]
  51. Bulut, E.; Albak, E.İ.; Sevilgen, G.; Öztürk, F. Prediction and Optimization of the Design Decisions of Liquid Cooling Systems of Battery Modules Using Artificial Neural Networks. Int. J. Energy Res. 2022, 46, 1–16. [Google Scholar] [CrossRef]
  52. Tusar, T.; Gantar, K.; Koblar, V.A. Study of overfitting in optimization of a manufacturing quality control procedure. J. Appl. Soft Comput. 2017, 59, 77–87. [Google Scholar] [CrossRef]
Figure 1. Flowchart of proposed study.
Machines 11 00895 g001
Figure 2. Instrumented part and strain gauge location.
Machines 11 00895 g002
Figure 3. MAST test bench.
Machines 11 00895 g003
Figure 4. Instrumented part location in MAST bench.
Machines 11 00895 g004
Figure 5. System strain output for four different road profiles.
Machines 11 00895 g005
Figure 6. Monoaxial test setup.
Machines 11 00895 g006
Figure 7. Bolt and female thread specimens.
Machines 11 00895 g007
Figure 8. Connecting parts with different hole diameter and thickness.
Machines 11 00895 g008
Figure 9. Effects of factors on the S/N ratios of the loosening rate index.
Machines 11 00895 g009
Figure 10. Effects of factors on the mean values of the loosening rate index.
Machines 11 00895 g010
Figure 11. NN architecture.
Machines 11 00895 g011
Table 1. Strain gauge specifications.
Strain Gauge DescriptionModel NumberBridge TypeResistance (Ohm)
R1 & R2Comp-1Quarter bridge350
R3 & R4Comp-2Quarter bridge350
Table 2. Max–min response table from data acquisition.
Channel NameUnitsMinMax
R3_0_Degrµε−140.012141.977
R3_45_Degµε−68.90435.103
R3_90_Degµε−89.175176.785
R1_Linearµε−12.51713.471
R4_0_Degµε−150.979125.838
R4_45_Degµε−50.89425.222
R4_90_Degµε−98.38394.465
R2_Linearµε−4.3428.836
Table 3. Controlled parameters, their levels, and loosening rates of vibration tests.
Test NoClamp Force, NRadial Displacement, mmClamping Length, mmSurface Condition between PartsJoint Rigidity, N/mmWorking Thread Length, mmBearing Area, mm2Loosening Rates (N/cycle)
130,0000.1548Serrated853,689152350.998557639
230,0000.1548Normal853,689253610.466683951
330,0000.1558Serrated1,098,156153610.066644452
430,0000.1558Normal1,098,156252350.745979997
530,000148Serrated1,098,156252352.398081535
630,000148Normal1,098,156153613.400075557
730,000158Serrated853,689253613.10024113
830,000158Normal853,689152353.994673768
945,0000.1548Serrated1,098,156253610.0135
1045,0000.1548Normal1,098,156152350.299900033
1145,0000.1558Serrated853,689252350.0135
1245,0000.1558Normal853,689153610.089675375
1345,000148Serrated853,689153611.339152862
1445,000148Normal853,689252351.797603196
1545,000158Serrated1,098,156152351.199893343
1645,000158Normal1,098,156253613.150525088
1737,5000.57553Normal975,921202981.25635
1830,0000.1548Normal853,689152350.992105
1945,000158Serrated1,098,156253611.785632
Table 4. Response table for signal-to-noise ratios and their input effect rank.
LevelClamp ForceRadial DisplacementClamping LengthSurface ConditionJoint RigidityWorking Thread LengthBearing Area
1−0.922817.36204.01880.35644.87573.96093.0135
211.3168−6.96806.375210.03765.51836.43317.3805
Delta (dB)12.239624.33002.35659.68130.64262.47224.3670
Rank2163754
Table 5. Response table for means and their input effect rank.
LevelClamp ForceRadial DisplacementClamping LengthSurface ConditionJoint RigidityWorking Thread LengthBearing Area
11.89640.33681.28341.74311.41921.36781.4310
20.93222.49171.54511.08541.40931.46081.3975
Delta (dB)0.96422.15490.26170.65770.00990.09300.0335
Rank2143756
Table 6. Taguchi prediction for experimental tests.
Test #Output TestOutput Minitab PredictionError Rate %
171.256351.350897.525
180.9921051.1256713.463
191.7856321.836432.845
Table 7. NN Levenberg–Marquardt approach results for the prediction of self-loosing mechanism and behavior of bolted joints.
Levenberg-Marquardt AlgorithmError Rate %
Arch.MSE for TrainingMSE for ValidationR-ValueOutput #17Output #18Output #19Output #17Output #18Output #19
7, 3, 10.27570.89510.94841.26720.95531.68060.86363.70985.8821
7, 4, 10.24840.81990.94931.30240.89951.89333.66549.33426.0297
7, 5, 10.27440.92110.92941.25780.96771.72890.11542.45993.1771
7, 6, 10.16870.91640.96351.19520.97861.54644.86731.361213.3976
7, 7, 10.18480.78690.95251.09541.02391.571412.81093.204811.9975
7, 8, 10.12460.83880.97181.35840.97232.12318.12271.996318.8991
7, 9, 10.14330.93580.96921.10150.82851.623112.325416.49079.1022
7, 10, 10.12610.82530.97241.1961.16271.88364.803617.19535.4865
7, 11, 10.13610.87760.96671.32741.08251.57255.65539.111411.9359
7, 12, 10.12390.91010.97021.03250.95851.598517.81753.387210.4799
7, 13, 10.0790.90580.98171.45531.09371.598515.835610.240310.4799
7, 14, 10.09151.03250.97791.47361.06651.760417.29227.49871.4131
7, 15, 10.08331.12060.97971.04480.95821.619616.83853.41759.2982
Table 8. NN Bayesian regularization approach results for the prediction of self-loosing mechanism and behavior of bolted joints.
Bayesian Regularization Error Rate %
Arch.MSE for TrainingMSE for ValidationR ValueOutput #17Output #18Output #19Output #17Output #18Output #19
7, 3, 10.64451.30450.95181.31571.02011.62944.7242.82188.7494
7, 4, 10.40071.10550.95351.22790.91461.67462.26457.81226.2181
7, 5, 10.49260.65280.94721.31851.01821.65934.94692.63037.0749
7, 6, 10.68911.07760.94321.29820.95971.69653.33113.26634.9916
7, 7, 10.66781.11630.9381.26480.94211.64840.67265.04037.6853
7, 8, 10.87611.45650.9361.28560.97861.6872.32821.36125.5236
7, 9, 10.92731.52110.91521.42651.1781.692613.543218.73745.2162
7, 10, 10.88261.22040.93411.35771.05731.70438.06776.57144.5548
7, 11, 10.87661.36240.93311.5621.12351.632624.328413.24418.5702
7, 12, 10.79021.1620.93321.3441.04361.70096.97665.19054.7452
7, 13, 10.79421.32780.93381.30360.98921.6993.76090.29284.8516
7, 14, 10.93871.36540.93241.21290.89681.72583.45849.60633.3507
7, 15, 10.8681.32130.93251.57341.09921.65425.235810.79477.3717
Table 9. Comparison of prediction error rates of Taguchi prediction and LM method.
Prediction MethodError Rate %
Output #17Output #18Output #19
NN–LM 7–5–1 model0.122.463.18
Taguchi analysis7.5213.462.84
Disclaimer/Publisher’s Note: The statements, opinions and data contained in all publications are solely those of the individual author(s) and contributor(s) and not of MDPI and/or the editor(s). MDPI and/or the editor(s) disclaim responsibility for any injury to people or property resulting from any ideas, methods, instructions or products referred to in the content.

