
Advancements in 3D-Printed Novel Nylon-6: A Taguchi Method for Surface Quality Sustainability and Mechanical Properties


Abstract
:1. Introduction
2. Materials and Methods
2.1. Materials
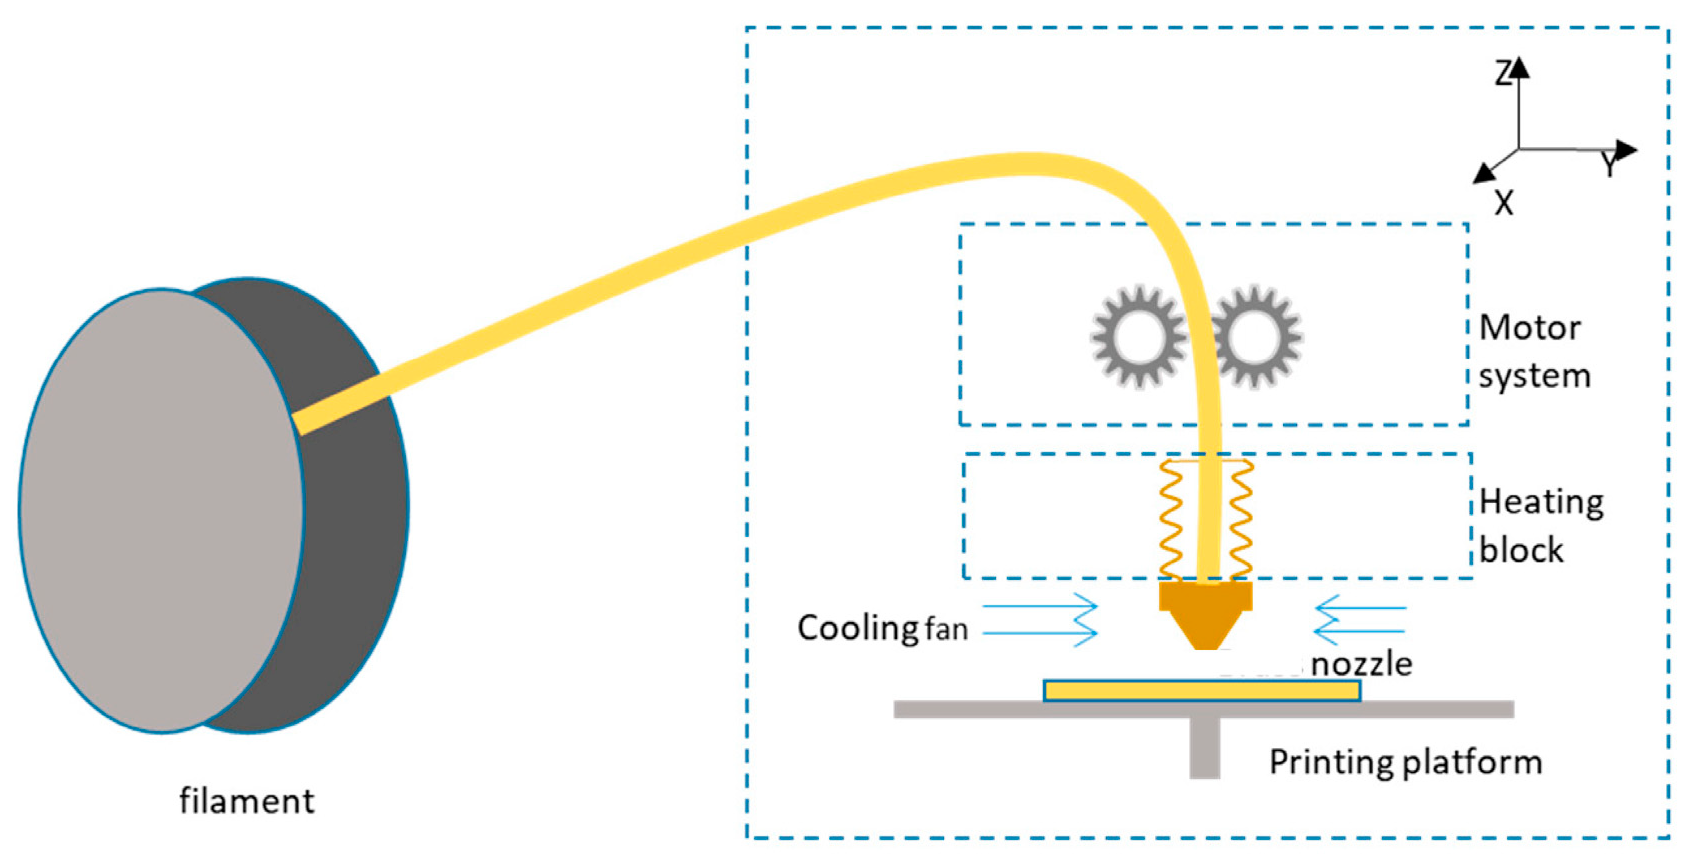
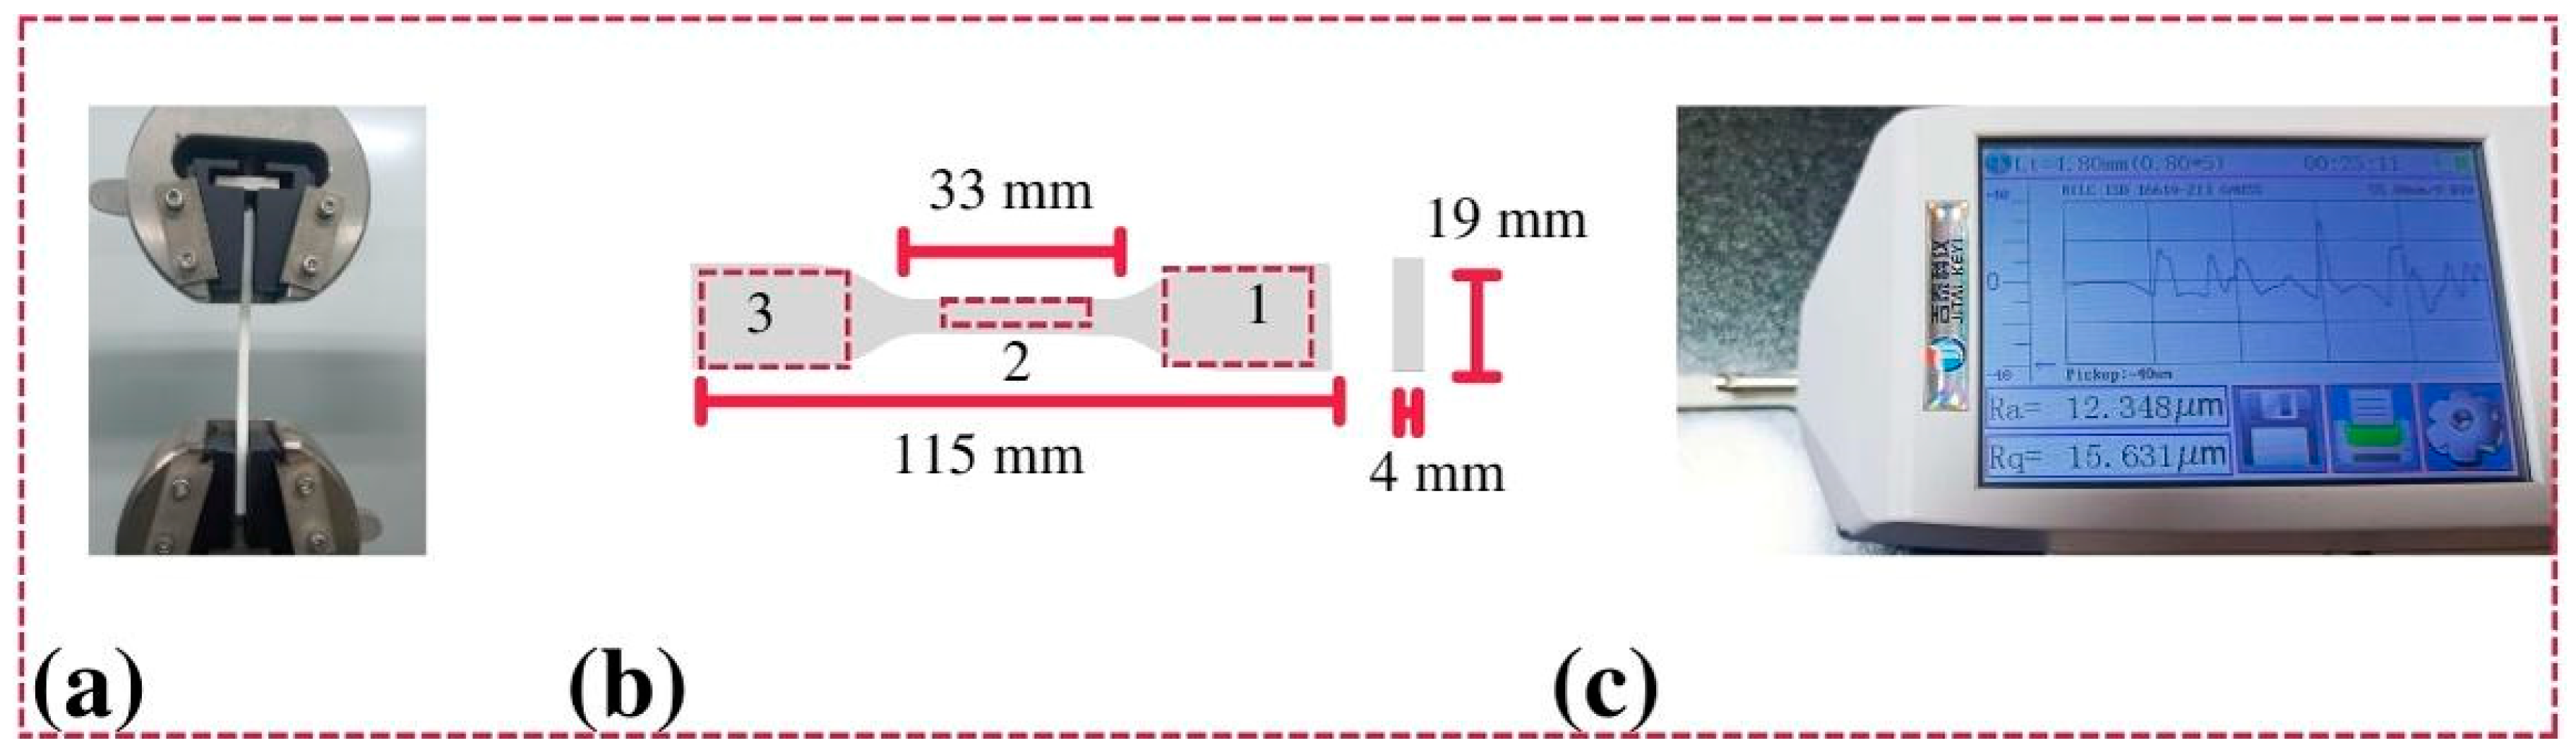
2.2. Methods
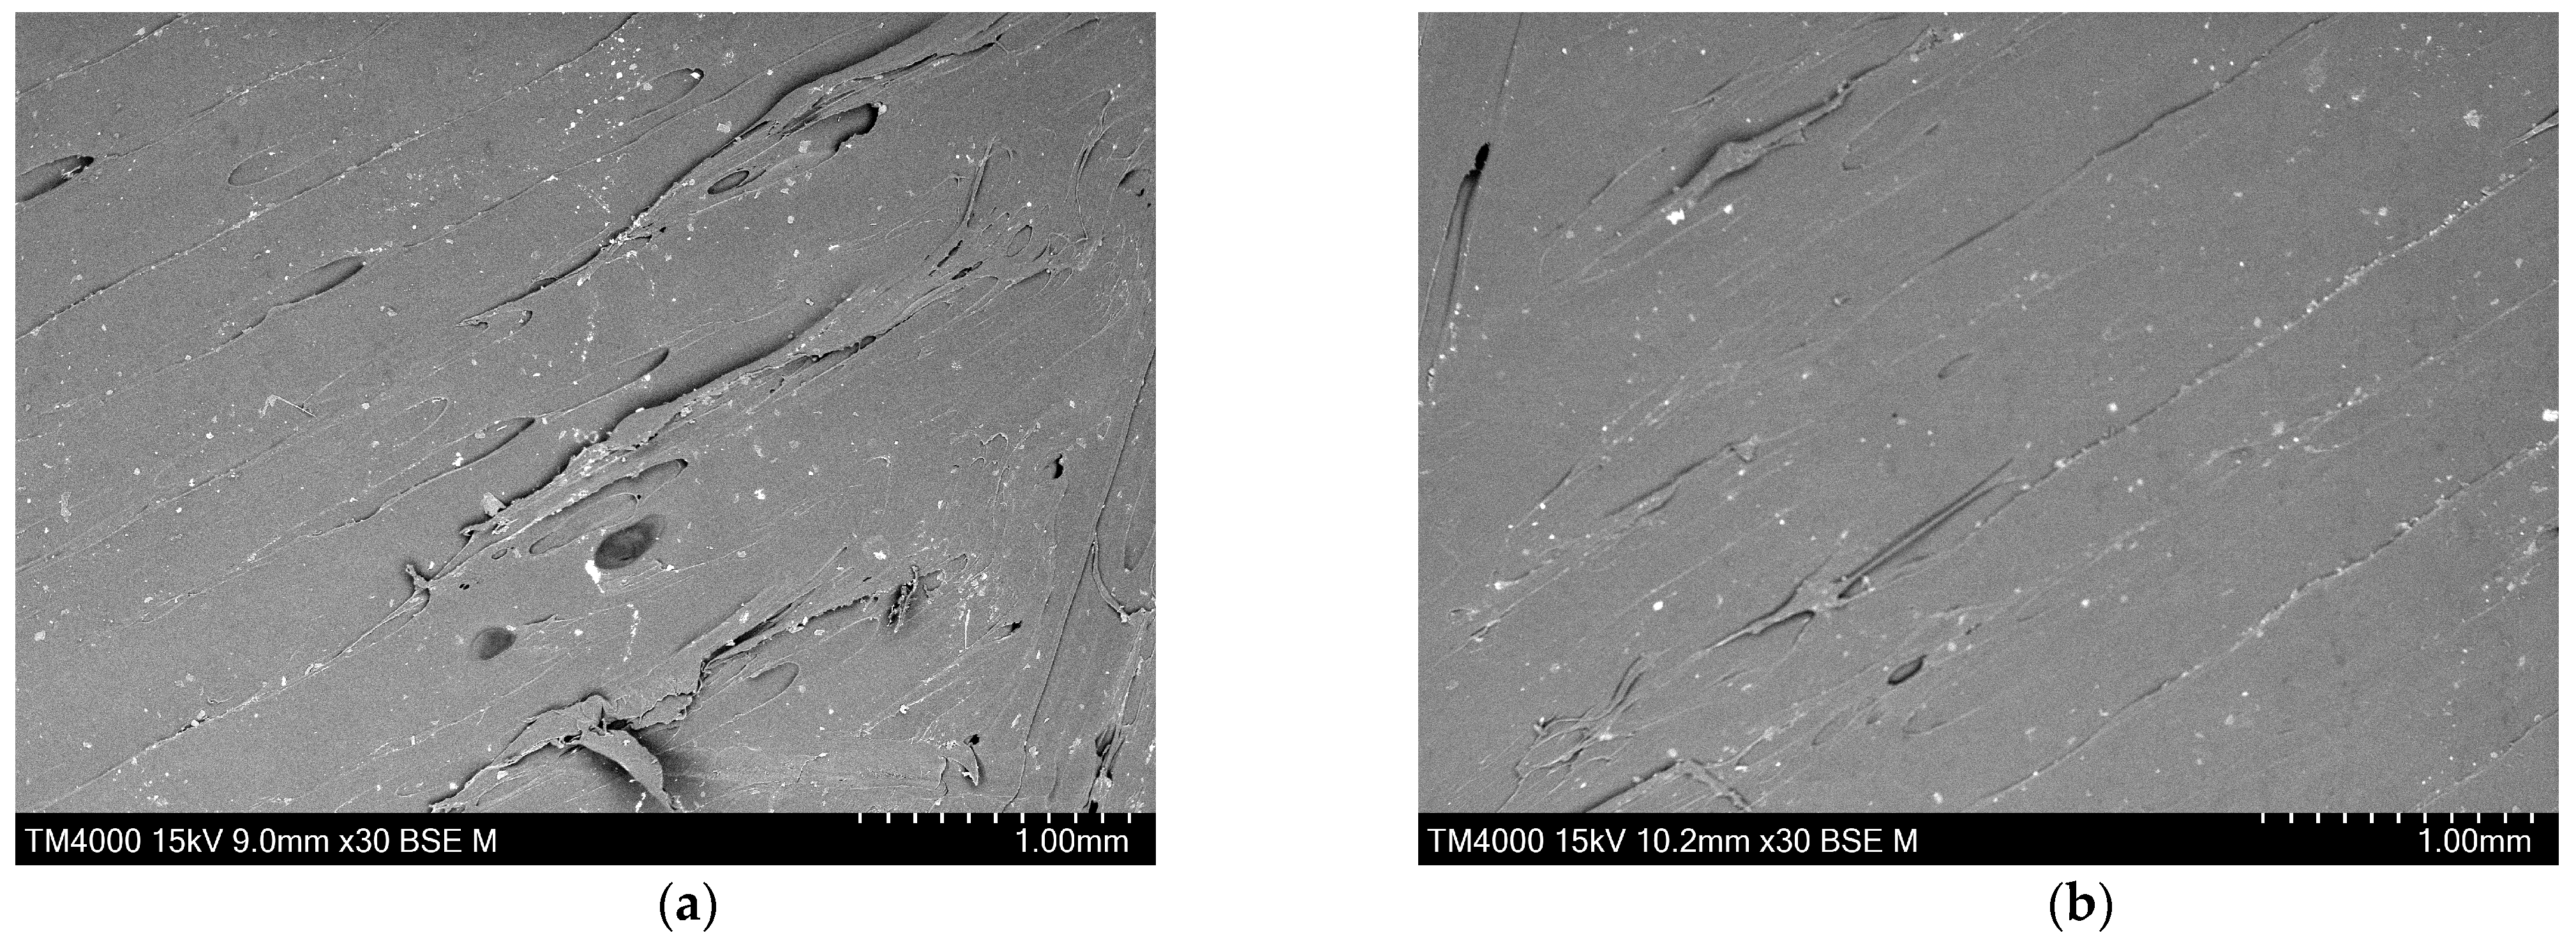
Measurement Procedure
3. Results and Discussions
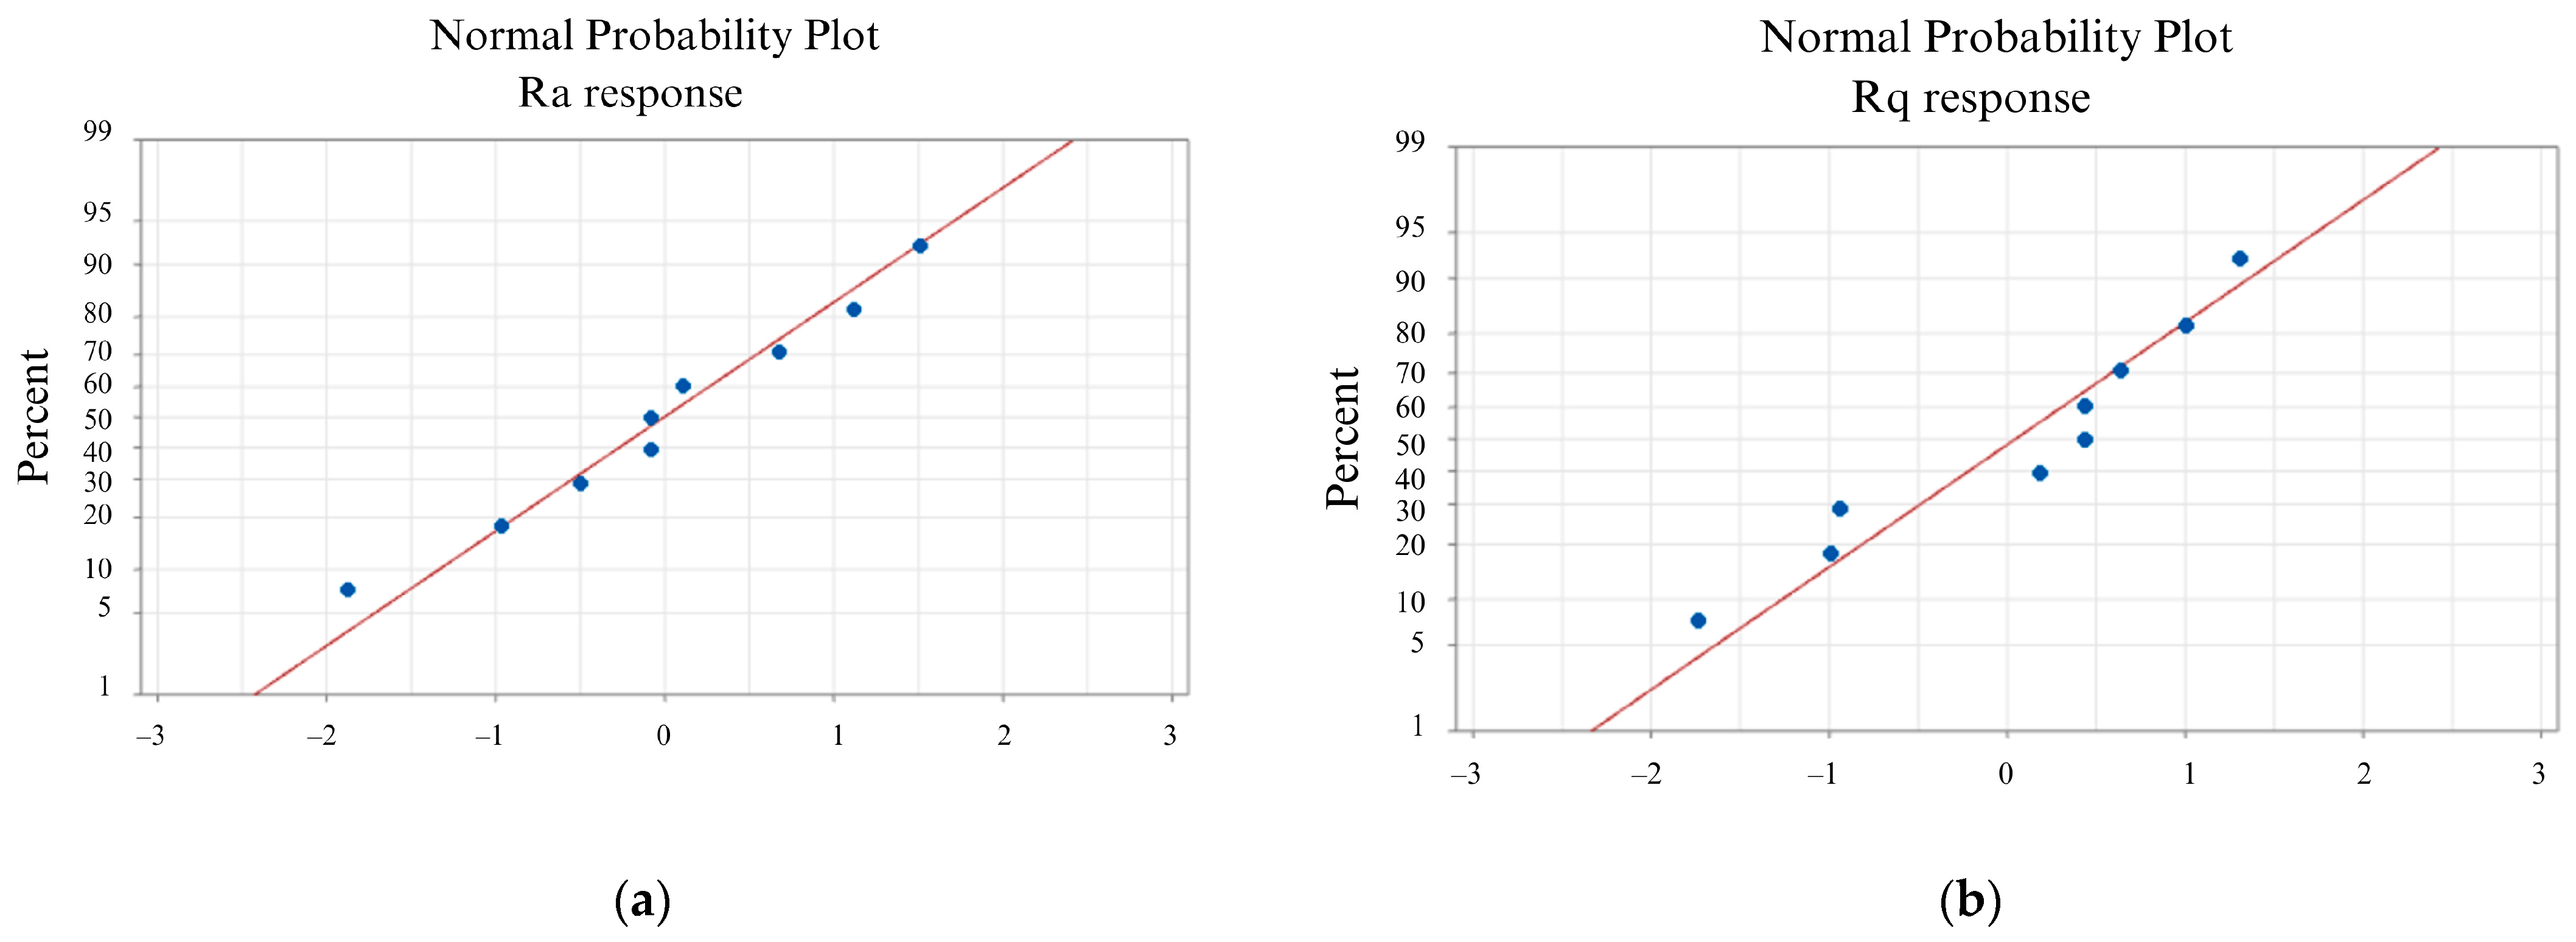
3.1. Taguchi Process
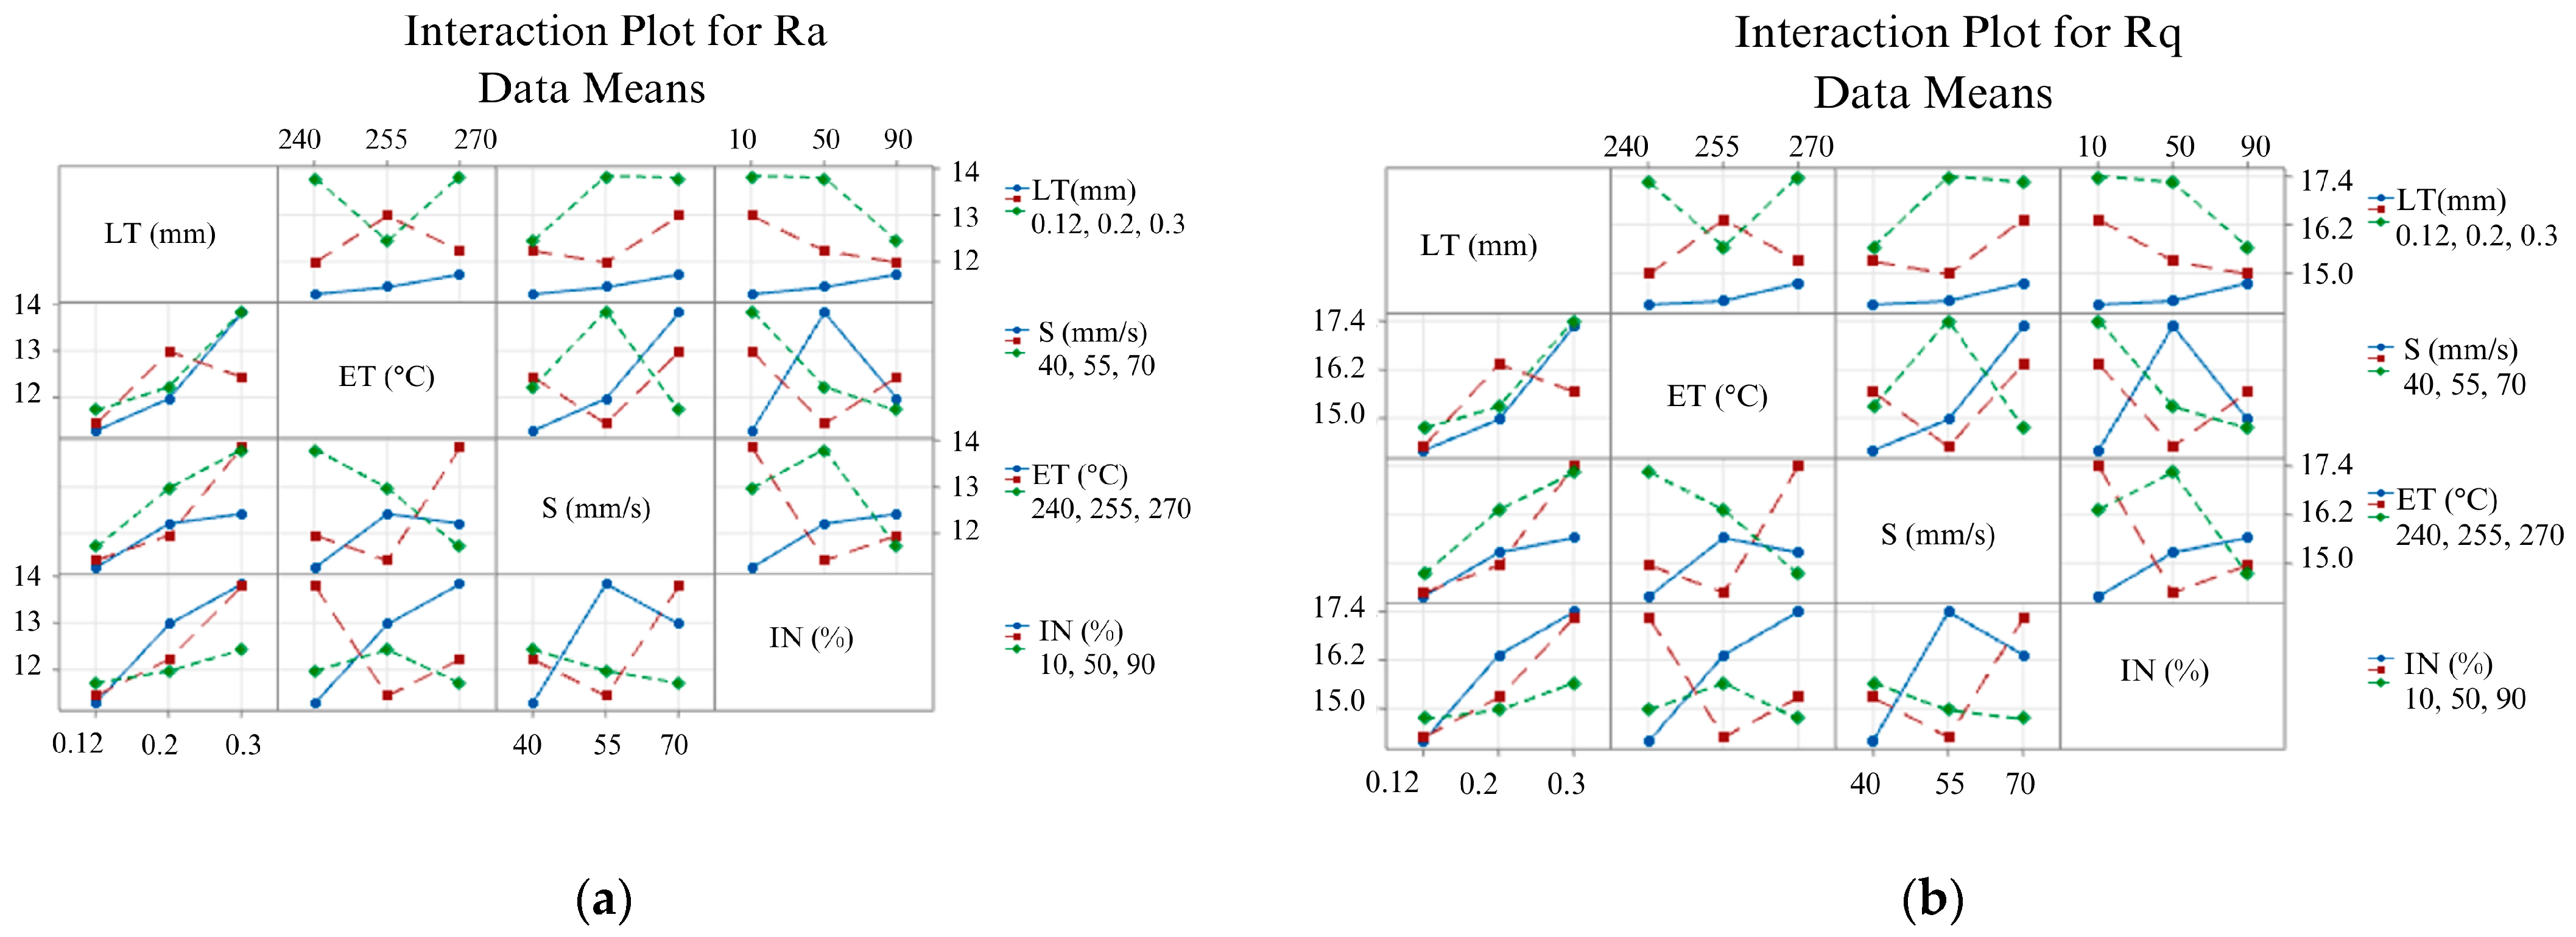
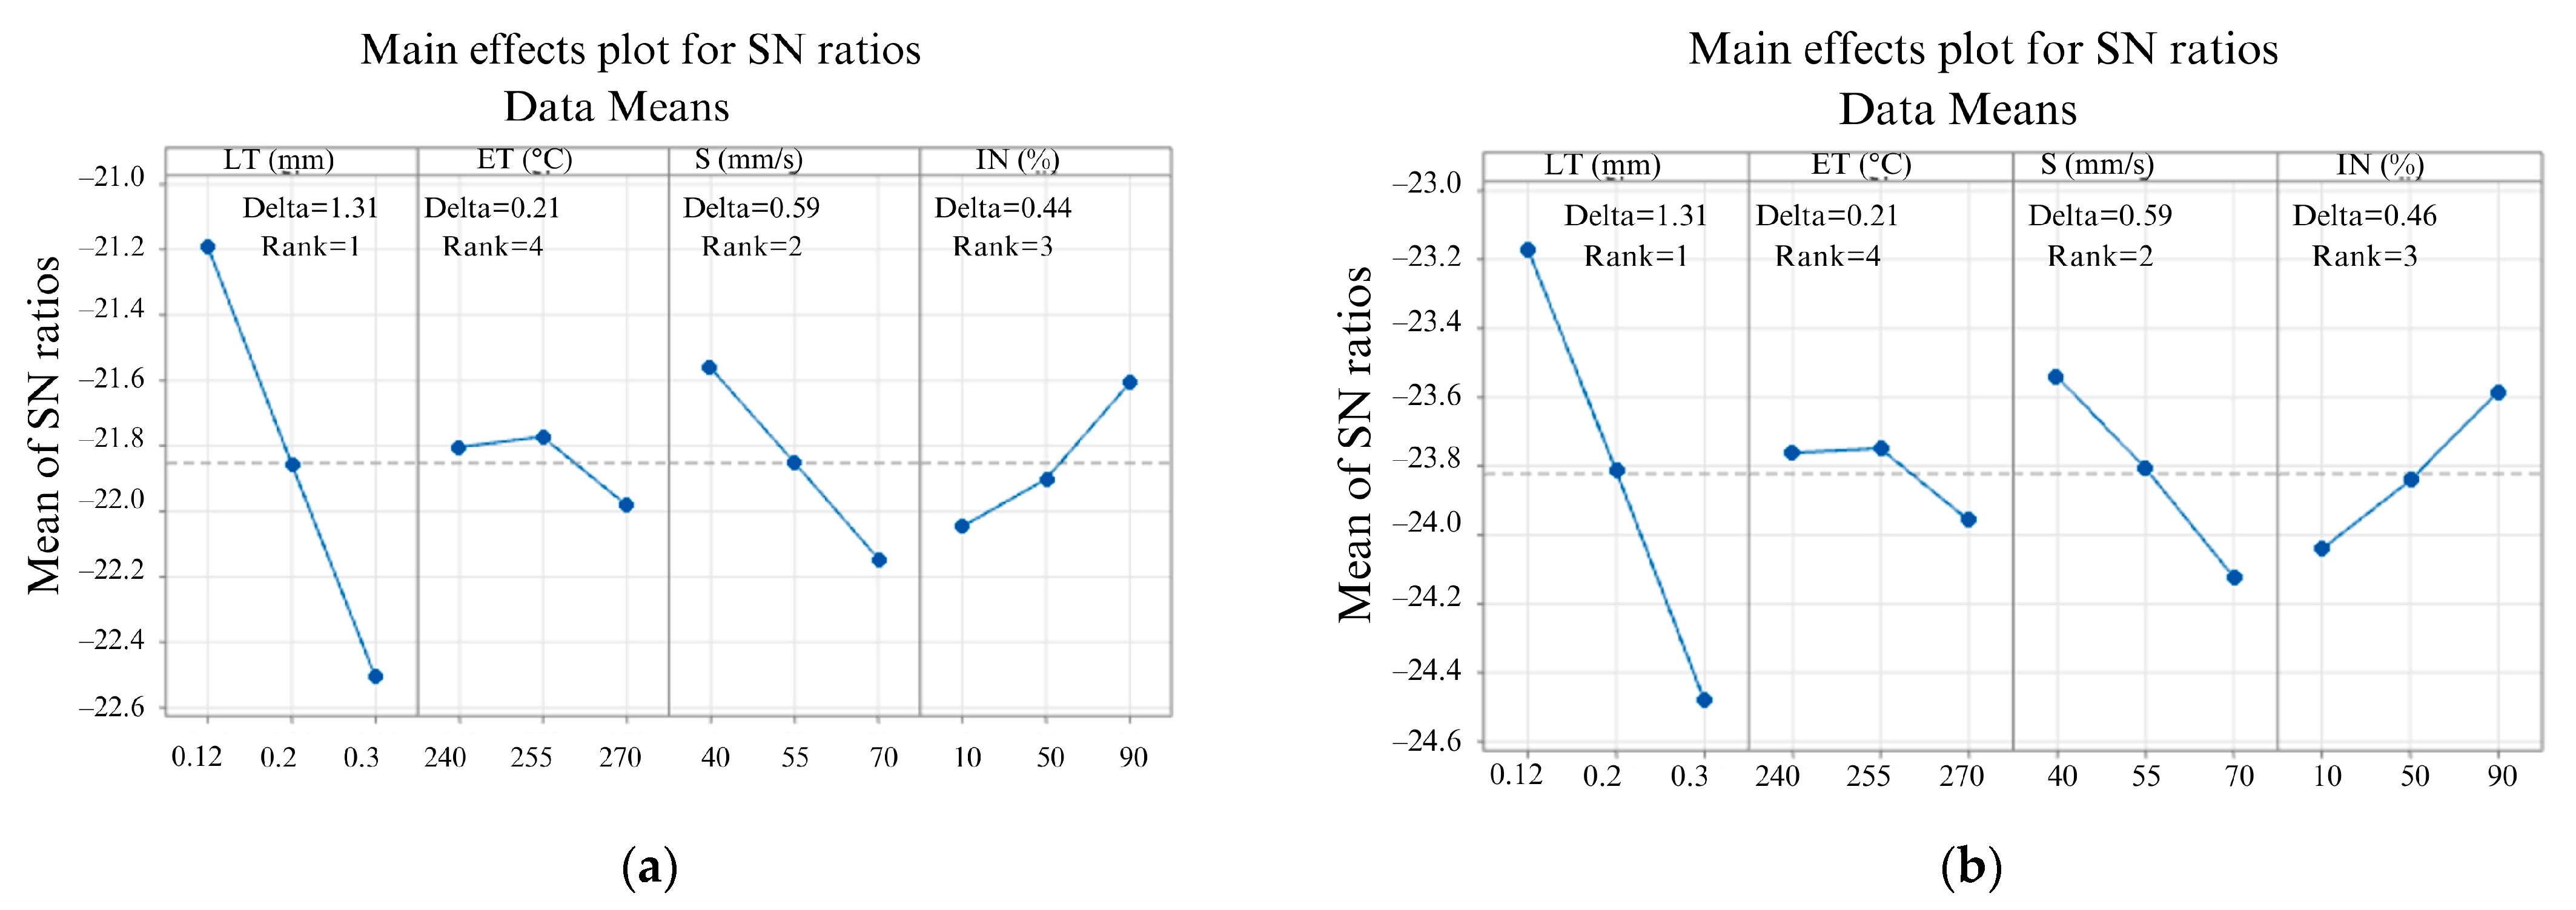
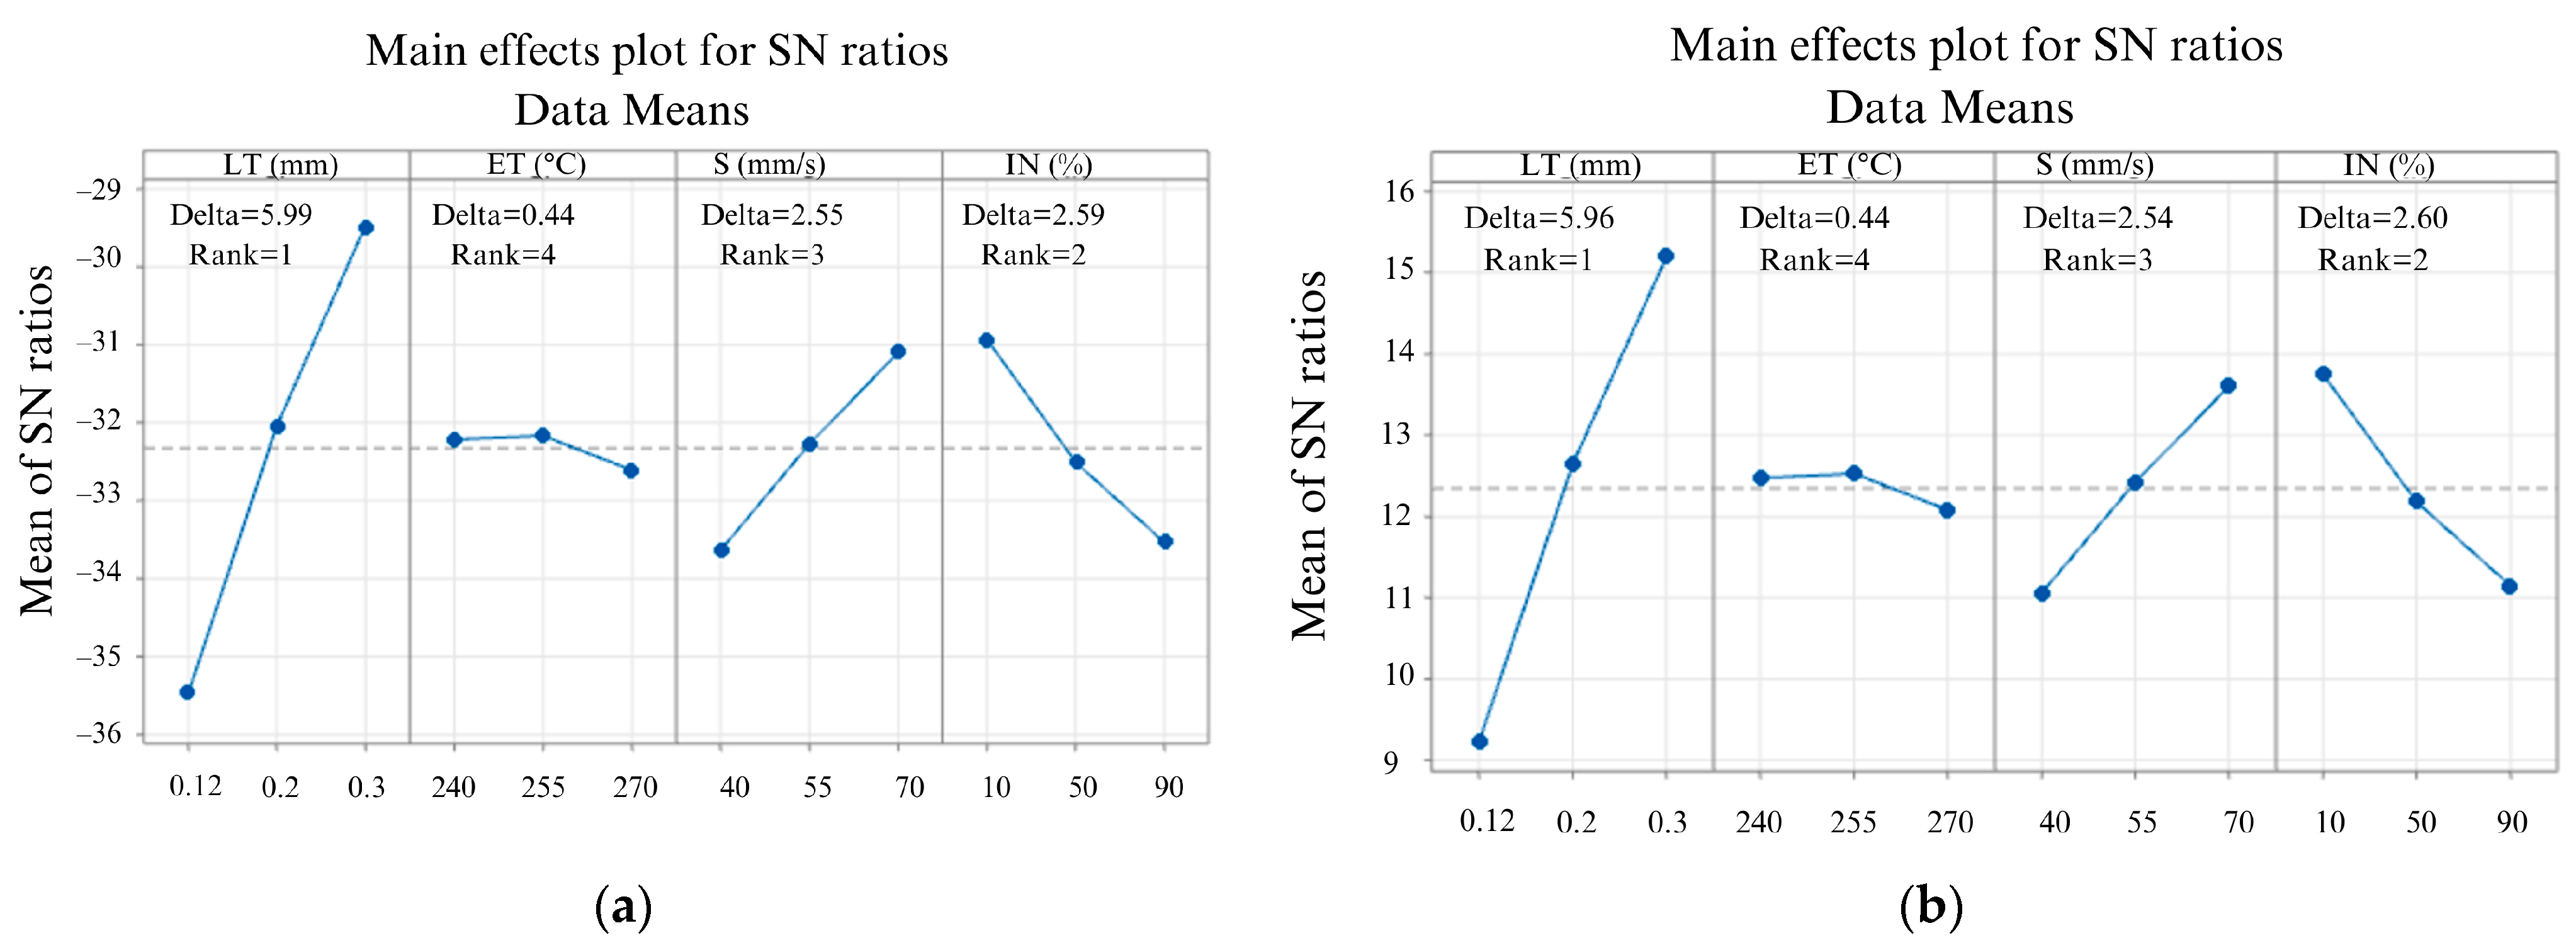
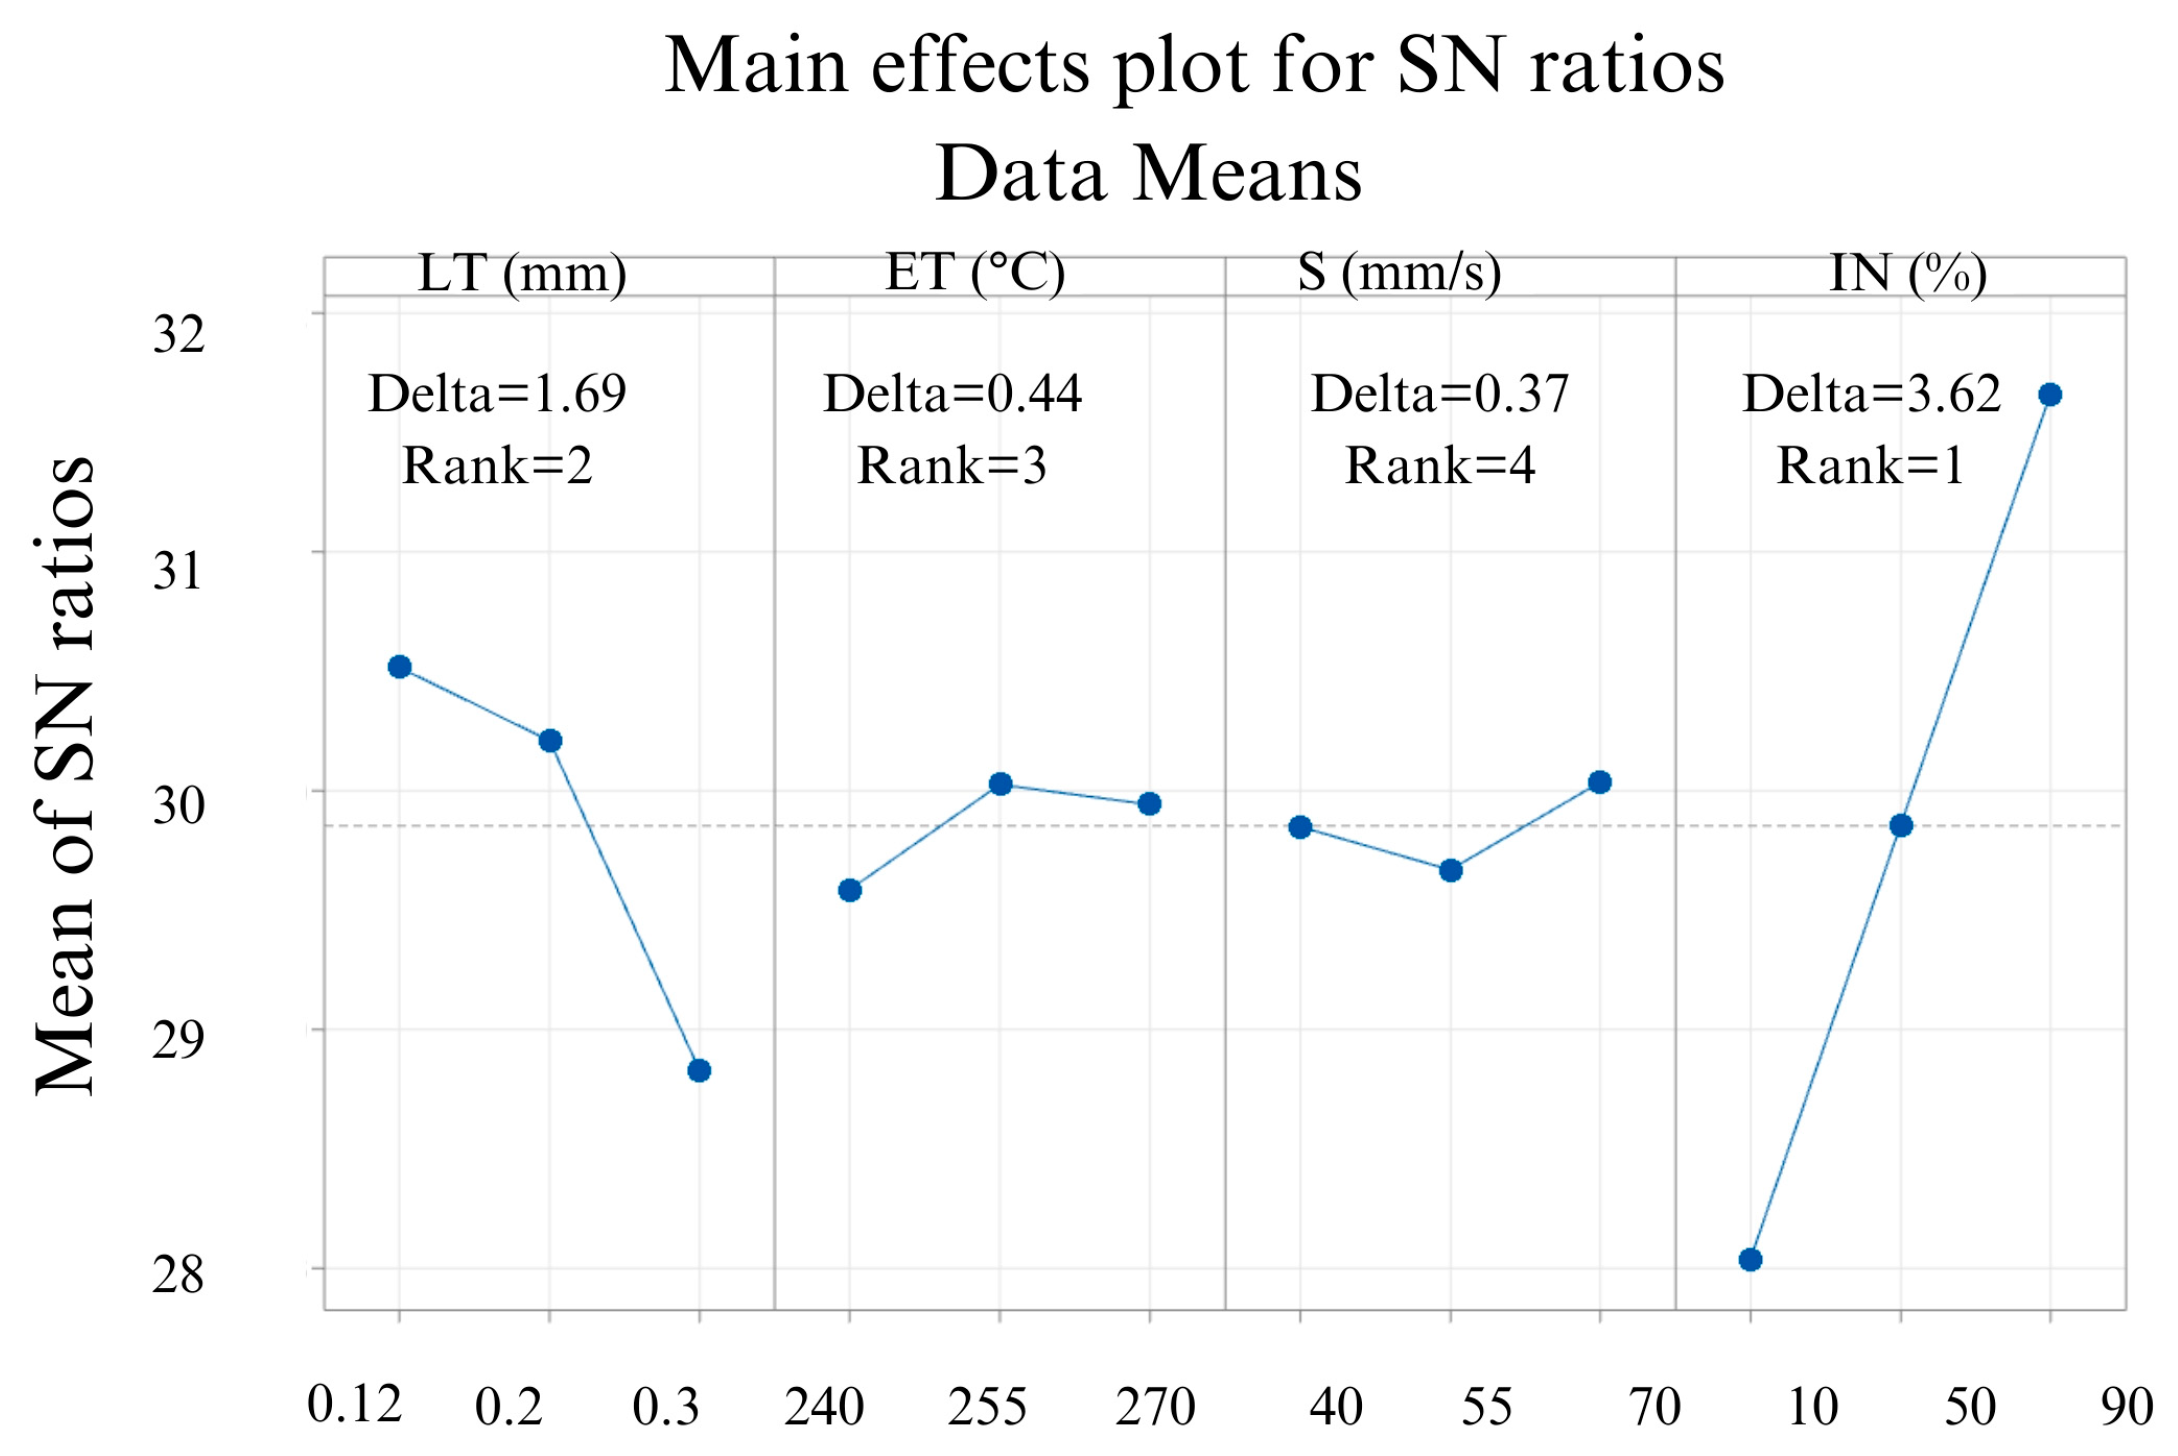
3.2. Effects of the 3D Printing Parameters on Ra and Rq
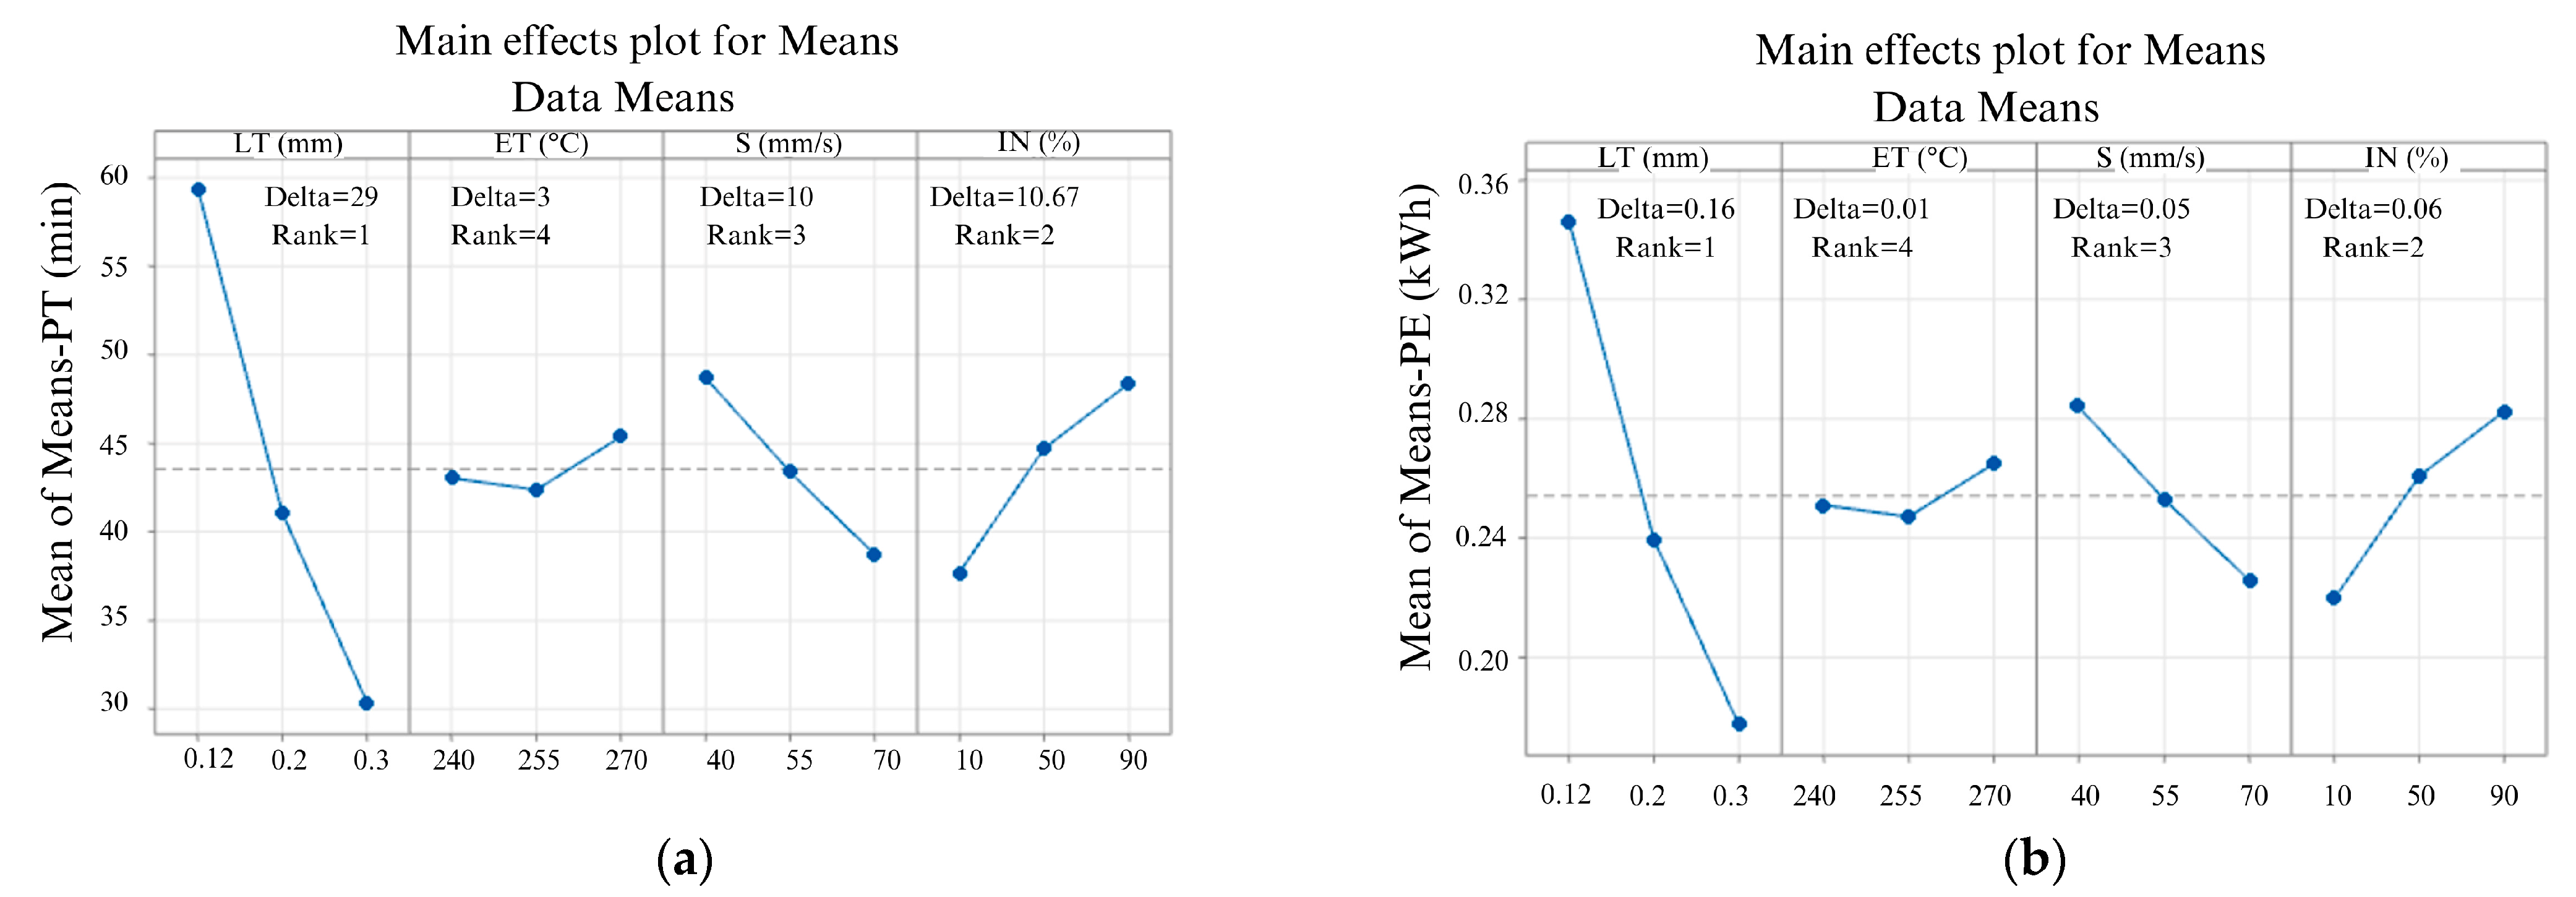
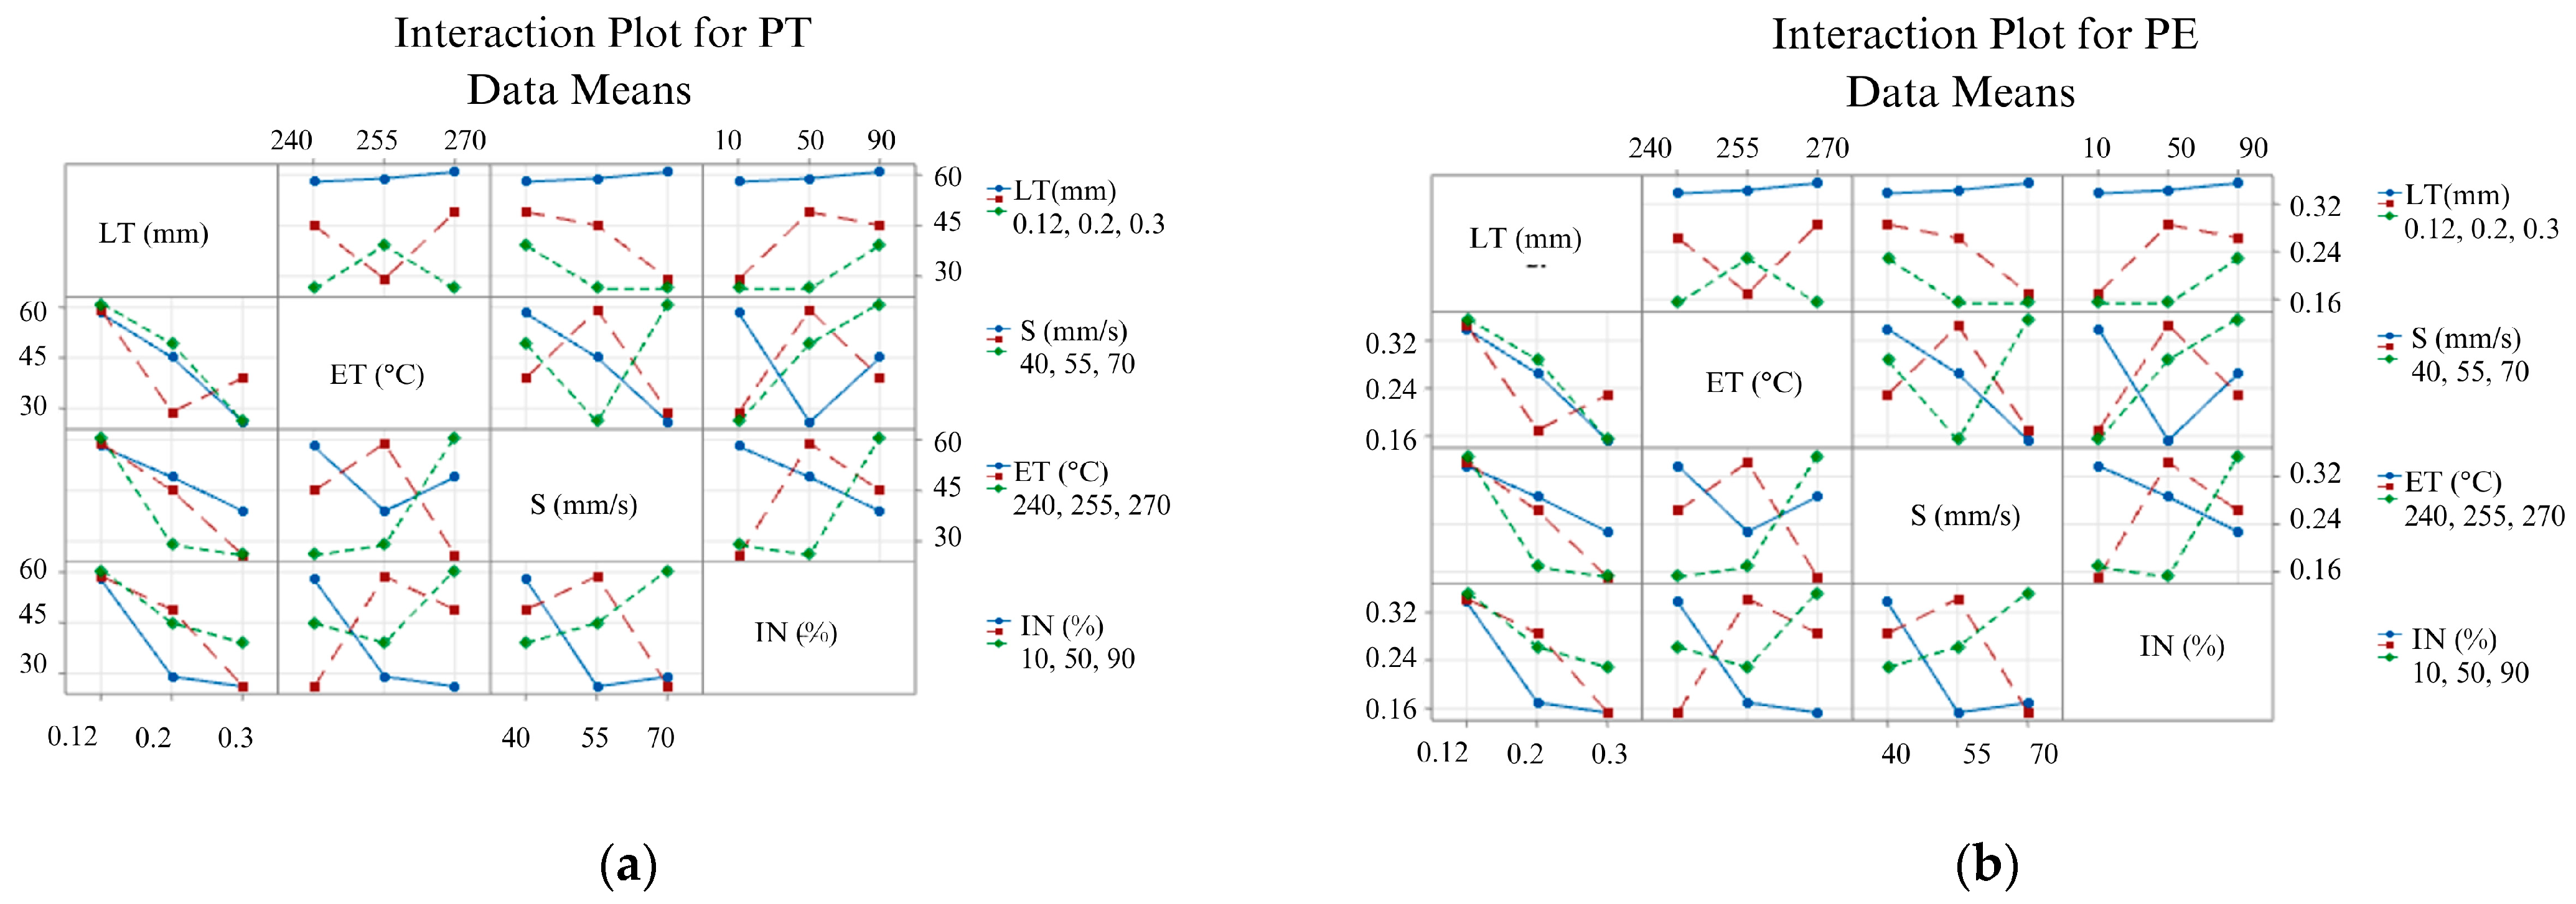
3.3. Effects of the FFF Parameters on Print Time and Energy
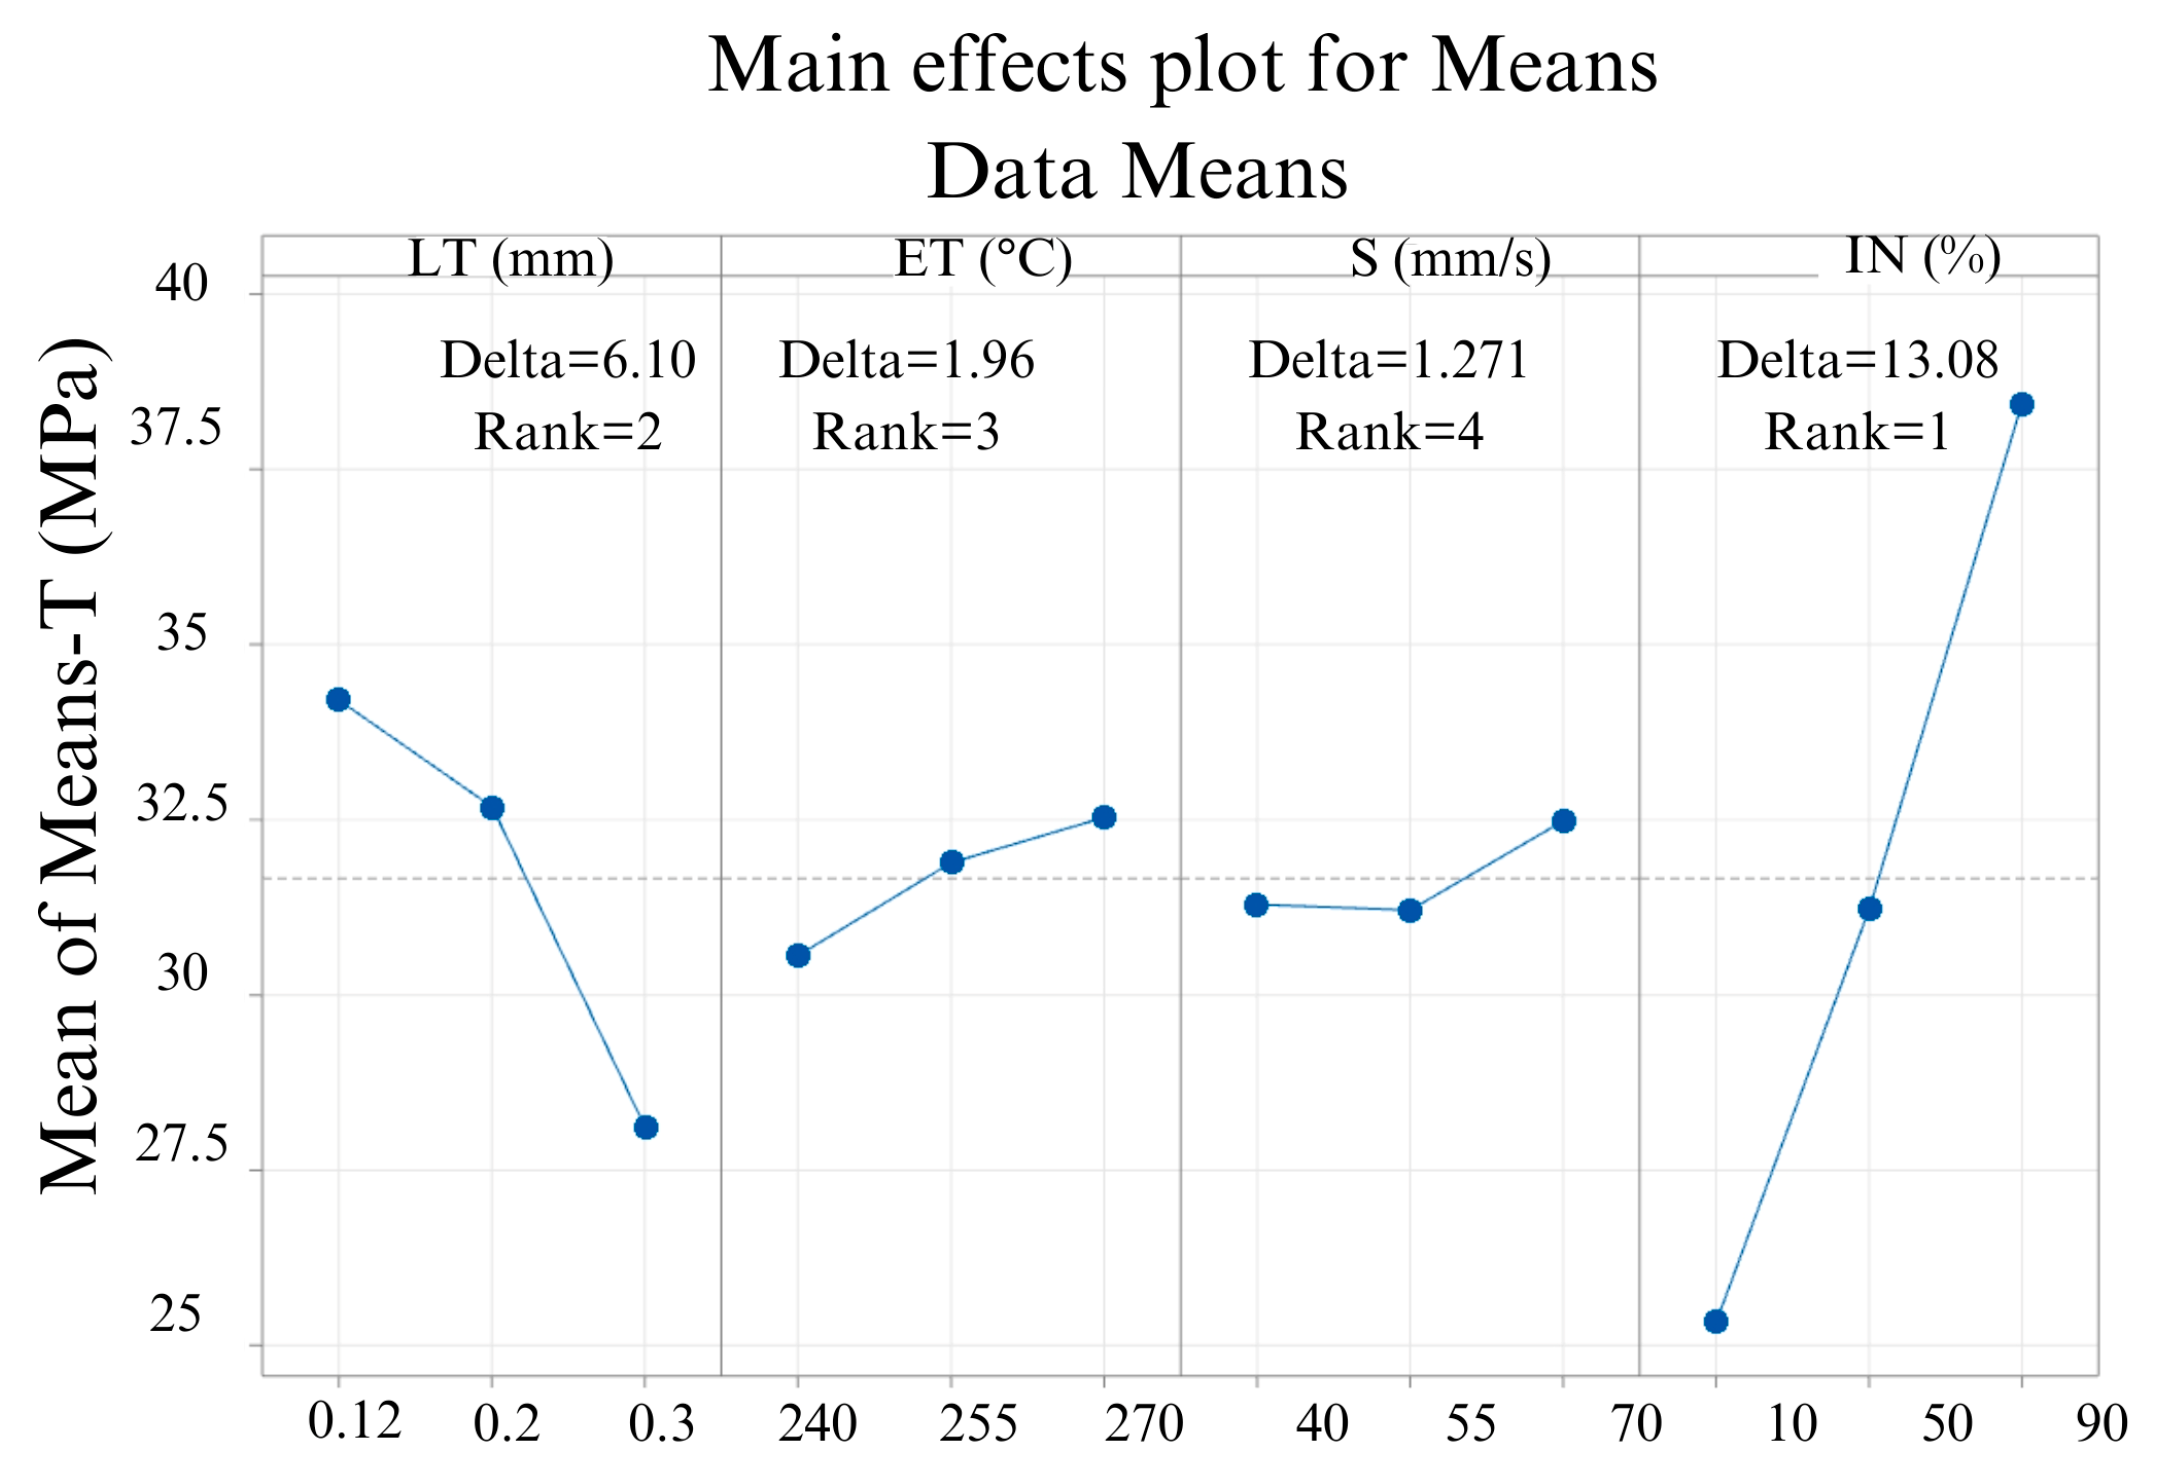
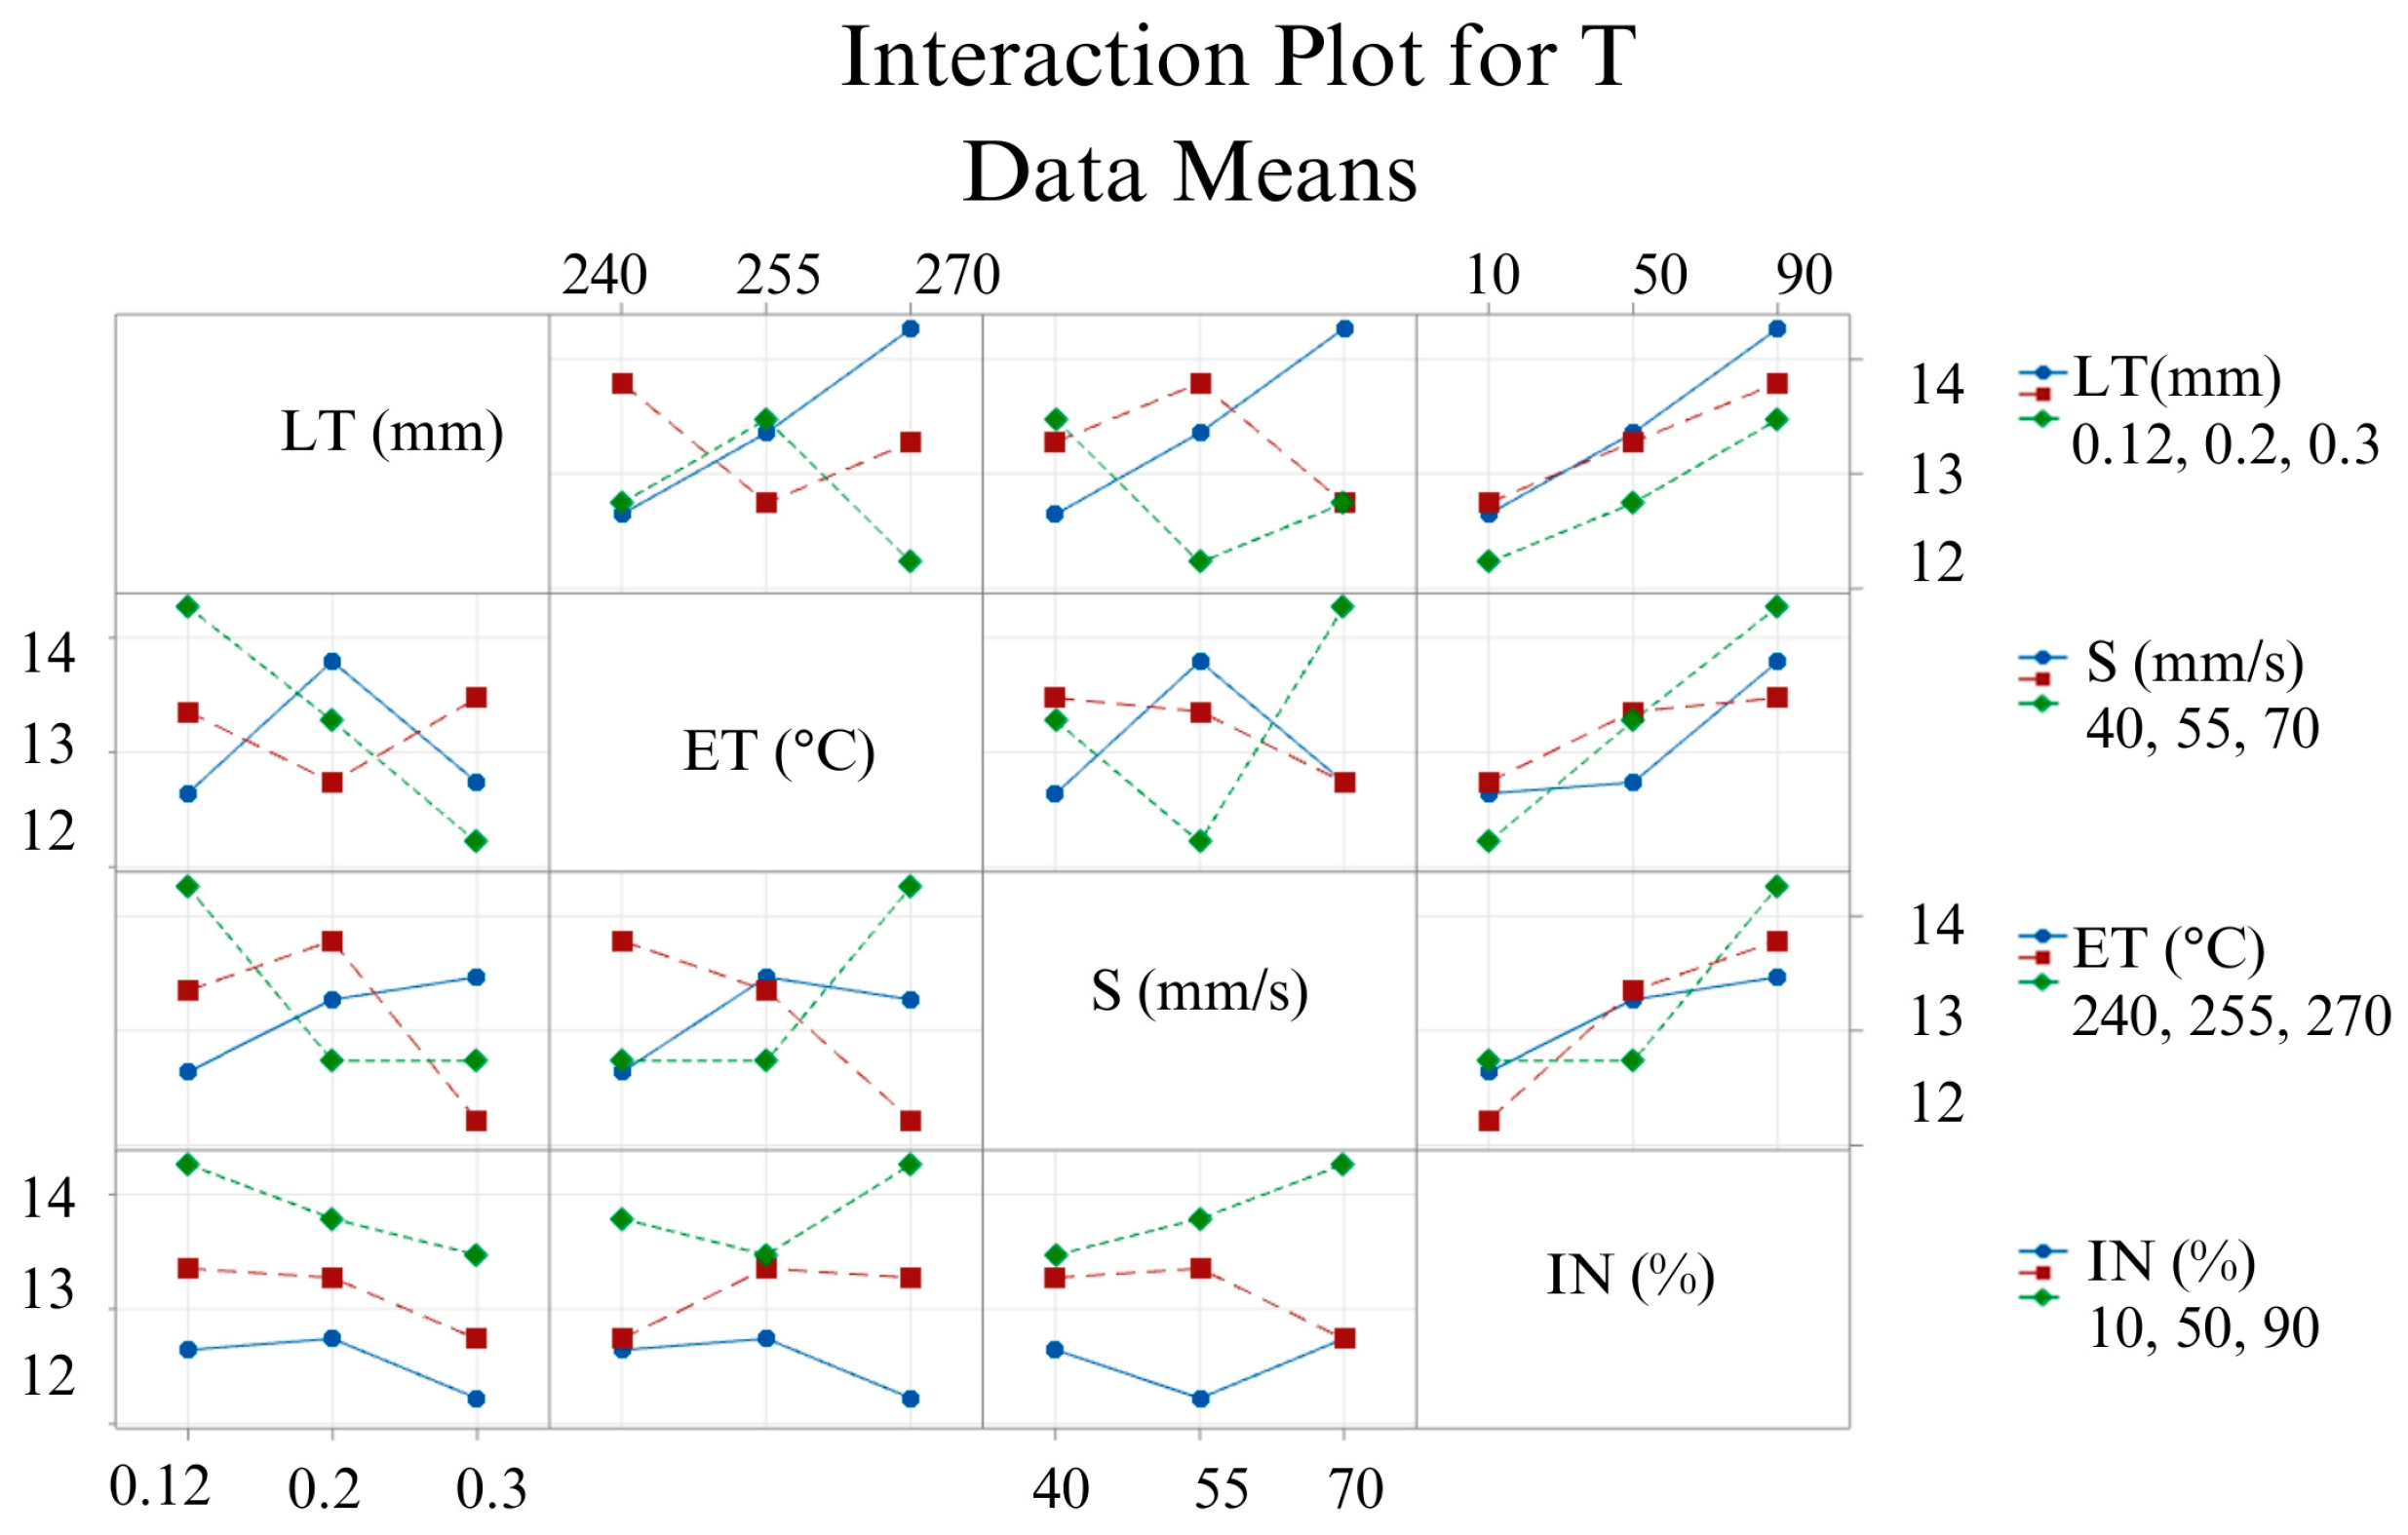
3.4. Effects of the 3D Printing Parameters on Tensile Strength (T)
3.5. Optimal Parameters for Ra, Rq, PT, PE, and T Selection
3.6. Validation Test
4. ANOVA for Ra, Rq, PT and PE
5. Mathematical Modeling
6. Conclusions and Future Directions
- The optimal settings for 3D printing of Nylon-6 (PA6) using fused filament fabrication (FFF) were determined through a comprehensive study that analyzed the average surface roughness (Ra), root mean squared surface roughness (Rq), print time (PT), print energy (PE), and tensile strength (T).
- Through the application of Taguchi analysis via the S/N ratio, significant reductions in Ra, Rq, PT, and PE were achieved. The optimal values obtained were Ra of 10.58 µm, Rq of 13.3 µm, PT of 23 min, PE of 0.13 kWh, and T of 42.7 MPa.
- An analysis of variance (ANOVA) was utilized to understand the influence of the aforementioned parameters on surface roughness, print time, and print energy.
- Modeling based on the investigational results was also developed, which is expected to facilitate predicting the best printing conditions without the necessity for time-consuming trial tests.
- The study lays the foundation for future research and the practical implementation of these optimized parameters in the 3D printing of PA6 using FFF, promising surface finishes, and sustainability improvements.
Future Recommendations
- More PA6 parameters need to be studied, and then those values can be used to create useful industrial models.
- Determine PA-6’s mechanical characteristics by subjecting it to flexural testing.
- Reduce the surface’s roughness by employing various optimization strategies, such as the response surface methodology.
Author Contributions
Funding
Data Availability Statement
Acknowledgments
Conflicts of Interest
Appendix A

| Level | LT (mm) | S (mm/s) | ET (°C) | IN |
|---|---|---|---|---|
| 1 | −21.19 | −21.80 | −21.56 | −22.05 |
| 2 | −21.86 | −21.77 | −21.85 | −21.90 |
| 3 | −22.51 | −21.98 | −22.15 | −21.61 |
| Delta | 1.31 | 0.21 | 0.59 | 0.44 |
| Rank | 1 | 4 | 2 | 3 |
| Level | LT (mm) | S (mm/s) | ET (°C) | IN |
|---|---|---|---|---|
| 1 | −23.17 | −23.76 | −23.54 | −24.04 |
| 2 | −23.81 | −23.75 | −23.81 | −23.84 |
| 3 | −24.48 | −23.96 | −24.12 | −23.58 |
| Delta | 1.31 | 0.21 | 0.59 | 0.46 |
| Rank | 1 | 4 | 2 | 3 |
| Level | LT (mm) | S (mm/s) | ET (°C) | IN |
|---|---|---|---|---|
| 1 | −35.46 | −32.21 | −33.63 | −30.94 |
| 2 | −32.04 | −32.16 | −32.26 | −32.51 |
| 3 | −29.47 | −32.60 | −31.08 | −33.53 |
| Delta | 5.99 | 0.44 | 2.55 | 2.59 |
| Rank | 1 | 4 | 3 | 2 |
| Level | LT (mm) | S (mm/s) | ET (°C) | IN |
|---|---|---|---|---|
| 1 | 9.220 | 12.462 | 11.045 | 13.742 |
| 2 | 12.639 | 12.517 | 12.411 | 12.168 |
| 3 | 15.189 | 12.069 | 13.592 | 11.138 |
| Delta | 5.969 | 0.449 | 2.547 | 2.605 |
| Rank | 1 | 4 | 3 | 2 |
| Level | LT (mm) | S (mm/s) | ET (°C) | IN |
|---|---|---|---|---|
| 1 | 30.52 | 29.59 | 29.85 | 28.04 |
| 2 | 30.21 | 30.03 | 29.67 | 29.85 |
| 3 | 28.83 | 29.94 | 30.04 | 31.66 |
| Delta | 1.69 | 0.44 | 0.37 | 3.62 |
| Rank | 2 | 3 | 4 | 1 |
| Preliminary Parameters | Optimum Parameters | |||
|---|---|---|---|---|
| Predicted | Experimented | Predicted | Experiment | |
| Level | LT-S2 ET-S2 S-S2 IN-S2 | LT-S2 ET-S2 S-S2 IN-S2 | LT-S1 ET-S2 S-S1 IN-S3 | LT-S1 ET-S2 S-S1 IN-S3 |
| Ra (um) | 12.35 | 10.58 | ||
| Rq (um) | 15.51 | 13.30 | ||
| S/N ratio (dB) (Ra (um)) | −21.82 | −21.61 | −20.57 | −20.62 |
| S/N ratio (dB) (Rq (um)) | −23.74 | −23.81 | −22.57 | −22.63 |
| S/N ratio (dB) improvement for Ra (um) | 1.25dB | |||
| S/N ratio (dB) improvement for Rq (um) | 1.27dB | |||
| Percentage Reduction in Ra | 14.35 | |||
| % Reduction in Rq | 14.25 | |||
| Preliminary Parameters | Optimum Parameters | |||
|---|---|---|---|---|
| Predicted | Experimented | Predicted | Experiment | |
| Level | LT-S2 ET-S2 S-S2 IN-S2 | LT-S2 ET-S2 S-S2 IN-S2 | LT-S3 ET-S2 S-S3 IN-S1 | LT-S3 ET-S2 S-S3 IN-S1 |
| PT (min) | 40 | 23 | ||
| PE (kWh) | 0.234 | 0.13 | ||
| S/N ratio (dB) for PT (min) | −31.99 | −31.90 | −26.67 | −28.80 |
| S/N ratio (dB) for PE (kWh) | 12.68 | 12.70 | 17.99 | −16.9 |
| S/N ratio (dB) improvement for PT | 5.32 | |||
| S/N ratio (dB) improvement for PE | 5.31 | |||
| % Reduction in PT | 42.5 | |||
| % Reduction in PE | 44.4 | |||
| Preliminary Parameters | Optimum Parameters | |||
|---|---|---|---|---|
| Predicted | Experimented | Predicted | Experiment | |
| Level | LT-S2 ET-S2 S-S2 IN-S2 | LT-S2 ET-S2 S-S2 IN-S2 | LT-S1 ET-S2 S-S3 IN-S3 | LT-S1 ET-S2 S-S3 IN-S3 |
| T (MPa) | 32.2 | 42.7 | ||
| S/N ratio (dB) for T (MPa) | 30.25 | 30.34 | 32.68 | 32.69 |
| S/N ratio (dB) improvement for T (MPa) | 2.35 | |||
| % increment in T | 32.6 | |||
References
- Kumbhar, N.N.; Mulay, A.V. Post Processing Methods Used to Improve Surface Finish of Products Which Are Manufactured by Additive Manufacturing Technologies: A Review. J. Inst. Eng. (India) Ser. C 2018, 99, 481–487. [Google Scholar] [CrossRef]
- Soares, J.B.; Finamor, J.; Silva, F.P.; Roldo, L.; Cândido, L.H. Analysis of the Influence of Polylactic Acid (PLA) Colour on FDM 3D Printing Temperature and Part Finishing. Rapid Prototyp. J. 2018, 24, 1305–1316. [Google Scholar] [CrossRef]
- Li, H.; Wang, T.; Sun, J.; Yu, Z. The Effect of Process Parameters in Fused Deposition Modelling on Bonding Degree and Mechanical Properties. Rapid Prototyp. J. 2018, 24, 80–92. [Google Scholar] [CrossRef]
- Rehman, A.U.; Karakas, B.; Mahmood, M.A.; Bas, B.; Rehman, R.; Kirac, M.; Khraisheh, M.; Salamci, M.; Ünal, R. Additive Manufacturing of Inconel-625: From Powder Production to Bulk Samples Printing. Rapid Prototyp. J. 2023. [Google Scholar] [CrossRef]
- Rehman, A.U.; Ullah, A.; Liu, T.; Rehman, R.; Salamci, M. Corrigendum: Additive Manufacturing of Al2O3 Ceramics with MgO/SiC Contents by Laser Powder Bed Fusion Process. Front. Chem. 2023, 11, 1034473. [Google Scholar] [CrossRef]
- Crump, S.S. Fused Deposition Modeling (FDM): Putting Rapid Back into Prototyping. In Proceedings of the 2nd International Conference on Rapid Prototyping, Dayton, OH, USA, 11–13 June 1991; pp. 354–357. [Google Scholar]
- Wang, Y.; Müller, W.-D.; Rumjahn, A.; Schwitalla, A. Parameters Influencing the Outcome of Additive Manufacturing of Tiny Medical Devices Based on PEEK. Materials 2020, 13, 466. [Google Scholar] [CrossRef]
- Choong, Y.Y.C.; Tan, H.W.; Patel, D.C.; Choong, W.T.N.; Chen, C.-H.; Low, H.Y.; Tan, M.J.; Patel, C.D.; Chua, C.K. The Global Rise of 3D Printing during the COVID-19 Pandemic. Nat. Rev. Mater. 2020, 5, 637–639. [Google Scholar] [CrossRef]
- Pramanik, D.; Mandal, A.; Kuar, A.S. An Experimental Investigation on Improvement of Surface Roughness of ABS on Fused Deposition Modelling Process. Mater. Today Proc. 2019, 26, 860–863. [Google Scholar] [CrossRef]
- Jin, S.J.; Jeong, I.D.; Kim, J.H.; Kim, W.C. Accuracy (Trueness and Precision) of Dental Models Fabricated Using Additive Manufacturing Methods. Int. J. Comput. Dent. 2018, 21, 107–113. [Google Scholar]
- Shakor, P.; Nejadi, S.; Paul, G.; Sanjayan, J. A Novel Methodology of Powder-Based Cementitious Materials in 3D Inkjet Printing for Construction Applications. In Proceedings of the Sixth International Conference on Durability of Concrete Structures, Leeds, UK, 18–20 July 2018. [Google Scholar]
- Deng, Y.; Lv, J.; Huang, D.; Du, S. Combining the Theoretical Bound and Deep Adversarial Network for Machinery Open-Set Diagnosis Transfer. Neurocomputing 2023, 548, 126391. [Google Scholar] [CrossRef]
- Yu, H.; Zhang, J.; Fang, M.; Ma, T.; Wang, B.; Zhang, Z.; Hu, Z.; Li, H.; Cao, X.; Ding, C. Bio-Inspired Strip-Shaped Composite Composed of Glass Fabric and Waste Selvedge from A. Pernyi Silk for Lightweight and High-Impact Applications. Compos. Part A Appl. Sci. Manuf. 2023, 174, 107715. [Google Scholar] [CrossRef]
- Srivastava, M.; Rathee, S. Optimisation of FDM Process Parameters by Taguchi Method for Imparting Customised Properties to Components. Virtual Phys. Prototyp. 2018, 13, 203–210. [Google Scholar] [CrossRef]
- Bai, X.; Shi, H.; Zhang, K.; Zhang, X.; Wu, Y. Effect of the Fit Clearance between Ceramic Outer Ring and Steel Pedestal on the Sound Radiation of Full Ceramic Ball Bearing System. J. Sound. Vib. 2022, 529, 116967. [Google Scholar] [CrossRef]
- He, J.-C.; Zhu, S.-P.; Luo, C.; Niu, X.; Wang, Q. Size Effect in Fatigue Modelling of Defective Materials: Application of the Calibrated Weakest-Link Theory. Int. J. Fatigue 2022, 165, 107213. [Google Scholar] [CrossRef]
- Ntousia, M.; Fudos, I. 3D Printing Technologies & Applications: An Overview. In Proceedings of the CAD 2019 Conference, Singapore, 24–26 June 2019. [Google Scholar]
- Samykano, M.; Selvamani, S.K.; Kadirgama, K.; Ngui, W.K.; Kanagaraj, G.; Sudhakar, K. Mechanical Property of FDM Printed ABS: Influence of Printing Parameters. Int. J. Adv. Manuf. Technol. 2019, 102, 2779–2796. [Google Scholar] [CrossRef]
- Mohamed, O.A.; Masood, S.H.; Bhowmik, J.L. Investigation on the Flexural Creep Stiffness Behavior of PC-ABS Material Processed by Fused Deposition Modeling Using Response Surface Definitive Screening Design. JOM 2017, 69, 498–505. [Google Scholar] [CrossRef]
- Gautam, R.; Idapalapati, S.; Feih, S. Printing and Characterisation of Kagome Lattice Structures by Fused Deposition Modelling. Mater. Des. 2018, 137, 266–275. [Google Scholar] [CrossRef]
- Zhang, H.; Zhu, X.; Tai, Y.; Zhou, J.; Li, H.; Li, Z.; Wang, R.; Zhang, J.; Zhang, Y.; Ge, W. Recent Advances in Nanofiber-Based Flexible Transparent Electrodes. Int. J. Extrem. Manuf. 2023, 5, 032005. [Google Scholar] [CrossRef]
- Zhu, X.; Liu, M.; Qi, X.; Li, H.; Zhang, Y.; Li, Z.; Peng, Z.; Yang, J.; Qian, L.; Xu, Q. Templateless, Plating-free Fabrication of Flexible Transparent Electrodes with Embedded Silver Mesh by Electric-field-driven Microscale 3D Printing and Hybrid Hot Embossing. Adv. Mater. 2021, 33, 2007772. [Google Scholar] [CrossRef]
- Su, Z.; Meng, J.; Su, Y. Application of SiO2 Nanocomposite Ferroelectric Material in Preparation of Trampoline Net for Physical Exercise. Adv. Nano Res. 2023, 14, 355–362. [Google Scholar]
- Larrañeta, E.; Dominguez-Robles, J.; Lamprou, D.A. Additive Manufacturing Can Assist in the Fight against COVID-19 and Other Pandemics and Impact on the Global Supply Chain. 3D Print. Addit. Manuf. 2020, 7, 100–103. [Google Scholar] [CrossRef] [PubMed]
- Bakar, N.S.A.; Alkahari, M.R.; Boejang, H. Analysis on Fused Deposition Modelling Performance. J. Zhejiang Univ. Sci. A 2010, 11, 972–977. [Google Scholar] [CrossRef]
- Ahn, D.; Kweon, J.-H.; Kwon, S.; Song, J.; Lee, S. Representation of Surface Roughness in Fused Deposition Modeling. J. Mater. Process Technol. 2009, 209, 5593–5600. [Google Scholar] [CrossRef]
- Nancharaiah, T. Optimization of Process Parameters in FDM Process Using Design of Optimization of Process Parameters in FDM Process Using Design of Experiments. Int. J. Emerg. Technol. 2011, 2, 100–102. [Google Scholar]
- Akande, S.O. Dimensional Accuracy and Surface Finish Optimization of Fused Deposition Modelling Parts Using Desirability Function Analysis. Int. J. Eng. Res. 2015, V4, 196–202. [Google Scholar] [CrossRef]
- Nuñez, P.J.; Rivas, A.; García-Plaza, E.; Beamud, E.; Sanz-Lobera, A. Dimensional and Surface Texture Characterization in Fused Deposition Modelling (FDM) with ABS Plus. Procedia Eng. 2015, 132, 856–863. [Google Scholar] [CrossRef]
- Alsoufi, M.S.; Elsayed, A.E. Surface Roughness Quality and Dimensional Accuracy—A Comprehensive Analysis of 100% Infill Printed Parts Fabricated by a Personal/Desktop Cost-Effective FDM 3D Printer. Mater. Sci. Appl. 2018, 9, 11–40. [Google Scholar] [CrossRef]
- Perez, M.; Medina-Sanchez, G.; Garcia-Collado, A.; Gupta, M.; Carou, D. Surface Quality Enhancement of Fused Deposition Modeling (FDM) Printed Samples Based on the Selection of Critical Printing Parameters. Materials 2018, 11, 1382. [Google Scholar] [CrossRef] [PubMed]
- Kuo, C.C.; Wu, Y.R.; Li, M.H.; Wu, H.W. Minimizing Warpage of ABS Prototypes Built with Low-Cost Fused Deposition Modeling Machine Using Developed Closed-Chamber and Optimal Process Parameters. Int. J. Adv. Manuf. Technol. 2019, 101, 593–602. [Google Scholar] [CrossRef]
- Gao, X.; Zhang, D.; Wen, X.; Qi, S.; Su, Y.; Dong, X. Fused Deposition Modeling with Polyamide 1012. Rapid Prototyp. J. 2019, 25, 1145–1154. [Google Scholar] [CrossRef]
- Vyavahare, S.; Kumar, S.; Panghal, D. Experimental Study of Surface Roughness, Dimensional Accuracy and Time of Fabrication of Parts Produced by Fused Deposition Modelling. Rapid Prototyp. J. 2020, 26, 1535–1554. [Google Scholar] [CrossRef]
- Asiltürk, İ.; Neşeli, S.; İnce, M.A. Optimisation of Parameters Affecting Surface Roughness of Co28Cr6Mo Medical Material during CNC Lathe Machining by Using the Taguchi and RSM Methods. Measurement 2016, 78, 120–128. [Google Scholar] [CrossRef]
- Li, C.; Xiao, Q.; Tang, Y.; Li, L. A Method Integrating Taguchi, RSM and MOPSO to CNC Machining Parameters Optimization for Energy Saving. J. Clean. Prod. 2016, 135, 263–275. [Google Scholar] [CrossRef]
- Song, H.; Dan, J.; Li, J.; Du, J.; Xiao, J.; Xu, J. Experimental Study on the Cutting Force during Laser-Assisted Machining of Fused Silica Based on the Taguchi Method and Response Surface Methodology. J. Manuf. Process 2019, 38, 9–20. [Google Scholar] [CrossRef]
- Hu, Z.; He, G.; Zhang, X.; Huang, T.; Li, H.; Zhang, Y.; Xie, D.; Song, X.; Ning, X.; Ning, F. Impact Behavior of Nylon Kernmantle Ropes for High-Altitude Fall Protection. J. Eng. Fiber Fabr. 2023, 18, 15589250231167400. [Google Scholar] [CrossRef]
- Niu, X.; Zhu, S.-P.; He, J.-C.; Liao, D.; Correia, J.A.F.O.; Berto, F.; Wang, Q. Defect Tolerant Fatigue Assessment of AM Materials: Size Effect and Probabilistic Prospects. Int. J. Fatigue 2022, 160, 106884. [Google Scholar] [CrossRef]
- Pavan, C.; Sateesh, N.; Subbiah, R. Taguchi Analysis on Machinability of Inconel 600 Using Copper, Brass, and Copper Tungsten Electrodes in EDM. Mater. Today Proc. 2021, 46, 9281–9286. [Google Scholar] [CrossRef]
- Suthar, J.; Teli, S.N.; Murumkar, A. Drilling Process Improvement by Taguchi Method. Mater. Today Proc. 2021, 47, 2814–2819. [Google Scholar] [CrossRef]
- Wang, J.; Liang, F.; Zhou, H.; Yang, M.; Wang, Q. Analysis of Position, Pose and Force Decoupling Characteristics of a 4-UPS/1-RPS Parallel Grinding Robot. Symmetry 2022, 14, 825. [Google Scholar] [CrossRef]
- Tian, L.-M.; Jin, B.-B.; Li, L. Axial Compressive Mechanical Behaviors of a Double-Layer Member. J. Struct. Eng. 2023, 149, 4023110. [Google Scholar] [CrossRef]
- Liao, D.; Zhu, S.-P.; Keshtegar, B.; Qian, G.; Wang, Q. Probabilistic Framework for Fatigue Life Assessment of Notched Components under Size Effects. Int. J. Mech. Sci. 2020, 181, 105685. [Google Scholar] [CrossRef]
- Narang, R.; Chhabra, D. Analysis of Process Parameters of Fused Deposition Modeling (FDM) Technique. Int. J. Future Revolut. Comput. Sci. Commun. Eng. IJFRCSCE 2017, 3, 41–48. [Google Scholar]
- Hashmi, A.W.; Mali, H.S.; Meena, A. The Surface Quality Improvement Methods for FDM Printed Parts: A Review; Springer International Publishing: Berlin/Heidelberg, Germany, 2021; ISBN 9783030680244. [Google Scholar]
- Srivastava, A.; Bhaskar, J. Experimental Investigations of Printing Parameters of Fused Deposition Modeling-Based 3D Printers for Average Surface Roughness; Springer: Singapore, 2020; ISBN 9789813294332. [Google Scholar]
- Alvarez, K.L.; Lagos, R.; Aizpun, M. Investigating the Influence of Infill Percentage on the Mechanical Properties of Fused Deposition Modelled ABS Parts. Ing. E Investig. 2016, 36, 110–116. [Google Scholar] [CrossRef]
- Mohamed, O.A.; Masood, S.H.; Bhowmik, J.L. Optimization of Fused Deposition Modeling Process Parameters: A Review of Current Research and Future Prospects. Adv. Manuf. 2015, 3, 42–53. [Google Scholar] [CrossRef]
- Lalegani Dezaki, M.; Ariffin, M.K.A.M.; Serjouei, A.; Zolfagharian, A.; Hatami, S.; Bodaghi, M. Influence of Infill Patterns Generated by CAD and FDM 3D Printer on Surface Roughness and Tensile Strength Properties. Appl. Sci. 2021, 11, 7272. [Google Scholar] [CrossRef]
- Dezaki, M.L.; Mohd Ariffin, M.K.A. The Effects of Combined Infill Patterns on Mechanical Properties in Fdm Process. Polymer 2020, 12, 2792. [Google Scholar] [CrossRef] [PubMed]
- Dey, A.; Yodo, N. A Systematic Survey of FDM Process Parameter Optimization and Their Influence on Part Characteristics. J. Manuf. Mater. Process. 2019, 3, 64. [Google Scholar] [CrossRef]
- Singh, R.; Kumar, R.; Mascolo, I.; Modano, M. On the Applicability of Composite PA6-TiO2 Filaments for the Rapid Prototyping of Innovative Materials and Structures. Compos. Part. B-Eng. 2018, 143, 132–140. [Google Scholar] [CrossRef]
- Sahay, C.; Ghosh, S. Understanding Surface Quality: Beyond Average Roughness (Ra). In Proceedings of the 2018 ASEE Annual Conference & Exposition, Salt Lake City, UT, USA, 23–27 June 2018. [Google Scholar] [CrossRef]
- Teir, L.; Lindstedt, T.; Widmaier, T.; Hemming, B.; Brand, U.; Fahrbach, M.; Peiner, E.; Lassila, A. In-Line Measurement of the Surface Texture of Rolls Using Long Slender Piezoresistive Microprobes. Sensors 2021, 21, 5955. [Google Scholar] [CrossRef]
- Sakthivel Murugan, R.; Vinodh, S. Parametric Optimization of Fused Deposition Modelling Process Using Grey Based Taguchi and TOPSIS Methods for an Automotive Component. Rapid Prototyp. J. 2021, 27, 155–175. [Google Scholar] [CrossRef]
- Taguchi, G.; Chowdhury, S.; Wu, Y. Taguchi’s Quality Engineering Handbook; Wiley: Hoboken, NJ, USA, 2007. [Google Scholar]
- Kechagias, J.D.; Zaoutsos, S.P. Optimising Fused Filament Fabrication Surface Roughness for a Dental Implant. Mater. Manuf. Process. 2023, 38, 954–959. [Google Scholar] [CrossRef]
- de Toro, E.V.; Sobrino, J.C.; Martinez, A.M.; Eguia, V.M.; Perez, J.A. Investigation of a Short Carbon Fibre-Reinforced Polyamide and Comparison of Two Manufacturing Processes: Fused Deposition Modelling (FDM) and Polymer Injection Moulding (PIM). Materials 2020, 13, 672. [Google Scholar] [CrossRef] [PubMed]
- Singh, R.; Garg, H.K. Fused Deposition Modeling—A State of Art Review and Future Applications; Elsevier Ltd.: Amsterdam, The Netherlands, 2016; ISBN 9780128035818. [Google Scholar]
- Padovano, E.; Galfione, M.; Concialdi, P.; Lucco, G.; Badini, C. Mechanical and Thermal Behavior of Ultem® 9085 Fabricated by Fused-Deposition Modeling. Appl. Sci. 2020, 10, 3170. [Google Scholar] [CrossRef]
- Kechagias, J.; Chaidas, D.; Vidakis, N.; Salonitis, K.; Vaxevanidis, N.M. Key Parameters Controlling Surface Quality and Dimensional Accuracy: A Critical Review of FFF Process. Mater. Manuf. Process. 2022, 37, 963–984. [Google Scholar] [CrossRef]
- Vidakis, N.; Petousis, M.; Mountakis, N.; Moutsopoulou, A.; Karapidakis, E. Energy Consumption vs. Tensile Strength of Poly[Methyl Methacrylate] in Material Extrusion 3D Printing: The Impact of Six Control Settings. Polymers 2023, 15, 845. [Google Scholar] [CrossRef]
- Kechagias, J.D.; Vidakis, N.; Petousis, M. Parameter Effects and Process Modeling of FFF-TPU Mechanical Response. Mater. Manuf. Process. 2021, 38, 341–351. [Google Scholar] [CrossRef]
- Vidakis, N.; Kechagias, J.D.; Petousis, M.; Vakouftsi, F.; Mountakis, N. The Effects of FFF 3D Printing Parameters on Energy Consumption. Mater. Manuf. Process. 2023, 38, 915–932. [Google Scholar] [CrossRef]
- Sivaiah, P.; Chakradhar, D. Modeling and Optimization of Sustainable Manufacturing Process in Machining of 17-4 PH Stainless Steel. Measurement 2019, 134, 142–152. [Google Scholar] [CrossRef]
- Wu, D.Z.; Wei, Y.P.; Terpenny, J. Predictive Modelling of Surface Roughness in Fused Deposition Modelling Using Data Fusion. Int. J. Prod. Res. 2019, 57, 3992–4006. [Google Scholar] [CrossRef]
- Raju, M.; Gupta, M.K.; Bhanot, N.; Sharma, V.S. A Hybrid PSO–BFO Evolutionary Algorithm for Optimization of Fused Deposition Modelling Process Parameters. J. Intell. Manuf. 2019, 30, 2743–2758. [Google Scholar] [CrossRef]
- Khan, M.S.; Mishra, S.B. Minimizing Surface Roughness of ABS-FDM Build Parts: An Experimental Approach. Mater. Today Proc. 2019, 26, 1557–1566. [Google Scholar] [CrossRef]
- Mohamed, O.A.; Masood, S.H.; Bhowmik, J.L. Experimental Investigation for Dynamic Stiffness and Dimensional Accuracy of FDM Manufactured Part Using IV-Optimal Response Surface Design. Rapid Prototyp. J. 2017, 23, 736–749. [Google Scholar] [CrossRef]


| TYPE | Diameter | S mm/sec | ET °C | Bed Temperature °C | Tensile Strength MPa | Flexural Strength MPa |
|---|---|---|---|---|---|---|
| PA6 | 1.75 mm | 40–80 | 240–280 °C | 80–100 °C | 40 | 85 |
| Parameter | Unit | Symbol | Level 1 | Level2 | Level3 |
|---|---|---|---|---|---|
| LT | mm | LT | 0.12 | 0.2 | 0.3 |
| S | mm/s | S | 40 | 55 | 70 |
| ET | °C | ET | 240 | 255 | 270 |
| IN | % | IN | 10 | 50 | 90 |
| LT (mm) | ET (°C) | S (mm/s) | IN (%) | T (MPa) | Ra (μm) | Rq (μm) | PT (min) | PE (kWh) |
|---|---|---|---|---|---|---|---|---|
| 0.12 | 240 | 40 | 10 | 26.42 | 11.28 | 14.20 | 58 | 0.338 |
| 0.12 | 255 | 55 | 50 | 33.54 | 11.43 | 14.29 | 59 | 0.344 |
| 0.12 | 270 | 70 | 90 | 42.66 | 11.71 | 14.74 | 61 | 0.356 |
| 0.20 | 240 | 55 | 90 | 37.9 | 11.97 | 14.96 | 45 | 0.263 |
| 0.20 | 255 | 70 | 10 | 27.41 | 12.98 | 16.33 | 29 | 0.169 |
| 0.20 | 270 | 40 | 50 | 32.74 | 12.22 | 15.28 | 49 | 0.286 |
| 0.30 | 240 | 70 | 50 | 27.39 | 13.81 | 17.26 | 26 | 0.152 |
| 0.30 | 255 | 40 | 90 | 34.72 | 12.43 | 15.64 | 39 | 0.228 |
| 0.30 | 270 | 55 | 10 | 22.2 | 13.85 | 17.41 | 26 | 0.152 |
| Source | DF | Seq SS | Contribution | Adj SS | Adj MS | F-Value | p-Value |
|---|---|---|---|---|---|---|---|
| Regression | 4 | 7.20193 | 98.44% | 7.20193 | 1.80048 | 63.20 | 0.001 |
| LT | 1 | 5.34805 | 73.10% | 5.34805 | 5.34805 | 187.72 | 0.000 |
| ET | 1 | 0.08640 | 1.18% | 0.08640 | 0.08640 | 3.03 | 0.157 |
| S | 1 | 1.10082 | 15.05% | 1.10082 | 1.10082 | 38.64 | 0.003 |
| IN | 1 | 0.66667 | 9.11% | 0.66667 | 0.66667 | 23.40 | 0.008 |
| Error | 4 | 0.11396 | 1.56% | 0.11396 | 0.02849 | ||
| Total | 8 | 7.31589 | 100.00% |
| Source | DF | Seq SS | Contribution | Adj SS | Adj MS | F-Value | p-Value |
|---|---|---|---|---|---|---|---|
| Regression | 4 | 11.3691 | 98.99% | 11.3691 | 2.84226 | 98.43 | 0.000 |
| LT | 1 | 8.3550 | 72.75% | 8.3550 | 8.35502 | 289.34 | 0.000 |
| ET | 1 | 0.1700 | 1.48% | 0.1700 | 0.17002 | 5.89 | 0.072 |
| S | 1 | 1.7174 | 14.95% | 1.7174 | 1.71735 | 59.47 | 0.002 |
| IN | 1 | 1.1267 | 9.81% | 1.1267 | 1.12667 | 39.02 | 0.003 |
| Error | 4 | 0.1155 | 1.01% | 0.1155 | 0.02888 | ||
| Total | 8 | 11.4846 | 100.00% |
| Source | DF | Seq SS | Contribution | Adj SS | Adj MS | F-Value | p-Value |
|---|---|---|---|---|---|---|---|
| Regression | 4 | 1560.68 | 95.62% | 1560.68 | 390.17 | 21.82 | 0.006 |
| LT | 1 | 1231.85 | 75.47% | 1231.85 | 1231.85 | 68.88 | 0.001 |
| ET | 1 | 8.17 | 0.50% | 8.17 | 8.17 | 0.46 | 0.536 |
| S | 1 | 150.00 | 9.19% | 150.00 | 150.00 | 8.39 | 0.044 |
| IN | 1 | 170.67 | 10.46% | 170.67 | 170.67 | 9.54 | 0.037 |
| Error | 4 | 71.54 | 4.38% | 71.54 | 17.89 | ||
| Total | 8 | 1632.22 | 100.00% |
| Source | DF | Seq SS | Contribution | Adj SS | Adj MS | F-Value | p-Value |
|---|---|---|---|---|---|---|---|
| Regression | 4 | 0.052943 | 95.61% | 0.052943 | 0.013236 | 21.78 | 0.006 |
| LT | 1 | 0.041668 | 75.25% | 0.041668 | 0.041668 | 68.58 | 0.001 |
| ET | 1 | 0.000280 | 0.51% | 0.000280 | 0.000280 | 0.46 | 0.534 |
| S | 1 | 0.005104 | 9.22% | 0.005104 | 0.005104 | 8.40 | 0.044 |
| IN | 1 | 0.005891 | 10.64% | 0.005891 | 0.005891 | 9.70 | 0.036 |
| Error | 4 | 0.002430 | 4.39% | 0.002430 | 0.000608 | ||
| Total | 8 | 0.055374 | 100.00% |
| Source | DF | Seq SS | Contribution | Adj SS | Adj MS | F-Value | p-Value |
|---|---|---|---|---|---|---|---|
| Regression | 4 | 322.409 | 98.52% | 322.409 | 80.602 | 66.65 | 0.001 |
| LT | 1 | 57.731 | 17.64% | 57.731 | 57.731 | 47.74 | 0.002 |
| ET | 1 | 5.782 | 1.77% | 5.782 | 5.782 | 4.78 | 0.094 |
| S | 1 | 2.136 | 0.65% | 2.136 | 2.136 | 1.77 | 0.255 |
| IN | 1 | 256.76 | 78.46% | 256.76 | 256.76 | 212.31 | 0 |
| Error | 4 | 4.837 | 1.48% | 4.837 | 1.209 | ||
| Total | 8 | 327.246 | 100.00% |
| Run | Experimented | Predicted | Difference | ||||||||||||
|---|---|---|---|---|---|---|---|---|---|---|---|---|---|---|---|
| Ra | Rq | PT | PE | T | Ra | Rq- | PT | PE | T | Ra | Rq | PT | PE | T | |
| 2 | 11.43 | 14.29 | 59 | 0.344 | 33.54 | 11.50 | 14.43 | 57.33 | 0.334 | 34.64 | −0.07 | −0.14 | +1.67 | −0.01 | +1.1 |
| 4 | 11.97 | 14.96 | 45 | 0.263 | 37.90 | 11.89 | 14.88 | 48.78 | 0.285 | 37.45 | −0.08 | −0.08 | +3.78 | −0.02 | +0.4 |
| 6 | 12.22 | 15.28 | 49 | 0.286 | 32.74 | 12.03 | 15.11 | 50.78 | 0.296 | 32.27 | −0.19 | −0.17 | +1.78 | −0.01 | +0.46 |
| 8 | 12.43 | 15.64 | 39 | 0.228 | 34.72 | 12.62 | 15.82 | 39.06 | 0.228 | 34.39 | −0.19 | −0.18 | +0.06 | 0.00 | +0.32 |
Disclaimer/Publisher’s Note: The statements, opinions and data contained in all publications are solely those of the individual author(s) and contributor(s) and not of MDPI and/or the editor(s). MDPI and/or the editor(s) disclaim responsibility for any injury to people or property resulting from any ideas, methods, instructions or products referred to in the content. |
© 2023 by the authors. Licensee MDPI, Basel, Switzerland. This article is an open access article distributed under the terms and conditions of the Creative Commons Attribution (CC BY) license (https://creativecommons.org/licenses/by/4.0/).
Share and Cite
Mushtaq, R.T.; Alkahtani, M.; Khan, A.M.; Abidi, M.H. Advancements in 3D-Printed Novel Nylon-6: A Taguchi Method for Surface Quality Sustainability and Mechanical Properties. Machines 2023, 11, 885. https://doi.org/10.3390/machines11090885
Mushtaq RT, Alkahtani M, Khan AM, Abidi MH. Advancements in 3D-Printed Novel Nylon-6: A Taguchi Method for Surface Quality Sustainability and Mechanical Properties. Machines. 2023; 11(9):885. https://doi.org/10.3390/machines11090885
Chicago/Turabian StyleMushtaq, Ray Tahir, Mohammed Alkahtani, Aqib Mashood Khan, and Mustufa Haider Abidi. 2023. "Advancements in 3D-Printed Novel Nylon-6: A Taguchi Method for Surface Quality Sustainability and Mechanical Properties" Machines 11, no. 9: 885. https://doi.org/10.3390/machines11090885
APA StyleMushtaq, R. T., Alkahtani, M., Khan, A. M., & Abidi, M. H. (2023). Advancements in 3D-Printed Novel Nylon-6: A Taguchi Method for Surface Quality Sustainability and Mechanical Properties. Machines, 11(9), 885. https://doi.org/10.3390/machines11090885