Abstract
This study presents a comprehensive analysis of the impact of variable inlet guide vanes and physical faults on the performance of a three-shaft gas turbine engine operating at full load. By utilizing the input data provided by the engine manufacturer, the performance models for both the design point and off-design scenarios have been developed. To ensure the accuracy of our models, validation was conducted using the manufacturer’s data. Once the models were successfully validated, various degradation conditions, such as variable inlet guide vane drift, fouling, and erosion, were simulated. Three scenarios that cause gas turbine degradation have been considered and simulated: First, how would the variable inlet guide vane drift affect the gas turbine performance? Second, how would the combined effect of fouling and variable inlet guide vane drift cause the degradation of the engine performance? Third, how would the combined effect of erosion and variable inlet guide vane drift cause the degradation of the engine performance? The results revealed that up-VIGV drift, which is combined fouling and erosion, shows a small deviation because of offsetting the isentropic efficiency drop caused by fouling and erosion. It is clearly observed that fouling affects more upstream components, whereas erosion affects more downstream components. Furthermore, the deviation of performance and output parameters due to the combined faults has been discussed.
1. Introduction
The main source of power for aircraft and industrial systems is the gas turbine. It operates at high pressure, high temperature, high speed, and stress. A gas turbine is a complicated machine involving mechanical, electrical, and hydraulic systems [1,2,3]. Actuator wear, seal wear, blade erosion, blade fouling, blocked fuel nozzles, sensor issues, and domestic object damage are factors that contribute to a decline in gas turbine performance over time [4,5,6]. Due to harsh operating conditions, the performance of a gas turbine steadily declines over time. Anomalous working circumstances must be avoided as soon as possible to reduce the associated increase in energy consumption and environmental damage. Even though the engine is working normally due to its decent inlet filtration system that enables the use of clean air, the parts of the engine flow stream will be eroded, corrosion issues that cause engine deterioration [7]. The use of an efficient condition monitoring technique that can identify, analyse, and predict impending failure conditions and recommend the necessary maintenance measures at the appropriate time is most sought. Energy usage and environmental pollution will be significantly reduced by improving the operational performance of gas turbines. To evaluate the overall performance of a gas turbine and satisfy operational and maintenance requirements, knowledge of the gas turbine’s fundamental state is crucial [8,9]. Several pieces of commercial simulation software have shown to be helpful tools for creating models of certain engine performance models [10]. The software helps to develop both steady-state and transient models using component characteristics and produce matching results. To investigate the performance of both clean and degraded gas turbine engines, the thermodynamic interactive generalized turbine engine model must be created [11,12].
Modern gas turbines include advanced features to achieve improved reliability, availability, and sustainability [13,14,15]. Variable geometry plays a crucial role in enhancing the performance of gas turbines through various features such as variable stator vanes (VSVs), variable inlet guide vanes (VIGV), variable area nozzles (VAN) and variable bleed valves (VBV). These components collectively contribute to improving the overall efficiency and performance of compressors and turbines [16]. Since VIGVs and VSVs are scheduled as a function of spool speed, the nominal angle will be adjusted when the engine experiences a speed fluctuation during startup, shutdown, and load changes [17]. Surging and stalling, which frequently occur at low speeds during startup and shutdown, can always be injurious to the engine’s health and performance [18]. Therefore, stability is ensured, and performance is improved by removing compressor surge phenomena using the VIGVs and bleed control system. Variable geometry mechanism faults, axial compressor fouling, and increasing ambient temperature may also contribute to degradation [19]. Different connections attached to guiding vanes are used as part of an actuation system to regulate the VIGVs [20]. However, VIVGs may have various issues, like drifting beyond the standard functioning range. These issues and faults finally cause an unexpected shutdown due to a surge in the compressor.
Salar et al. [21] identified that low-speed stop, high-speed stop, hydraulic ram leakage, and Rotary variable displacement transducer (RVDT) misalignment are the main causes of VIGV drift. A soft sensor was created to forecast VIGV drift. The defect was located by comparing the deviation between the actual guide vane position from the control panel and the VIGV position provided by the soft sensor. According to Tsalavoutas et al. [22], other factors, such as the wearing of the actuation mechanism linkages and the misalignment or stacking of the vanes because of loosened bolts, caused VIGVs to deviate from their typical schedule. Continuous monitoring is required to make sure that the movement and position of the actuation mechanism are in sync with the actual design schedule to avoid the occurrence of these issues. The vanes of the same compressor stage move synchronously and, in general, have a common drift. To overcome this, an adaptive performance model to identify VIGV problems was proposed by Stamatis et al. [23]. By artificially introducing various VIGV drifts, some researchers have attempted to observe the impact of VIGV drift on gas turbine performance. To investigate the impact of VIGV drift on the performance of the compressor, Cruz-Manzo et al. [24] recently created a MATLAB Simulink-based performance model. A comparison of the difference between the position that the VIGV was intended to be in and the drift position was investigated, and a significant variation has been observed. Additionally, Razak and Dosanjh [25] covered the significance of the condition monitoring system for identifying VIGV drift.
Compressor fouling has an impact on the performance of gas turbines. When sticky particles accumulate on the annulus passage of the compressor, including the rotors and stators, compressor fouling occurs [26]. Ajoko and Tolumoye [27] studied the monitoring of industrial gas turbine performance, which can be affected by fouling, erosion, and other physical faults. The main goal of the study is to forecast an industrial gas turbine’s performance utilizing a data analysis process to check, balance, and monitor the behavior of the gas turbine while it is in operation. According to established facts, this low performance is observed through the drastic drop in the measurable performance parameters, which can be rectified and controlled with ambient temperature by regulating the intake supply air, which is dense and close to the intended specification. Finally, Ajoko and Tolumoye advised that, to avoid and minimize total gas turbine downtime, gas turbine operators must be familiar with such information for early prognosis. R. K. Mishra [6] studied aero gas turbine compressor fouling and corrosion. The conclusion showed that the physical faults have been demonstrated to be well-addressed by compressor washing. The frequency of compressor wash must be carefully calculated from the perspectives of corrosion rate and performance degradation. The research work [28] provides more information on the impact of fouling and erosion on gas turbine performance. To prevent a severe performance decline, adaptive performance models and simulations were conducted to estimate the fouling rate during operation.
As discussed above, researchers have worked on the simulation of gas path faults and gas turbine performance degradation. However, only a few numbers of researchers have studied the performance degradation of all significant gas turbine components. Variable inlet guide vane drift and its combined effect with other physical faults remained unexplored. Therefore, the purpose of this study is to study the effect of variable inlet guide vane drift and its combined effect with fouling and erosion on the three-shaft gas turbine performance at part-load operation. The effects on component isentropic efficiency and output parameters are studied and discussed. During the development of the engine performance model, secondary air or cooling system and variable inlet guide vane scheduling were considered. With the help of engine manufacturer data, the gas turbine design point and off-design performance models have been built using GasTurb 13 and validated. Using the correlation between physical faults and performance parameters, fouling and erosion physical faults were introduced to the healthy engine model. Investigations of the effect of the combined effect of variable inlet guide vane drift with fouling and variable inlet guide vane drift with erosion on performance and output parameters have been conducted. The study focused on a specific type of engine known as a three-shaft gas turbine engine. This engine is composed of six main components that make up the gas path. These components consist of a low-pressure compressor (LPC), high-pressure compressor (HPC), combustion chamber, high-pressure turbine (HPT), low-pressure turbine (HPT) and power turbine (PT). The power turbine is designed with a single shaft, while the gas generator consists of two shafts. Within the gas generator, there are LPC and LPT, as well as HPC and HPT. The LPC is driven by the LPT, while the HPC is driven by the HPT. The power turbine, which is a free axial turbine, consists of two stages. Figure 1 and Figure 2 provide the schematic configuration and exergy flow diagram of the three-shaft gas turbine.
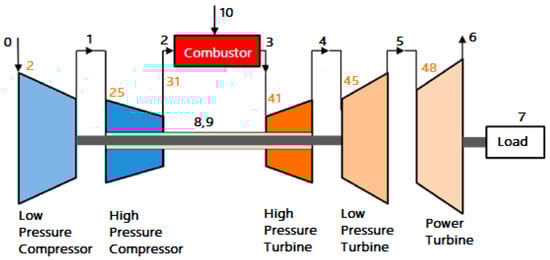
Figure 1.
Configuration of a three-shaft gas turbine.
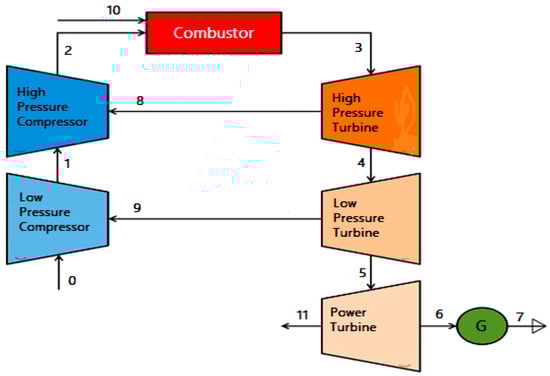
Figure 2.
Exergy flow diagram of three-shaft gas turbine (adapted from [29]).
2. Gas Turbine Performance Model Development
Many researchers have employed various approaches to construct gas turbine performance models. Among these approaches, utilizing the method of evaluating enthalpies and entropies at multiple crucial cycle points has proven to be the most precise means of assessing gas turbine performance [30]. The performance model for gas turbines requires the development of design point and off-design models [31]. The design point model simulates the engine operating at the design load. In off-design performance simulation, the design point is treated as a single operating condition. The overall performance of the actual gas turbine cycle is determined by combining the individual performances of each component of the gas turbine [30,32]. The input data for the development of the design point model were gathered from the technical manuals or catalogue of the manufacturer. To assess the design point and off-design model, the energy balance approach and the iteration and optimization method were used to make the model accurate and verify the produced results [33]. If the model result matches the catalogue data, and then the model is taken as an accurate model in terms of predicting engine performance [34].
2.1. Design Point Performance Modelling
In gas turbine engineering, a design point performance model refers to a mathematical or computational model used to predict the performance characteristics of a gas turbine at its design or rated operating conditions. The design point represents the specific combination of parameters, such as inlet air conditions, fuel flow rate, and rotational speed, at which the gas turbine is designed to operate optimally. It considers various factors that affect the performance of a gas turbine, including thermodynamics, aerodynamics, combustion, and mechanical considerations. It aims to provide a quantitative understanding of the gas turbine’s behavior and performance, such as power output, thermal efficiency, exhaust gas temperature, compressor and turbine efficiencies. In this study, the gas path parameters were determined at design-point calculation. The ambient conditions, component efficiencies, compressor pressure ratio, inlet mass flow rate, air–fuel ratio in the combustion chamber and turbine inlet temperature are among the input data. A design point performance model developed a single operating point employing thermodynamic equations to calculate all unknown parameters. It is essential to examine the compatibility or energy equilibrium between components that use a common shaft. Programming in Matlab or another programming language can be used to create the design point model. The model will continue to be improved until the error becomes smaller. In this study, the performance model was developed using commercial software called GasTurb 13 [10]. The software works by employing the most accurate and promising method called determining enthalpy–entropy values at each gas path point. The input data and validation data were gathered from several sources. The majority of the engine information was gathered from engine manufacturer datasheets. The remaining input parameters were gathered from scientific journal papers, and during model optimization, engineering judgments and estimated values were used. The input data presented in the paper [19] were used to develop the engine design point performance model and to calculate all the gas path parameters. Using the optimization parameters, constraints, parameters, and figure of merit listed in paper [19], the model has been tuned.
Design point performance was developed using the known input parameters collected from the catalogue and the available literature, along with some engineering judgments [35,36]. The secondary air system was taken into consideration. The combustion chamber performance model was created using the energy balance equation, taking pressure loss into account.
Compatibility of the components work:
where LHV is lower heating value, is the combustion efficiency, is the inlet air mass flow rate, is the fuel mass flow rate, and h3 is high-pressure compressor exit enthalpy. is low-pressure compressor work, is high-pressure compressor work, is high-pressure turbine work, is power turbine work, and is the load. The model was optimized until the validation was matched. Finally, the output of the design point model was compared to the design parameters from the gas turbine product datasheet, and as the design point model output presented in the paper [19], it was determined that the model has minimal discrepancies from the engine manufacturer data. Due to the agreement with the actual design values and very low variance, the design point values produced by the GasTurb 13 [10] simulation were found to be acceptable. As shown in the component maps scaled and presented in Figure 3, Figure 4, Figure 5, Figure 6 and Figure 7, the model has no issue with the surging and choking that occur in the gas turbine operation. The yellow square in the maps shows the design point.
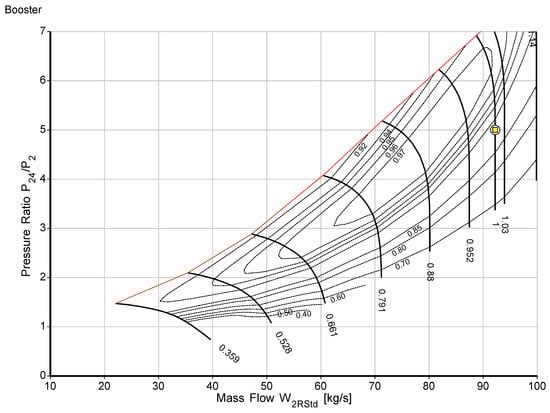
Figure 3.
Low-pressure compressor map.
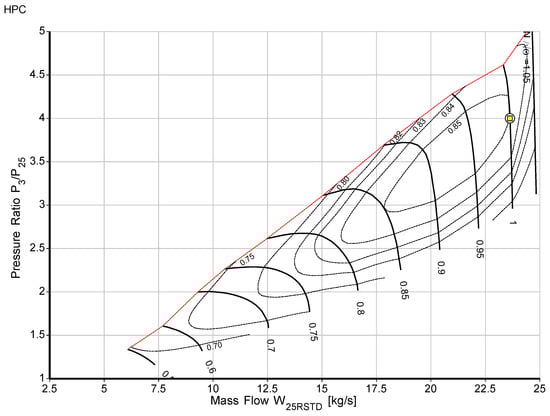
Figure 4.
High-pressure compressor map.
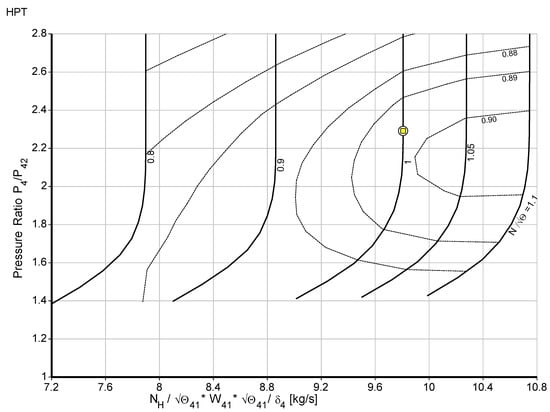
Figure 5.
High-pressure turbine map.
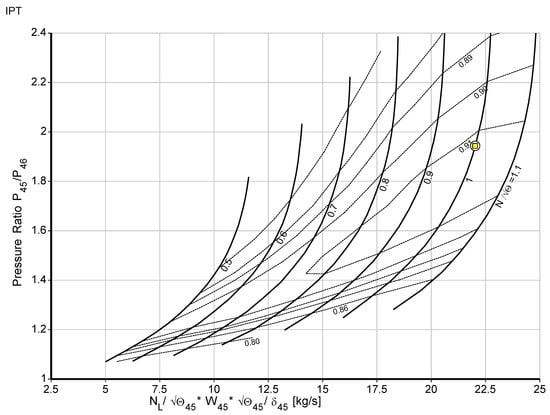
Figure 6.
Low-pressure turbine map.
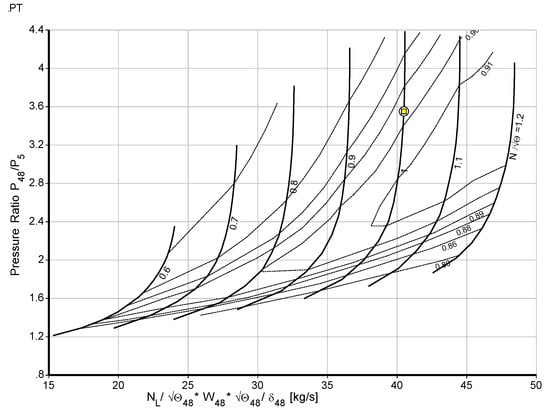
Figure 7.
Power turbine map.
2.2. Off-Design Performance Modelling
Following the successful development of the cycle design point calculations, an off-design model was developed. Off-design is the potential of the engine to run for the entire operating conditions, including the design point. It is all about state change under ambient conditions and engine load. For instance, the ambient temperature may change drastically from winter to summer, which has a considerable impact on engine performance. As a result, the engine must perform efficiently in both design point and off-design operating points. The initial step in off-design simulations is the adaptation of the target engine’s design point using the scaling approach and already existing compressor and turbine mappings. The design point was scaled uniformly for each of the five component maps. Component matching is the second step in off-design, and it is performed by employing the Newton–Raphson iterative process to ensure mass flow and work compatibility [15,31]. A suitable characteristics map comprising design point data was selected for the alteration of the compressor and turbine maps. An additional coordinate called beta (β) was added to the component map digitization process, as suggested by Kurzke [37], to maintain accurate component matching. The Newton–Raphson-based component matching procedure is presented in Figure 8.
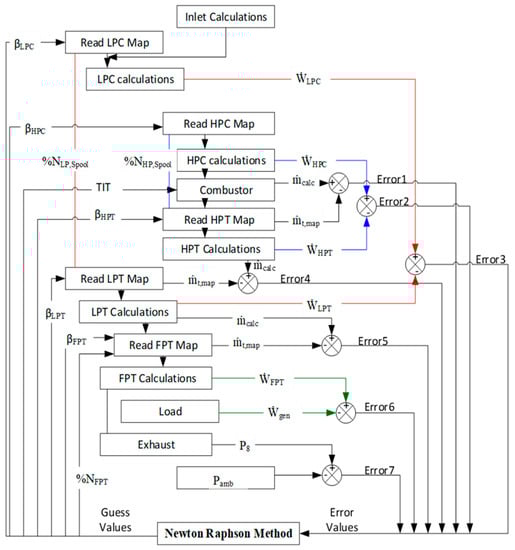
Figure 8.
Newton−Raphson algorithm for component matching in GasTurb 13 [31].
Gas Turb 13 commercial software [10], which is used to develop the design point and off-design performance mode, ensures the flow and work of the connected individual components are compatible. A steady-state off-design operating line is typically built using the Newton−Raphson iterative methodology because of its simplicity in non-linear systems [7].
The off-design model was developed and verified by using the engine datasheet or manufacturer data. The engine datasheet provided crucial information for validating the off-design model, encompassing efficiency versus ambient temperature change and power output versus ambient temperature change.
In this study, the scheduling of Variable Inlet Guide Vanes (VIGVs) and bleed air were carefully considered. The VIGV scheduling graph, displayed in Figure 9, was imported into the engine simulation software. This VIGV scheduling data were also obtained from the engine manufacturers’ catalogue.
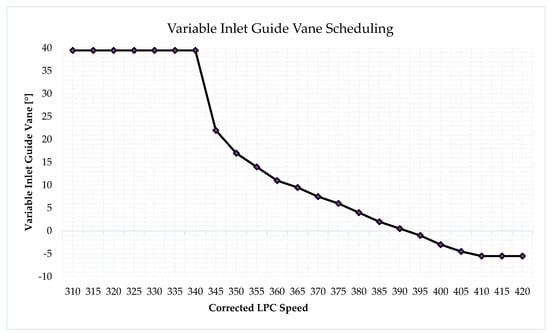
Figure 9.
RB211−24G VIGVs schedule (N1/√T0).
The off-design model was then used to generate data by incorporating the power output versus ambient temperature and VIGV scheduling into the software. Subsequently, the generated data were compared to the data collected from the engine datasheet. The validation data closely aligned with the model that produced the efficiency versus ambient temperature and power output versus ambient temperature. At each operational point, the model power output versus ambient temperature error from the data collected from the engine datasheet was a mere 0.02%. Meanwhile, the efficiency versus ambient temperature output data exhibited a 4.5% error, as presented in the paper published [19]. The validation indicates that the model is trustworthy and acceptable in predicting the gas turbine’s performance.
3. Physical Fault Simulation
The performance of the gas path components, particularly the compressor and turbine, plays a crucial role in the overall functioning of the engine due to their susceptibility to various internal and external degradation factors. Gas turbine deterioration can be attributed to two main categories of causes. The first category involves mechanical failures such as misalignment, imbalance, loose parts, bearing failures, and inadequate lubricating oil. The second category pertains to performance-related issues such as debris and fouling in compressors, corrosion, erosion, improper combustion, increased clearance around blade tips, and domestic object damage (DOD). Meanwhile, the degradation of gas turbine performance can be classified as either temporary or permanent. Temporary deterioration, which can be rectified through washing, is caused by fouling, erosion, corrosion, and blade tip clearance. On the other hand, permanent deterioration needs replacement. The most frequent cause of gas turbine performance decline is the existence of fouling and erosion. Hence, fouling and erosion physical faults, combined with variable inlet guide vane drift, were simulated in this study. One of the most common causes of component deterioration is fouling, which is responsible for more than 70% of the overall loss of engine performance during the period of operation [38,39]. It is known that during gas turbine operation, a volume of air containing air pollutants enters the engine. Using health parameters, it is possible to monitor the decline in gas turbine engine performance [40]. The performance changes caused by various defects are depicted using the health parameters. The ratio of the degraded component isentropic efficiency and mass flow and those that are in good condition component’s isentropic efficiency and mass flow are called component health parameters, as shown in Equations (6) and (7). It defines that gas turbine performance degradation occurred when the health parameter is less than 1 but not when it is greater than 1 [41]. , are health parameters.
where is the total pressure, and are health parameters, is flow rate and is isentropic efficiency.
To study how physical faults affect gas turbine performance, physical faults were introduced into the model. The relationship between physical faults and performance parameter deviation was used to simulate physical faults. The method used to simulate physical faults required a deliberate deviation in flow capacity and isentropic efficiency from the normal condition while maintaining the relationship between physical faults and performance parameters, as shown in Table 1. Prior to the simulation and data generation of the model, the deviating values were scheduled in the software using the modifier option. As shown in Table 1, to simulate compressor fouling from 0% to 100% fouling severity level, the mass flow must be purposefully decreased at intervals of 0% to −7.5%, and isentropic efficiency was also reduced at intervals of 0% to −2.5%. The flow capacity and isentropic efficiency relationship is 3:1 [41,42]. For instance, the flow capacity and efficiency will drop by −0.75 percent and −0.25 percent, respectively, in a 10 percent low and high-pressure compressor fouling severity level scenario, which means 10% of −7.5% and −2.5%. For compressor erosion and turbine fouling simulation at 10% fault severity, the reductions in efficiency and mass flow are −0.2% and −0.4%, respectively. However, it is important to note that erosion in the turbine leads to an increase in flow capacity. Thus, to simulate turbine erosion at 10% fault severity, isentropic efficiency was decreased by −0.2%, while mass flow was increased by 0.4%.

Table 1.
Health parameters and physical faults relationship [41,42,43].
4. Results and Discussion
The Combined Effect of Fouling with VIGV Drift and Erosion with VIGV Drift on the Component Isentropic Efficiency
After developing and validating the design point and off-design performance model, fouling and erosion were simulated using the relationship between physical faults and health parameters, as shown in Table 1. The GasTurb 13’s [10] modifier option was used to implant the physical faults using isentropic efficiency and flow capacity. To simulate the engine model under a deteriorated condition, the compressor maps and turbine maps must be updated using the following scaling factors [43].
where and are the scaling factors of the compressor efficiency and flow capacity, describe the scaling factors of the turbine and compressor flow capacity and efficiency, while and are the change of compressor flow capacity and efficiency, and and are the change of turbine flow capacity and efficiency. After implanting physical faults using the relations, the combined effect of fouling and variable inlet guide vane drift and erosion and variable inlet guide vane drift on component isentropic efficiency were investigated. Five different drift angles at 100% fouling and erosion fault severity levels were simulated. The VIGV drift angles were −6.5°, −3.5°, 0°, 3.5°, and 6.5°. The part load ranges were from 100% to 60%, incremented by 10%. The combined effect of fouling and VIGV drift and the combined effect of erosion and VIGV drift on the main components’ isentropic efficiency are shown in Figure 10a–j.
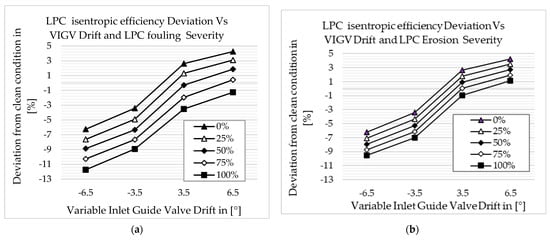
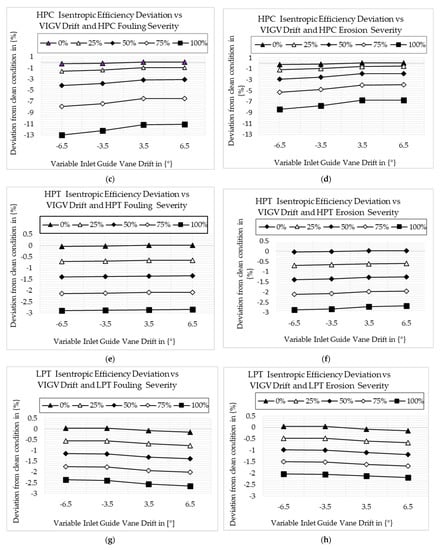
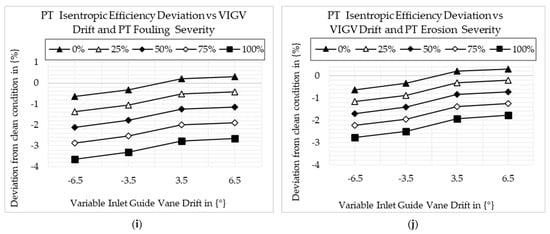
Figure 10.
Deviation of component isentropic efficiency: (a) LPC fouling and VIGV drift; (b) LPC erosion and VIGV drift; (c) HPC fouling and VIGV drift; (d) HPC erosion and VIGV drift; (e) HPT fouling and VIGV drift; (f) HPT erosion and VIGV drift; (g) LPT fouling and VIGV drift; (h) LPT erosion and VIGV drift; (i) PT fouling and VIGV drift; (j) PT erosion and VIGV drift.
Figure 10a and Figure 10b show the deviation of LPC’s isentropic efficiency when LPC fouling with VIGV drift and LPC erosion with VIGV drift existed independently, respectively. The results show that the isentropic efficiency is decreased when LPC fouling with down-VIGV drift and LPC erosion with down-VIGV drift exist. The LPC’s isentropic efficiency is increased at up-VIGV drift angles and when fouling and erosion severity are 0%. Both up- and down-VIGV drift with 100% LPC fouling caused LPC’s isentropic efficiency to decrease. However, exceptionally, LPC isentropic efficiency increases when VIGV drift is 6.5°, with 100% LPC erosion occurring. Figure 10c and Figure 10d show the isentropic efficiency deviation caused by HPC fouling with VIGV drift and HPC erosion with VIGV drift, respectively. The result shows that the HPC’s isentropic efficiency deviation trend is almost similar to the LPC’s isentropic efficiency deviation trend, but the isentropic efficiency deviation of HPC due to HPC fouling with VIGV drift and HPC erosion with VIGV drift is minimal. Another difference is that both up- and down-VIGV drift with 100% HPC fouling and both up- and down-VIGV drift with 100% erosion caused HPC isentropic efficiency to decrease. Figure 10e and Figure 10f show the HPT isentropic efficiency deviation due to HPT fouling with VIGV drift and HPT erosion with VIGV drift, respectively. In all scenarios, except 0% fouling with up-VIGV drift and erosion with up-VIGV drift, the HPT isentropic efficiency is decreased. In this case, the HPT isentropic efficiency trend due to fouling and due to erosion is similar. However, as shown in Figure 10g and Figure 10h, the LPT isentropic efficiency increases at 0% fouling with down-VIGV drift and erosion with up-VIGV drift only. Other than that, LPT isentropic efficiency decreases in all scenarios. Figure 10i and Figure 10j show the deviation of PT isentropic efficiency due to PT fouling with VIGV drift and PT erosion with VIGV drift, respectively. The trend is similar to the LPT isentropic efficiency deviation, but the deviation of PT isentropic efficiency is higher than the deviation of LPT isentropic efficiency in all scenarios.
Gas path measurement parameters are always used to monitor gas turbine performance. Mohd et al. [35] recommended the top ten diagnosis set parameters for an RB211-24G three-shaft gas turbine engine. These suggested parameters have been used in [42,43], and they are listed as follows: PT4, T24, P3, T3, P43, P47, T5, FF, N1 and N2. The combined effect of fouling and VIGV drift and erosion and VIGV drift on these measurement parameters is shown in the following graphs.
Figure 11a–j show how measurement parameters change when components and existing fouling and VIGV drift are combined and how the measurement parameters change when component erosion and VIGV drift are combined and exist. The severity of fouling and erosion was applied at 100%, and VIGV drift angles of −6.5°, −3.5°, 3.5° and 6.5° were considered.
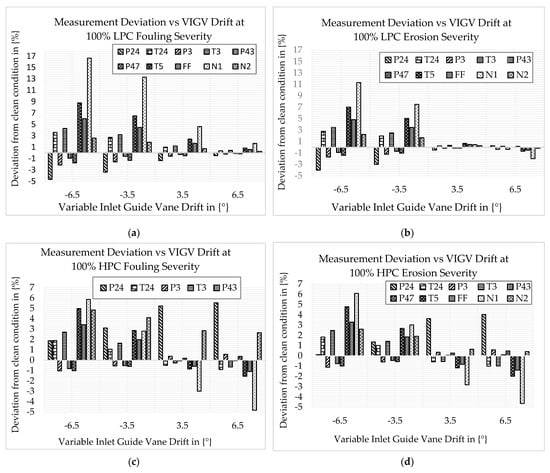
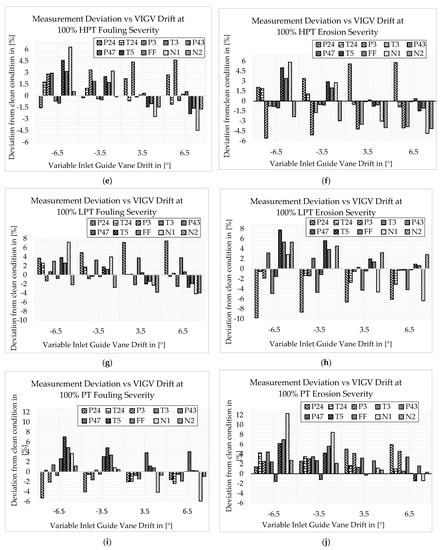
Figure 11.
Deviation of component measurement parameters: (a) LPC fouling and VIGV drift; (b) LPC erosion and VIGV drift; (c) HPC fouling and VIGV drift; (d) HPC erosion and VIGV drift; (e) HPT fouling and VIGV drift; (f) HPT erosion and VIGV drift; (g) LPT fouling and VIGV drift; (h) LPT erosion and VIGV drift; (i) PT fouling and VIGV drift; (j) PT erosion and VIGV drift.
Figure 11a,b show how the measurement parameters change when LPC fouling and VIGV drift are combined and how the measurement parameters change when LPC erosion and VIGV drift are combined and exist. The graphs of both Figure 11a and Figure 11b demonstrate that at each drift angle, T24, T3, T5, FF, N1, and N2 show increments, whereas P24, P3, P43, and P47 show decrements. The highest deviation is shown in the down-VIGV drift for both scenarios. The knowledge gained from this result is that up-VIGV drift offsets the deviation of measurements caused by fouling and erosion. Figure 11c and Figure 11d show how the measurement parameters change when HPC fouling and VIGV drift combine and occur and how the measurement parameters change when HPC erosion and VIGV drift combine and occur. The result shows that at each drift angle, P24, T24, T3, T5, FF, N1, and N2 show increments, while P3, P43, and P47 show decrements. The highest deviation, except P24, is shown in the down-VIGV drift for both scenarios. When HPT fouling is combined with VIGV drift, the measurement parameters change, as shown in Figure 11e. The result shows that the highest deviations of P24, P3, and N2 parameters were observed at the 6.5° drift angle, which were about 2.71%, 4.6%, and 1.7%, while the highest deviations of T24, T3, P43, P47, T5, FF, and N1 parameters were observed at a −6.5° drift angle, and were about 1.78%, 2.93%, −0.7%, −0.95%, 4.59%, 3.14%, and 6.3%, respectively. Figure 11f shows how the measurement parameters change when HPT erosion combined with VIGV drift occurred. The result shows that the highest deviation of P24, T3, and N2 is observed at 6.5° drift, being about 5.79%, −3.84%, and −4.12%, respectively; the highest deviation of T24, P3, P43, P47, T5, FF, and N1 is observed at −6.5° drift, being about 1.89%, −5.6%, −0.83%, −1.03%, 5.0%, 3.4%, and 5.8%, respectively.
Figure 11g shows how the measurement parameters change when LPT fouling is combined with VIGV drift and exists. The result shows that the highest deviations of parameters P24, T3, P43, and N2, were observed at 6.5° drift, being about 7.47%, −2.54%, 3.78%, and −3.97%, respectively, and the highest deviation of parameters T24, P3, P47, T5, FF, and N1, was observed at −6.5° drift, being about 2.6%, −1.33%, −0.8%, 3.8%, 2.6%, and 7.1%, respectively. It was also observed that P24, T24, T3, P43, T5, FF, and N1 were increased compared to the normal condition, where P3, P43, and N2 were decreased. Figure 11h depicts how the measurement parameters changed when LPT erosion and VIGV drift coexisted. The result shows that the highest deviation of parameters P24, P3, T3, P43, P47, T5, FF, and N2 is observed at a −6.5° drift, being about −9.8%, −1.88%, 3.18%, −4.95%, −1.55%, 7.75%, 5.3%, and 5.3%, respectively. It was observed that T3, T5, FF, N1, and N2 increased from the normal condition, whereas P24, T24, P3, P43, and P47 decreased. Figure 11i depicts how the measurement parameters change when PT fouling occurs in conjunction with VIGV drift. The result shows that the highest deviation of T24, T3, P47, and N1 is observed at 6.5° drift, being about −2.36%, −1.88%, −4.07%, and −5.91%, respectively, and the highest deviation of P24, P3, P43, T5, FF, and N2 is observed at −6.5° drift, being about −5.27%, −2.09%, −0.74%, 7.04%, 4.8%, and 1.15%, respectively. Figure 11j depicts how measurement parameters changed when PT erosion and VIGV drift coexisted. The results show that the maximum deviation of parameters P24, P3, and P43 is observed at 6.5° drift, being approximately −3.16, −6.39%, and −4.12%; the maximum deviation of parameters T24, T3, P47, T5, FF, and N1 is observed at −6.5° drift, being approximately 4.27%, 4.44%, −5.18%, 6.18%, 6.98%, 12.3%, and 2.71%. It was observed that T5, FF, and N1 show the highest deviation at −6.5° VIGV angle drift, among other parameters.
5. Conclusions
The results showed that VIGV drift has a significant impact on gas turbine performance. When component fouling and VIGV drift are combined and exist and when components erosion and VIGV drift are combined and exist, the highest isentropic efficiency deviation is shown for LPC, while the lowest deviation is shown for LPT. The combined effect of fouling and up-VIGV drift and the combined effect of erosion and up-VIGV drift show a small deviation due to offsetting the isentropic efficiency decline caused by fouling and the isentropic efficiency decline caused by erosion. Furthermore, the combination of fouling and down-VIGV drift as well as erosion and down-VIGV drift reduced the component’s isentropic efficiency. However, it is worth noting that LPT isentropic efficiency increases when down-VIGV drift occurs at 0% fouling and erosion severity. In most cases, it was observed that the deviation of component isentropic efficiency increases as the fouling and erosion severity increases, but in some cases, it is nonlinear due to component re-matching. The combined effect of fouling and down-VIGV drift, and the combined effect of erosion and down-VIGV drift, caused an increase in exhaust temperature. In the scenarios of up-VIGV drift with fouling and up-VIGV drift with erosion, it is observed that fuel flow rate, exhaust temperature, and low-pressure spool speed are significantly raised from the clean condition values. This causes a drop in overall engine efficiency. Generally, in this paper, the deviation of gas path measurement parameters due to the combined effects of fouling and VIGV drift, and the combined effects of erosion and VIGV drift, are discussed. The recorded isentropic efficiency of the component and the measurement deviation due to the combined effect of physical faults (fouling and erosion) and malfunction (VIGV drift) can be utilized as inputs for diagnosis development. The authors suggest that future research could investigate the combined effects of fouling and VIGV drift and the combined effects of erosion and VIGV drift on gas turbine performance under part-load operation.
Author Contributions
S.I.G., T.A.L., A.D.F. and K.G.K. reviewed the manuscript and made critical revisions. W.M.S. created the model, ran the simulation, produced the graphs, and wrote the draft paper. The manuscript’s current form was approved by all authors after they read it. All authors have read and agreed to the published version of the manuscript.
Funding
This research was funded by the Swedish Knowledge Foundation (KKS) under the project PROGNOSIS, grant number 20190994, while the article processing charge was funded by Mälardalen University (MDU).
Acknowledgments
The authors are thankful to Universiti Teknologi PETRONAS and Mälardalen University.
Conflicts of Interest
The authors have no conflicting interest.
Nomenclature
| CC | Combustion chamber |
| DOD | Domestic object damage |
| FF | Fuel flow |
| GT | Gas Turbine |
| NGV | Nozzle guide vane |
| N1 | Low-pressure speed |
| N2 | High-pressure speed |
| P24 | Low-pressure compressor exit Pressure |
| P3 | High-pressure compressor exit pressure |
| P43 | High-pressure turbine exit pressure |
| P47 | Low-pressure turbine exit pressure |
| RVDT | Rotary variable displacement transducer |
| T24 | Low-pressure compressor exit Temperature |
| T3 | High-pressure compressor exit Temperature |
| T5 | Power turbine exit temperature |
| VAN | Variable area nozzle |
| VBV | Variable bleed valve |
| VIGV | Variable inlet guide vane |
| VSV | Variable stator vane |
| Low-pressure compressor corrected flow | |
| High-pressure compressor corrected flow | |
| Corrected high-pressure spool speed, where and is inlet temperature | |
| Corrected low-pressure spool speed | |
| Corrected high-pressure turbine flow, where and Po is inlet pressure | |
| Corrected low-pressure turbine flow | |
| Corrected power turbine flow |
References
- Li, Z.; Zhong, S.-S.; Lin, L. Novel Gas Turbine Fault Diagnosis Method Based on Performance Deviation Model. J. Propuls. Power 2017, 33, 730–739. [Google Scholar] [CrossRef]
- Wang, H.; Li, X.-S.; Ren, X.; Gu, C.-W.; Ji, X.-X. A thermodynamic-cycle performance analysis method and application on a three-shaft gas turbine. Appl. Therm. Eng. 2017, 127, 465–472. [Google Scholar] [CrossRef]
- Fentaye, A.D.; Baheta, A.T.; Gilani, S.I.; Kyprianidis, K.G. A review on gas turbine gas-path diagnostics: State-of-the-art methods, challenges and opportunities. Aerospace 2019, 6, 83. [Google Scholar] [CrossRef]
- Merrington, G.; Kwon, O.-K.; Goodwin, G.; Carlsson, B. Fault Detection and Diagnosis in Gas Turbines. In Proceedings of the ASME 1990 International Gas Turbine and Aeroengine Congress and Exposition, Brussels, Belgium, 11–14 June 1990; Volume 5. [Google Scholar] [CrossRef]
- Saravanamuttoo, H.I.H.; Lakshminarasimha, A.N. A preliminary assessment of compressor fouling. ASME Pap. 1985, 153. [Google Scholar]
- Mishra, R.K. Fouling and Corrosion in an Aero Gas Turbine Compressor. J. Fail. Anal. Prev. 2015, 15, 837–845. [Google Scholar] [CrossRef]
- Diakunchak, I.S. Performance Deterioration in Industrial Gas Turbines; American Society of Mechanical Engineers: New York, NY, USA, 1991. [Google Scholar] [CrossRef]
- Grewal, N.S. Gas Turbine Engine Performance Deterioration Modelling and Analysis Supervisor. Ph.D. Thesis, Cranfield Institute of Technology, Cranfield, UK, 1988. [Google Scholar]
- Cruz-Manzo, S.; Krishnababu, S.; Panov, V.; Bingham, C. Inter-Stage Dynamic Performance of an Axial Compressor of a Twin-Shaft Industrial Gas Turbine. Machines 2020, 8, 83. [Google Scholar] [CrossRef]
- GGmbh. GasTurb 13 Design and Off-Design Performance of Gas Turbines. 85221 Dachau, Max Feldbauer Weg 5, Germany. 2018. Available online: www.gasturb.de (accessed on 2 August 2022).
- Treaty, N.A. Performance prediction and simulation of gas turbine engine operation for aircraft, marine, vehicular, and power generation. Res. Technol. Organ. (RTO) NATO 2007, 323. [Google Scholar]
- Qi, M.; Ren, X.; Li, X.; Xiao, Y.; Li, Y. Performance Investigation of a Large Turning Blade for Marine Gas Turbine Based on Experimental and Numerical Methods. Machines 2023, 11, 346. [Google Scholar] [CrossRef]
- Tahan, M.; Tsoutsanis, E.; Muhammad, M.; Karim, Z.A. Performance-based health monitoring, diagnostics and prognostics for condition-based maintenance of gas turbines: A review. Appl. Energy 2017, 198, 122–144. [Google Scholar] [CrossRef]
- Gu, C.-W.; Wang, H.; Ji, X.-X.; Li, X.-S. Development and application of a thermodynamic-cycle performance analysis method of a three-shaft gas turbine. Energy 2016, 112, 307–321. [Google Scholar] [CrossRef]
- Chen, Y.-Z.; Zhao, X.-D.; Xiang, H.-C.; Tsoutsanis, E. A sequential model-based approach for gas turbine performance diagnostics. Energy 2020, 220, 119657. [Google Scholar] [CrossRef]
- Haglind, F. Variable geometry gas turbines for improving the part-load performance of marine combined cycles—Gas turbine performance. Energy 2010, 35, 562–570. [Google Scholar] [CrossRef]
- Kim, J.H.; Song, T.W.; Kim, T.S.; Ro, S.T. Dynamic Simulation of Full Startup Procedure of Heavy-Duty Gas Turbines. J. Eng. Gas Turbines Power 2002, 124, 510–516. [Google Scholar] [CrossRef]
- Bringhenti, C.; Tomita, J.T.; Júnior, F.D.S.; Barbosa, J.R. Gas Turbine Performance Simulation Using an Optimized Axial Flow Compressor. In Proceedings of the ASME Turbo Expo 2006: Power for Land, Sea, and Air, Barcelona, Spain, 8–11 May 2006. [Google Scholar] [CrossRef]
- Salilew, W.M.; Karim, Z.A.A.; Lemma, T.A.; Fentaye, A.D.; Kyprianidis, K.G. Predicting the Performance Deterioration of a Three-Shaft Industrial Gas Turbine. Entropy 2022, 24, 1052. [Google Scholar] [CrossRef] [PubMed]
- Song, T.W.; Kim, T.S.; Kim, J.H.; Ro, S.T. Performance prediction of axial flow compressors using stage characteristics and simultaneous calculation of interstage parameters. Proc. Inst. Mech. Eng. Part A J. Power Energy 2001, 215, 89–98. [Google Scholar] [CrossRef]
- Salar, A.; Hosseini, S.M.; Zangmolk, B.R.; Sedigh, A.K. Improving Model-Based Gas Turbine Fault Diagnosis using Multi-Operating Point Method. In Proceedings of the 2010 Fourth UKSim European Symposium on Computer Modeling and Simulation, Pisa, Italy, 17–19 November 2010; pp. 240–247. [Google Scholar] [CrossRef]
- Tsalavoutas, A.; Mathioudakis, K.; Stamatis, A.; Smith, M. Identifying Faults in the Variable Geometry System of a Gas Turbine Compressor. J. Turbomach. 2000, 123, 33–39. [Google Scholar] [CrossRef]
- Stamatis, A.; Mathioudakis, K.; Papailiou, K.D. Adaptive Simulation of Gas Turbine Performance; American Society of Mechanical Engineers: New York, NY, USA, 1989; Volume 1. [Google Scholar] [CrossRef]
- Cruz-Manzo, S.; Maleki, S.; Panov, V.; Agbonzikilo, F.; Zhang, Y.; Latimer, A. Performance Analysis of a Twin-Shaft Gas Turbine with Fault in the Variable Stator Guide Vane System of the Axial Compressor. In Proceedings of the 9th International Gas Turbine Conference, Brussels, Belgium, 10–11 October 2018. [Google Scholar]
- Razak, A.M.Y.; Dosanjh, M.S. Application of an Advanced Performance Monitoring System to Detect an Implanted Fault on a Twin Spool Aero Derived Gas Turbine. In Proceedings of the ASME Turbo Expo 2002: Power for Land, Sea, and Air, Amsterdam, The Netherlands, 3–6 June 2002; pp. 29–36. [Google Scholar] [CrossRef]
- Enyia, J.D.; Li, Y.; Thank-God, I.; Igbong, D.I. Industrial gas turbine on-line compressor washing for power generation. Isaiah Int. J. Eng. Res. Technol. 2015, 4, 500–506. [Google Scholar]
- Ajoko, T.J. Performance monitoring of industrial gas turbine. Int. J. Eng. Sci. Invent. 2014, 3, 62–68. [Google Scholar]
- Salilew, W.M.; Karim, Z.A.A.; Lemma, T.A. Investigation of fault detection and isolation accuracy of different Machine learning techniques with different data processing methods for gas turbine. Alex. Eng. J. 2022, 61, 12635–12651. [Google Scholar] [CrossRef]
- Cao, Y.; Lv, X.; Han, G.; Luan, J.; Li, S. Research on Gas-Path Fault-Diagnosis Method of Marine Gas Turbine Based on Exergy Loss and Probabilistic Neural Network. Energies 2019, 12, 4701. [Google Scholar] [CrossRef]
- Razak, A.M.Y. Industrial Gas Turbines: Performance and Operability; Woodhead Publishing Ltd.: Cambridge, UK, 2007. [Google Scholar]
- Hashmi, M.B.; Lemma, T.A.; Karim, Z.A.A. Investigation of the Combined Effect of Variable Inlet Guide Vane Drift, Fouling, and Inlet Air Cooling on Gas Turbine Performance. Entropy 2019, 21, 1186. [Google Scholar] [CrossRef]
- Razak, A. Gas turbine performance modelling, analysis and optimisation. In Modern Gas Turbine Systems; Woodhead Publishing Ltd.: Cambridge, UK, 2013. [Google Scholar] [CrossRef]
- Kurzke, J. Design-Point Calculations of Industrial Gas Turbines; American Society of Mechanical Engineers: New York, NY, USA, 2020; pp. 376–397. [Google Scholar]
- Ao, S.I.; Gelman, L.; Hukins, D.W.L.; Hunter, A.; Korsunsky, A. International Association of Engineers. Design and Off-Design Operation and Performance Analysis of a Gas Turbine. In Proceedings of the World Congress on Engineering, London, UK, 4–6 July 2018; Volume 2. ISSN: 2078-0966 (Online). [Google Scholar]
- Jasmani, M.S.; Li, Y.-G.; Ariffin, Z. Measurement Selections for Multicomponent Gas Path Diagnostics Using Analytical Approach and Measurement Subset Concept. J. Eng. Gas Turbines Power 2011, 133, 111701. [Google Scholar] [CrossRef]
- Gao, J.-H.; Huang, Y.-Y. Modeling and Simulation of an Aero Turbojet Engine with Gasturb. In Proceedings of the 2011 International Conference on Intelligence Science and Information Engineering, Wuhan, China, 20–21 August 2011; pp. 295–298. [Google Scholar] [CrossRef]
- Kurzke, J. About Simplifications in Gas Turbine Performance Calculations. In Proceedings of the Turbo Expo: Power for Land, Sea, and Air, Montreal, Canada, 14–17 May 2007. [Google Scholar] [CrossRef]
- Lakshminarasimha, A.N.; Boyce, M.P.; Meher-Homji, C.B. Modeling and Analysis of Gas Turbine Performance Deterioration. J. Eng. Gas Turbines Power 1994, 116, 46–52. [Google Scholar] [CrossRef]
- Ntantis, E. Capability Expansion of Non-Linear Gas Path Analysis. Ph.D. Thesis, Cranfield University, Cranfield, UK, October 2008. [Google Scholar]
- Yang, Q.; Li, S.; Cao, Y. Full and Part-Load Performance Deterioration Analysis of Industrial Three-Shaft Gas Turbine Based on Genetic Algorithm. In Proceedings of the ASME Turbo Expo: Turbine Technical Conference and Exposition, Seoul, Republic of Korea, 13–17 June 2016. [Google Scholar]
- Mohammadi, E.; Montazeri-Gh, M. Simulation of Full and Part-Load Performance Deterioration of Industrial Two-Shaft Gas Turbine. J. Eng. Gas Turbines Power 2014, 136, 092602. [Google Scholar] [CrossRef]
- Salilew, W.M.; Karim, Z.A.A.; Lemma, T.A.; Fentaye, A.D.; Kyprianidis, K.G. The Effect of Physical Faults on a Three-Shaft Gas Turbine Performance at Full- and Part-Load Operation. Sensors 2022, 22, 7150. [Google Scholar] [CrossRef] [PubMed]
- Salilew, W.M.; Karim, Z.A.A.; Lemma, T.A.; Fentaye, A.D.; Kyprianidis, K.G. Three Shaft Industrial Gas Turbine Transient Performance Analysis. Sensors 2023, 23, 1767. [Google Scholar] [CrossRef] [PubMed]
Disclaimer/Publisher’s Note: The statements, opinions and data contained in all publications are solely those of the individual author(s) and contributor(s) and not of MDPI and/or the editor(s). MDPI and/or the editor(s) disclaim responsibility for any injury to people or property resulting from any ideas, methods, instructions or products referred to in the content. |
© 2023 by the authors. Licensee MDPI, Basel, Switzerland. This article is an open access article distributed under the terms and conditions of the Creative Commons Attribution (CC BY) license (https://creativecommons.org/licenses/by/4.0/).