Article

Research on the Influence of Charging Oil Conditions on the Axial Force of Hydraulic Torque Converter

1
School of Mechanical Engineering, Beijing Institute of Technology, Beijing 100081, China
2
Chongqing Innovation Center, Beijing Institute of Technology, Chongqing 401122, China
3
Yangtze Delta Region Academy of Beijing Institute of Technology, Jiaxing 314001, China
4
Advanced Technology Research Institute, Beijing Institute of Technology, Jinan 250307, China
*
Author to whom correspondence should be addressed.
Machines 2023, 11(7), 730; https://doi.org/10.3390/machines11070730
Submission received: 16 May 2023 / Revised: 1 July 2023 / Accepted: 6 July 2023 / Published: 11 July 2023
(This article belongs to the Section Turbomachinery)

Abstract

:
The hydraulic torque converter is a critical component in high-power tracked vehicles such as bulldozers or bridge machines. Its axial force has a significant impact on the reliability and load-carrying capacity of the transmission system, which is greatly influenced by the charging oil conditions. To investigate the axial force characteristic of the torque converter and its charging oil effects, a computational fluid dynamics (CFD) method is established by considering inner and outer leakage regions, as well as inlet and outlet channels. Additionally, a novel axial force-testing method is proposed, and the axial force testing and validation experiments on the torque converter prototype have been completed. The research findings reveal that changes in oil viscosity resulting from variations in charging oil temperature have a considerable impact on the axial force of the torque converter. The axial force of the pump and turbine decreases as the temperature increases due to varying pressure sensitivity among different components. The influence of charging oil pressure on axial force follows a linear relationship, with its magnitude determined by the axial unbalanced area of the hydraulic torque converter during its design and development. In addition, a formula for the axial force of the hydraulic torque converter is proposed under different charging oil pressures. Furthermore, a novel suppression of axial force has been proposed without altering the structure, which has been validated as an effective method. The results lay a theoretical foundation for the research and suppression of axial forces in hydraulic torque converters, and they also have an engineering application value in the design of high-reliability and long-life converters.

1. Introduction

Hydraulic torque converter is a fluid-driven machine that uses oil circulation to transfer energy. It offers functions such as stepless speed regulation, adaptive loading, and engine vibration absorption, significantly enhancing a vehicle’s power, reliability, and off-road capabilities. As a result, it has become a core component of transmission systems [1] and is widely employed in tank armored vehicles, passenger cars, off-road vehicles, construction machinery, ships, and other equipment. The hydraulic torque converter primarily consists of three impellers: pump, turbine, and stator. The pump impeller is connected to the engine, transferring energy to the working oil to drive the turbine impeller, which, in turn, powers the load. The working fluid circulates back to the pump impeller through the stator, forming a flow field circulation. Figure 1 shows a schematic diagram of its structure, where points a, c, and f denote the outer inlet points of the pump, turbine, and stator, respectively. Points b, d, and e represent the inner inlet points of the pump, turbine, and stator, respectively. The ch segment represents the flow passage formed on the left side by the components connected to the pump and turbine. The ai, fj, and ch segments collectively constitute the outer leakage area, while the bde segment constitutes the inner leakage area.
The hydraulic torque converter’s structure is complex, featuring a twisted space circulation structure in its internal flow channel and a highly intricate flow state. High-speed oil impacting the flow channel and vanes generate substantial axial forces, and due to varying structural designs, the high-pressure oil acting on each impeller may not be axially balanced, also resulting in axial forces. Consequently, significant axial forces occur during the hydraulic torque converter’s operation [2]. These forces act on the bearings and connecting components inside the hydraulic torque converter, increasing the comprehensive load on the bearings and structural parts, significantly reducing their service life, and substantially affecting the transmission’s reliability and lifespan. Therefore, it is urgent to carry out research on the axial force of torque converters.
Further, hydraulic torque converters use viscous oil as the working medium. A high temperature oil with a certain pressure and flow rate is continuously supplied by the charging oil system during operation, which directly contributes to the formation of axial forces. In addition, the structure of the supply system, as well as its pressure and temperature variations, can also have a significant effect on the axial forces. However, the characteristics of the axial force of the torque converter and the influence law are currently unclear. Therefore, studying the influence of charging oil conditions on axial forces can lay the groundwork for actively suppressing and optimizing axial forces in hydraulic torque converters. Therefore, the study of the effect of charging oil conditions on the axial force can provide a basis for the active suppression and optimization of the axial force of the hydraulic torque converter.
In recent decades, the axial forces of hydraulic torque converters, etc., are of increasing concern. In addition, the research methods have gradually transitioned from one-dimensional beam theory to three-dimensional flow field analysis. Farag [3] investigated the dynamical motion of a symmetric rigid body around a principal axis, which is filled with a viscous incompressible fluid around its center of mass. In addition, revealed the combined effect of both the viscous liquid and the movable mass on the suggested motion. Chen et al. [4] used one-dimensional beam theory to calculate the pressure distribution in each chamber of the hydraulic torque converter and study the axial force. Tan et al. [5] investigated the suppression of the axial force of the pump and turbine in the hydraulic torque converter by analyzing the distribution form of the unloading hole. They found that increasing the radius of the unloading hole distribution circle and the diameter of the unloading hole was beneficial for suppressing the axial force of the pump and turbine. Furthermore, Liu Chunbao, Yan Qingdong, and others computed the pressure of the flow field in the hydraulic torque converter using computational fluid dynamics (CFD) calculations to determine the internal force situation [6,7,8,9,10]. Sun Bo et al. [11] performed CFD numerical calculations to analyze the axial force of hydraulic couplings. Cai, Chai, et al. [12,13,14] conducted tests and analyzed the external characteristics of the internal flow field of the hydraulic torque converter using particle image velocimetry (PIV) and particle tracking velocimetry (PTV) technology. Wu et al. [15] found that the angles of the inlet and outlet, especially the angle of the turbine outlet, are very important for the performance of the hydraulic torque converter. Chen et al. [16] discovered that there is an optimal blade angle for the hydrodynamic retarder, which can achieve a stable internal flow direction and maximum braking torque. Li et al. [17] proposed a performance optimization method for hydraulic torque converters based on blade angle design and established its integrated dynamics mapping relationship. Xiong et al. [18,19] conducted research on cavitation caused by blades, using optimized Joukowsky airfoil profiles to reduce the degree of cavitation in the torque converter. They used slotted stator blades to suppress cavitation. Kunisaki et al. [20] measured the flow field structure in a hydraulic torque converter using Particle Image Velocimetry (PIV). Hempy [21] and De Jesus Rivera [22,23] studied the internal fluid behavior of a hydraulic torque converter using 29 pressure sensors.
Huang et al. [24] used the CFD method to calculate the axial force of the hydraulic torque converter, established an internal and external flow field model, and carried out a three-dimensional steady-state numerical simulation in ANSYS CFXTM to obtain the axial force exerted on the three impellers. They compared the results with the axial force calculated by the one-dimensional beam theory formula, verifying the accuracy of the numerical model. They also used the method of drilling relief holes on the turbine hub to reduce the axial force of the pump impeller and turbine. Gu [25] focused on the study of adjustable guide vane centrifugal turbine hydraulic torque converter, simulated the axial forces generated in different flow regions, and analyzed them separately. He found the proportion of the axial force in different parts to the total impeller axial force, discovered that the pump impeller axial force decreases as the turbine speed ratio increases and reverses at high speed ratios, and optimized the turbine axial force through the form of unloading holes. Zhang [26] studied the impact of supply oil pressure on the axial force of the adjustable guide vane hydraulic torque converter. He used the CFD method to calculate the axial force under different supply oil pressures and found that the greater the supply oil pressure, the greater the axial force of the LB46 type torque converter. He also studied the effect of guide vane opening on the axial force.
Current research on the axial force of torque converters predominantly employs numerical calculations to examine the effects of structural elements, such as unloading holes in the impeller, on the axial force. However, the effects of charging conditions, including charging pressure and temperature, have not been considered in previous studies. In addition, the research lacks relevant test techniques, experimental methods, and data. As a result, it seriously limits the study of axial forces and their suppression. Therefore, a CFD method was established in the research by considering inner and outer leakage regions, as well as inlet and outlet channels. In addition, a novel suppression of axial force has been proposed without altering the structure. Additionally, the impact of different charging oil conditions on the axial force of the hydraulic torque converter has been investigated by numerical methods and experimental techniques. This research has important engineering application value and significance in enhancing the reliability and service life of hydraulic torque converters.

2. Numerical Methods

Utilizing finite element simulation software, ANSYS CFX, the Reynolds-averaged Navier–Stokes equation for three-dimensional flow fields is solved based on the following assumptions [27]: (1) the fluid is incompressible; (2) the components are rigid bodies, neglecting deformation and axial displacement; (3) the flow is steady-state.
The axial force computational fluid dynamics (CFD) model proposed in this study encompasses six components: the pump, turbine, stator, leakage region, inlet region, and outlet region. As depicted in Figure 2, the leakage region is subdivided into outer and inner leakage areas. The majority of the working fluid circulates between the pump, turbine, and stator, forming the primary circulation of the torque converter flow field. The incorporation of inner and outer rings, as well as inlet and outlet flow fields, allows for precise simulation of unbalanced areas and oil supply conditions, ultimately yielding more accurate axial force predictions.

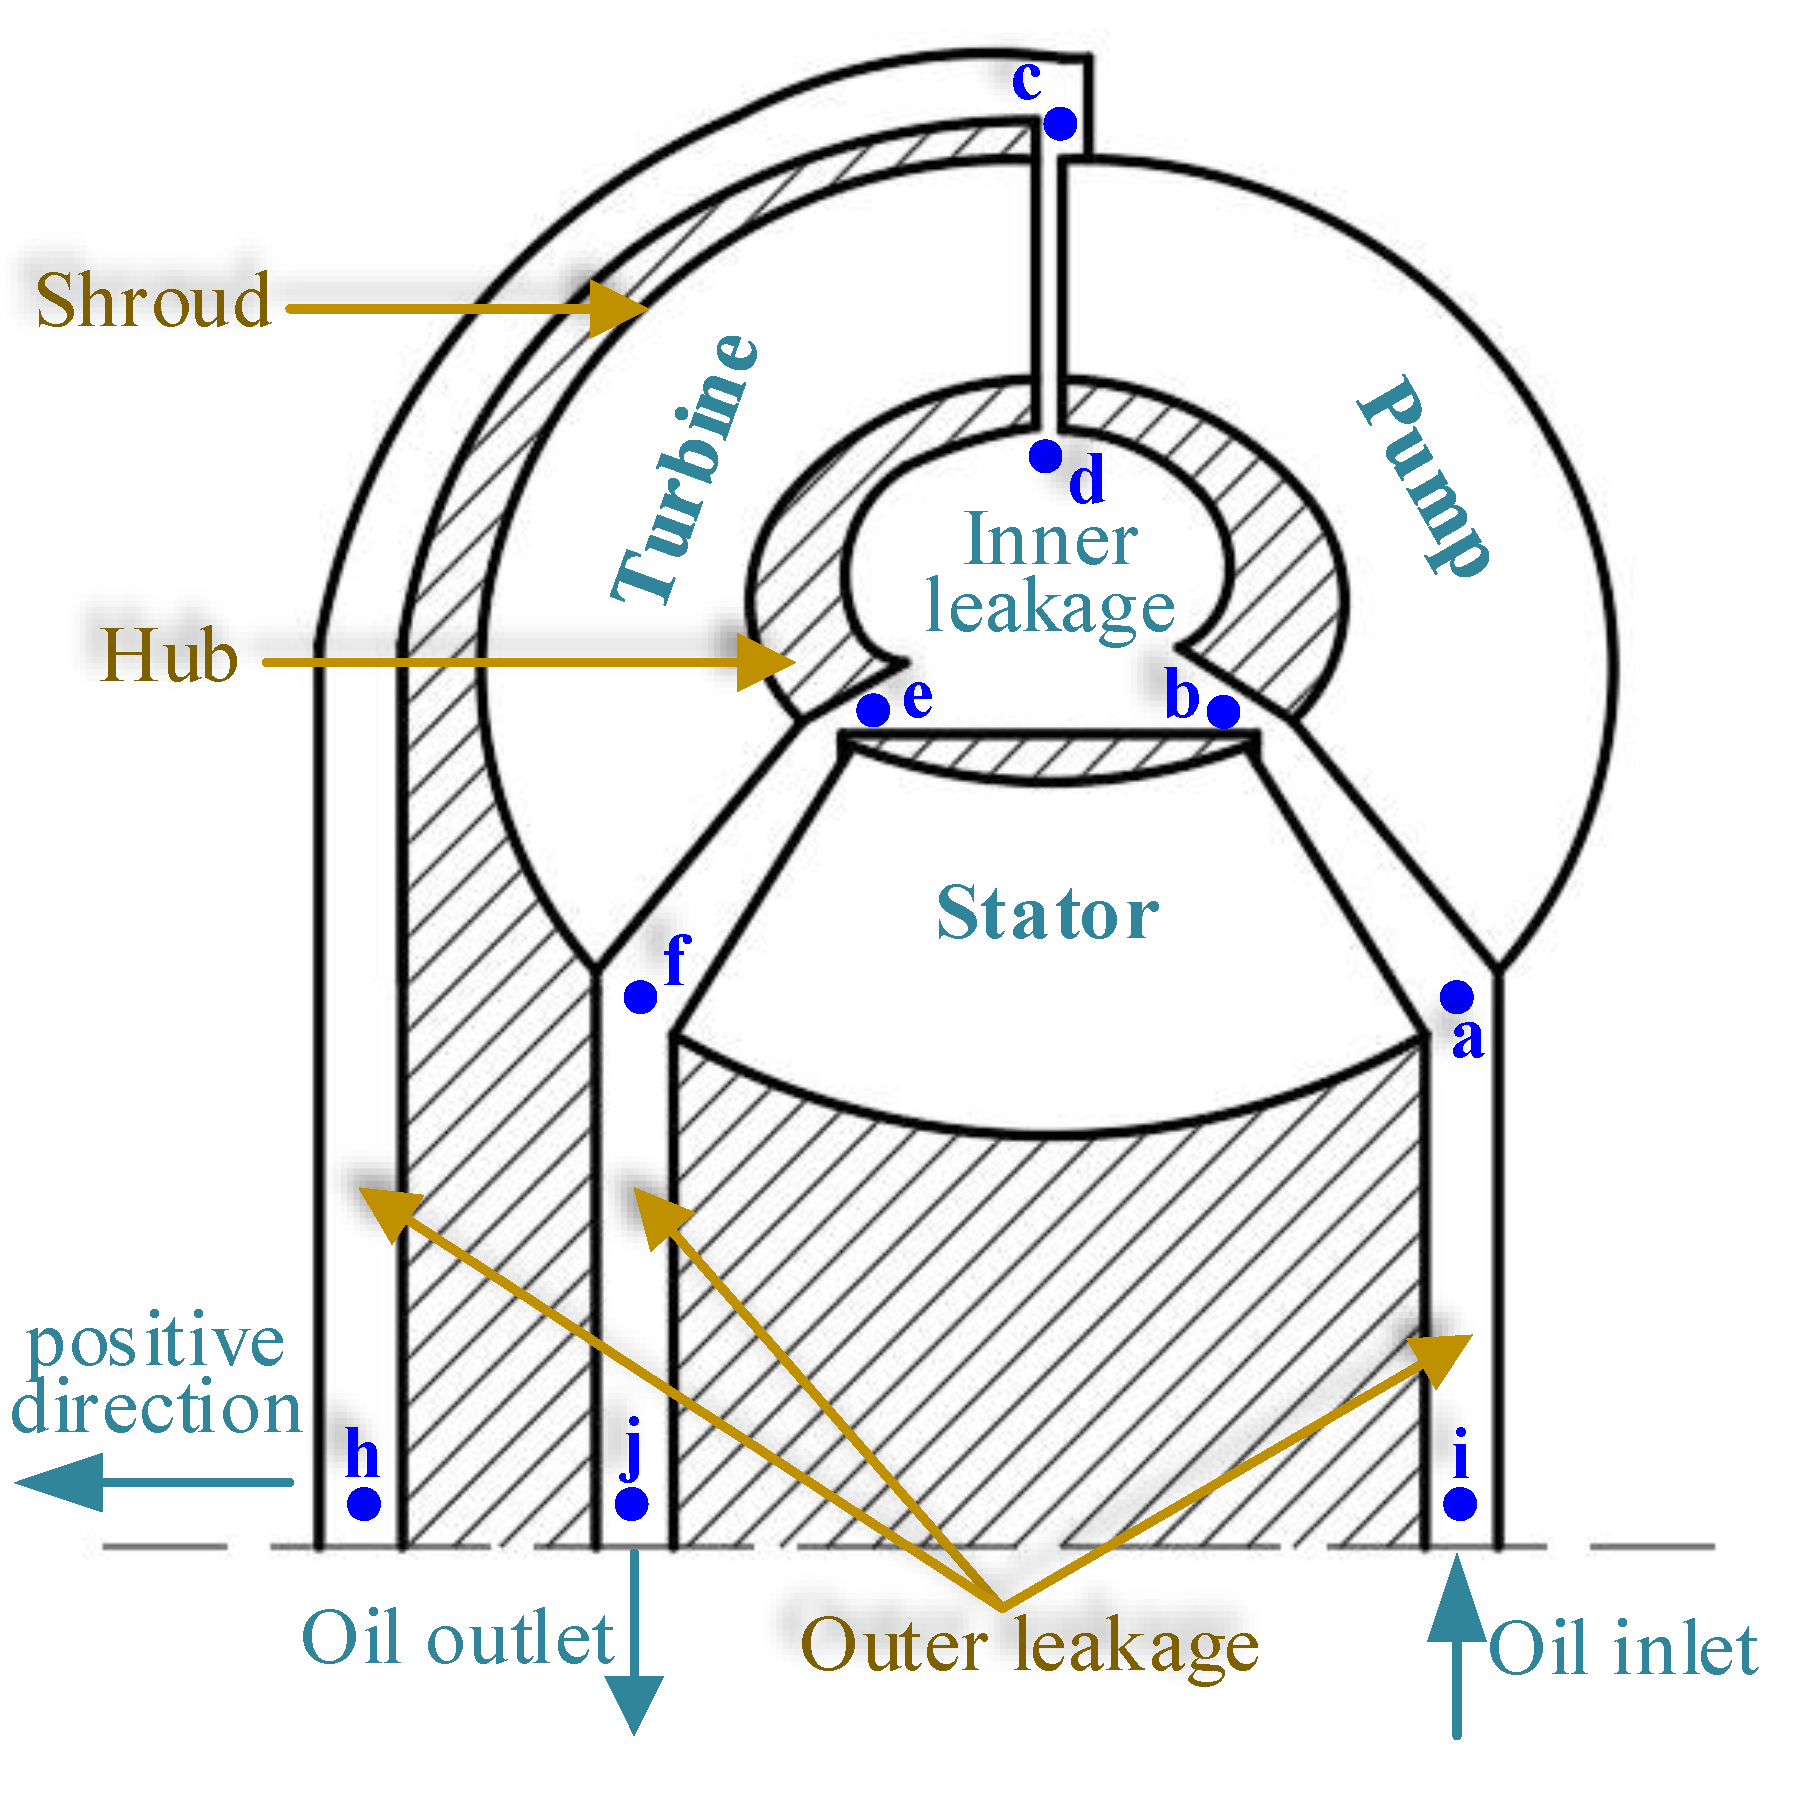
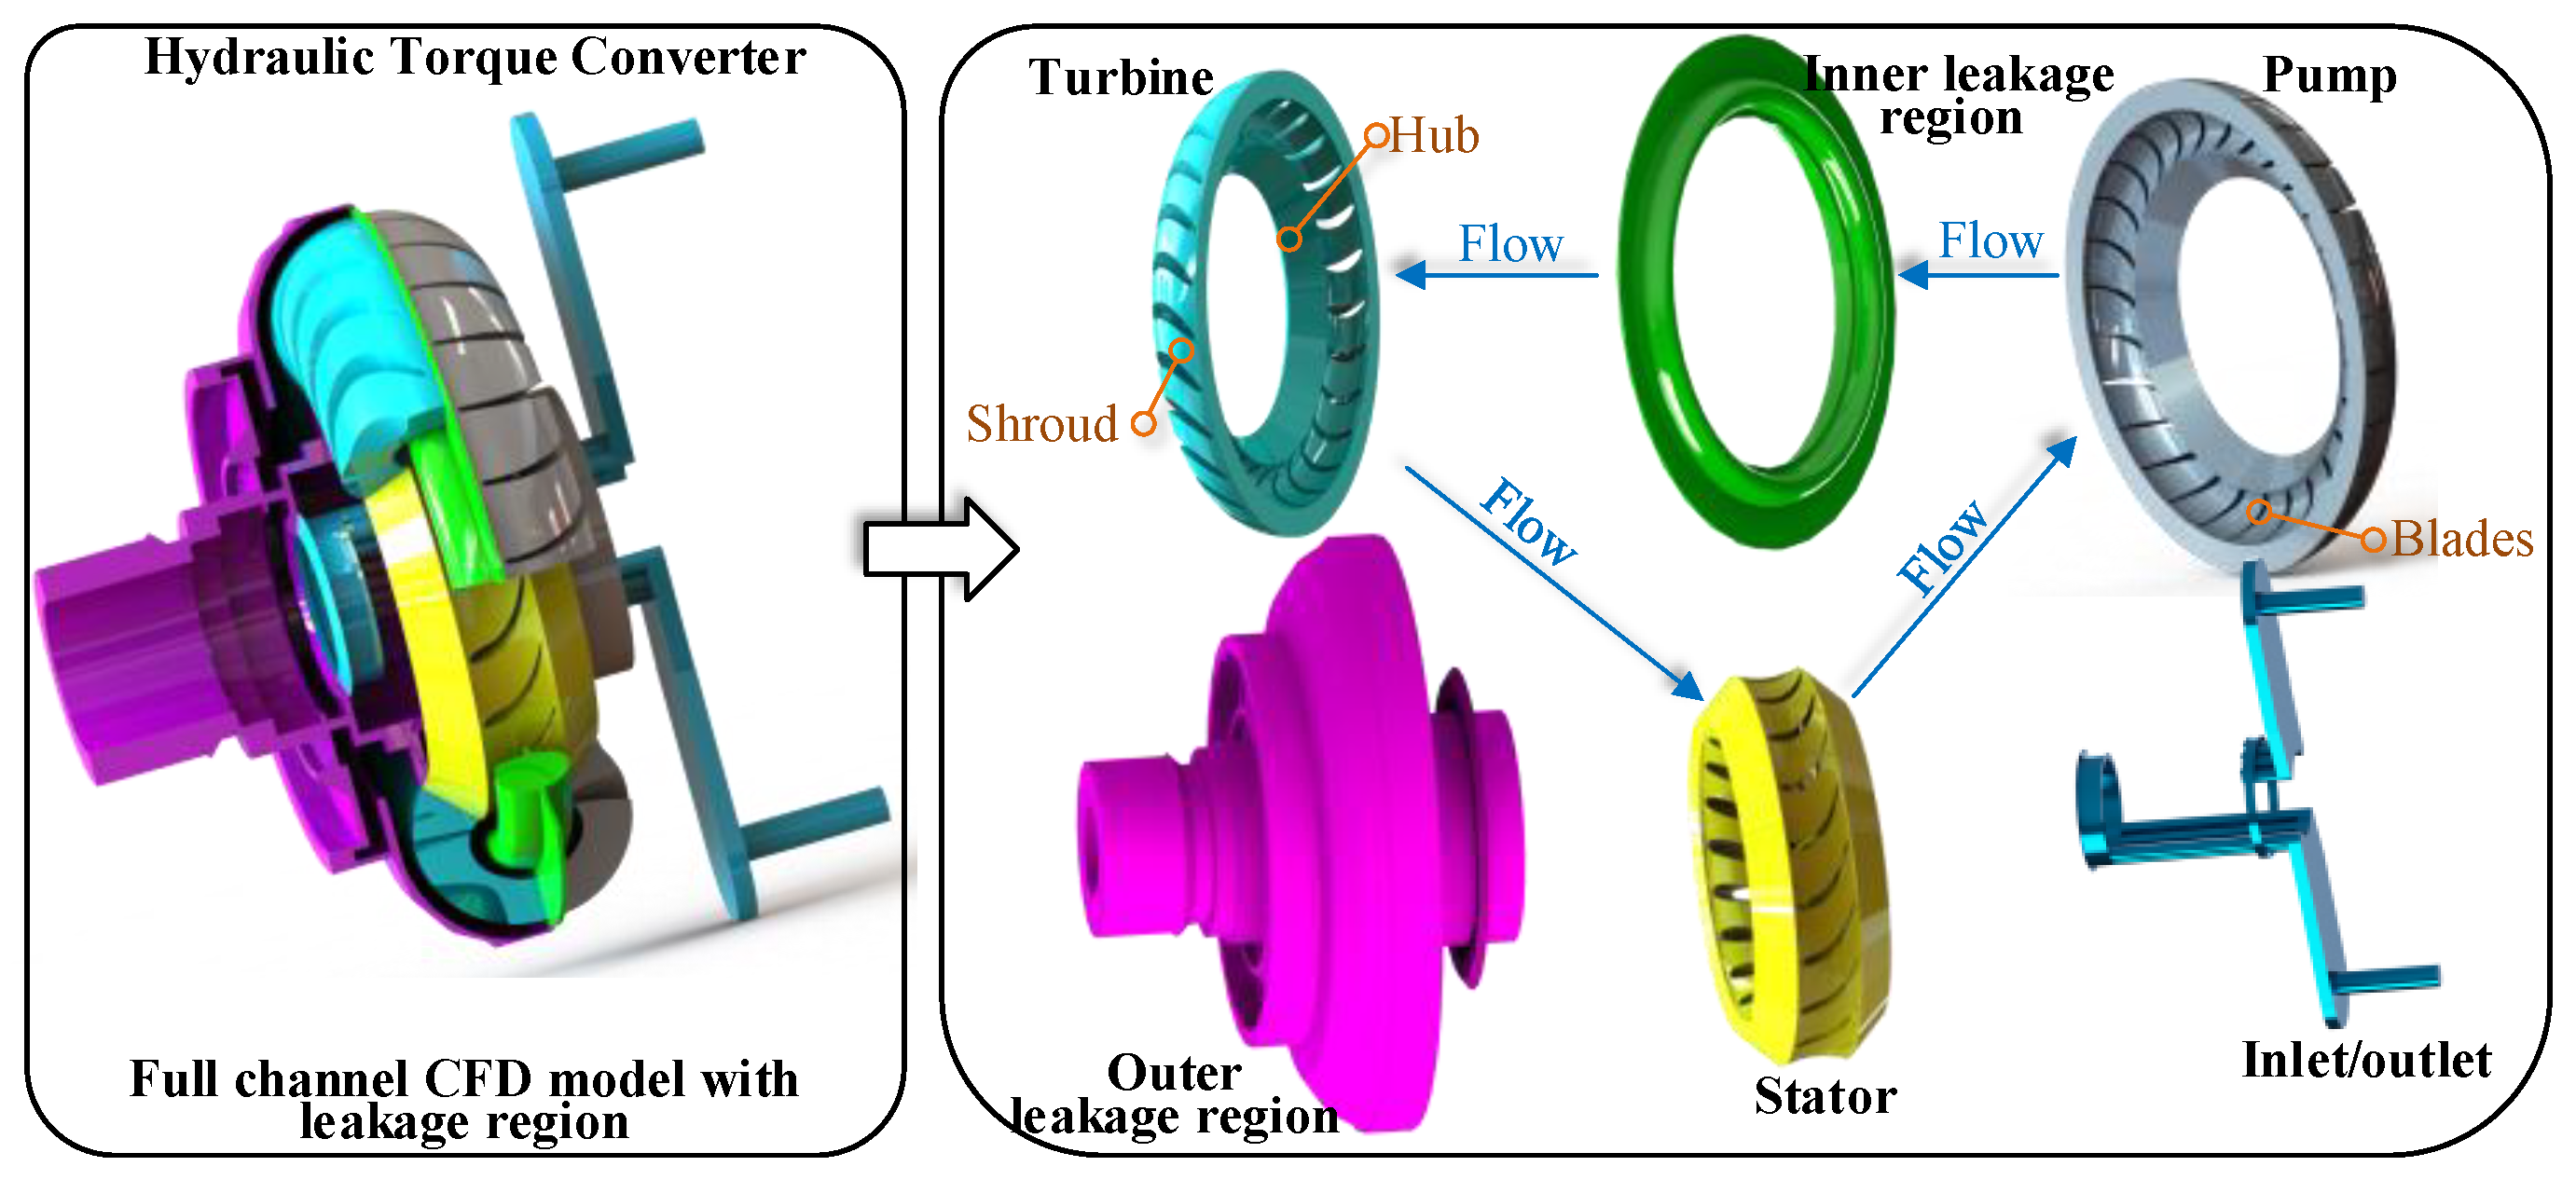
2.1. CFD Model and Boundary Settings

In the model configuration, given the presence of both stationary and rotating states, interfaces between adjacent flow domains are established as frozen rotor models, facilitating comprehensive data transfer across different flow domains. The remaining surfaces within the flow domain are set as non-slip smooth walls, assuming the velocity of the fluid layer directly in contact with the boundary is equal to the corresponding boundary’s velocity [27]. The shear stress transfer turbulence model (SST) [28] is employed to calculate boundary layer flow and the resulting flow separation. Steady-state characteristics of the hydraulic torque converter’s internal flow field are obtained using a steady-state computational fluid dynamics (CFD) approach. To ensure computational accuracy, a high resolution is adopted as the advection scheme, which uses a special nonlinear recipe for each node, computed to be as close to 1 as possible without introducing new extrema. The detailed settings of the CFD model are presented in Table 1 [29].
The inlet and outlet boundaries of the hydraulic torque converter’s CFD model are configured according to the charging oil conditions during testing; the inlet is a static pressure boundary, while the outlet is a flow rate condition. The pump speed is set to NP = 1800 rpm, the turbine speed is 5 rpm, and the stator remains stationary. This operating condition represents the starting condition with a speed ratio (SR) of 0.

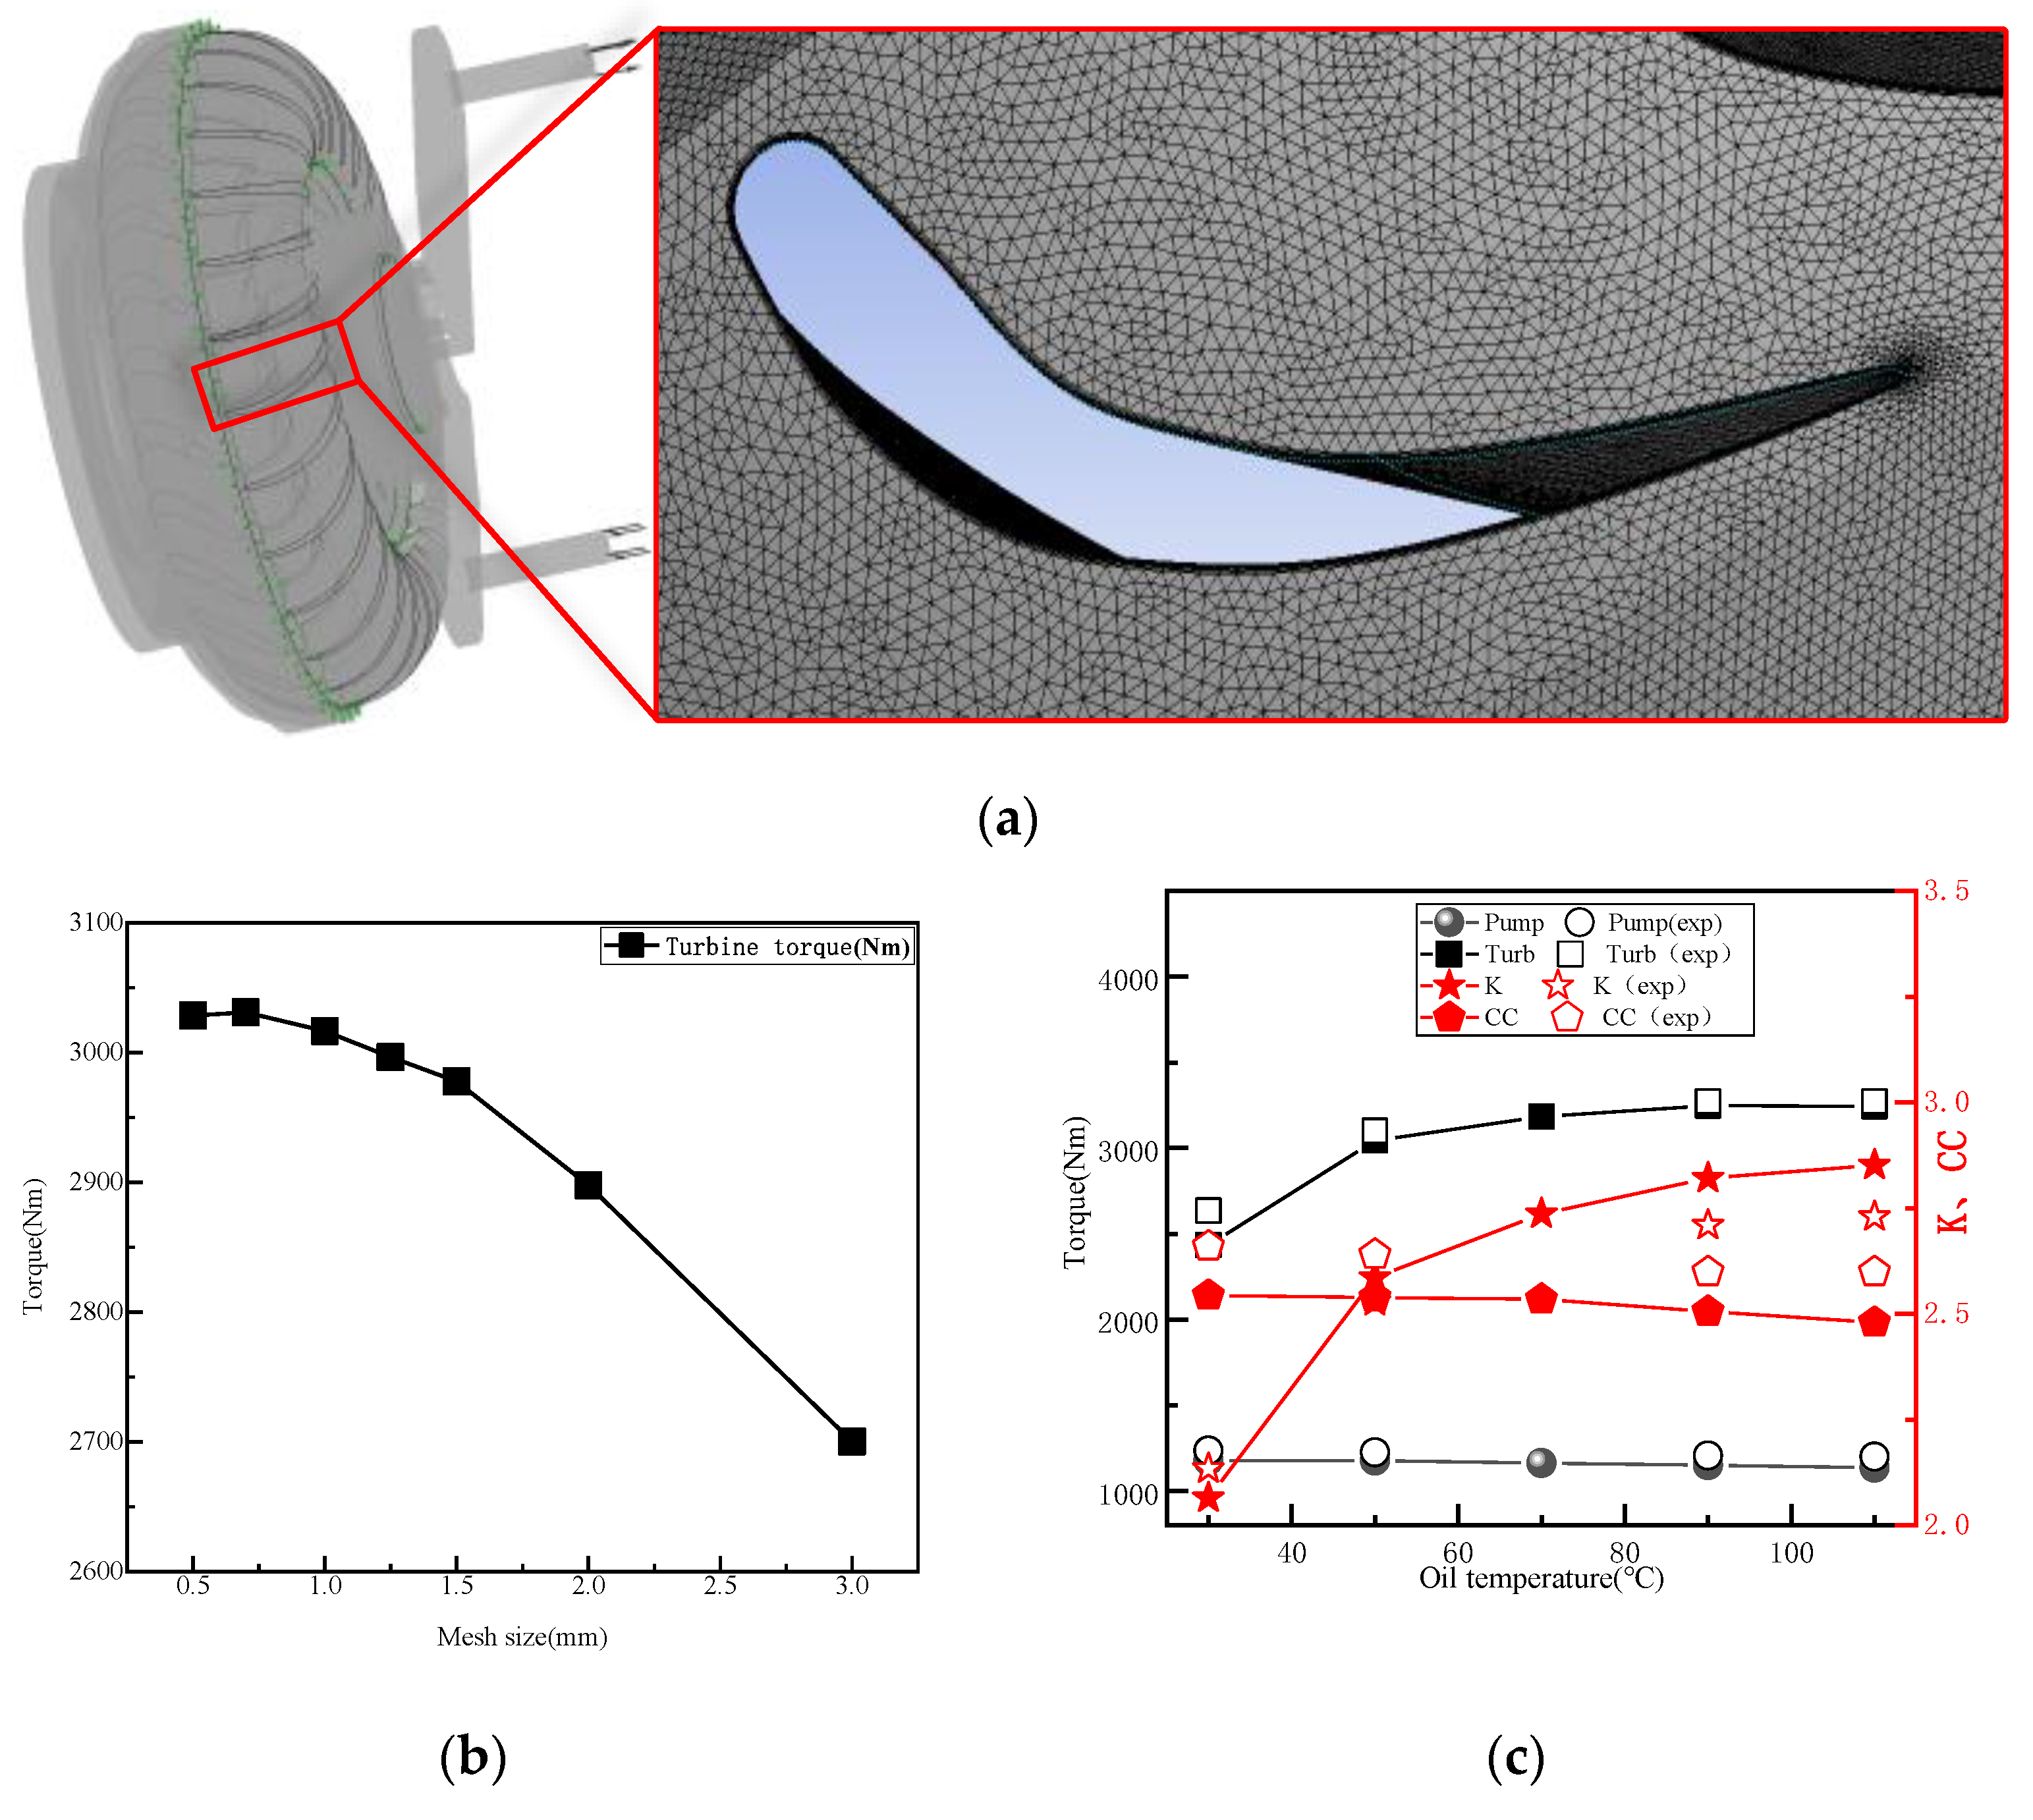
2.2. Mesh Independence Analysis and Model Accuracy Verification

The flow domain grid utilizes an unstructured tetrahedral grid, with grid independence analysis performed at various grid sizes to ultimately determine the grid size, as depicted in Figure 3a. The global grid size is set to 1 mm for the impeller and leakage area flow domains, while a 2 mm global grid size is designated for the inlet and outlet flow domains. As indicated by the independence analysis, by continually reducing the grid size, the calculation result variation rate remains below 3%. Subsequently, a boundary layer grid refinement is conducted on the blade surface with a minimum size of 0.003 mm and eight layers, resulting in a final total grid count of approximately 6.1 × 10⁷. Numerical results reveal that the average values of the complex blade geometry’s near-wall faces are below 2.
Torques for the pump (TP), turbine (TT), and stator (TS) are extracted from the numerical results. A comparison of the torque ratio (K) and energy capacity coefficient (CC) tests and simulations is conducted for different impeller speeds during the starting condition, as shown in Figure 3b, in order to verify the model’s accuracy. The results indicate that the simulation error for the hydraulic torque converter’s performance parameters in the CFD results is within 10%, demonstrating the model’s credibility.

3. The Axial Force Testing System of the Hydraulic Torque Converter

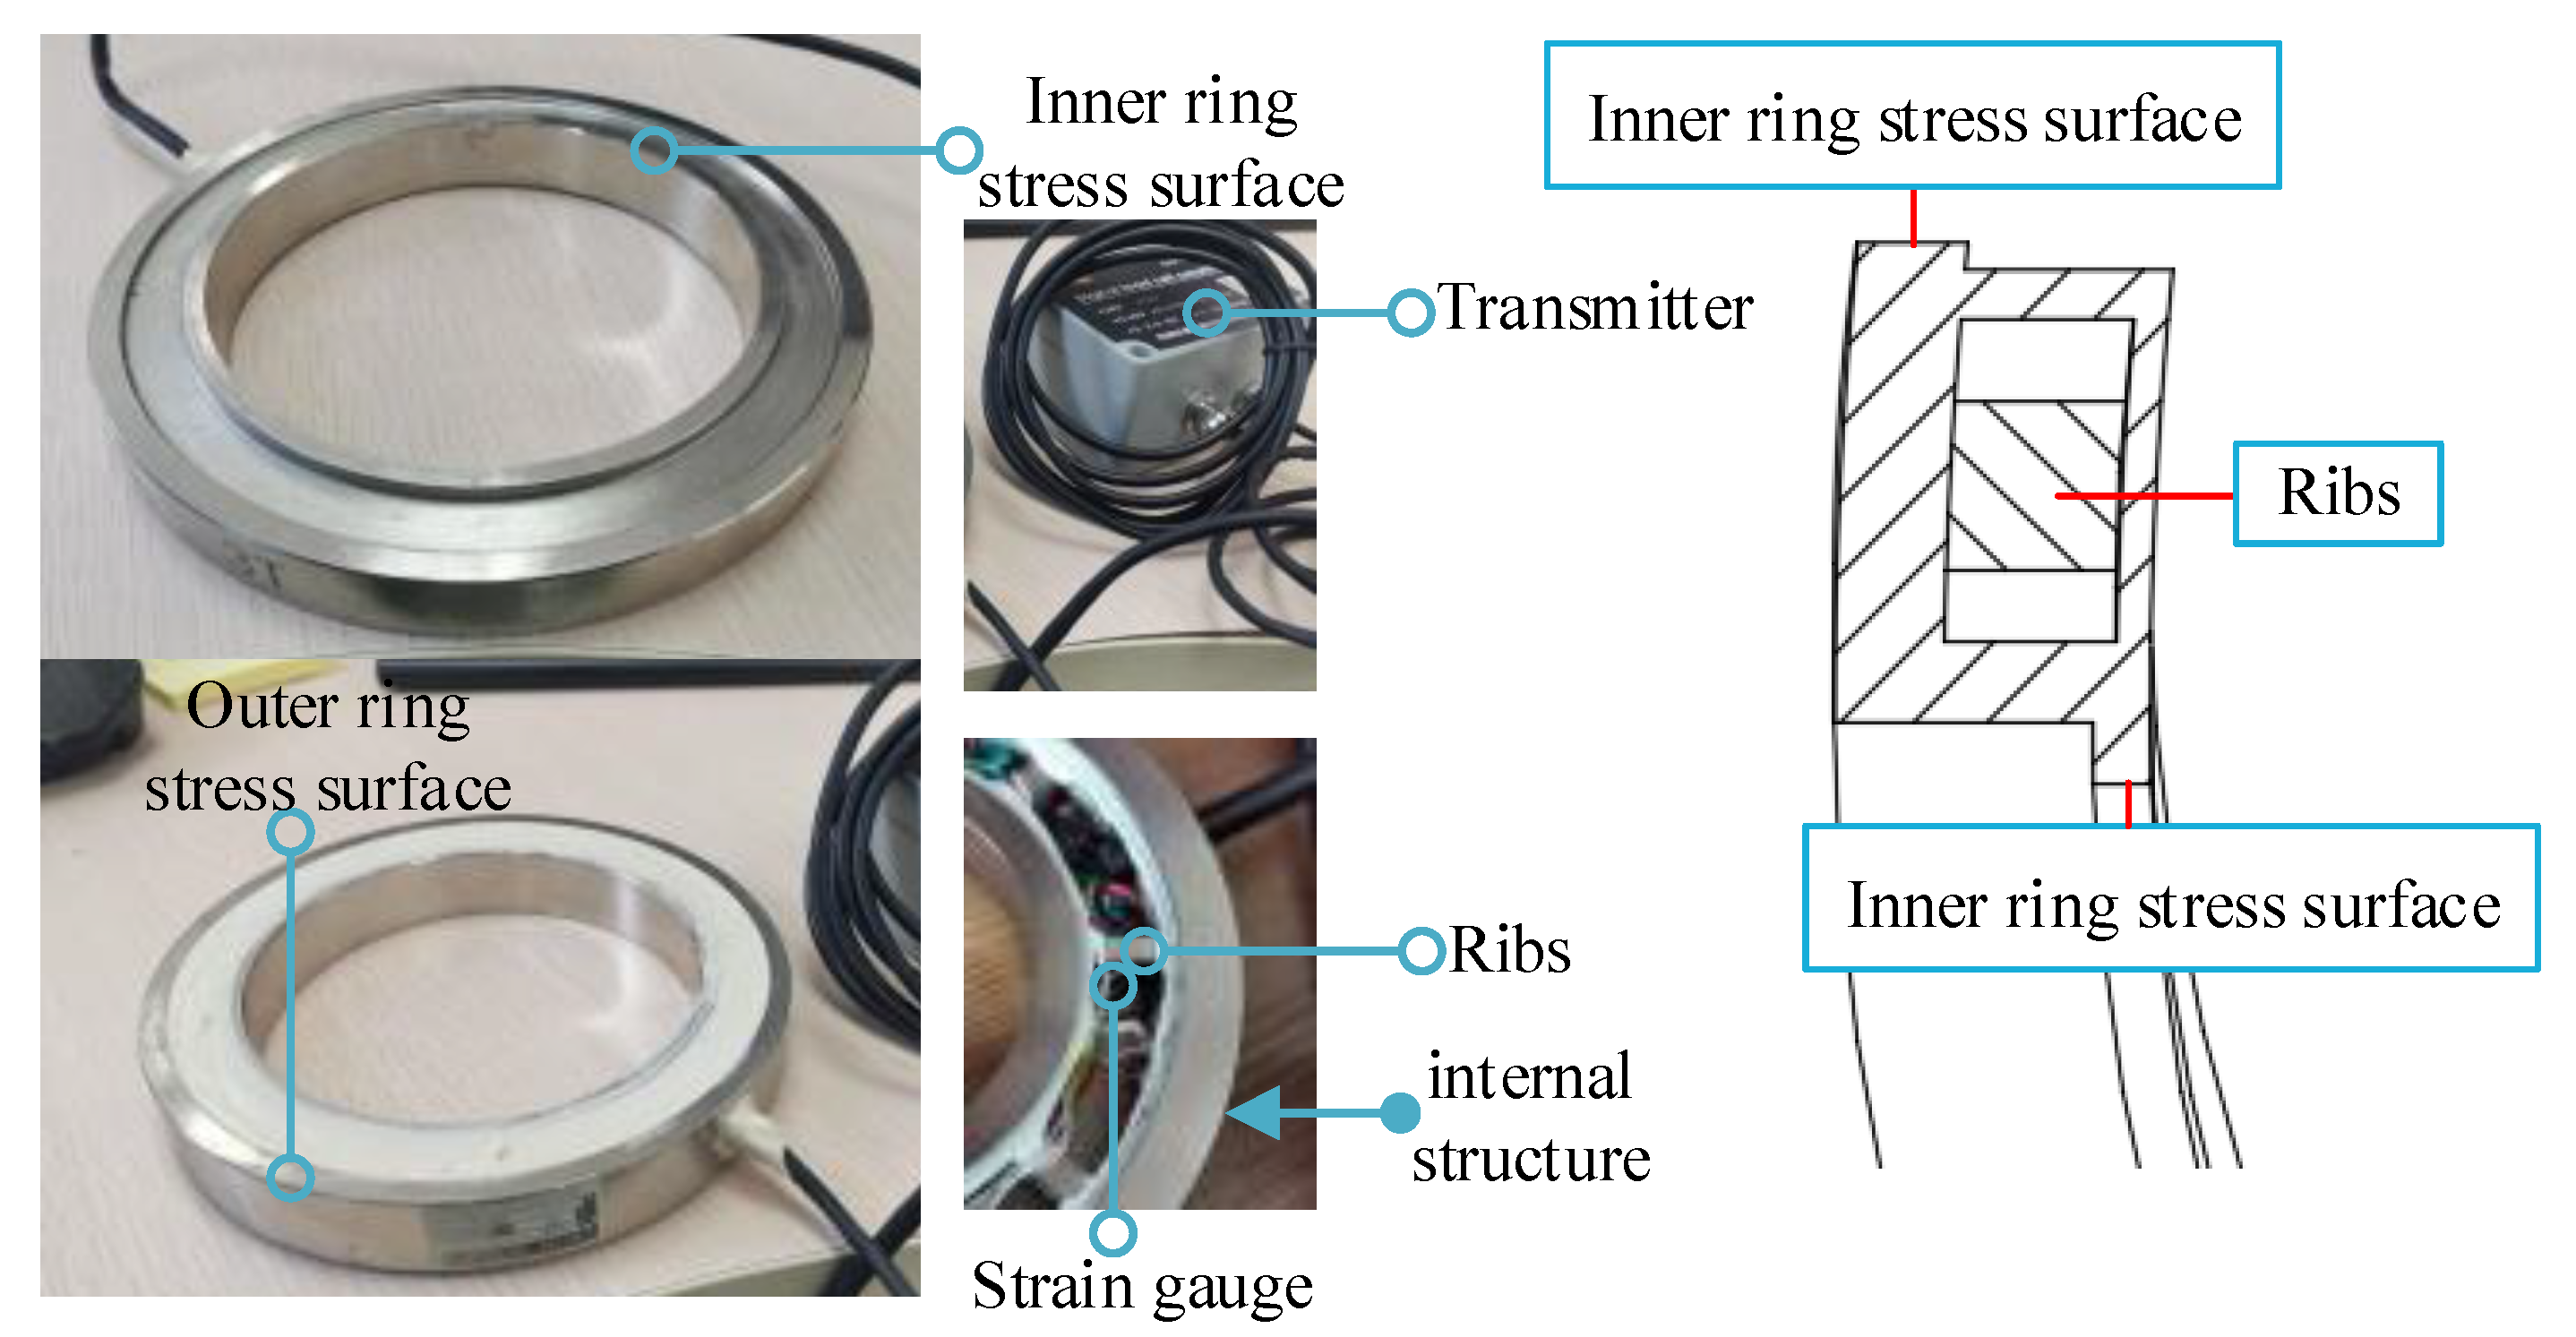
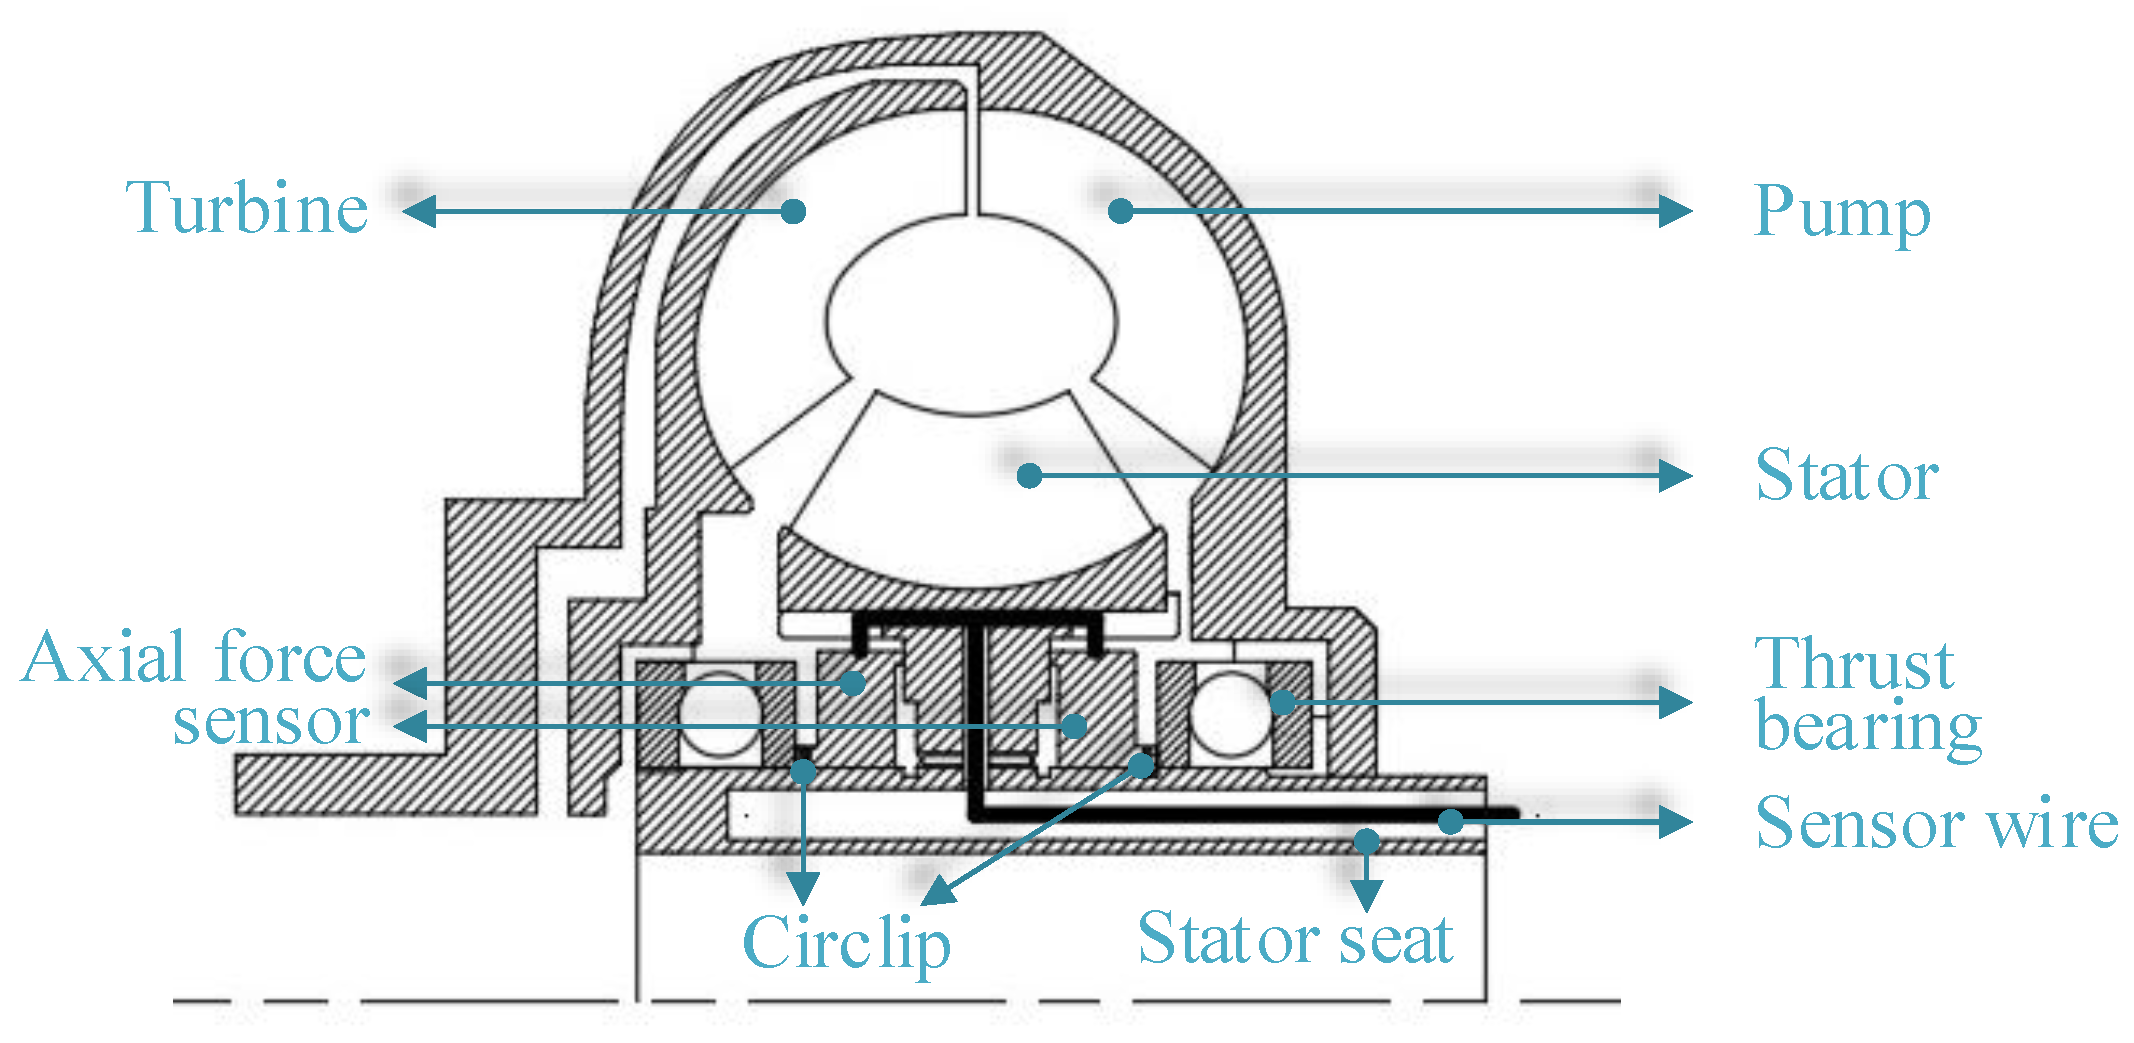
3.1. The Testing Method for Axial Forces

The structure and operating principle of axial force sensors are shown in Figure 4. The axial force sensor features a ring structure, facilitating easy installation on the shaft. Inside the sensor, multiple ribs with attached strain gauges connect the inner and outer rings. Both the inner and outer rings have a convex circular ring to bear the axial force, resulting in the deformation of the ribs. The full bridge circuit, comprised of strain gauges, converts force data into strain output voltage signals, ultimately yielding accurate axial force data, as illustrated in Figure 4. The axial force sensor has an input voltage range of 0–12 V, an output range of 0–5 V, a measurement range of 0–30,000 N, and an error of 0.1% FS.
As shown in Figure 5, two axial force sensors are installed on the stator seats on both sides of the stator, while multiple elastic retaining rings are mounted on the stationary stator seat. This testing scheme can measure the axial force of different impellers by using different installation methods for the circlip. The installation method of the circlip in Figure 5 can measure the axial force of the stator. The axial force of the stator is transmitted to the axial force sensor, and the other side of the sensor is supported by the circlip. At this time, the force received by the sensor can be considered the axial force of the stator. Changing the installation method of the circlip can measure the axial force of the pump and turbine.

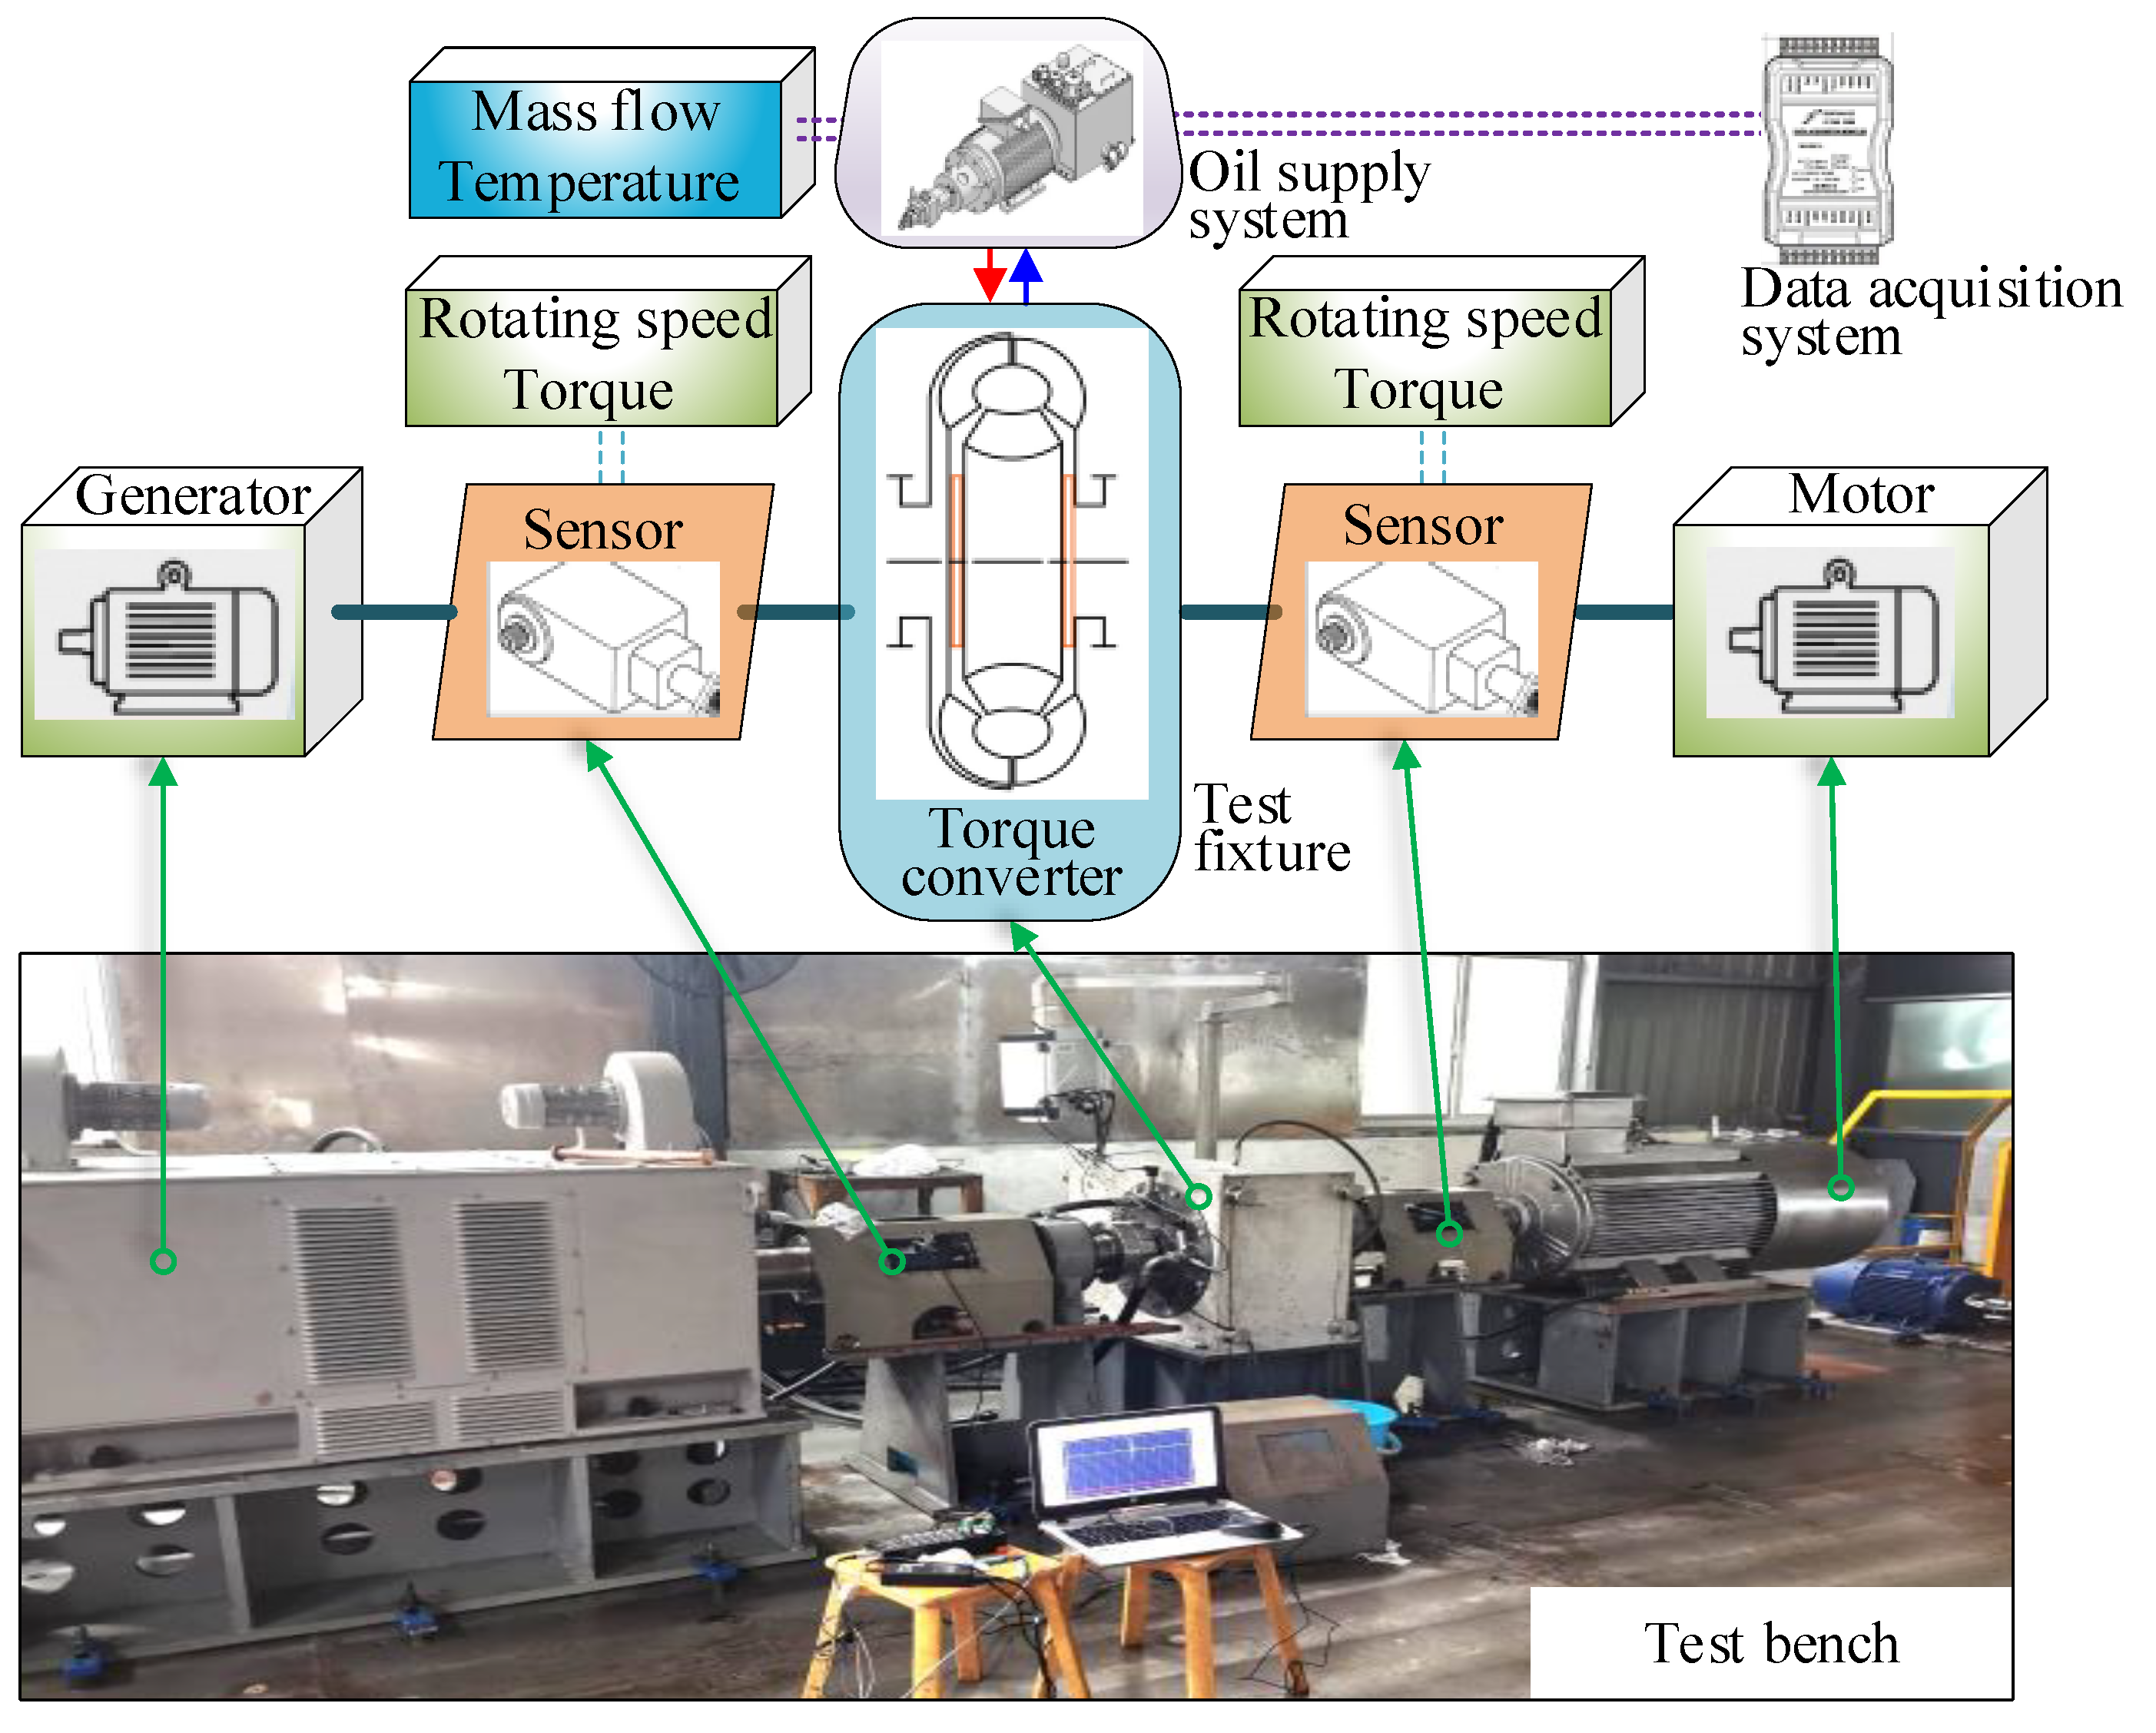
3.2. Hydraulic Torque Converter Axial Force Test Bench

The hydraulic torque converter axial force test bench can simulate the normal operating conditions of the converter, with a driving unit consisting of a 250 KW motor and a 315 KW Generator for the load unit. Speed and torque sensors are installed at the input and output ends of the torque converter, with maximum ranges of 5000 rpm and 3000 Nm, respectively. Flow, pressure, and temperature sensors are installed at the inlet and outlet of the torque converter housing.
During the test, speed and speed ratio conditions are achieved by controlling the driving motor and loading motor speeds. The supplementary oil pressure (0.3–1.2 MPa) and operating temperature are controlled by the hydraulic pump station, as shown in Figure 6.

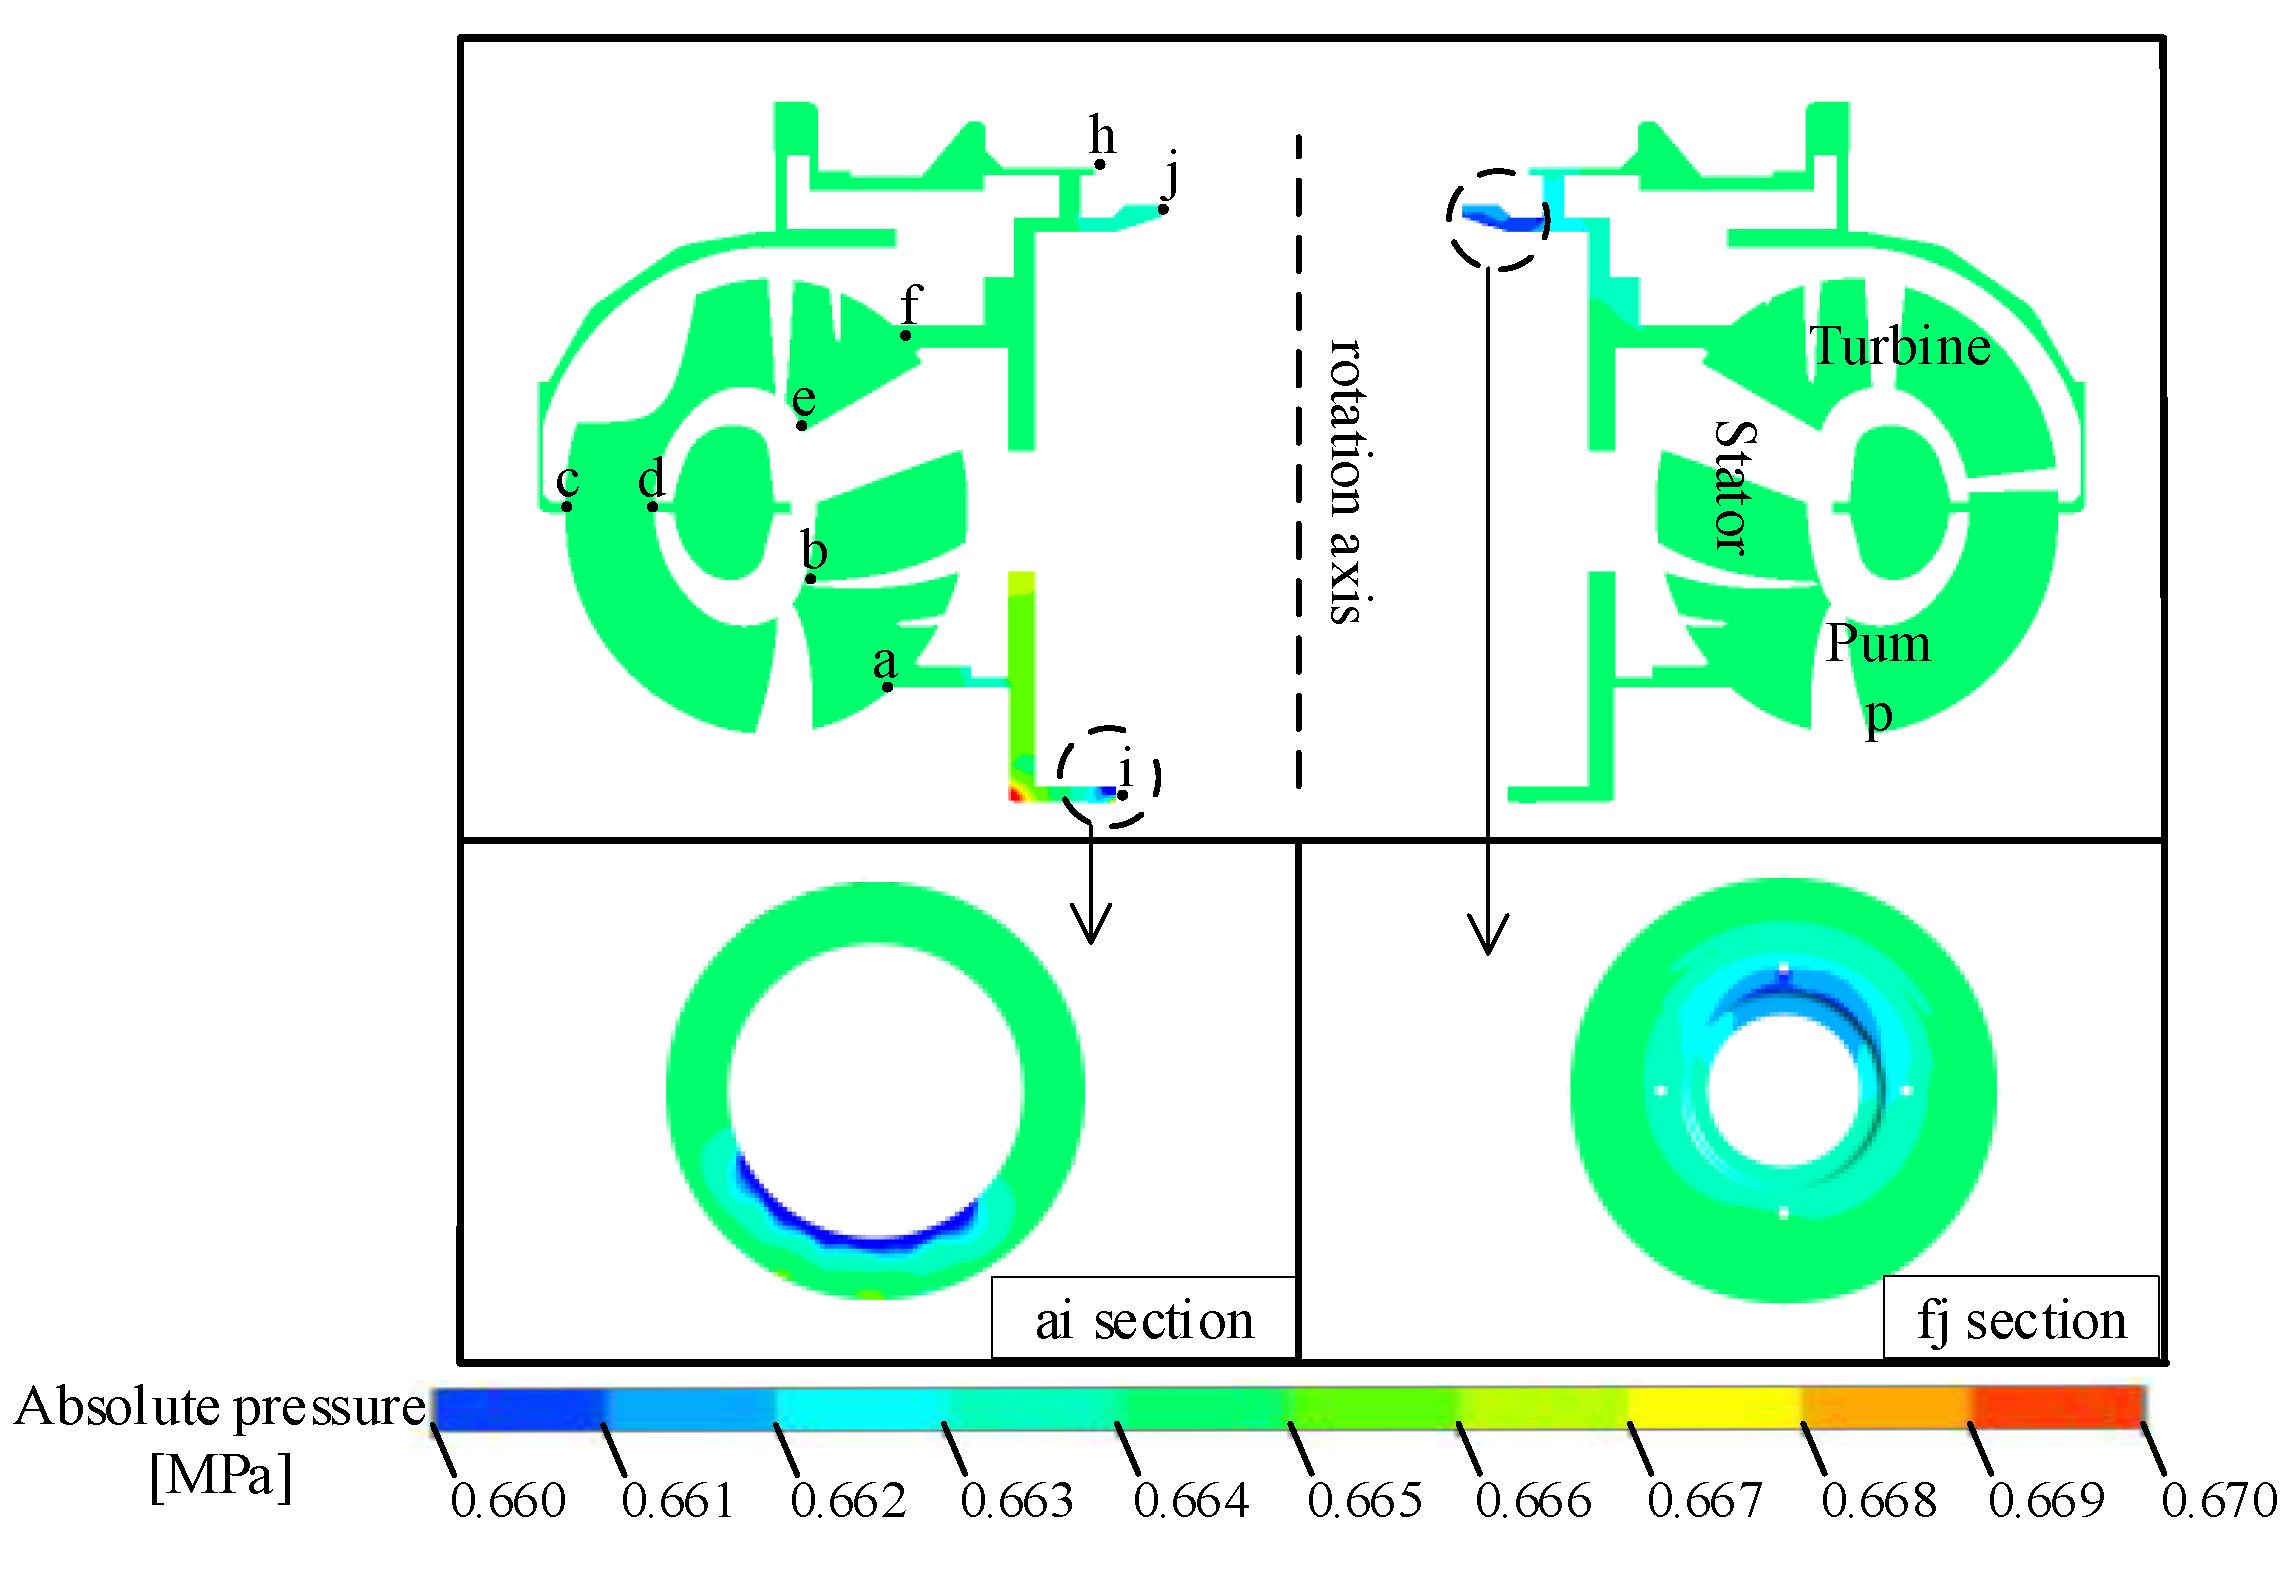
4. The Influence Mechanism of Charging Oil on Axial Force

The supply system determines the inlet pressure and temperature of the hydraulic torque converter. The inlet pressure affects the pressure distribution in the converter’s flow field, significantly impacting the axial force as a whole. Changes in temperature alter the properties of the working fluid, such as viscosity and density, which greatly influence the axial force and the external characteristics of the torque converter.

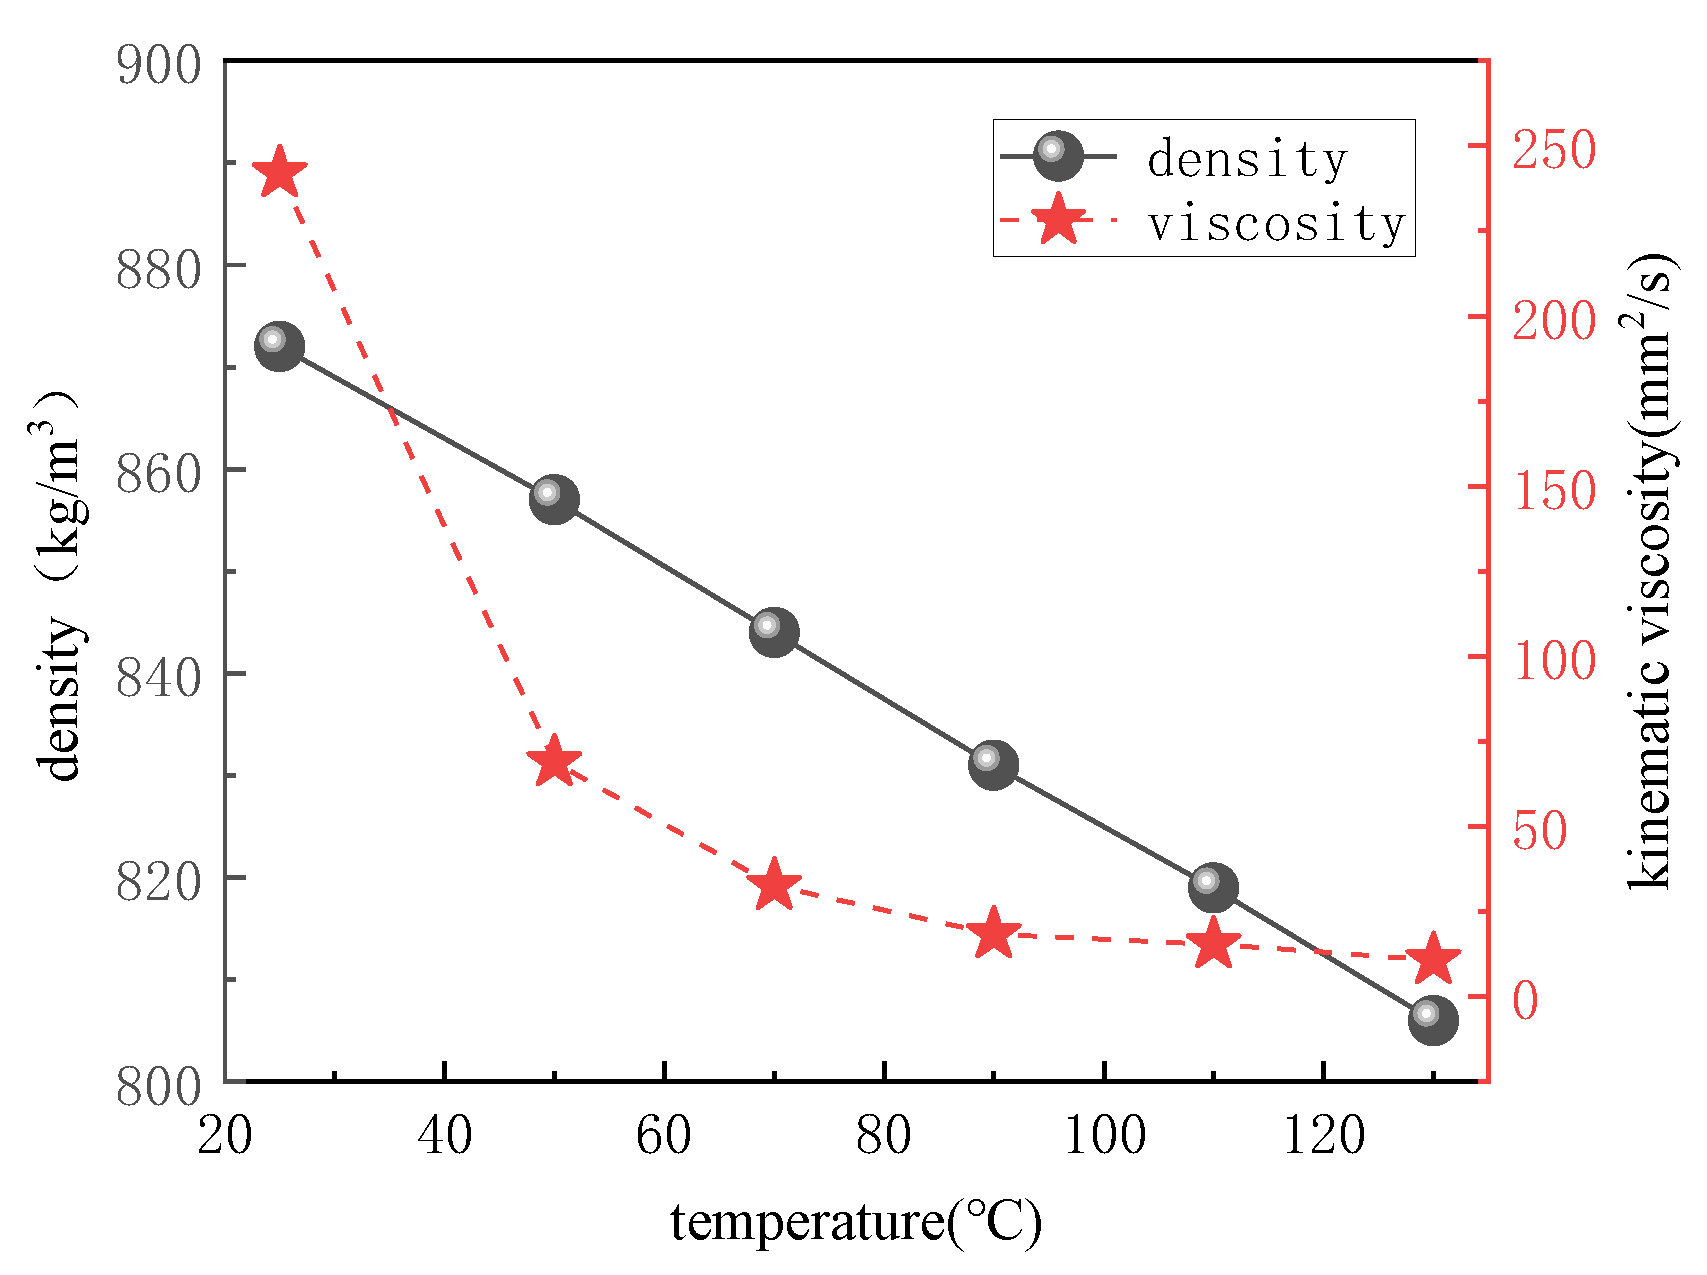
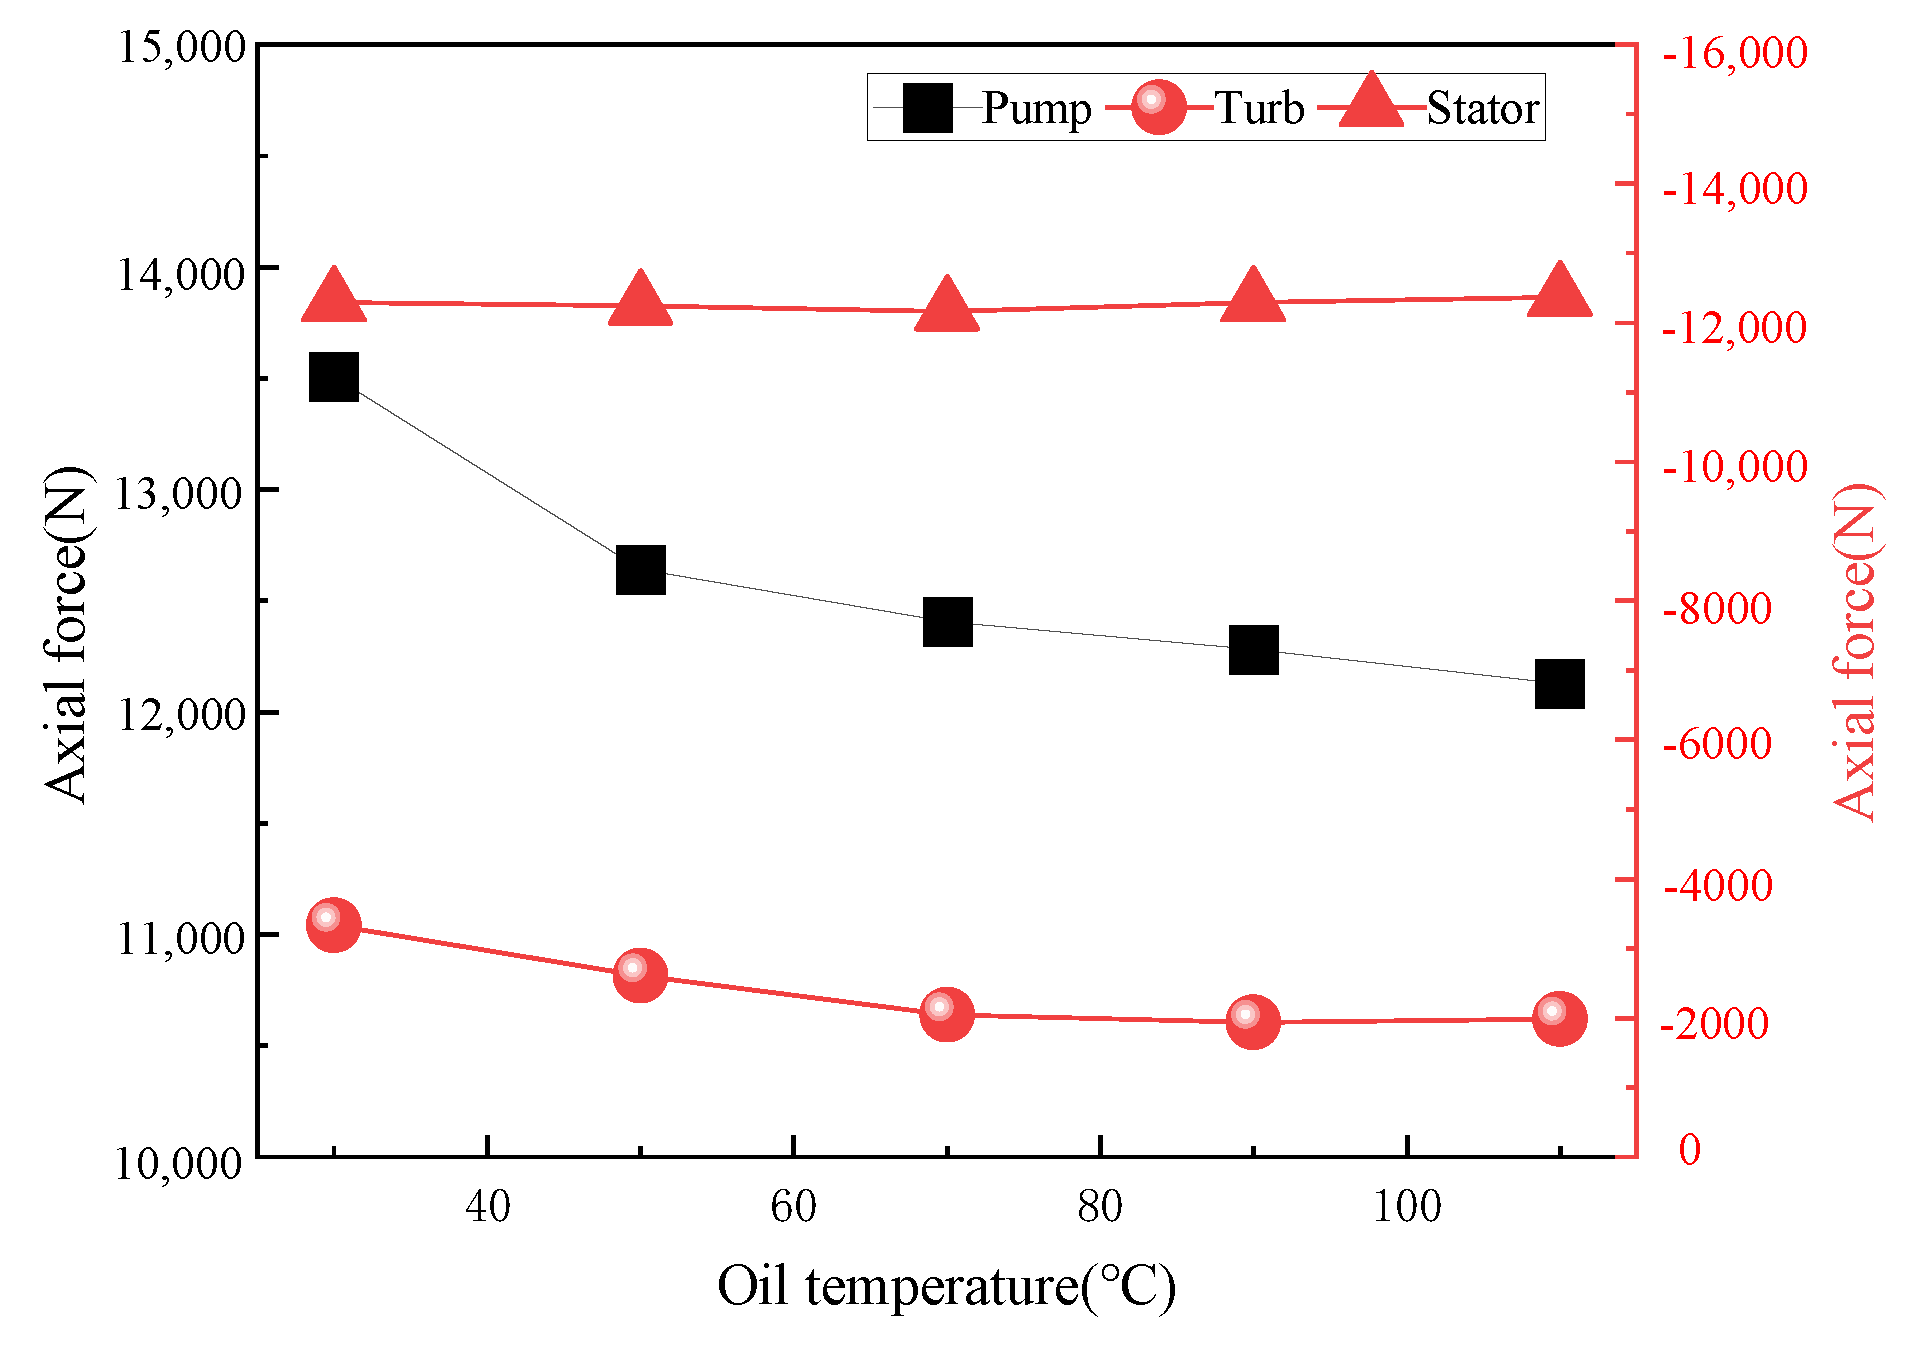
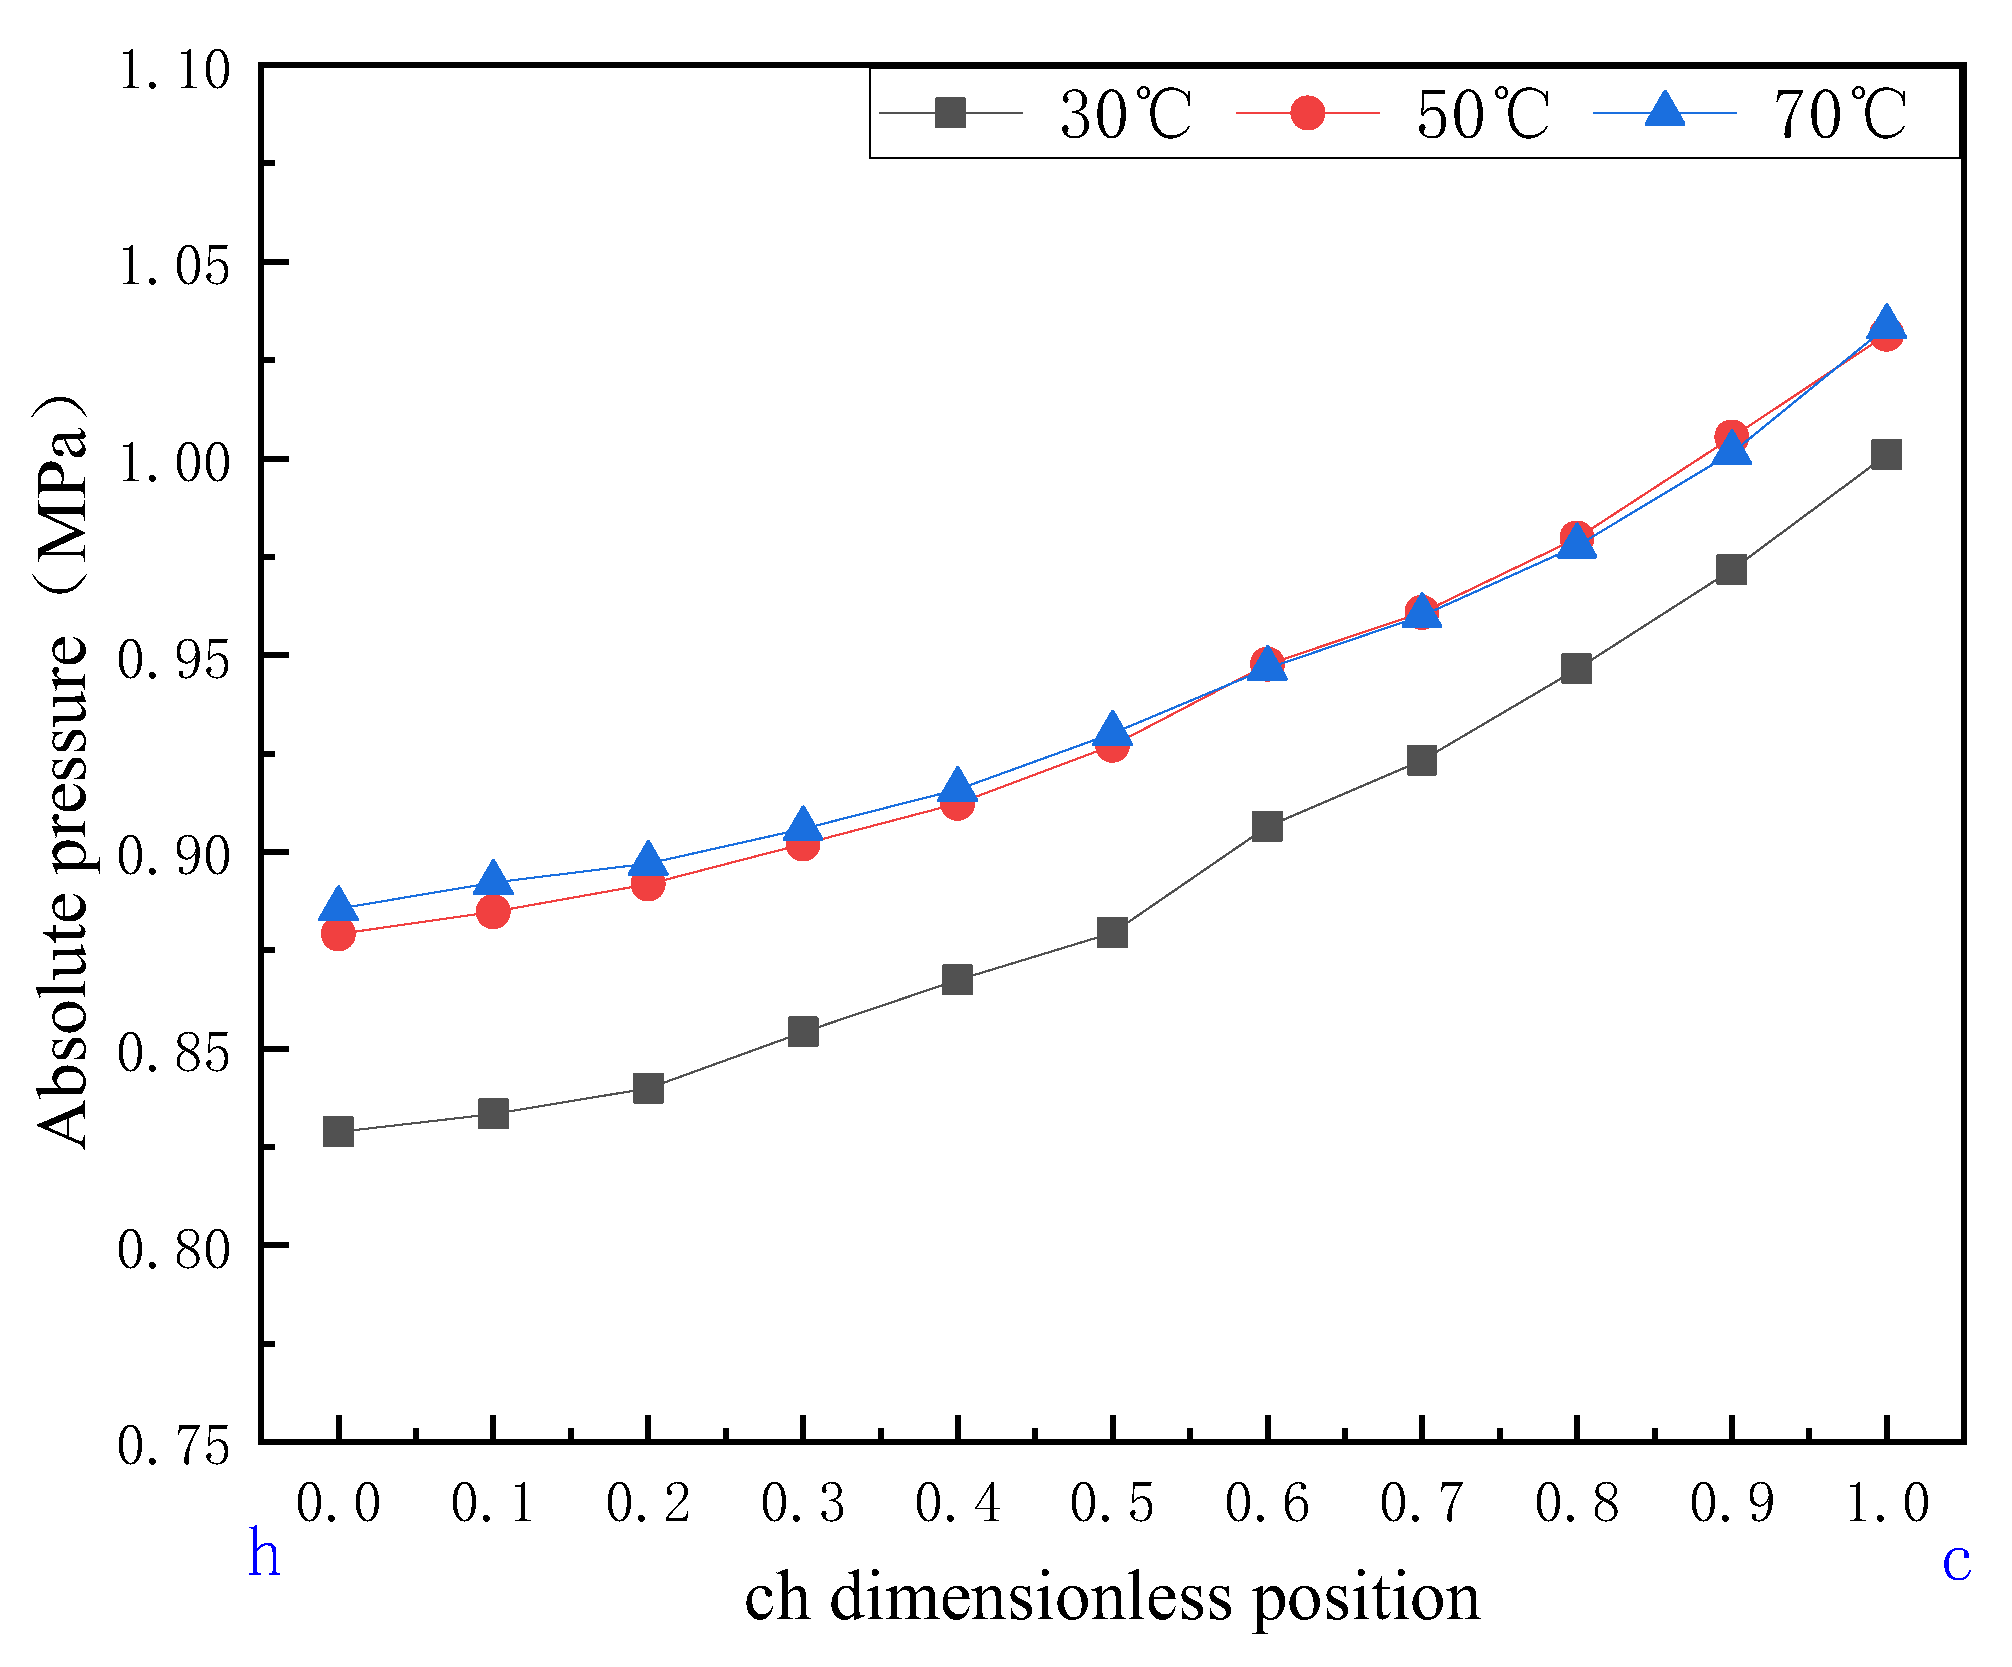
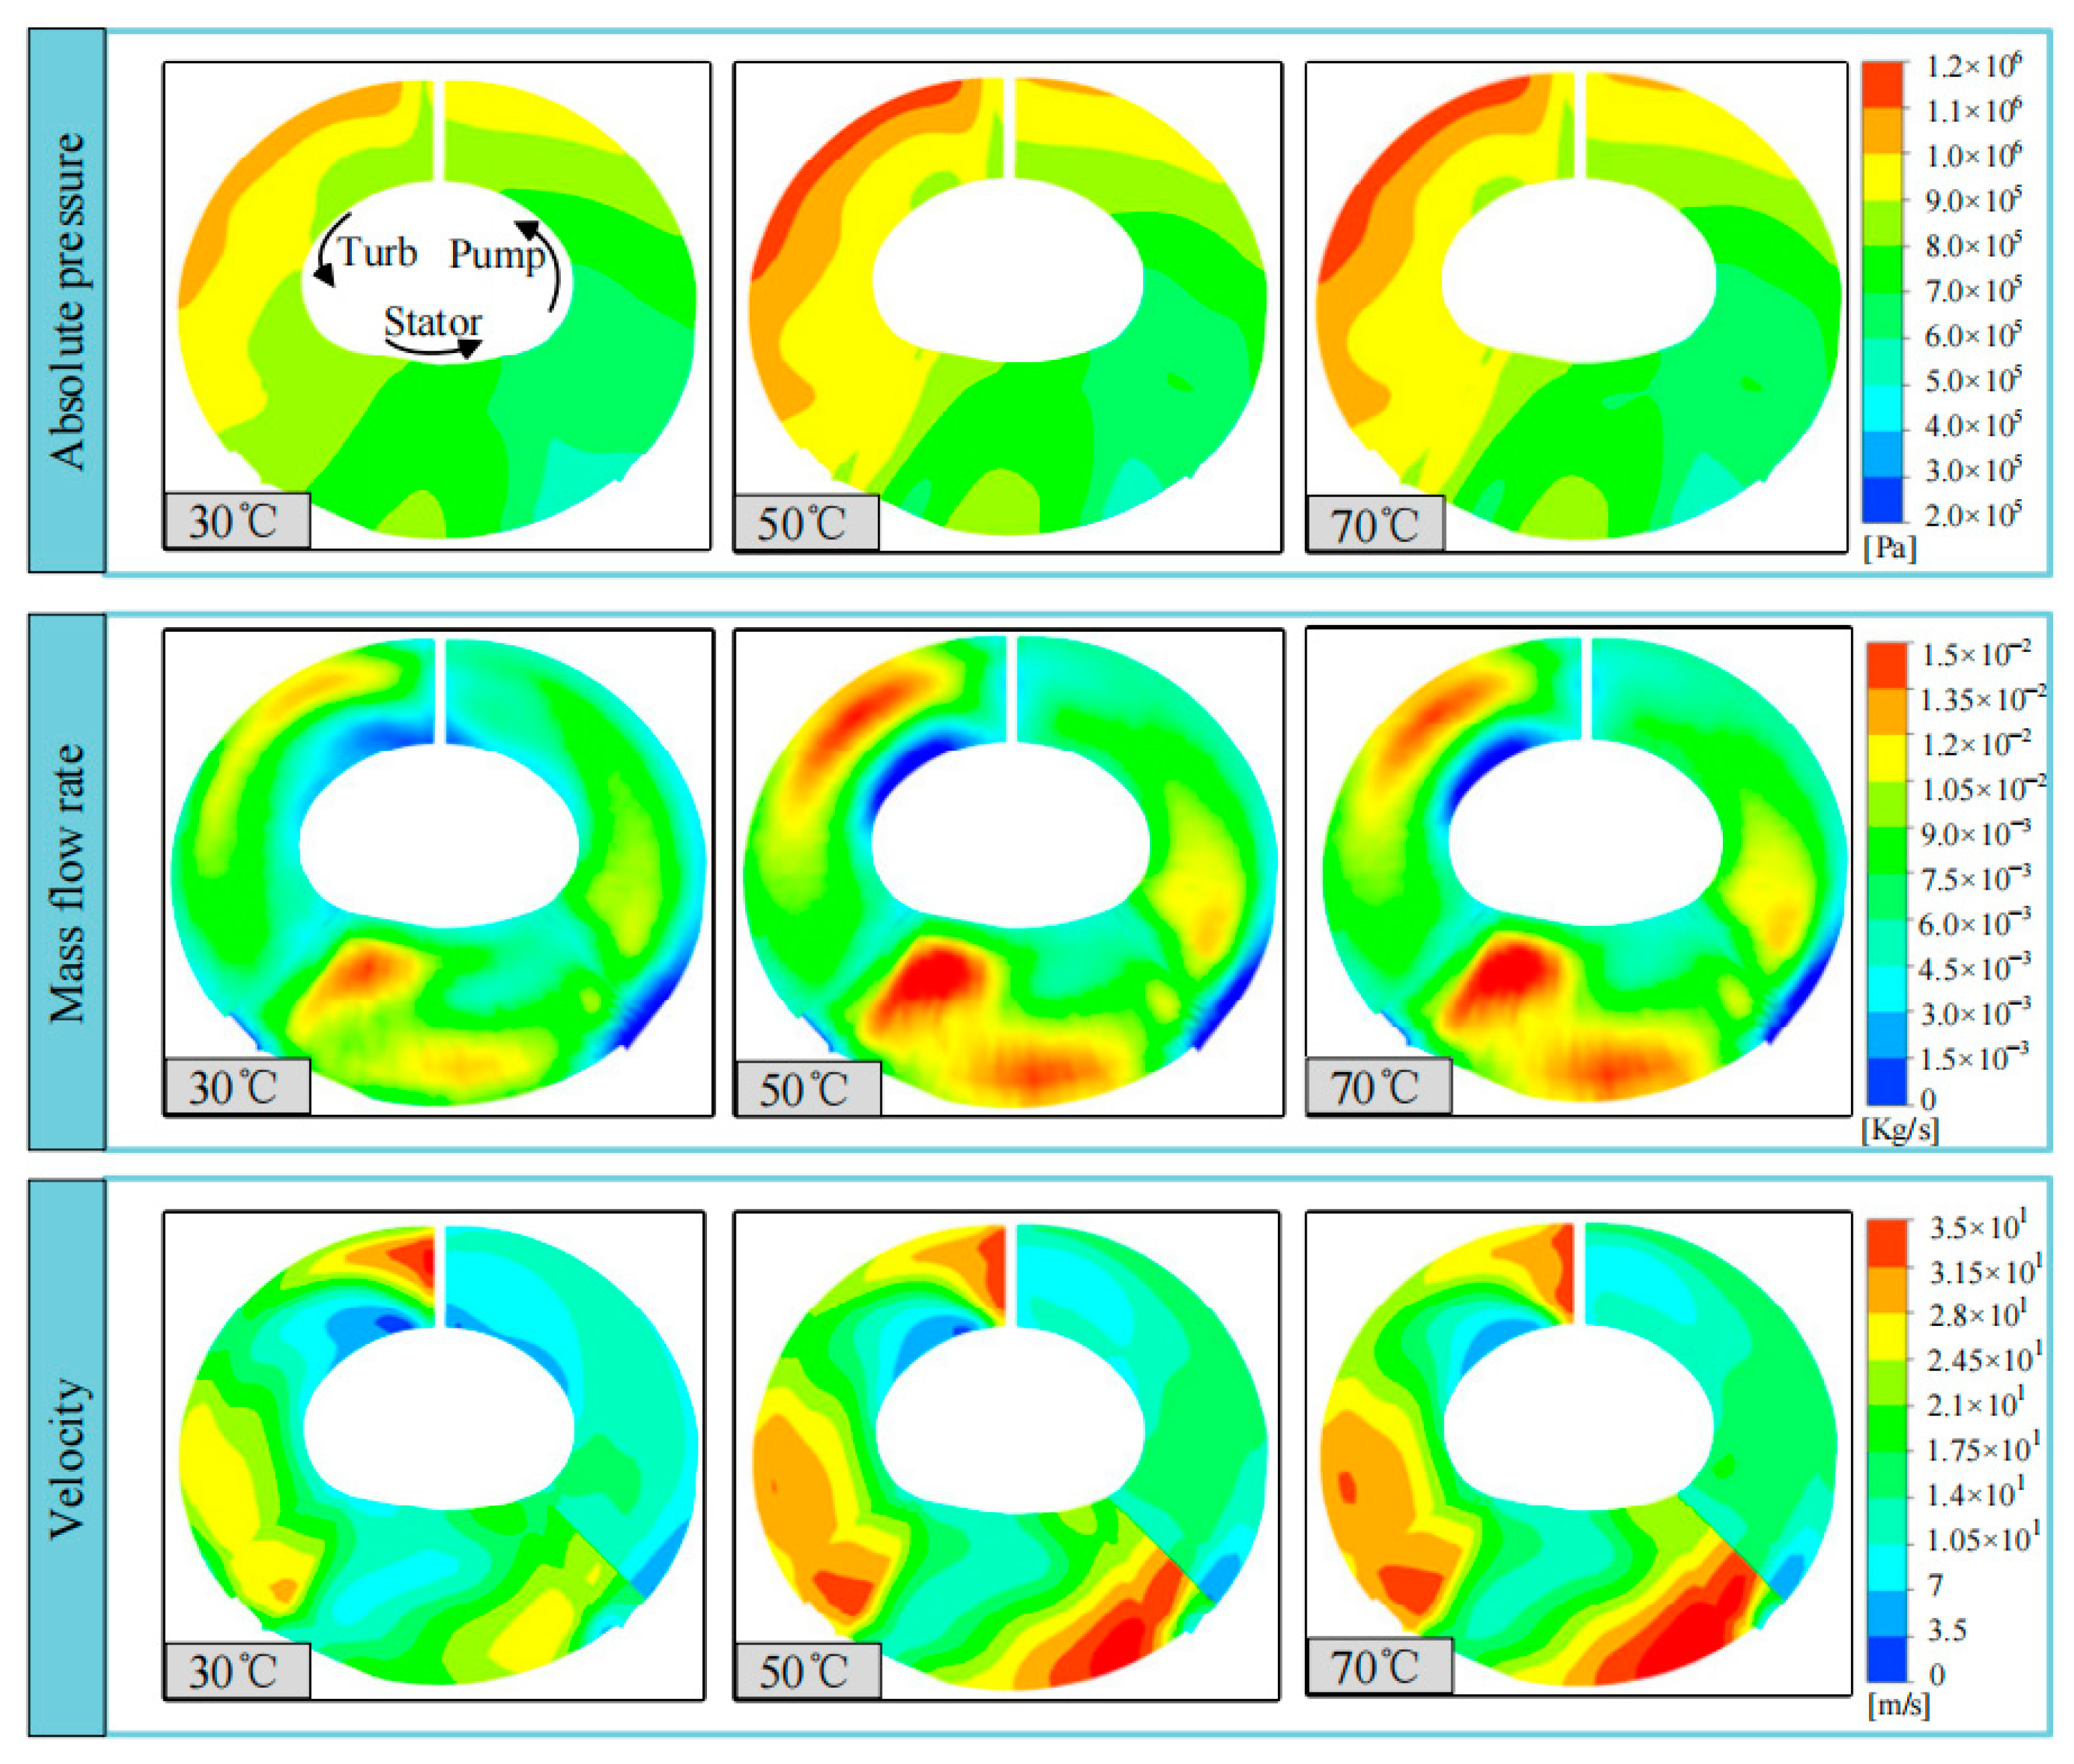
4.1. Axial Force at Different Temperatures

Figure 7 shows the viscosity and density change curves of 15W-40 oil at different temperatures as measured in the experiment. It can be observed that as the working temperature increases, the viscosity and density of the oil gradually decrease, with the viscosity decreasing more rapidly at lower temperatures [30]. The impeller axial force changes under starting conditions when the pump speed is 1800 rev/min, as shown in Figure 8. In this study, the positive direction of axial force is defined as the direction from the pump to the turbine, while the opposite direction is considered negative (Figure 1).
The results show that the pump axial force is positive, while the turbine and stator axial forces are negative. The pump axial force is most affected by temperature, followed by the turbine, while the stator axial force is barely affected by temperature. In addition, the axial forces of the pump and turbine both decrease as the temperature increases, with a more rapid decline at lower temperatures and a tendency to stabilize at higher temperatures.
According to the schematic diagram of the hydraulic torque converter (Figure 1), the axial force can be decomposed. The subscripts P, T, and S represent the pump, turbine, and stator, respectively, while the superscripts represent different positions, such as bl for the blade, hub for the inner, sh for the outer ring, and in for the internal leakage region. The axial force is expressed as
F P = F P b l + F P h u b + F P s h + F P i n + F P c h + F P a i F T = F T b l + F T h u b + F T s h + F T i n + F T c h + F T f j F S = F S b l + F S h u b + F S s h + F S a i + F S f j .
Taking the ch section as an example, the pressure change trends at different temperatures for the non-dimensional position are shown in Figure 9. The pressure change trends are similar at different temperatures, with the overall pressure increasing as the temperature rises and approaching stability above 50 °C. Figure 3c indicates that as the temperature increases, the torque ratio also increases, enhancing the “stirring capability” of the pump. Therefore, temperature changes do not affect the simple circumferential flow pattern within the ch section but rather affect the pressure at point c at the pump outlet, thereby influencing the pressure distribution in the leakage area.
Figure 10 illustrates the distribution of absolute pressure, mass flow rate, and flow velocity in the axial flow plane within the torque converter. It can be observed that at low temperatures, the pressure gradient is relatively small, with high pressure occurring at the impeller outlet and turbine inlet. As the temperature increases, the high-pressure region begins to appear on the outer ring of the turbine, while the low-pressure region emerges in the guide vane area. Additionally, the pressure distribution gradient increases with rising temperature. Furthermore, the mass flow rate of the oil increases as the temperature rises, with substantial changes at low temperatures. When the temperature exceeds 60 °C, the mass flow rate distribution stabilizes, with its peak value appearing at the inlet of the guide vane and turbine.
From Figure 10, it can be seen that at low temperatures, the oil has a high viscosity, low flow velocity, and low mass flow rate, resulting in lower impact force/pressure on the wall at the same position. As the temperature increases, the viscosity of the oil decreases, the flow velocity direction remains unchanged but the value increases, and the flow field pressure gradually increases and stabilizes. Moreover, compared to the trend of density changes, the changing pattern of viscosity due to increased temperature is more consistent with the changes in flow field pressure, flow velocity, and mass flow rate. Therefore, it can be concluded that the impact of temperature on axial force is mainly caused by viscosity.
To explore the reason why each part generates an increased axial force but the total axial force decreases, the pressure sensitivity is defined as
σ t 1 ~ t 2 = P t 2 P t 1 t 2 t 1 ,
where t2 and t1 are the oil supply temperatures and Pt1 and Pt2 are the average pressures of each part when the oil supply temperature is t2 and t1.
Figure 11 illustrates the pressure sensitivity of various parts of the pump. The average pressure rises most sharply at the working temperature of 30 °C to 50 °C, and the axial forces of each part also increase rapidly. Among them, the pressure sensitivity in the inner is the smallest, while the pressure sensitivity in the inner leakage area is the largest. This means that the leftward axial force generated by the pump’s inner has the smallest increase, while the rightward axial force generated by the inner leakage has the largest increase. Therefore, this is reflected in the total impeller axial force as a decrease in the impeller axial force value and a trend to reverse direction (rightward). After 50 °C, the pressure in each part tends to stabilize, and the pressure sensitivity is generally at a relatively low level. Among them, the pressure sensitivity in the ai section is the largest. Compared to other parts, the pressure decreases slightly, and the axial force generated by the ai section changes the least. Thus, this is reflected in the total impeller axial force as a slow decrease in the impeller axial force value and gradual stabilization.
Therefore, for the pump and turbine, the decrease in axial force with increasing temperature is mainly due to the pump’s inner being less sensitive to pressure and the inner leakage area being most sensitive to pressure. At high temperatures, the pressure sensitivity of each part is generally low, so the change in impeller axial force becomes smaller. Meanwhile, the axial force-bearing area of the inner leakage and inner in the stator is small, generating a small axial force. Therefore, the stator axial force is less affected by temperature and remains stable near the initial value.

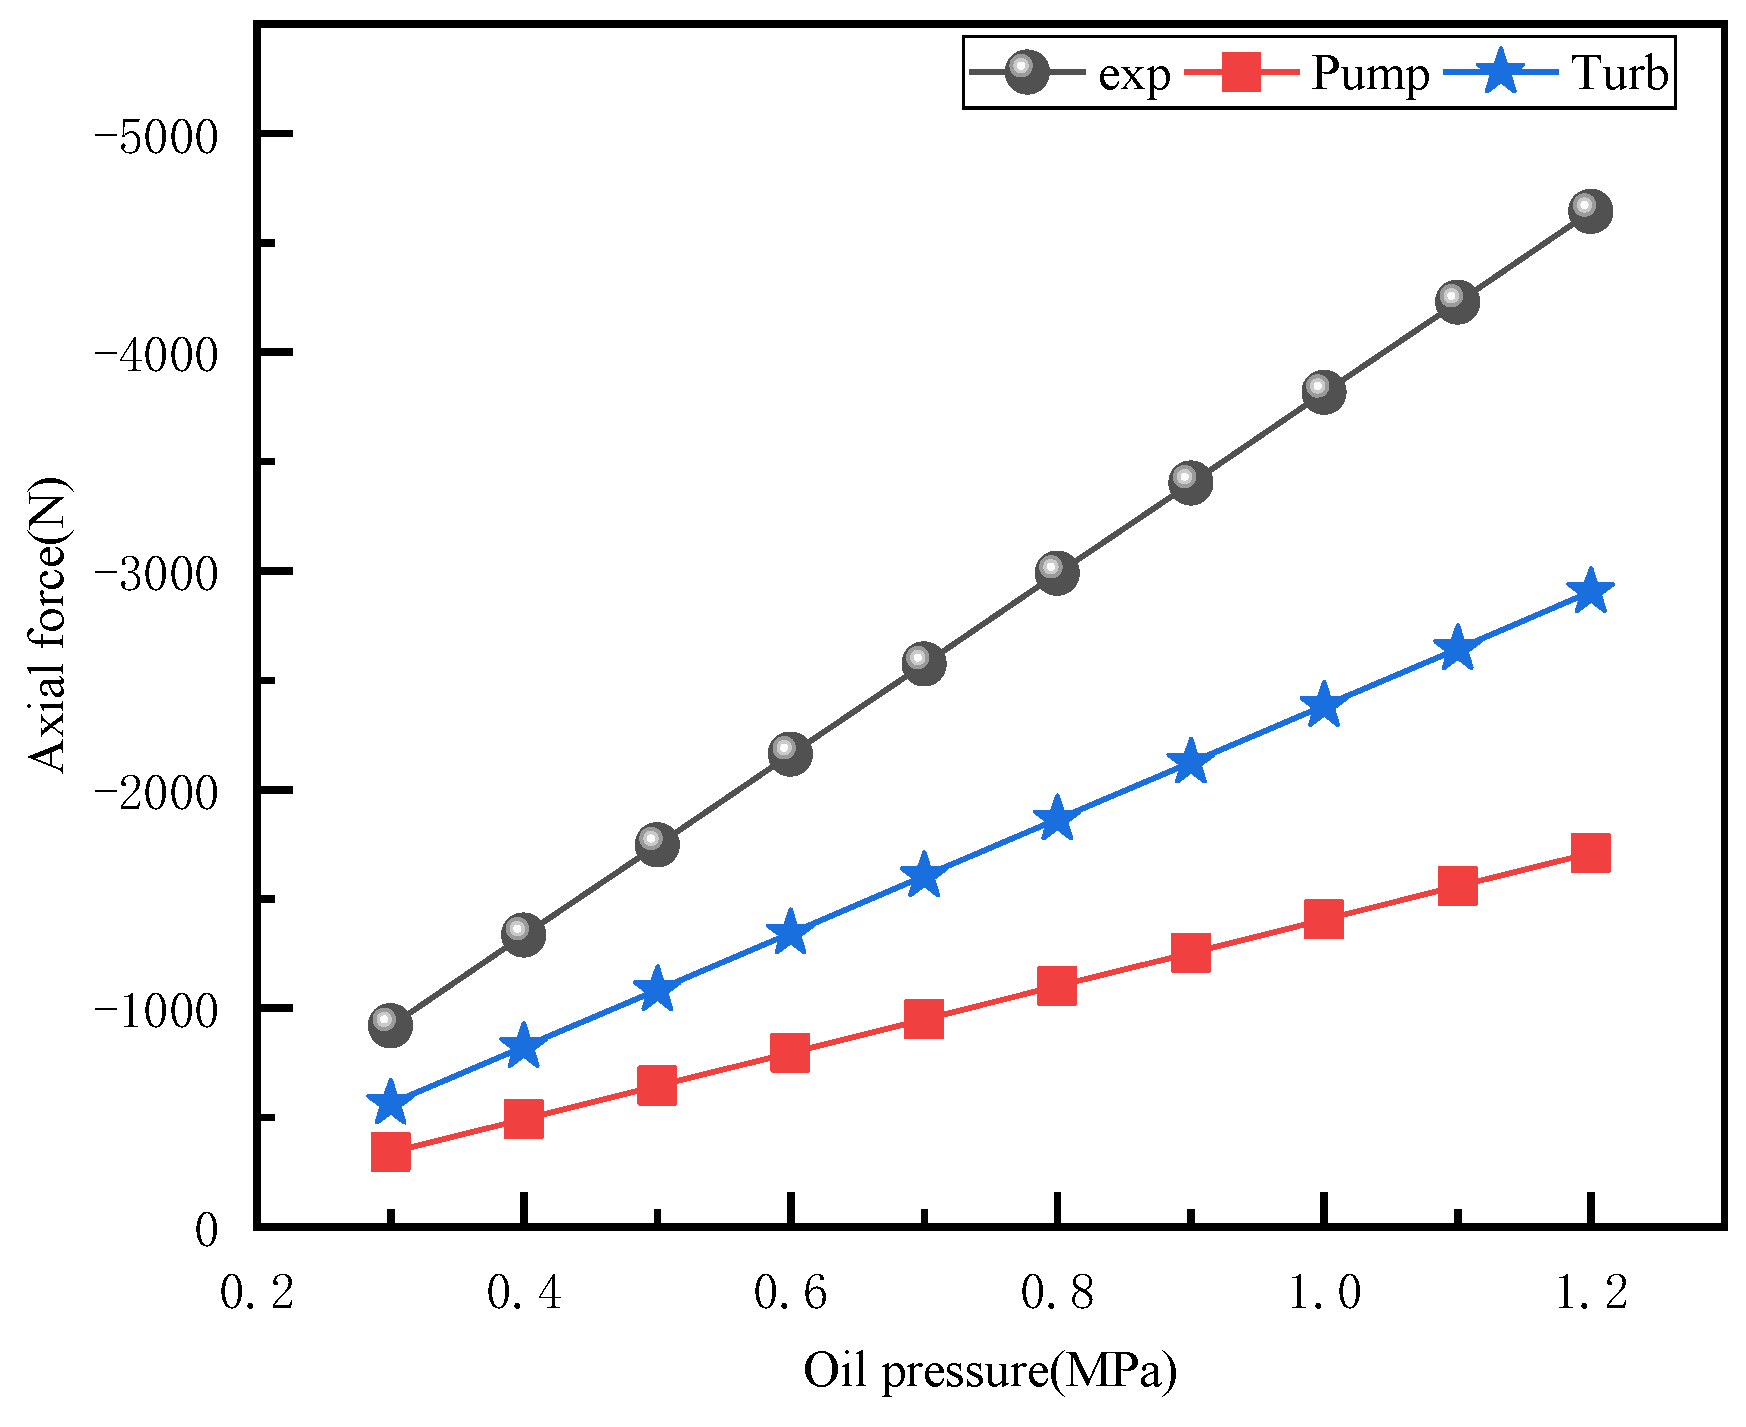
4.2. Axial Force under Different Pressure of Charging Oil

In the static state of the torque converter, experiments were carried out to measure the axial forces of each impeller under different charging oil pressures. The results are shown in Figure 12. It can be observed that the axial force measured by the turbine is directly proportional to the supply oil pressure, while the axial force experimental data measured by the sensor on the pump side is 0. This is because at this time, the axial force directions of both the pump and turbine are negative and act together on the bearing on the turbine side. Therefore, when the pump axial force is in the negative direction, the axial force experimental values collected by the sensor at the turbine in the experiment are the sum of the axial force values of the two impellers.
As shown in Figure 13, in the static state, the torque converter is filled with oil, and the pressure in all areas is essentially consistent. At this time, the stator has equal axial force-bearing areas on both sides, and its axial force is nearly zero. The turbine is also fully immersed in oil, but the size of the turbine axial force is directly proportional to the supply oil pressure. This is caused by the uneven pressure distribution in the fj section, as shown in the figure. The fj section is directly connected to the outlet flow channel, resulting in the pressure attenuation shown in the figure. Therefore, there is an initial axial force to the right in the turbine. Although the axial force-bearing areas on both sides of the pump are the same, the ai section is connected to the inlet flow channel, and there is a similar pressure attenuation in the ai section, resulting in an initial axial force to the right in the pump.
Under the starting condition with the pump speed of 1800 rev/min, the axial force of the impeller changes with the pressure of the charging oil, as shown in Figure 14. For every increase of 0.1 MPa in supply oil pressure, the axial force of the turbine decreases by approximately 100 N, the pump decreases by approximately 600 N, and the stator remains unchanged.
Taking the pump as an example, the changes in the average pressure of each part are shown in Figure 15. Their change rates are the same and are directly proportional to the charging pressure. Therefore, combined with the fact that the charging oil pressure does not change the external characteristics of the hydraulic torque converter, it can be concluded that the change in pressure of charging oil does not affect the performance and internal flow characteristics of the hydraulic torque converter. By changing the charging pressure, the axial force changes due to the overall pressure distribution increasing or decreasing.
Different flow passages exert different directions of axial force on the impeller, and their total axial force receiving area is defined as the axial imbalance area. According to the schematic diagram of this model structure shown in Figure 16, point i and point h of the pump are on the same horizontal line, but there is a wall surface S at point h that generates rightward axial force. The overall axial force of the pump is directed to the left, and bearing 1 is in an interference fit with the pump, with the force acting on bearing 1 applied to the pump.
Therefore, the axial imbalance area of the pump is related to the area S and the force of bearing 1, and the axial imbalance area of the turbine is related to the force of bearing 1, while the stator has no imbalance area. The axial imbalance areas of the three impellers are as follows (the negative sign indicates that the direction of the generated axial force is to the right):
S P = 0.006     m 2 S T = 0.001     m 2 S S = 0     m 2 .
Therefore, the variable of the torque converter impeller axial force affected by the oil supply pressure complies with the formula:
Δ F P = Δ P · S P Δ F T = Δ P · S T Δ F S = Δ P · S S ,
where Δ P represents the increase or decrease in oil supply pressure and Δ F represents the increase or decrease in axial force.
At different speed ratios (SR = turbine speed/pump speed) with a pump speed of 1800 rev/min, taking the pump as an example, the change in oil supply pressure at different speed ratios will cause the same magnitude of offset in the pump axial force. As shown in Figure 17, the pump axial force curve shifts up or down as a whole based on the oil supply pressure, so Formula (3) also satisfies the calculation of axial force variables at different speed ratios.

4.3. Test Verification

Figure 18a shows the impeller axial force numerical results and experimental data at different charging oil temperatures under starting conditions with a speed of 1800 rev/min. The results indicate that the numerical simulation results are in good agreement with the experimental results, with a calculation error of less than 5%. The axial force calculation model for this torque converter can accurately simulate the actual axial force and its changing trend.
As seen in Figure 18b, which displays axial force results at different pressures, the change in charging oil pressure has the most significant impact on the impeller axial force, showing an inverse relationship. Moreover, the experimental results also verify the accuracy of the axial force numerical simulation, with a calculation error within 5%.

5. Conclusions

Based on the CFD simulation results, this study investigates the impact of different charging oil conditions on the axial force of the hydraulic torque converter. The charging oil conditions include the temperature and pressure of the charging oil. Experimental validation is conducted to verify the accuracy of the CFD simulation results. The following conclusions are drawn:
(1)
A CFD numerical calculation model of the axial force of the torque converter is proposed, which consists of the flow field of the torque converter and its leakage region. The experiments demonstrate that the results from the simulations are within 5% error. The CFD model is able to accurately simulate the axial force of the torque converter under various operating conditions, which is of significant importance for the precise calculation of the axial force in hydraulic torque converters.
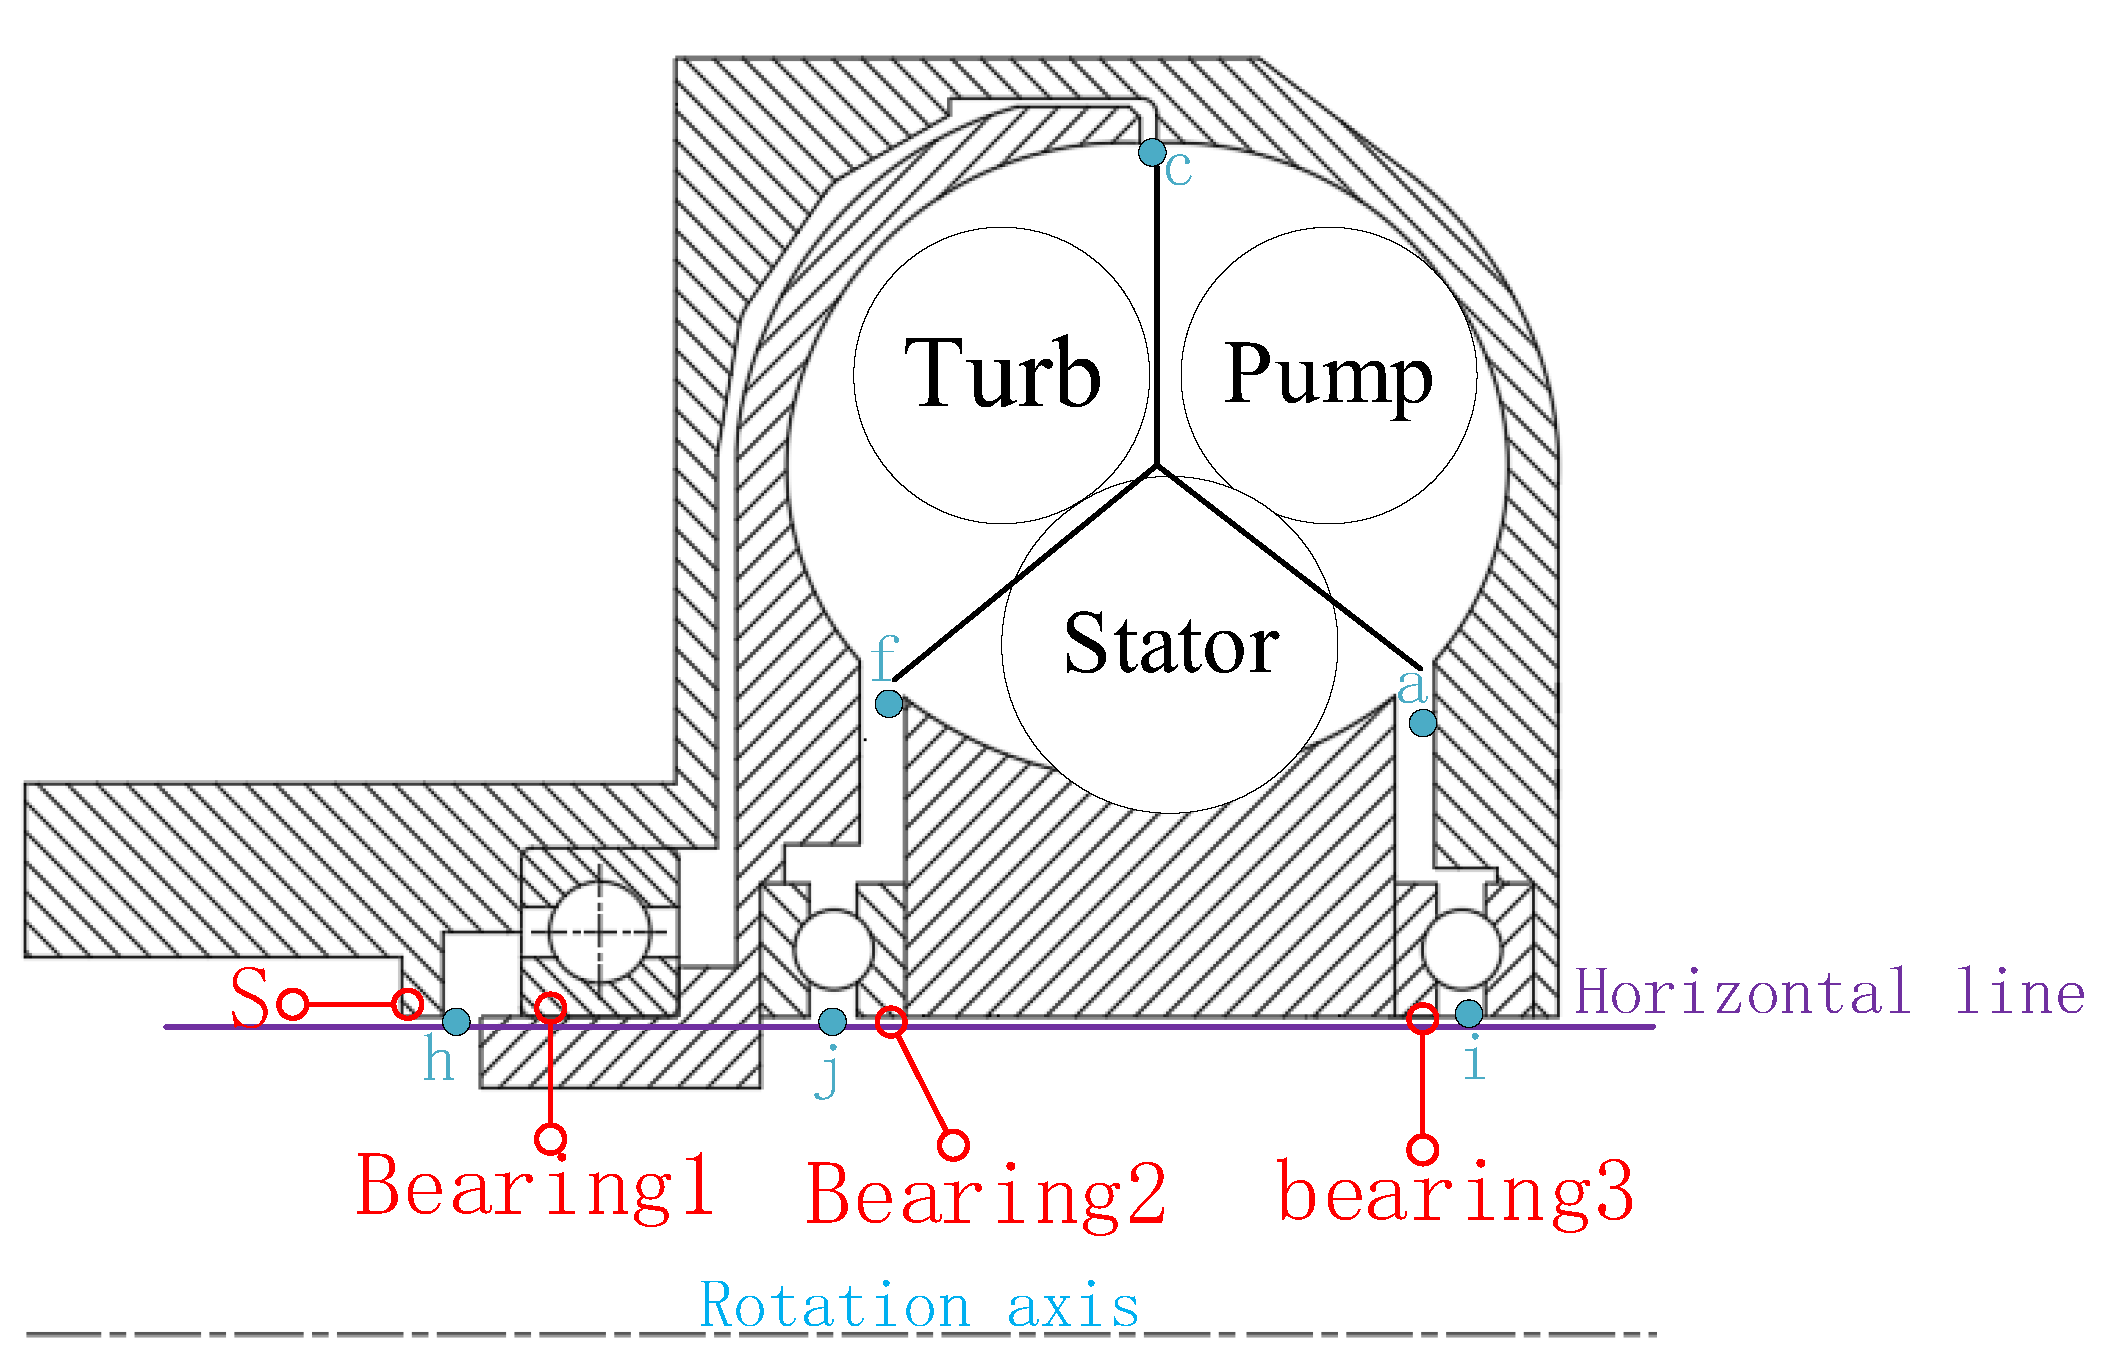
(2)
A novel experimental method for testing axial forces in the hydraulic torque converter is proposed. The axial forces on the impellers within a closed-coupled wheelset are measured accurately through the arrangement of different sensors and circlip in the hydraulic torque converter.
(3)
Research indicates that the axial forces on the pump and turbine are in the same direction and act on the turbine-side bearing under certain conditions, resulting in stress concentration in the bearing and reduced life. Thus, it is important to pay particular attention to the shaft bearing characteristics and its suppression on the turbine side during the design of the torque converter.
(4)
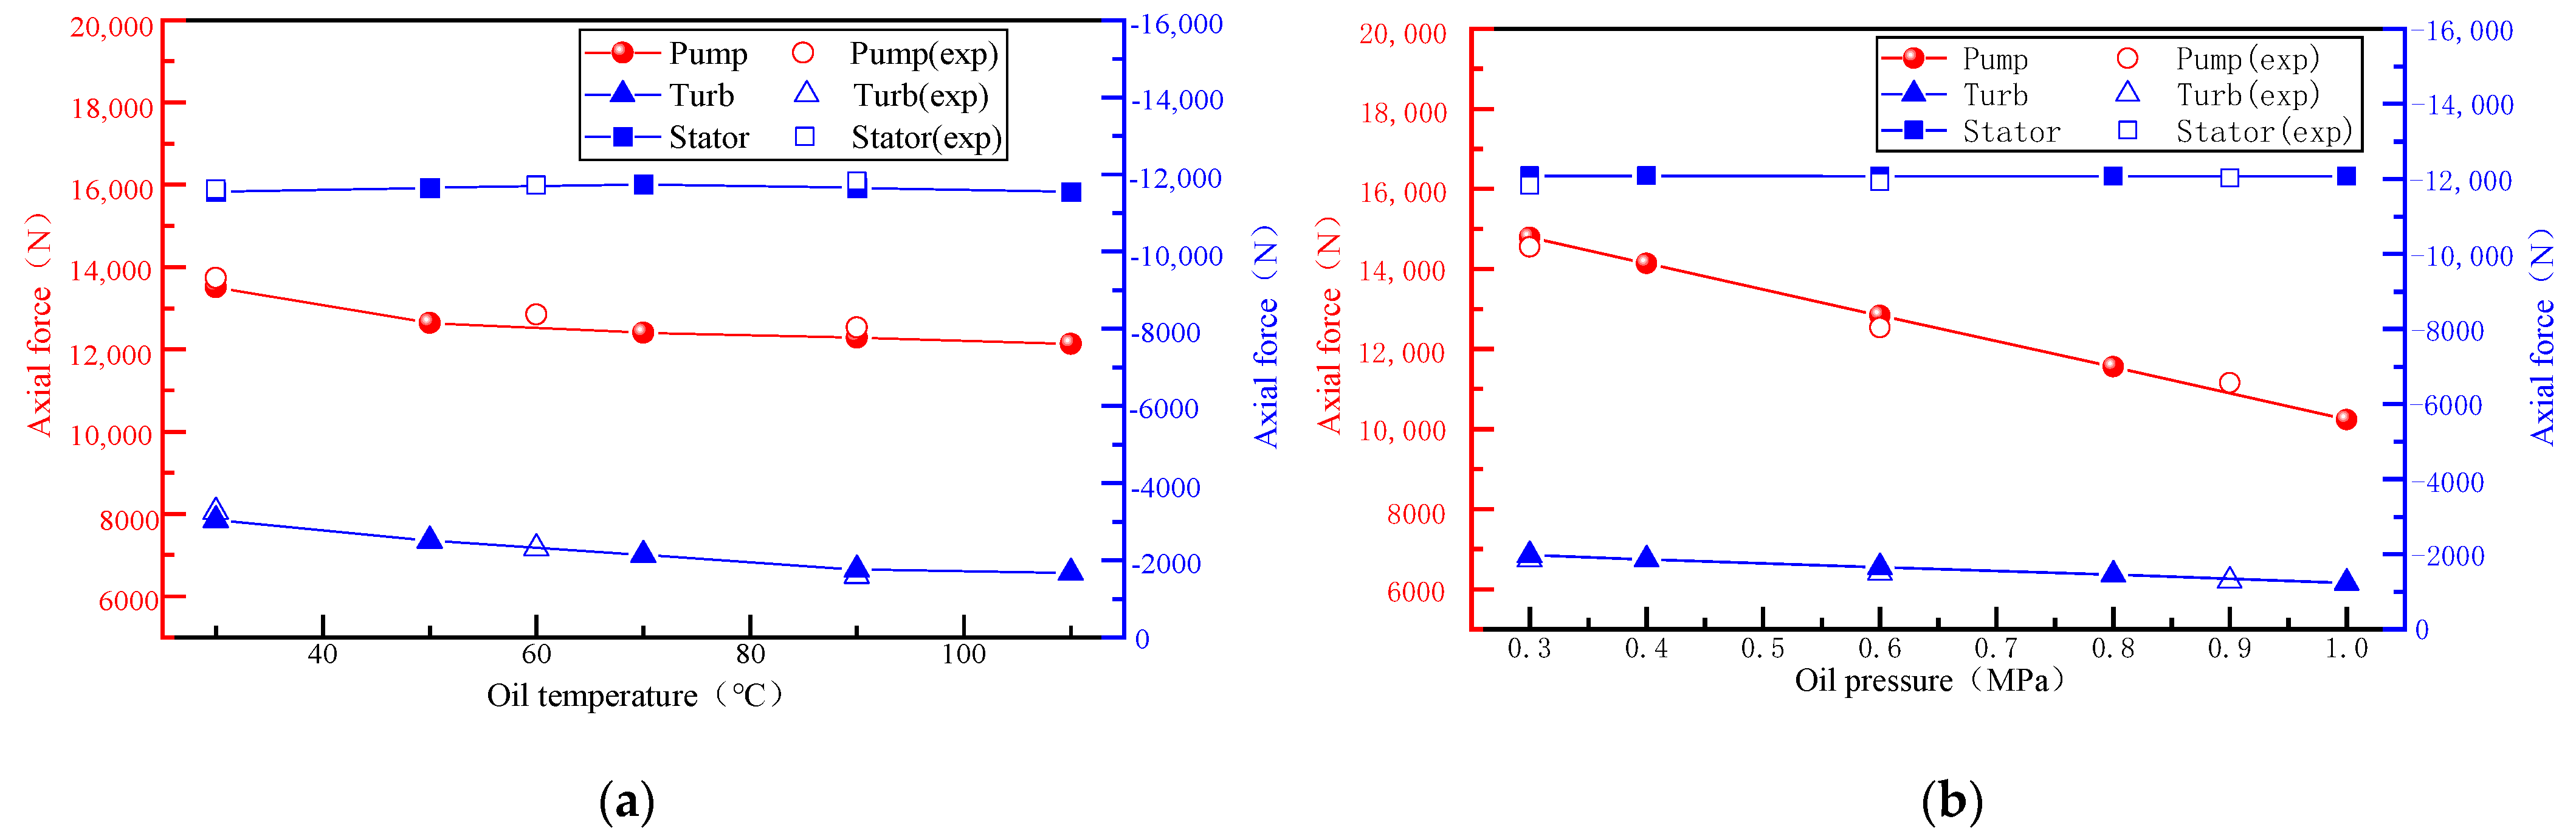
The axial force of the torque converter is significantly influenced by the temperature of the charging oil. The increase in temperature causes a reduction in the axial force of the pump and turbine, while it is unchanged in the stator. In addition, the variation in temperature directly affects the viscosity of oil, leading to significant changes in the axial force. Consequently, the use of a lower viscosity fluid is more effective in reducing and suppressing the axial force of the torque converter.
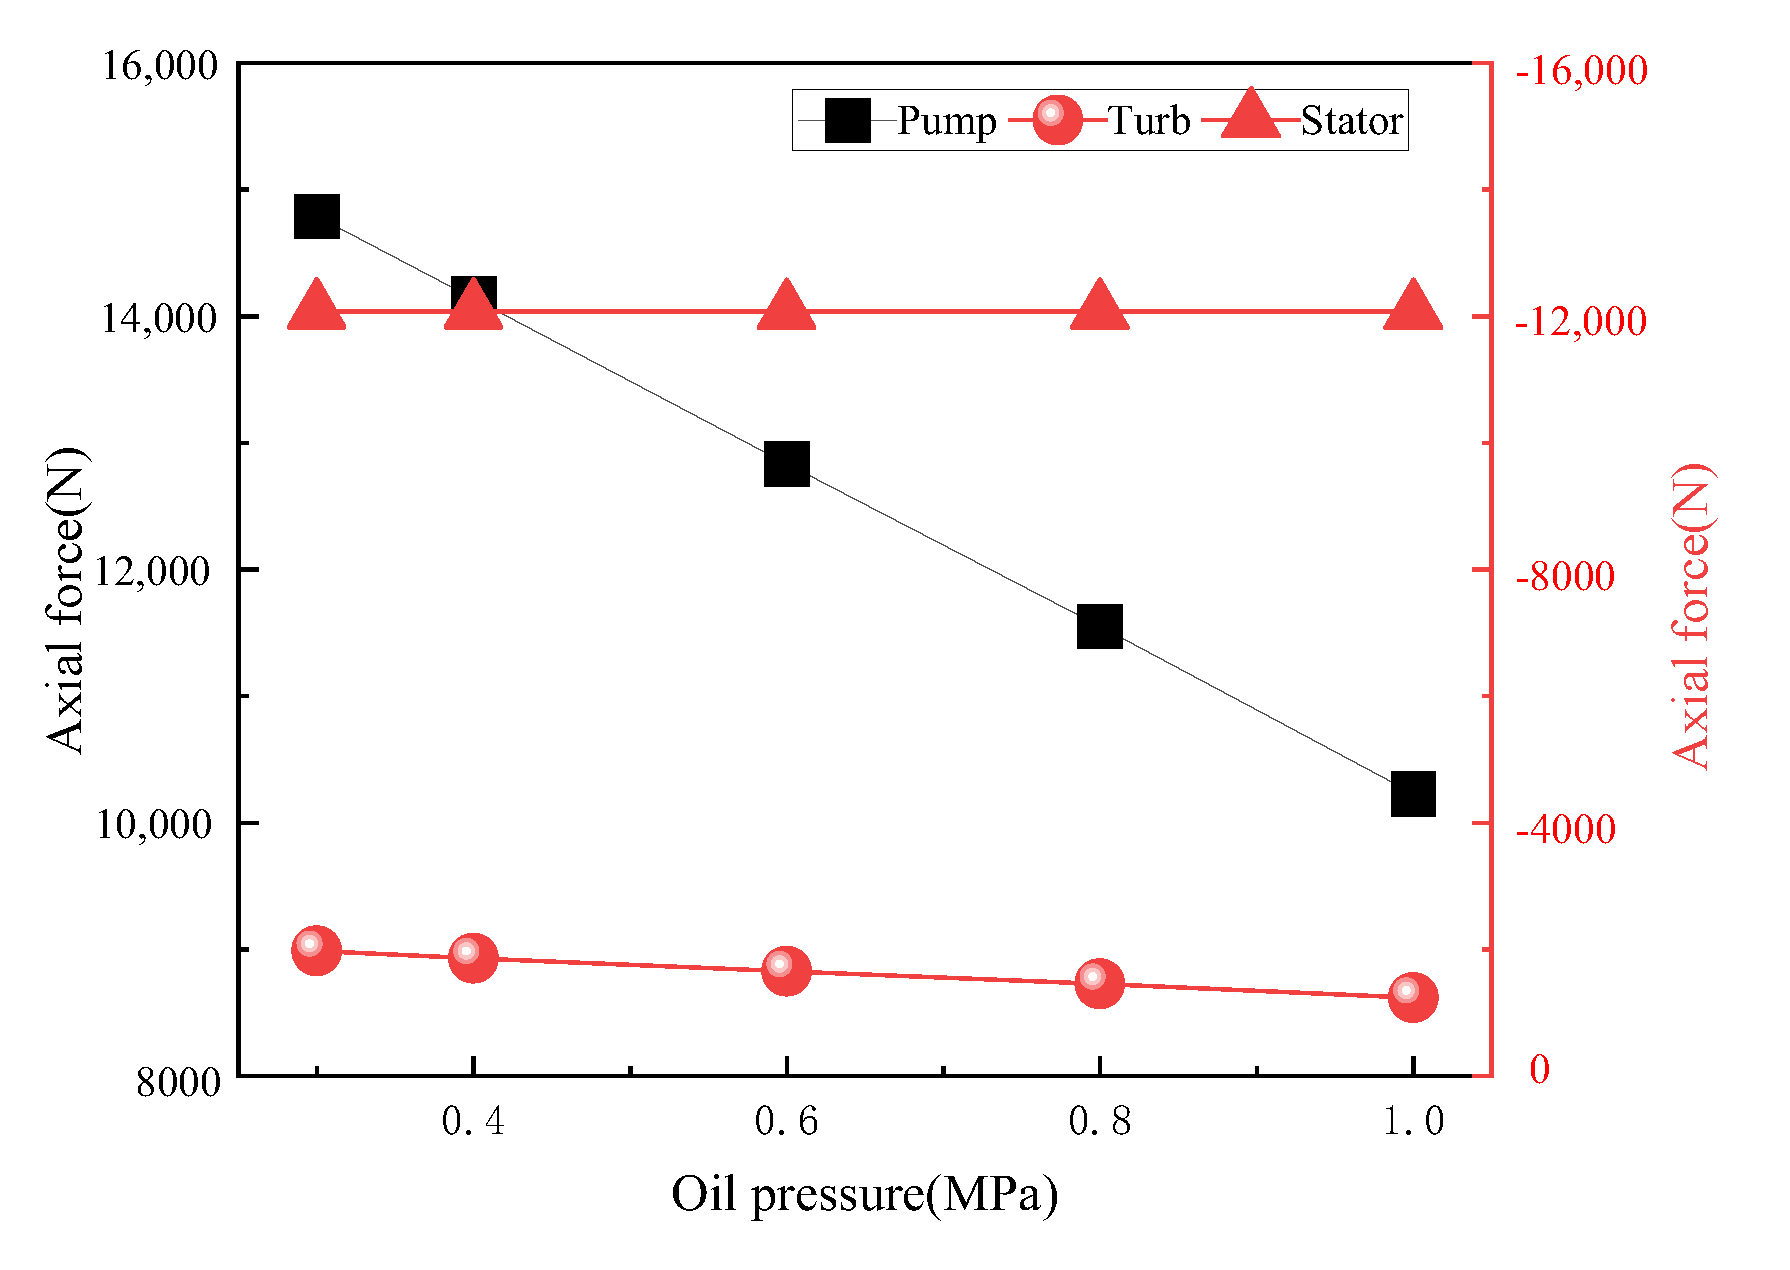
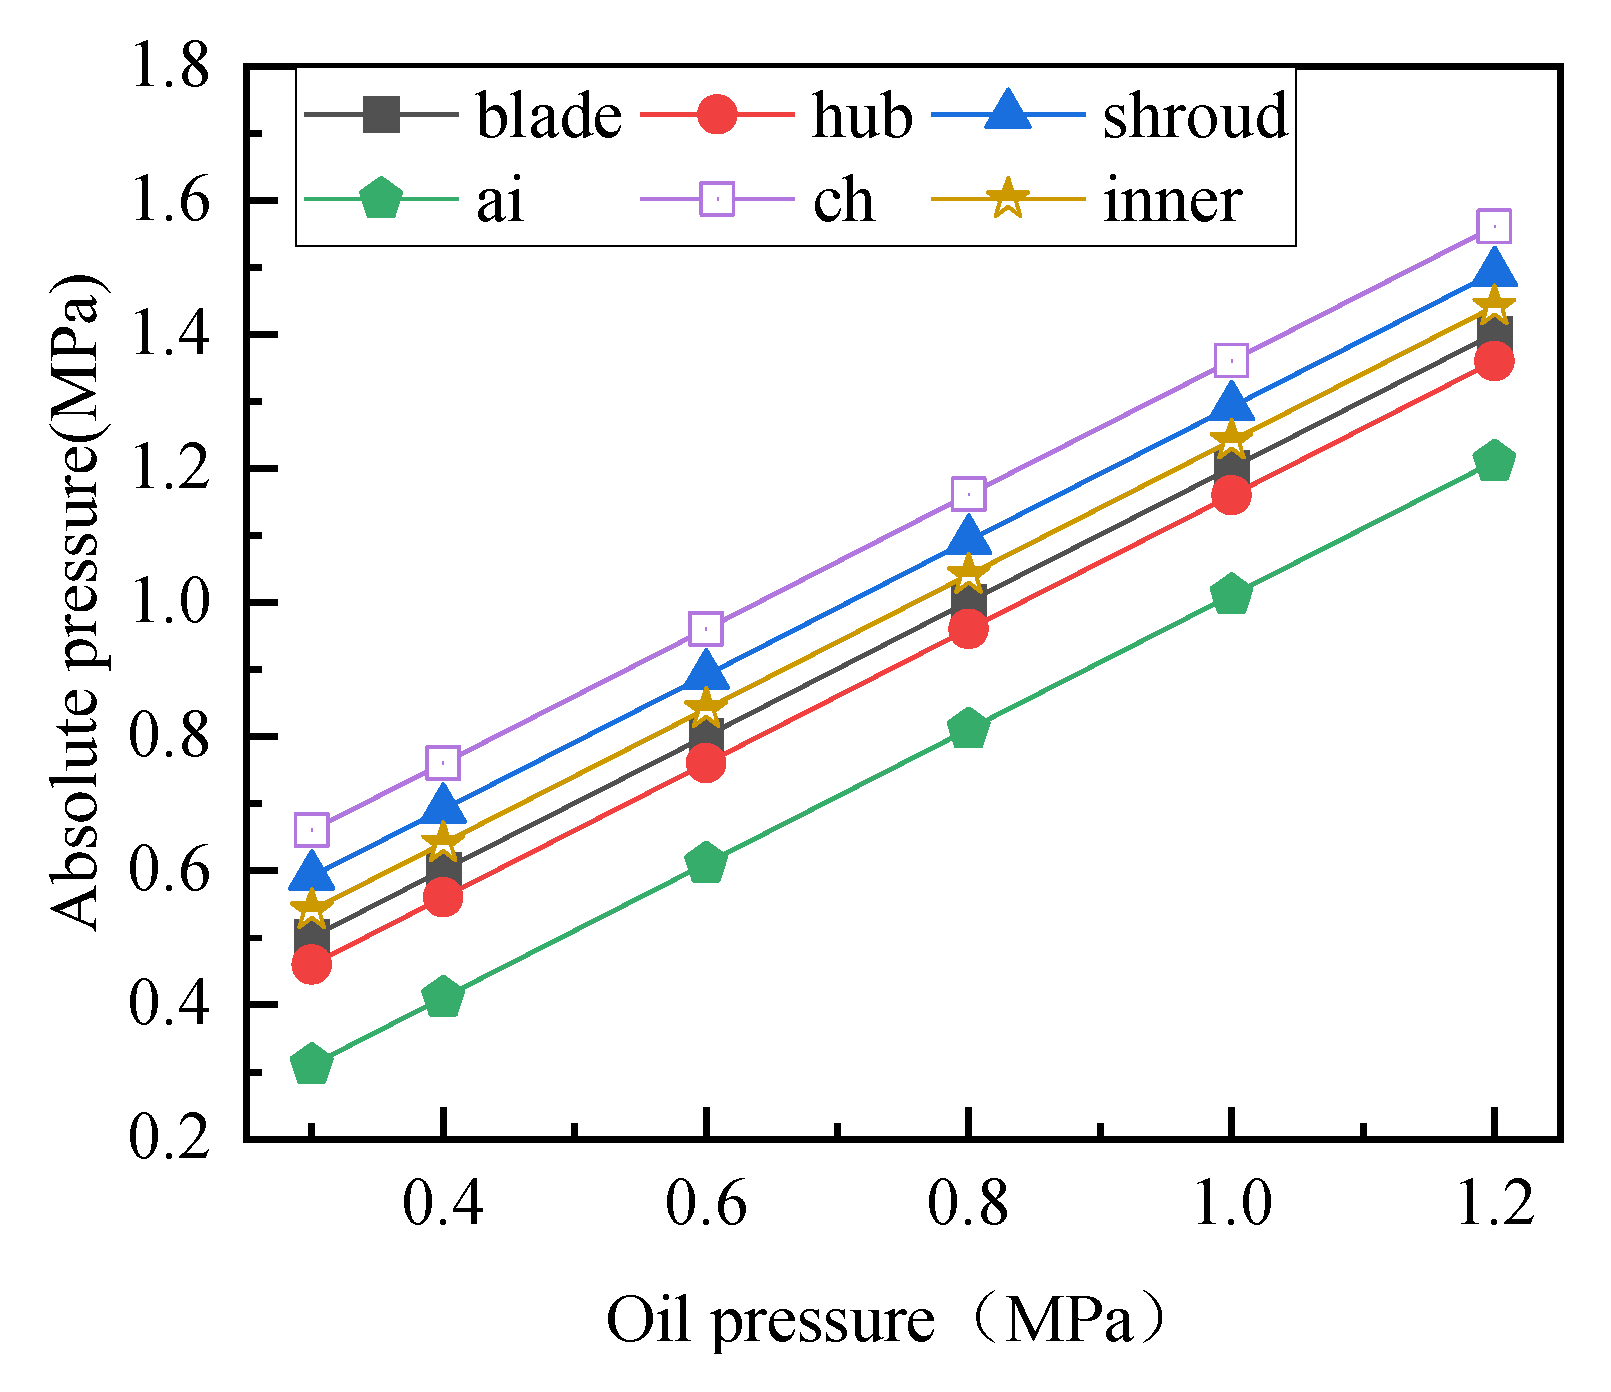
(5)
The charging pressure of the torque converter affects its axial force, especially in the pump. The results indicate that the axial forces of the pump wheel and turbine gradually decrease as the pressure increases, while the axial force of the stator keeps constant.
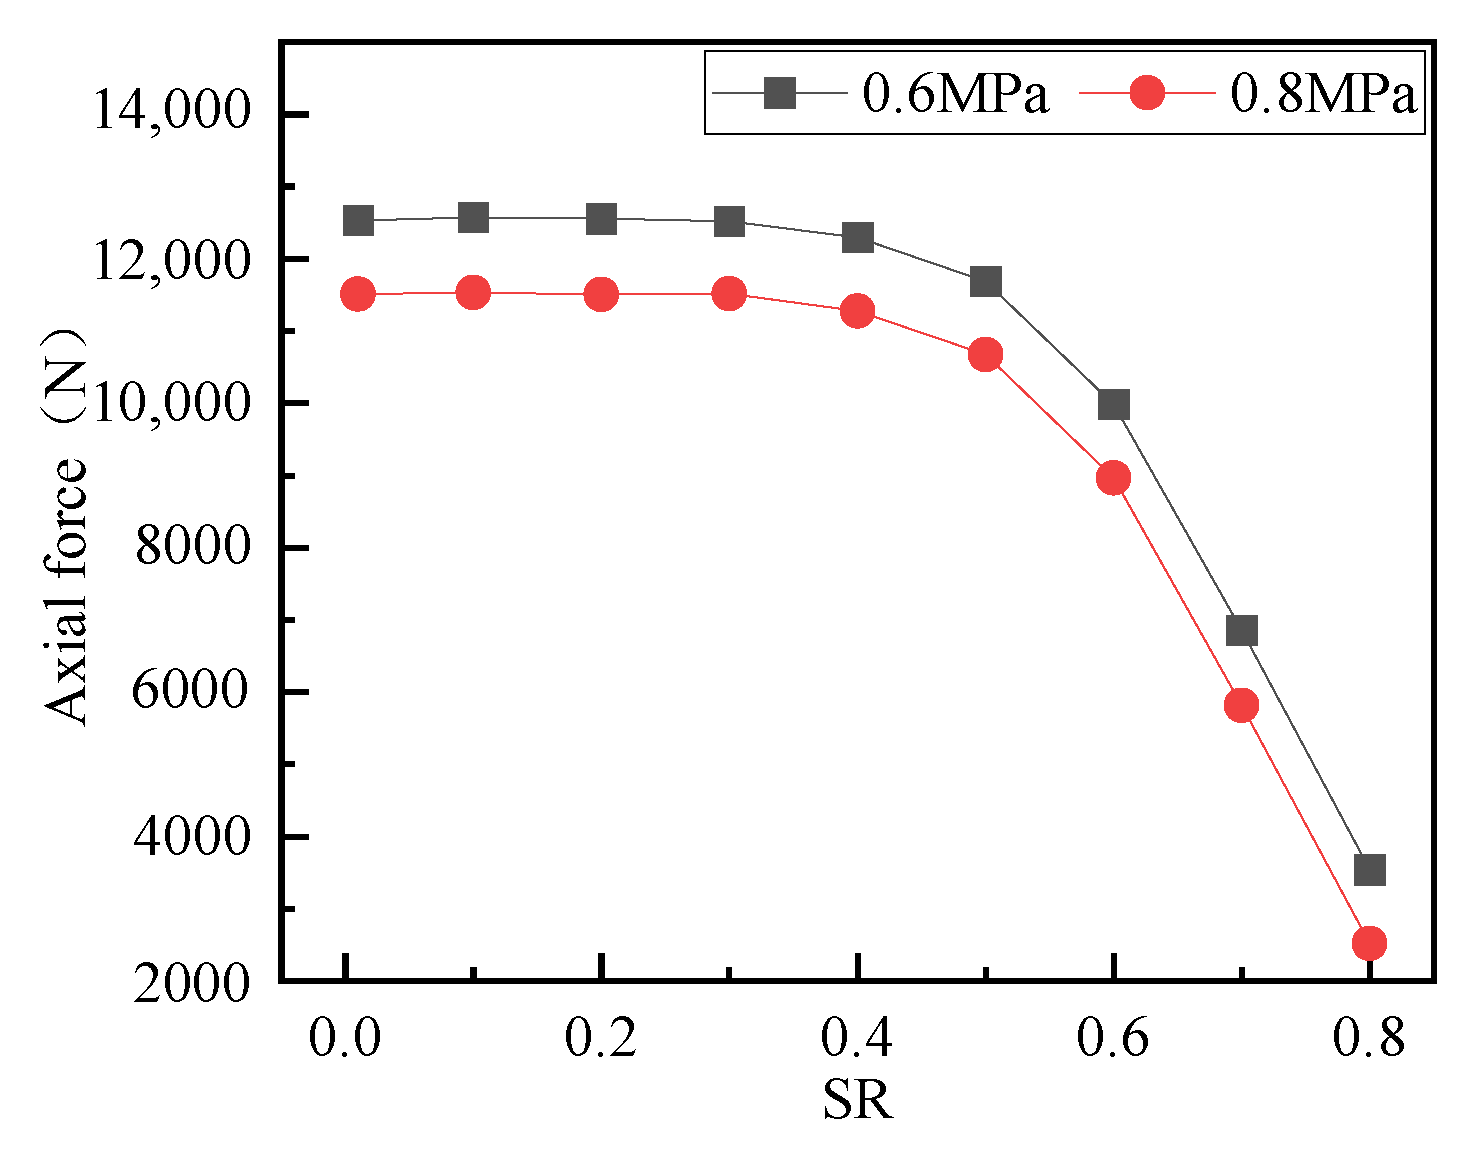
(6)
Research shows that the axial unbalanced area is an important parameter for predicting axial force variation, which determines the direction and magnitude of the axial force change of the hydraulic torque converter. A formula of axial force is proposed that enables fast prediction of turbine axial forces under various conditions.
Overall, the influence of charging oil on the axial force was studied for the hydraulic torque converter. However, further research is needed in order to delve into the formation mechanism of axial forces in hydraulic torque converters and explore their correlation with factors such as flow field, blade design, and fluid properties. By suppressing axial forces on the impellers, it will be possible to enable them to operate for longer durations under lower load conditions.

Author Contributions

C.L. performed the data analyses, designed and performed the experiments, and wrote the manuscript; C.J. In addition, M.G. contributed significantly to the analysis and manuscript preparation; Q.Y. In addition, W.W. contributed to the conception of the study. All authors have read and agreed to the published version of the manuscript.

Funding

Supported by the National Natural Science Foundation of China (NSFC) through Grant Nos. 51475041 and 51805027, and the China Postdoctoral Science Foundation (No. 2023M730239).

Data Availability Statement

The data that support the findings of this study are available from the corresponding author upon reasonable request.

Conflicts of Interest

The authors declare no conflict of interest.

Nomenclature

CC=TP × D−5 × ωP−2, Capacity constant [kg/rad2/m3]
DTorque converter torus diameter [m]
K=TT/TP, Torque ratio
NPRotating speed of pump [rpm]
NSRotating speed of stator [rpm]
NTRotating speed of turbine [rpm]
FiImpeller axial force [N], i represents different impellers
FijAxial force[N], where i represents different impellers and j represents different positions
SiAxial imbalance area [m2], i represents different impellers

References

  1. Yan, Q.; Wei, W.; Liu, C.; Liu, S.; Li, J.; Liu, B. Torque Converter Modern Design Theory and Methodology. Chin. Hydraul. Pneum. 2015, 2015, 1–8. [Google Scholar]
  2. Liu, Y.; Liu, C.; He, D.; Pa, Y. Three-dimensional Flow Numerical Calculation of Axial Load in a Torque Converter. Mach. Des. Res. 2011, 27, 42–44. [Google Scholar]
  3. Amer, W.S.; Farag, A.M.; Abady, I.M. Asymptotic analysis and numerical solutions for the rigid body containing a viscous liquid in cavity in the presence of gyrostatic moment. Arch. Appl. Mech. 2021, 91, 3889–3902. [Google Scholar] [CrossRef]
  4. Chen, Y. Theoretical Analysis and Experimental Research on Axial Force of Hydraulic Torque Converter. Ph.D. Thesis, Jilin University, Changchun, China, 1987. [Google Scholar]
  5. Yan, Q.; Tan, L.; Wei, W.; Song, Z. Thrust Load with Different Balance Holes Pattern of Turine Hub in a Hydrodynamic Torque Converter. Trans. Beijing Inst. Technol. 2019, 39, 7–13. [Google Scholar]
  6. Liu, C.; Ma, W.; Xu, R. Calculation and Analysis of Axial Force in Hydrodynamic Torque Converter based on CFD. J. Jilin Univ. (Eng. Technol. Ed.) 2009, 39, 1181–1185. [Google Scholar]
  7. Yan, Q.; Li, J.; Wei, W. Research on Effect of Working Oil Temperature for Hydraulic Torque Converter Performance Using CFD and Test. J. Mech. Eng. 2014, 50, 118–125. [Google Scholar] [CrossRef]
  8. By, R.R.; Lakshminarayana, B. Measurement and analysis of static pressure field in a torque converter turbine. J. Fluids Eng.-Trans. Asme 1995, 117, 473–478. [Google Scholar] [CrossRef]
  9. By, R.R.; Lakshminarayana, B. Static Pressure Measurement in a Torque Converter Stator. SAE911934, SAE Book SP879. SAE Trans. 1991, 100, 1756–1764. [Google Scholar]
  10. Yan, Q.; Liu, C.; Wei, W. Numerical simulation of the flow field of a flat torque converter. J. Beijing Inst. Technol. 2012, 21, 309–314. [Google Scholar]
  11. Sun, B.; Ma, W.; Li, Y.; Lü, Y. Axial Force Caculation Method of Hydrodynamic Coupling. Trans. Chin. Soc. Agric. Mach. 2014, 2, 40–46. [Google Scholar]
  12. Cai, W.; Ma, W.; Liu, C.; Yuan, Z. PIV Test and Analysis on Pump Internal Flow of Torque Converter. J. Jiangsu Univ. (Nat. Sci. Ed.) 2014, 3, 274–278. [Google Scholar]
  13. Chai, B.; Wang, Y.; Ma, W.; Wang, W. Test and analysis of internal flow field in turbine of hydrodynamic torque converter based on particle image velocimetry. Trans. Chin. Soc. Agric. Eng. 2015, 12, 92–98. [Google Scholar]
  14. Chai, B.; Liu, C.; Wang, W. Extraction of internal flow velocity in pump of hydrodynamic torque converter based on Hough transform. J. Drain. Irrig. Mach. Eng. 2014, 4, 283–289. [Google Scholar]
  15. Wu, G.Q.; Chen, J.; Zhu, W.J. Performance Analysis and Improvement of Flat Torque Converters Using DOE Method. Chin. J. Mech. Eng. 2018, 31, 1–9. [Google Scholar] [CrossRef] [Green Version]
  16. Chen, M.; Guo, X.; Tan, G.; Pei, X.; Zhang, W. Effects of blade lean angle on a hydraulic retarder. Adv. Mech. Eng. 2016, 8, 1–9. [Google Scholar] [CrossRef] [Green Version]
  17. Li, W.; Wang, A.; Li, X.; Zhang, Q. Performance optimization of the design space of torque converter’s blade angle under the condition of driving cycle. Harbin Gongcheng Daxue Xuebao/J. Harbin Eng. Univ. 2017, 38, 1781. [Google Scholar]
  18. Pan, X.; Xinyuan, C.; Hongjun, S.; Jiping, Z.; Lin, W.; Huichao, G. Effect of the Blade Shaped by Joukowsky Airfoil Transformation on the Characteristics of the Torque Converter. Proc. Inst. Mech. Eng. 2021, 235, 3314–3321. [Google Scholar] [CrossRef]
  19. Pan, X.; Xinyuan, C.; Jianghong, D.; Liangcai, Z.; Feng, Z. Application of slotted blade in the improvement of turbomachinery performance. AIP Adv. 2021, 11, 045017. [Google Scholar] [CrossRef]
  20. Kunisaki, Y.; Murata, S.; Tanaka, Y. Internal Flow Structure of Torque Converter Analyzed with Dynamic Mode Decomposition under Steady Driving Condition. Int. J. Automot. Eng. 2020, 11, 108. [Google Scholar] [CrossRef]
  21. Hempy, A.A. Transient Maneuvers and Pressure Analysis on an Automotive Torque Converter. Master’s Thesis, Michigan Technological University, Houghton, MI, USA, 2021. [Google Scholar]
  22. Rivera, E.D.J.; Woodland, M.; Robinette, D.; Blough, J.; Anderson, C.; Frait, S.; Devendran, R. Torque and Pressure CFD Correlation of a Torque Converter. SAE Int. J. Passeng. Cars Mech. Syst. 2019, 12, 157–168. [Google Scholar]
  23. De Jesus Rivera, E. Pressure Measurements Inside Multiple Cavities of a Torque Converter and CFD Correlation. Ph.D. Thesis, Michigan Technological University, Houghton, MI, USA, 2018. [Google Scholar]
  24. Huang, J.; Wu, G.; Wang, L. Analysis and optimization of axial force in torque converter. J. Jiamusi Univ. (Nat. Sci. Ed.) 2012, 30, 6–9. [Google Scholar]
  25. Gu, X. CFD Calculation and Investigation on Axial Force in a Torque Converter. Master’s Thesis, Harbin Institute of Technology, Harbin, China, 2015. [Google Scholar]
  26. Zhang, H. Research on Axial Force of High Speed Ratio Adjustable Hydraulic Torque Converter. Master’s Thesis, Harbin Institute of Technology, Harbin, China, 2018. [Google Scholar]
  27. Guo, M.; Liu, C.; Zhang, J.; Liu, S.; Ke, Z.; Yan, Q.; Khoo, B.C. Parametric analysis of the effects of blade exit angle on the cavitation characteristics in a hydraulic torque converter. Phys. Fluids 2022, 34, 053309. [Google Scholar] [CrossRef]
  28. Menter, F.R.; Kuntz, M.; Langtry, R. Ten years of industrial experience with the SST turbulence model. Heat Mass Transf. 2003, 4, 625–632. [Google Scholar]
  29. Zhang, J.; Li, J.Y.; Wang, T.; Qian, Z.S. Influence of nozzle structure on the flow field of the prestage of nozzle flapper servo valve. Int. J. Hydromechatronics 2023, 6, 59–75. [Google Scholar] [CrossRef]
  30. Guo, Y.; Chen, K.; Li, Y.; Chen, S.; Yuan, H.; Wang, Y.; Li, D. Analysis of conjugate heat transfer characteristics of nozzle in middle-high speed marine diesel engine. Int. J. Hydromechatronics 2022, 5, 124–135. [Google Scholar] [CrossRef]
Figure 1. Hydraulic torque converter structure diagram.
Machines 11 00730 g001
Figure 2. Calculation model of axial force in a full flow channel.
Machines 11 00730 g002
Figure 3. Analysis of numerical model: (a) mesh diagram; (b) mesh independence analysis; (c) model accuracy verification.
Machines 11 00730 g003
Figure 4. The structure and operating principle of axial force sensors.
Machines 11 00730 g004
Figure 5. Structural diagram of axial force test scheme.
Machines 11 00730 g005
Figure 6. Hydraulic torque converter axial force test bench.
Machines 11 00730 g006
Figure 7. Viscosity, density change curve with temperature.
Machines 11 00730 g007
Figure 8. Diagram of axial force changing with temperature.
Machines 11 00730 g008
Figure 9. Absolute pressure change diagram of ch section.
Machines 11 00730 g009
Figure 10. The contour of absolute pressure, mass flow rate, and velocity in the meridional view.
Machines 11 00730 g010
Figure 11. Pressure sensitivity diagram of each part of the pump.
Machines 11 00730 g011
Figure 12. Diagram of axial force changing with oil supply pressure under static state.
Machines 11 00730 g012
Figure 13. Pressure distribution diagram of axial flow surface in the full flow field of the torque converter.
Machines 11 00730 g013
Figure 14. Change diagram of impeller axial force with oil supply pressure.
Machines 11 00730 g014
Figure 15. Variation of average pressure of each part of the pump with oil supply pressure.
Machines 11 00730 g015
Figure 16. Structural diagram of a hydraulic torque converter.
Machines 11 00730 g016
Figure 17. Diagram of axial force of pump with different oil supply pressure varying with speed ratio.
Machines 11 00730 g017
Figure 18. Comparison of axial force simulation and tests: (a) varying with oil supply temperature; (b) varying with oil supply pressure.
Machines 11 00730 g018
Table 1. Detailed setting of the CFD model.
Analysis StepAxial Force Simulation of the Torque Converter
Analysis typeSteady-state
Advection schemeHigh resolution scheme
Interface modelFrozen rotor
Time stepAuto timescale
Step number400
Convergence targeRMS 1 × 10⁻⁵
Turbulence modelSST (Shear Stress Transfer)
Pump status1800 rpm
Speed ratio0
Stator statusStationary
Boundary detailsNo-slip and smooth wall
Inlet conditionsStatic pressure
Outlet conditionsMass flow rate
Disclaimer/Publisher’s Note: The statements, opinions and data contained in all publications are solely those of the individual author(s) and contributor(s) and not of MDPI and/or the editor(s). MDPI and/or the editor(s) disclaim responsibility for any injury to people or property resulting from any ideas, methods, instructions or products referred to in the content.

