Article

Improved Support Vector Machine for Voiceprint Diagnosis of Typical Faults in Power Transformers

1
State Grid Jibei Electric Power Co., Ltd., Langfang Power Supply Company, Langfang 065000, China
2
IFLYTEK, Hefei 230088, China
3
Department of Mechanical Engineering, North China Electric Power University, Baoding 071003, China
*
Author to whom correspondence should be addressed.
Machines 2023, 11(5), 539; https://doi.org/10.3390/machines11050539
Submission received: 21 April 2023 / Revised: 8 May 2023 / Accepted: 9 May 2023 / Published: 10 May 2023
(This article belongs to the Special Issue Application of Deep Learning in Fault Diagnosis)

Abstract

:
The traditional power transformer diagnosis method relies on a lot of experience knowledge and a complex sampling process, which brings great difficulties to the fault diagnosis work. To solve this problem, a fault feature extraction method based on fully adaptive noise set empirical mode decomposition (CEEMDAN) is proposed, and the hunter–prey optimization (HPO) algorithm is used to optimize the support vector machine (SVM) to identify and classify the voice print faults of power transformers. Firstly, the CEEMDAN algorithm is used to decompose the voicemarks into several IMF components. IMF components containing fault information are selected according to the envelope kurtosis index and reconstructed to generate new signal sequences. PCA dimensionality reduction is performed on the reconstructed signal, and the principal components are extracted with a high cumulative contribution rate as input to SVM. Then, the HPO-SVM algorithm is used to classify and identify transformer faults. Apply the proposed method to the diagnosis of typical faults in power transformers. The results show that the accuracy of this method in identifying various fault states of power transformers can reach 98.5%, and it has better classification performance than other similar methods.

1. Introduction

As the hub of power transmission and energy conversion, the operation status of power transformers is the key to ensuring the power operation of the system [1,2]. Due to the influence of the substation environment and human factors, different types of faults such as partial discharge and short circuit impact often occur during operation. Not only has it affected the normal electricity demand of society, but it will also cause incalculable losses. Timely fault monitoring and diagnosis of power transformers are of great significance for ensuring the safe and stable operation of power grids [3,4].
Compared to the widely used methods for detecting vibration signals and dissolved gases in oil [5,6,7], the acquisition of voiceprint signals has the advantages of non-contact, simple operation, safety and reliability, and live detection and diagnosis of power transformers can be performed at any time [8]. At present, some typical faults of power transformers, such as partial discharge, short-circuit impulse, and DC magnetic bias, can be distinguished from the voiceprint signal. For example, when partial discharge occurs in the power transformer, there will be bubbles, impurities, etc., in the transformer, which will lead to partial damage of the dielectric and make a “squeak” or “crackle” sound. When a power transformer experiences a short-circuit impact, the short-circuit current surges, causing a “gurgling” boiling sound inside the transformer. When a power transformer experiences DC bias, the DC flowing through the winding becomes a part of the transformer excitation current, which causes the transformer core to produce bias and make a huge noise. This abnormal voiceprint information provides a reference for diagnosing faults in the voiceprint features of power transformers.
Feature extraction, selection optimization, and fusion of collected signals can facilitate subsequent signal processing and recognition work. The author of [9] proposed multiple methods for feature extraction and integration and further verified the practicality and robustness of the methods through experiments. The author of [10] achieved good results in identifying and classifying target objects through time-frequency scaling and automatic feature extraction methods, demonstrating the robustness of the method. With the vigorous development of the field of machine learning, algorithms such as support vector machines [11], random forests [12], and KNN [13] are gradually applied to the field of power transformer fault diagnosis. Support vector machines have been widely used due to their high accuracy and generalization performance [14].
The author of [15] used Mel spectrum processing to collect the voiceprint signals of power transformers and used convolutional neural networks to classify their faults, with good diagnostic results. The author of [16] used the GWO-SVM algorithm to classify and diagnose the fault set of balanced power transformers, achieving a recognition rate of 86.67% for unbalanced faults. The author of [17] proposed a PSO-SVM excitation inrush current identification model, which realizes the identification of typical faults in power transformers. Accuracy has been improved by about 5% compared to the unoptimized SVM model, reaching 98%. The author of [18] proposed a BSO-SVM classification algorithm based on the combination of longicorn beetle whisker search, particle swarm optimization, and support vector machine. The microfiber coupler sensor was applied to the pattern recognition of partial discharge ultrasonic signals, and the classification and recognition of transformer partial discharge faults were carried out. The recognition accuracy exceeded 93%. Research shows that the above algorithms have certain classification and recognition capabilities for power transformer fault signals, but none of the power transformer signals under normal conditions are added during the training process, and there is still room for improvement in the training speed and optimization ability of the population optimization algorithm used. In practical applications, the voiceprint signals generated by normal power transformers lack obvious characteristics; during the classification process, it is easy to overlap with faults, such as short circuit impact, which affects the effectiveness of fault classification and diagnosis.
In summary, this paper proposes a power method transformer voiceprint fault diagnosis based on CEEMDAN and HPO-SVM, taking 110 kV power transformer fault voiceprint signals as the research object. This method arranges sound sensors around power transformers, performs CEEMDAN decomposition on the collected voiceprint signals, calculates the envelope spectral kurtosis of the decomposed IMF components, selects the IMF components containing fault information, and reconstructs them to generate a new signal sequence. HPO-SVM method is used to classify and identify the voiceprint signals in normal and fault conditions. It solves the problem of the aliasing of classification results in processing signals with overlapping features. Compared with other population optimization algorithms, the convergence speed and optimization ability are improved, the recognition rate for typical faults has reached 98.5%, and the recognition and diagnosis of power transformer fault voice print signals are realized.

2. Fault Diagnosis Principle of CEEMDAN-HPO-SVM

2.1. CEEMDAN

Complete Ensemble Empirical Mode Decomposition with Adaptive Noise (CEEMDAN) is improved based on EMD [19], Gaussian noise is added to the original signal, and the noise interference in the signal is eliminated by multiple superpositions and averaging. Its decomposition process does not require too many average times and has the advantages of fast calculation speed and good modal decomposition effect. The solution steps are as follows [20,21,22]:
  • The signal y i ( t ) obtained by adding Gaussian white noise to the original signal y ( t ) and EMD decomposition is performed on the signal y i ( t ) to obtain f I M F 1 , i . The average value f I M F 1 is calculated after decomposition, which is the first modal component, as shown in Equations (1) and (2).
    y i ( t ) = y ( t ) + ζ 0 a i ( t ) ,
    f I M F 1 = 1 k i = 1 k M 1 r 1 ( t ) + ζ 1 M 1 ( a i ( t ) ) ,
    where k represents the number of times white noise was added, and ζ 0 a i ( t ) represents the first white noise.
  • The first residual component r 1 ( t ) is obtained by subtracting the first modal component f I M F 1 from the original signal y ( t ) , as shown in Equation (3).
    r 1 ( t ) = y ( t ) f I M F 1
  • M j the jth f I M F 1 component is defined, and Gaussian white noise is added to the first residual component to perform a second decomposition of the mixed signal, as shown in Equation (4).
    f I M F 2 = 1 k i = 1 k M 1 r 1 ( t ) + ζ 1 M 1 ( a i ( t ) ) ,
    where ζ 1 M 1 ( a i ( t ) ) represents the added Gaussian white noise, and f I M F 2 represents the obtained second modal component.
  • For the l-th residual component ( l = 1 , 2 , , L , where L is the maximum decomposition order), as shown in Equation (5).
    r l ( t ) = r l 1 ( t ) f I M F l
  • The above operations are repeated until EMD is unable to decompose the residual signal to obtain the final solution of the original signal, as shown in Equation (6).
    y ( t ) = l = 1 L f I M F l + r ( t )

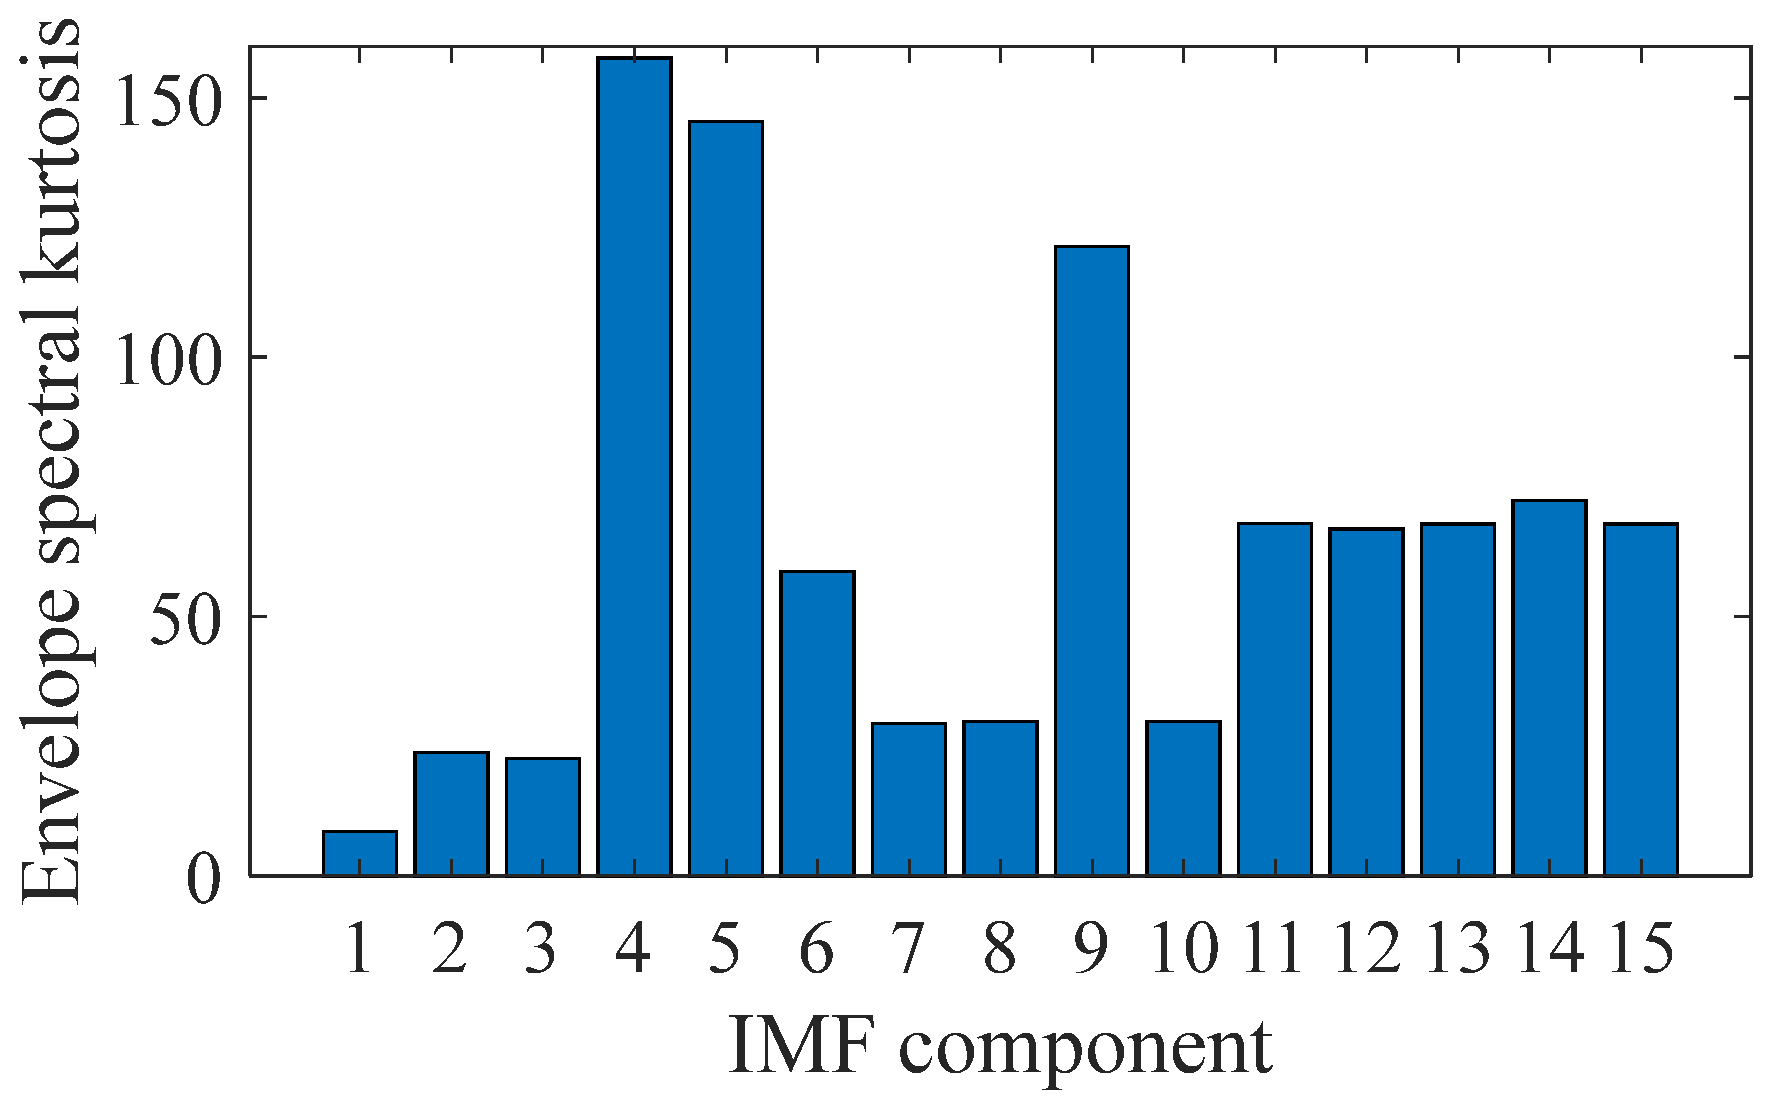
2.2. Envelope Spectral Kurtosis

As an indicator of the strength of fault characteristics in time domain signals, kurtosis is widely used in processing impulse signals. However, it is susceptible to aperiodic noise and cannot accurately characterize the periodic characteristics of voiceprint signals. The envelope spectrum kurtosis calculates the kurtosis of the fault signal in the frequency domain, which can not only detect the fault information in the voiceprint signal but also eliminate the interference caused by accidental noise.
The time domain signal is set as x(t), and CEEMDAN is used to decompose x (t) into several IMF components x i ( t ) , as shown in Equation (7).
z ( t ) = x i 2 ( t ) + x ^ i 2 ( t ) ,
where z ( t ) represents the envelope signal of the IMF component, x ^ i ( t ) represents the Hilbert transform of x i ( t ) , where i = 1 , 2 , , I . I is the maximum decomposition order.
The spectrum of the envelope signal is calculated, and its envelope spectral kurtosis is derived, as shown in Equation (8) as follows:
K E S = 1 / N n = 1 N ( E n ( t ) u E ) 4 1 / N n = 1 N ( E n ( t ) u E ) 2 2   ,
where E n ( t ) represents the spectrum of the envelope signal, u E is the mean of E n ( t ) , and N is the length of the signal.

2.3. SVM

SVM is a learning method based on statistical learning and structural risk minimization [23]. Its purpose is to find an optimal hyperplane that can not only classify the samples correctly but also make the classification samples have the maximum spacing.
The selection of kernel functions plays a crucial role in the classification performance of SVM [24,25]. Compared to other kernel functions, Radial Basis Function (RBF) involves fewer parameters, and it has better classification performance. Its definition is as shown in Equation (9) as follows:
K ( x i , x j ) = exp x i x j 2 2 g 2 ,
where g is the kernel function parameter.
In RBF kernel functions, the selection of penalty factor C and kernel function parameter g has a significant impact on the model’s generalization ability. C represents the weight of preference for two indicators (interval size, classification accuracy) in the adjustment and optimization direction, and g determines the distribution of data after mapping to a new feature space. SVM still faces problems such as long training time and low accuracy when solving multi-classification problems; when processing data with overlapping features, there is a tendency for classification results to be mixed, making it very sensitive to the selection of kernel functions and their parameters. At present, the parameters of mature kernel functions are selected through human experience, which has a certain degree of randomness. When dealing with problems in different fields, kernel functions should have appropriate forms and parameters.
The population optimization algorithm has the characteristics of high efficiency and good optimization effect in optimizing SVM parameters and is currently widely used in the optimization of SVM algorithms. The HPO algorithm has the characteristics of fast convergence speed and strong optimization ability, combining the SVM algorithm can help kernel functions find the optimal parameters. It plays a crucial role in improving the training speed and diagnostic performance of the SVM algorithm for power transformer voiceprint signals under different faults.

2.4. HPO

The HPO is a parameter optimization algorithm proposed by NARUEI et al. [26]. The algorithm simulates the behavior of carnivorous animals such as lions and leopards (hunters) preying on prey such as deer and antelopes. The basic assumptions of this algorithm are as follows: When hunters search for prey, they are likely to choose prey that is far away from the group; When hunters chase their prey, they will escape the predator’s attack and reach a safe place. This hunting process is accompanied by updating the hunter’s prey position. Finally, the optimal location for the prey is found, and the search process is completed. The algorithm process is as follows [27]:
  • The population position is initialized, and hunters or prey in space are randomly generated, as shown in Equation (10).
    x n = r a n d ( 1 , d ) . * ( u l ) + l ,
    where x n represents the position of population members, d represents the dimension of the problem, and u and l represent the upper and lower bounds of the problem variables, respectively.
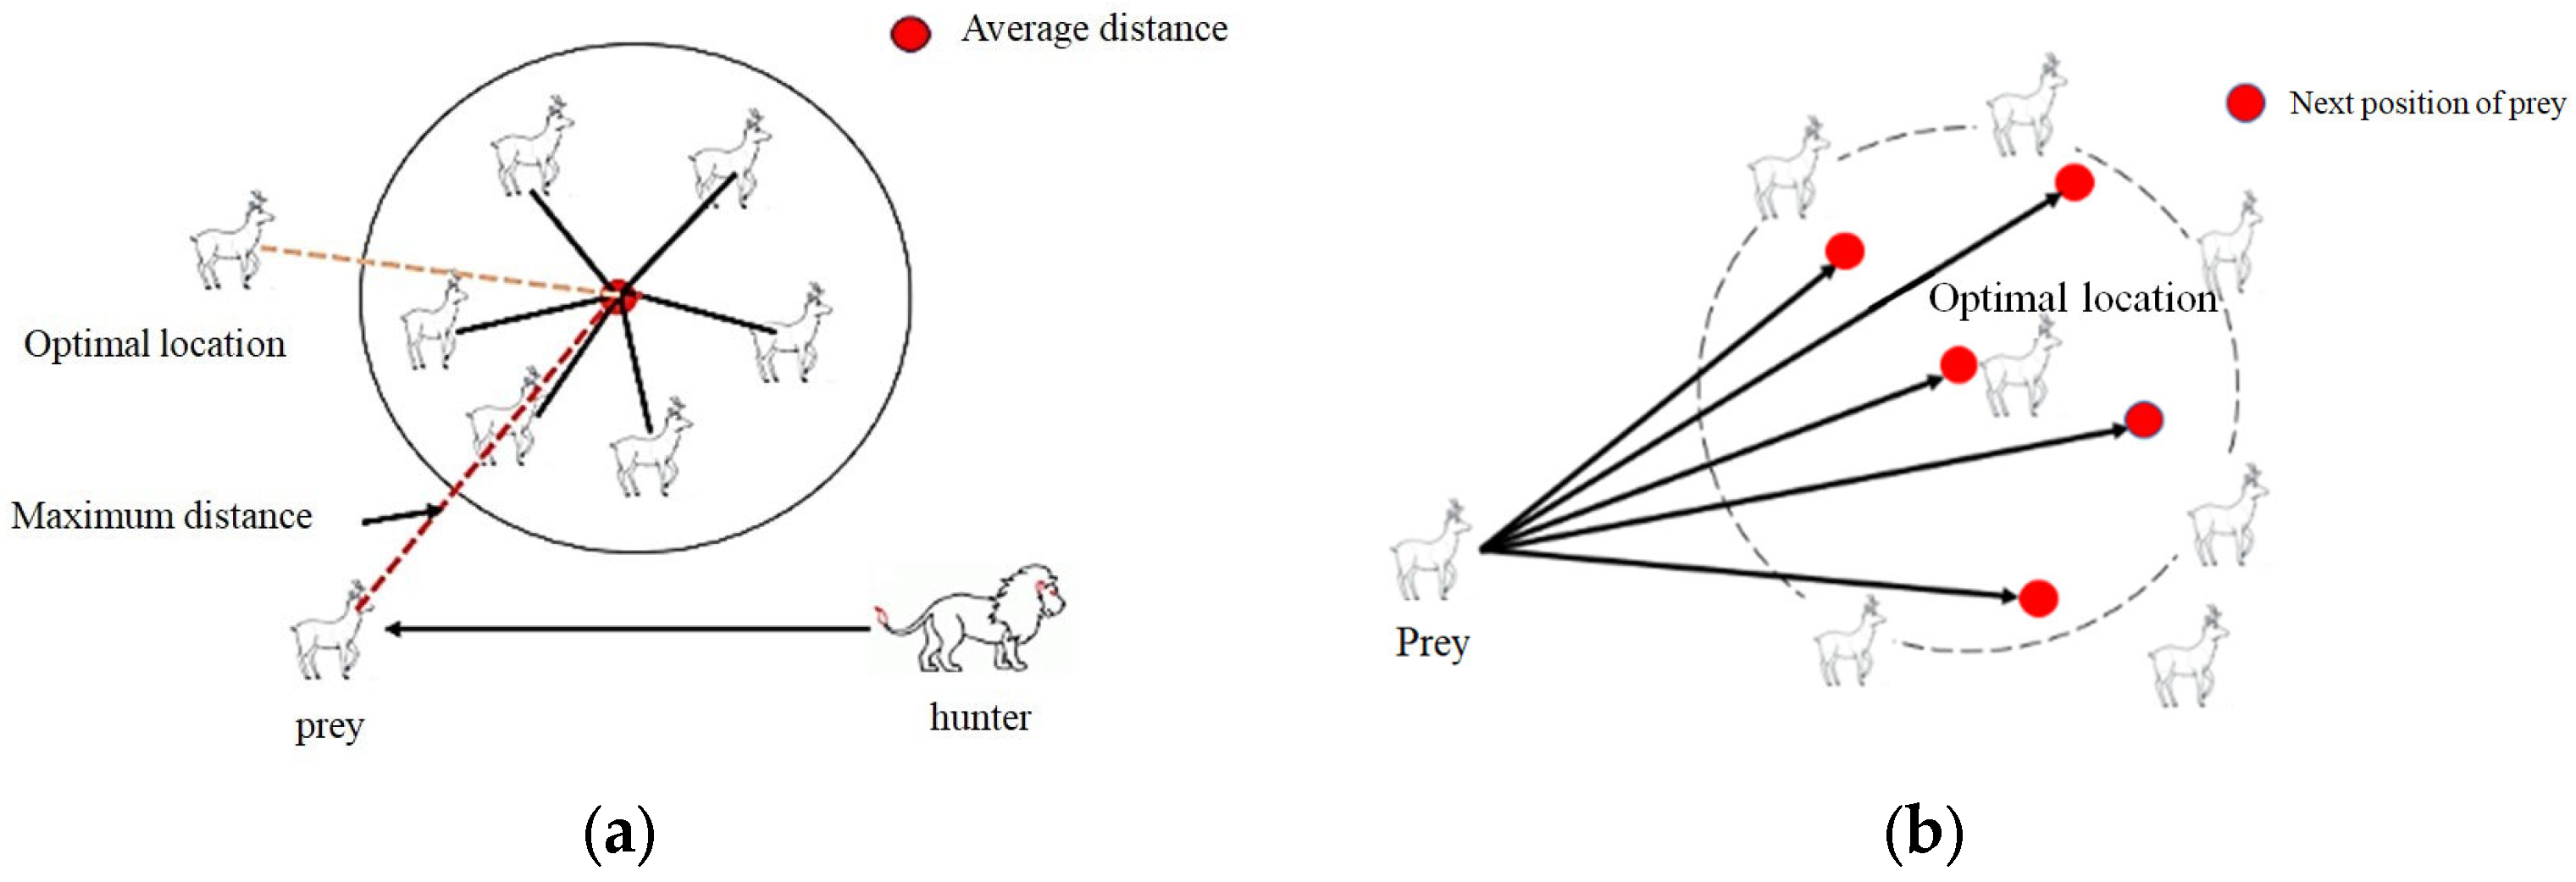
  • Introducing a hunter search mechanism, hunters choose prey far from the group as their hunting targets, as shown in Equation (11).
    x i , j ( t + 1 ) = x i , j ( t ) + 0.5 ( 2 W Z P p o s ( j ) x i , j ( t ) ) + ( 2 ( 1 W ) Z τ ( j ) x i , j ( t ) )
    where x i , j ( t ) represents the current position of the hunter, x i , j ( t + 1 ) represents the next position of the hunter, P p o s ( j ) represents the position of the target prey, τ ( j ) represents the average position between the hunter and the prey, Z is the adaptive parameter, W is the equilibrium parameter in algorithm exploration, and its calculation process is shown in Equation (12).
    W = 1 t ( 0.98 t max ) ,
    where t represents the number of iterations, and tmax represents the maximum number of iterations.
  • A prey escape mechanism is introduced. The prey moves to the global optimal position to avoid the hunter’s search to escape hunting, as shown in Equation (13).
    x i , j ( t + 1 ) = T p o s ( j ) + W Z cos ( 2 π R ) × ( T p o s ( j ) x i , j ( t ) ) ,
    where x i , j ( t ) represents the current position of the prey, x i , j ( t + 1 ) represents the next position of the prey, T p o s ( j ) is the target position of the prey (global optimal position), and R is a random number within the range of [−1,1].
  • Combining Equations (11) and (13) to obtain the algorithm’s selection mechanism for hunter-prey behavior, an adjustment parameter δ is set, and the random numbers R1 and δ between [0,1] are compared; if R1 is less than δ , the hunter search mechanism is executed. On the contrary, the prey escape mechanism is triggered until the conditions are met and the optimization is completed. In this paper, the regulating parameter δ is set as 0.1. Figure 1 is a schematic diagram of the location of hunters searching for prey and the process of prey escape.

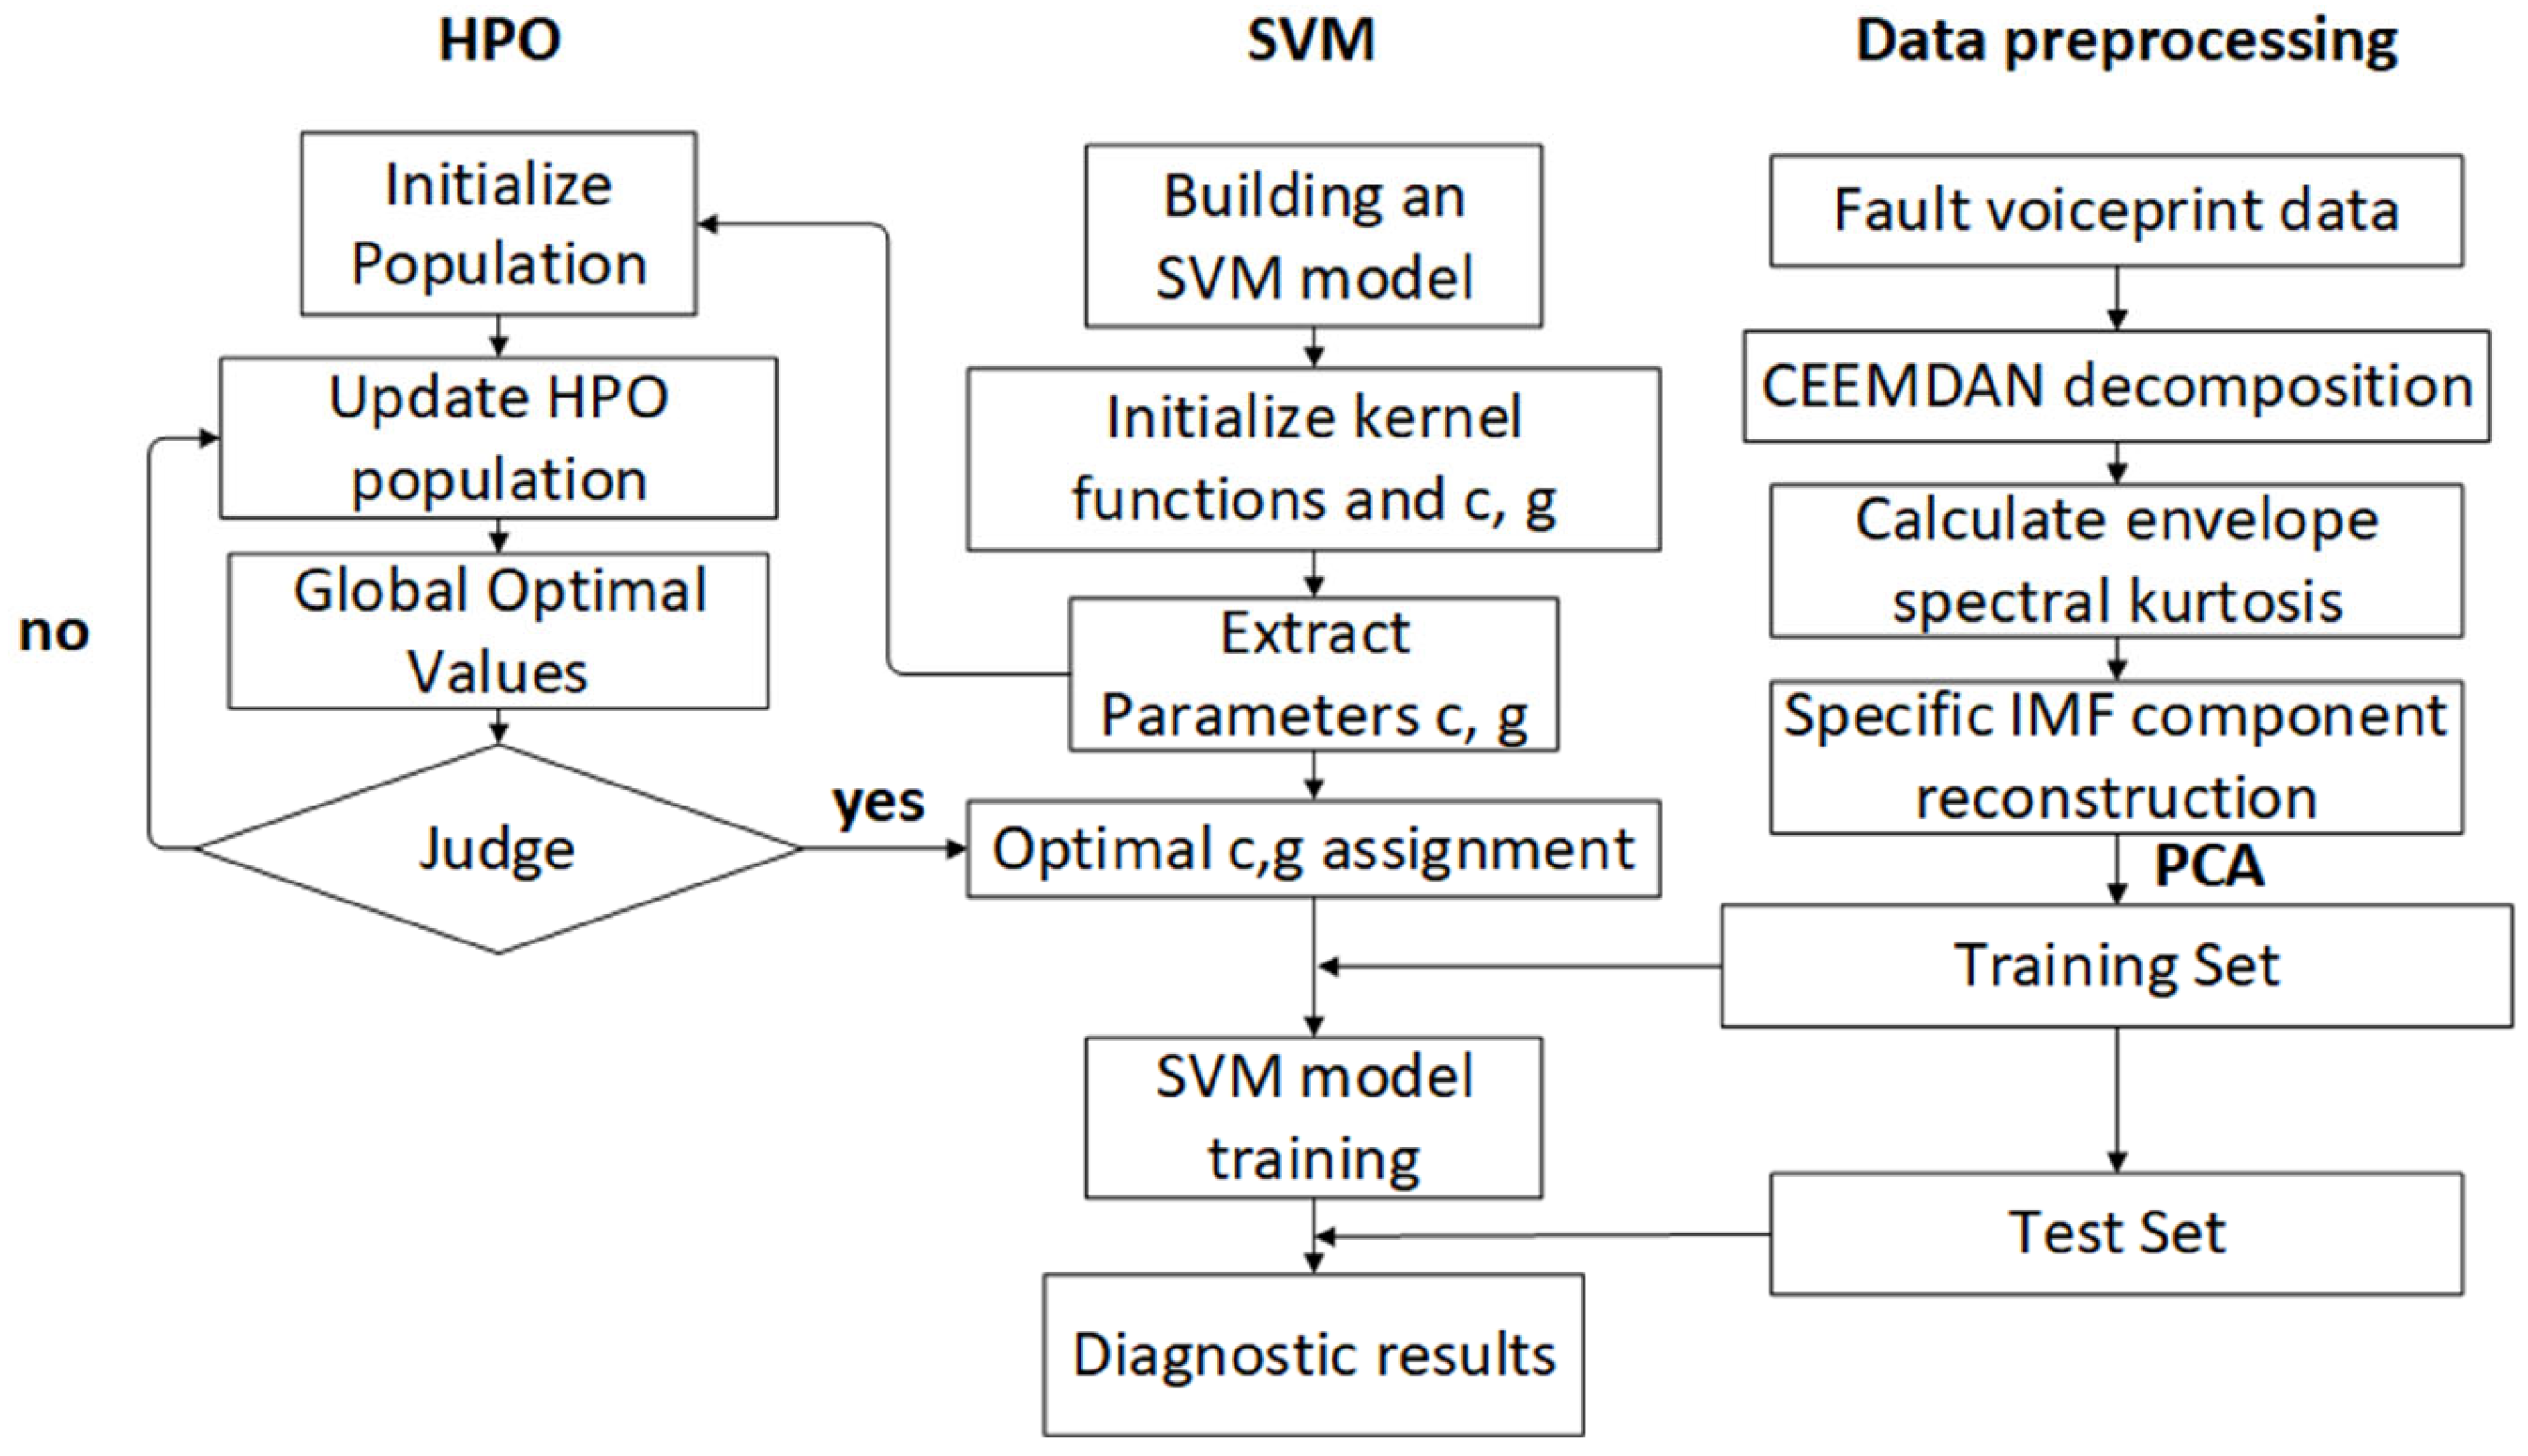
3. CEEMDAN-HPO-SVM Diagnostic Process

The structural framework based on CEEMDAN-HPO-SVM is shown in Figure 2. This structural framework mainly includes the HPO module, SVM module, and data processing module. CEEMDAN decomposition is performed on the collected voiceprint signal data of power transformers in different states, the envelope spectral kurtosis of the decomposed IMF components is calculated, and the components with higher envelope spectral kurtosis are selected and reconstructed into a new signal sequence. Using the HPO algorithm to optimize the penalty factor C and kernel parameter g of the kernel function in SVM, the C and g values of the optimal position are assigned to SVM, and the constructed feature matrix is trained and tested.

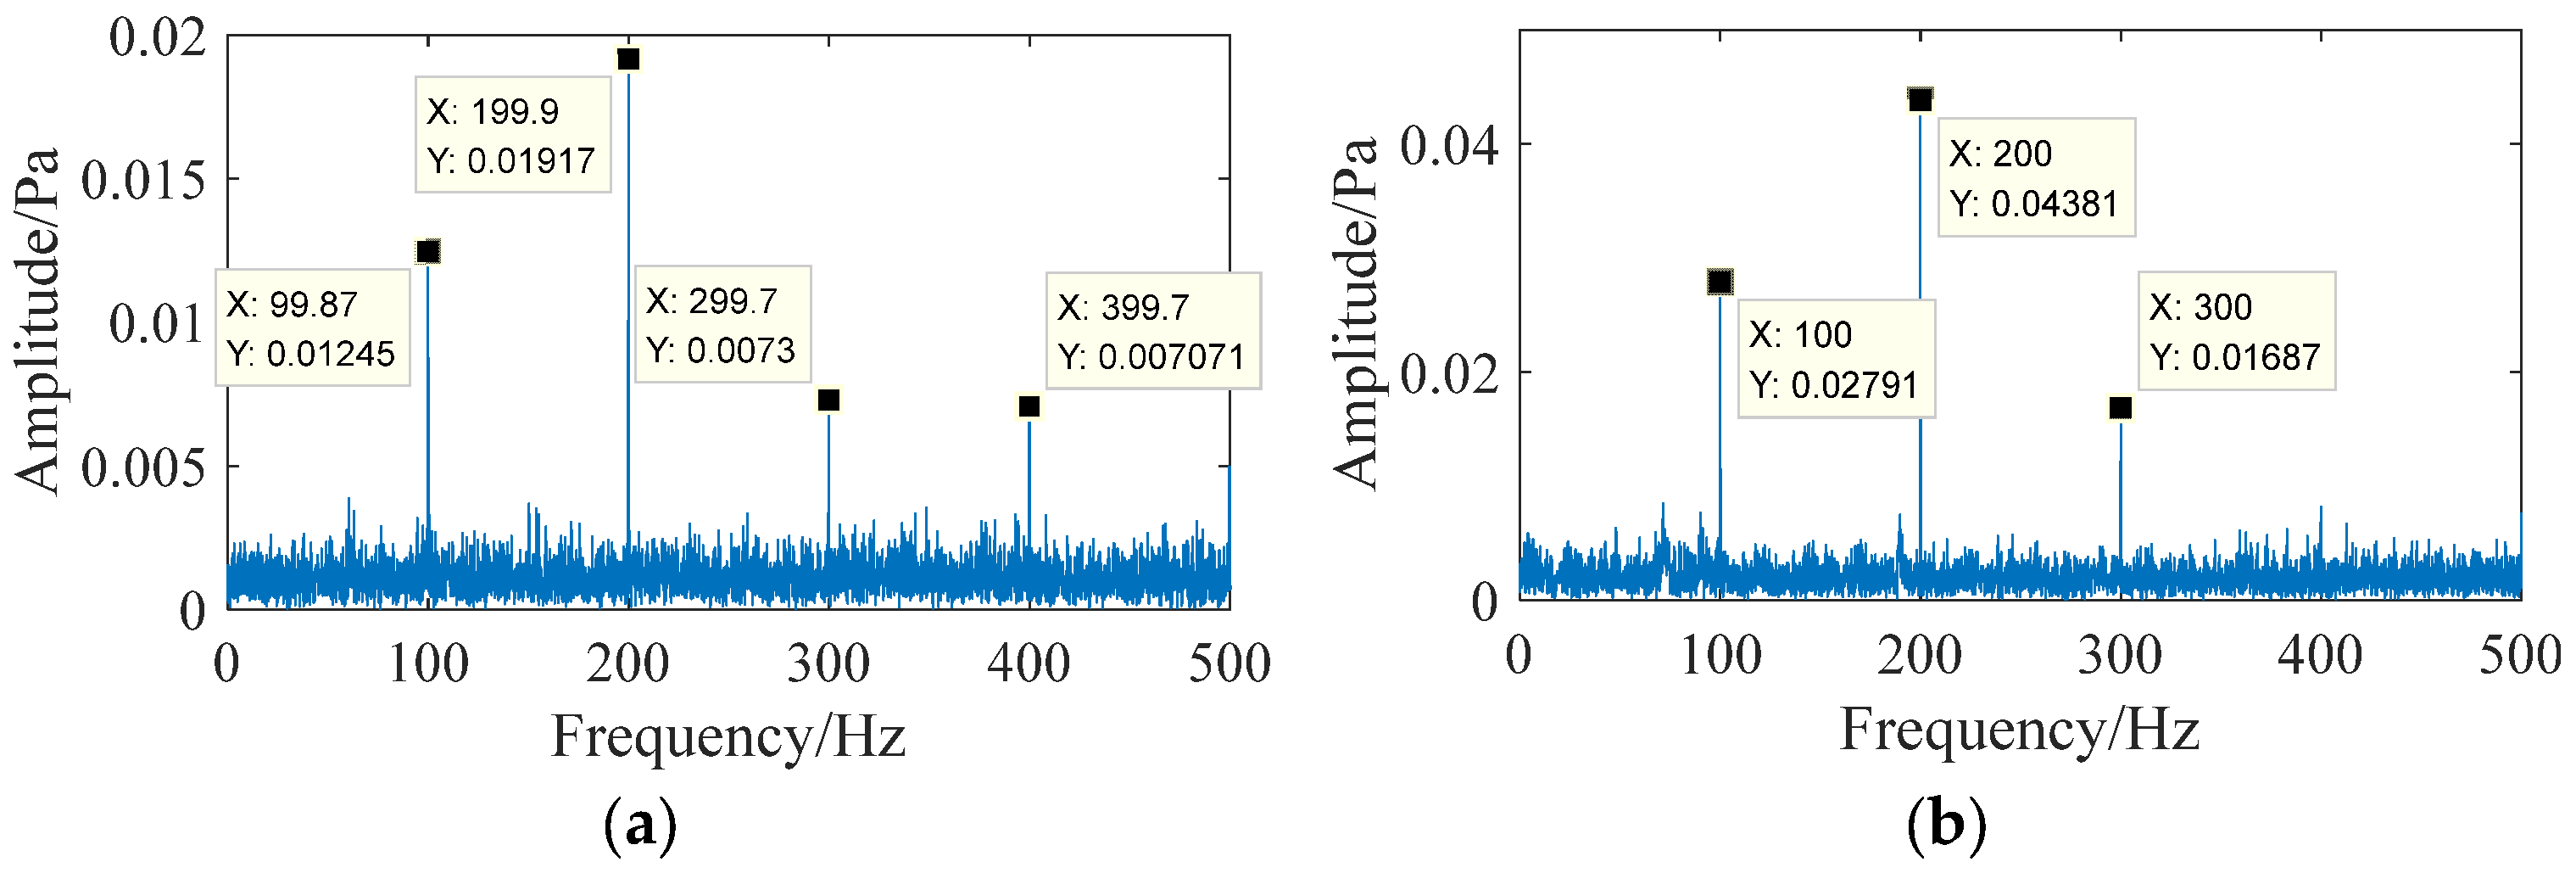
4. CEEMDAN Fault Feature Extraction

The winding of a power transformer will withstand high amplitude and wide frequency electrical forces during the process of short-circuit impact. Strong nonlinear vibration response is generated, and the short-circuit electrodynamic frequency borne by its winding mainly occurs at 50 Hz, 100 Hz, and their octaves [28]. A voiceprint signal of a power transformer short-circuit impulse fault without noise interference for analysis is selected. The time domain and frequency domain signals are shown in Figure 3. The impact characteristics are obvious in the time domain signal and its frequency doubling components, and the frequency domain signal contains 100 Hz, indicating obvious fault characteristics.
When collecting voiceprint signals from power transformers, during the transmission of fault signals from the internal winding of the transformer to the sound sensor, they will be coupled with interference factors such as speaking, bird calls, and machine roars in the transmission path; interference factors will, to some extent, mask the fault voiceprint information. To replicate the acoustic environment of the substation during normal operation as much as possible, an audio signal containing interference noise is added to the transformer short-circuits impact voiceprint signal to obtain the time-frequency domain signal of the voiceprint signal affected by noise interference. As shown in Figure 4, the short-circuit impulse characteristics in the time domain signal are completely submerged by noise, and the 100 Hz and its harmonics are not obvious in the frequency domain diagram.
Using CEEMDAN to analyze the noisy signal, 15 IMF components were decomposed. Calculate the envelope spectral kurtosis of each component separately, as shown in Figure 5. The envelope spectral kurtosis of IMF4, IMF5, and IMF9 is relatively high. Three sets of IMF components are reconstructed and analyzed in both time and frequency domains; the results are shown in Figure 6. The short-circuit impact characteristics are obvious in the time domain diagram, and there are 100 Hz and its frequency-doubling components in the frequency domain diagram. This indicates that CEEMDAN can achieve the separation of fault voiceprint information and transmission path interference factors by combining the envelope spectral kurtosis index to characterize voiceprint information in the frequency domain, and accurate extraction of fault information components is achieved.

5. Experimental Verification

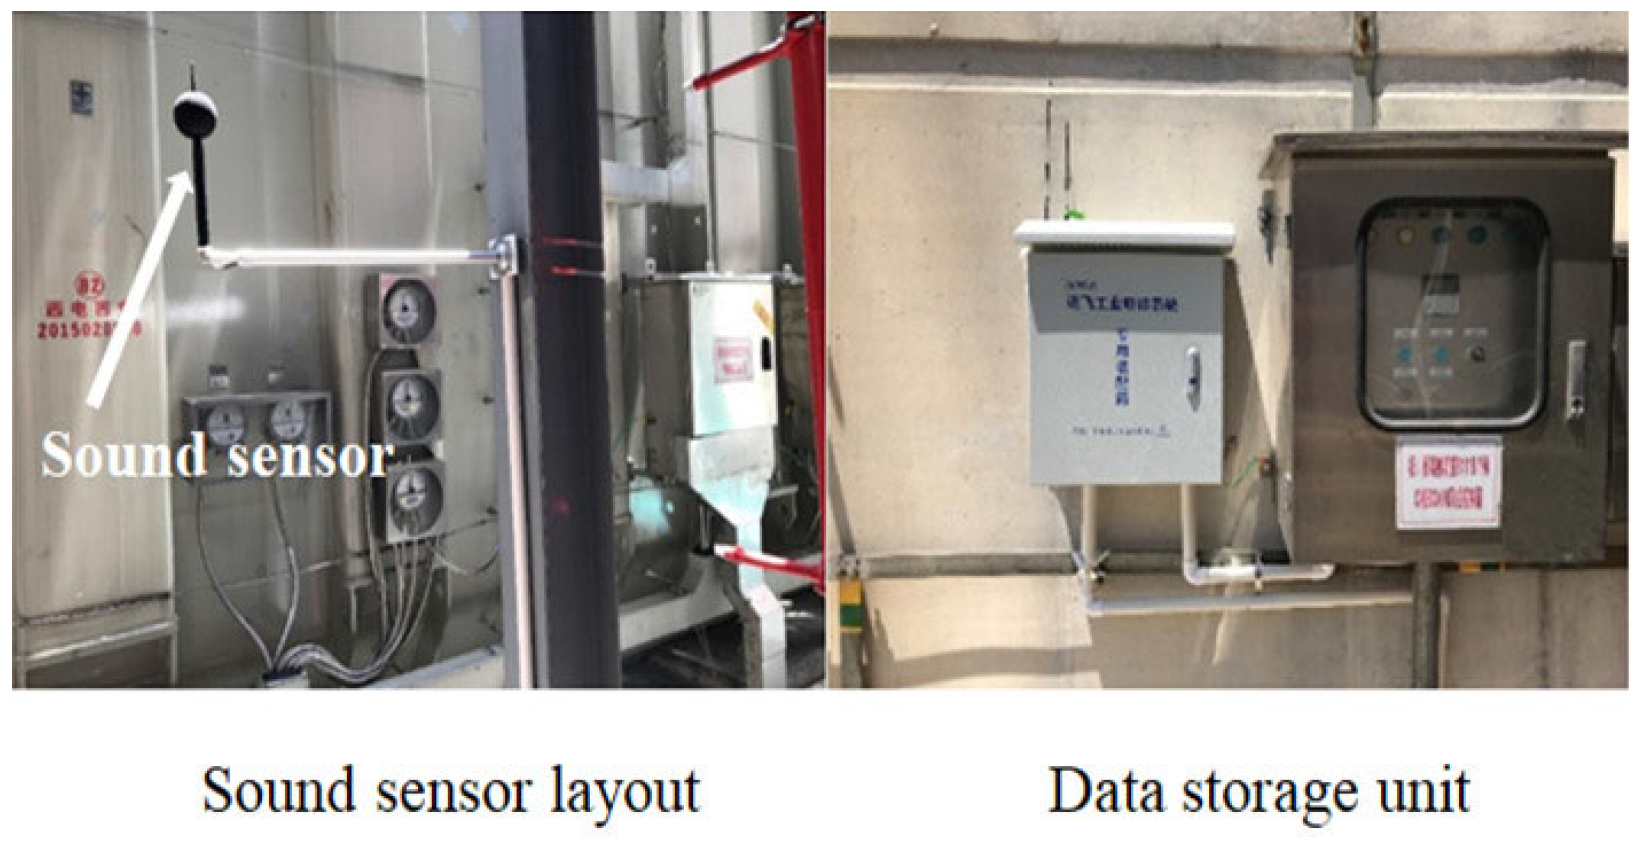
5.1. Data Collection

To verify the recognition ability of the HPO-SVM algorithm for voiceprint signals under different faults of power transformers, iFlytek’s voiceprint acquisition equipment is used to collect full cycle voiceprint signals from multiple power transformers, the collection time is about one year, The collection environment is shown in Figure 7, with a frequency response range of 10 Hz~20 kHz and a sampling frequency of 16,000 Hz. The sensitivity of the sound sensor used is 50 mV/Pa. Audible voiceprint signals of power transformers are collected under normal conditions and faults such as short circuit impact.
CEEMDAN decomposition is performed on the collected three types of fault samples and normal samples, and components with high kurtosis in the envelope spectrum are selected for reconstruction. Divide the reconstructed signal into 400 groups in chronological order, each containing 300 sampling points, built into a size of 400 × 300 feature matrix. To ensure that faults such as short circuit impact include fault features in each group of samples, the feature matrix was transposed, and the results are shown in Table 1. Each group of faults contains 300 sets of samples, each containing 400 sample points. The following numbers of samples were selected: 3/5 for model training, 1/5 as a validation set, and 1/5 as test samples.

5.2. Model Parameter Selection

The performance of SVM mainly depends on the selection of kernel functions and the setting of its main parameters. RBF kernels that involve fewer parameters and have good classification performance are selected. The initialization penalty factor C is 1, the kernel function parameter g is 0.01, the HPO algorithm population is set to 10, and the number of iterations is 10.

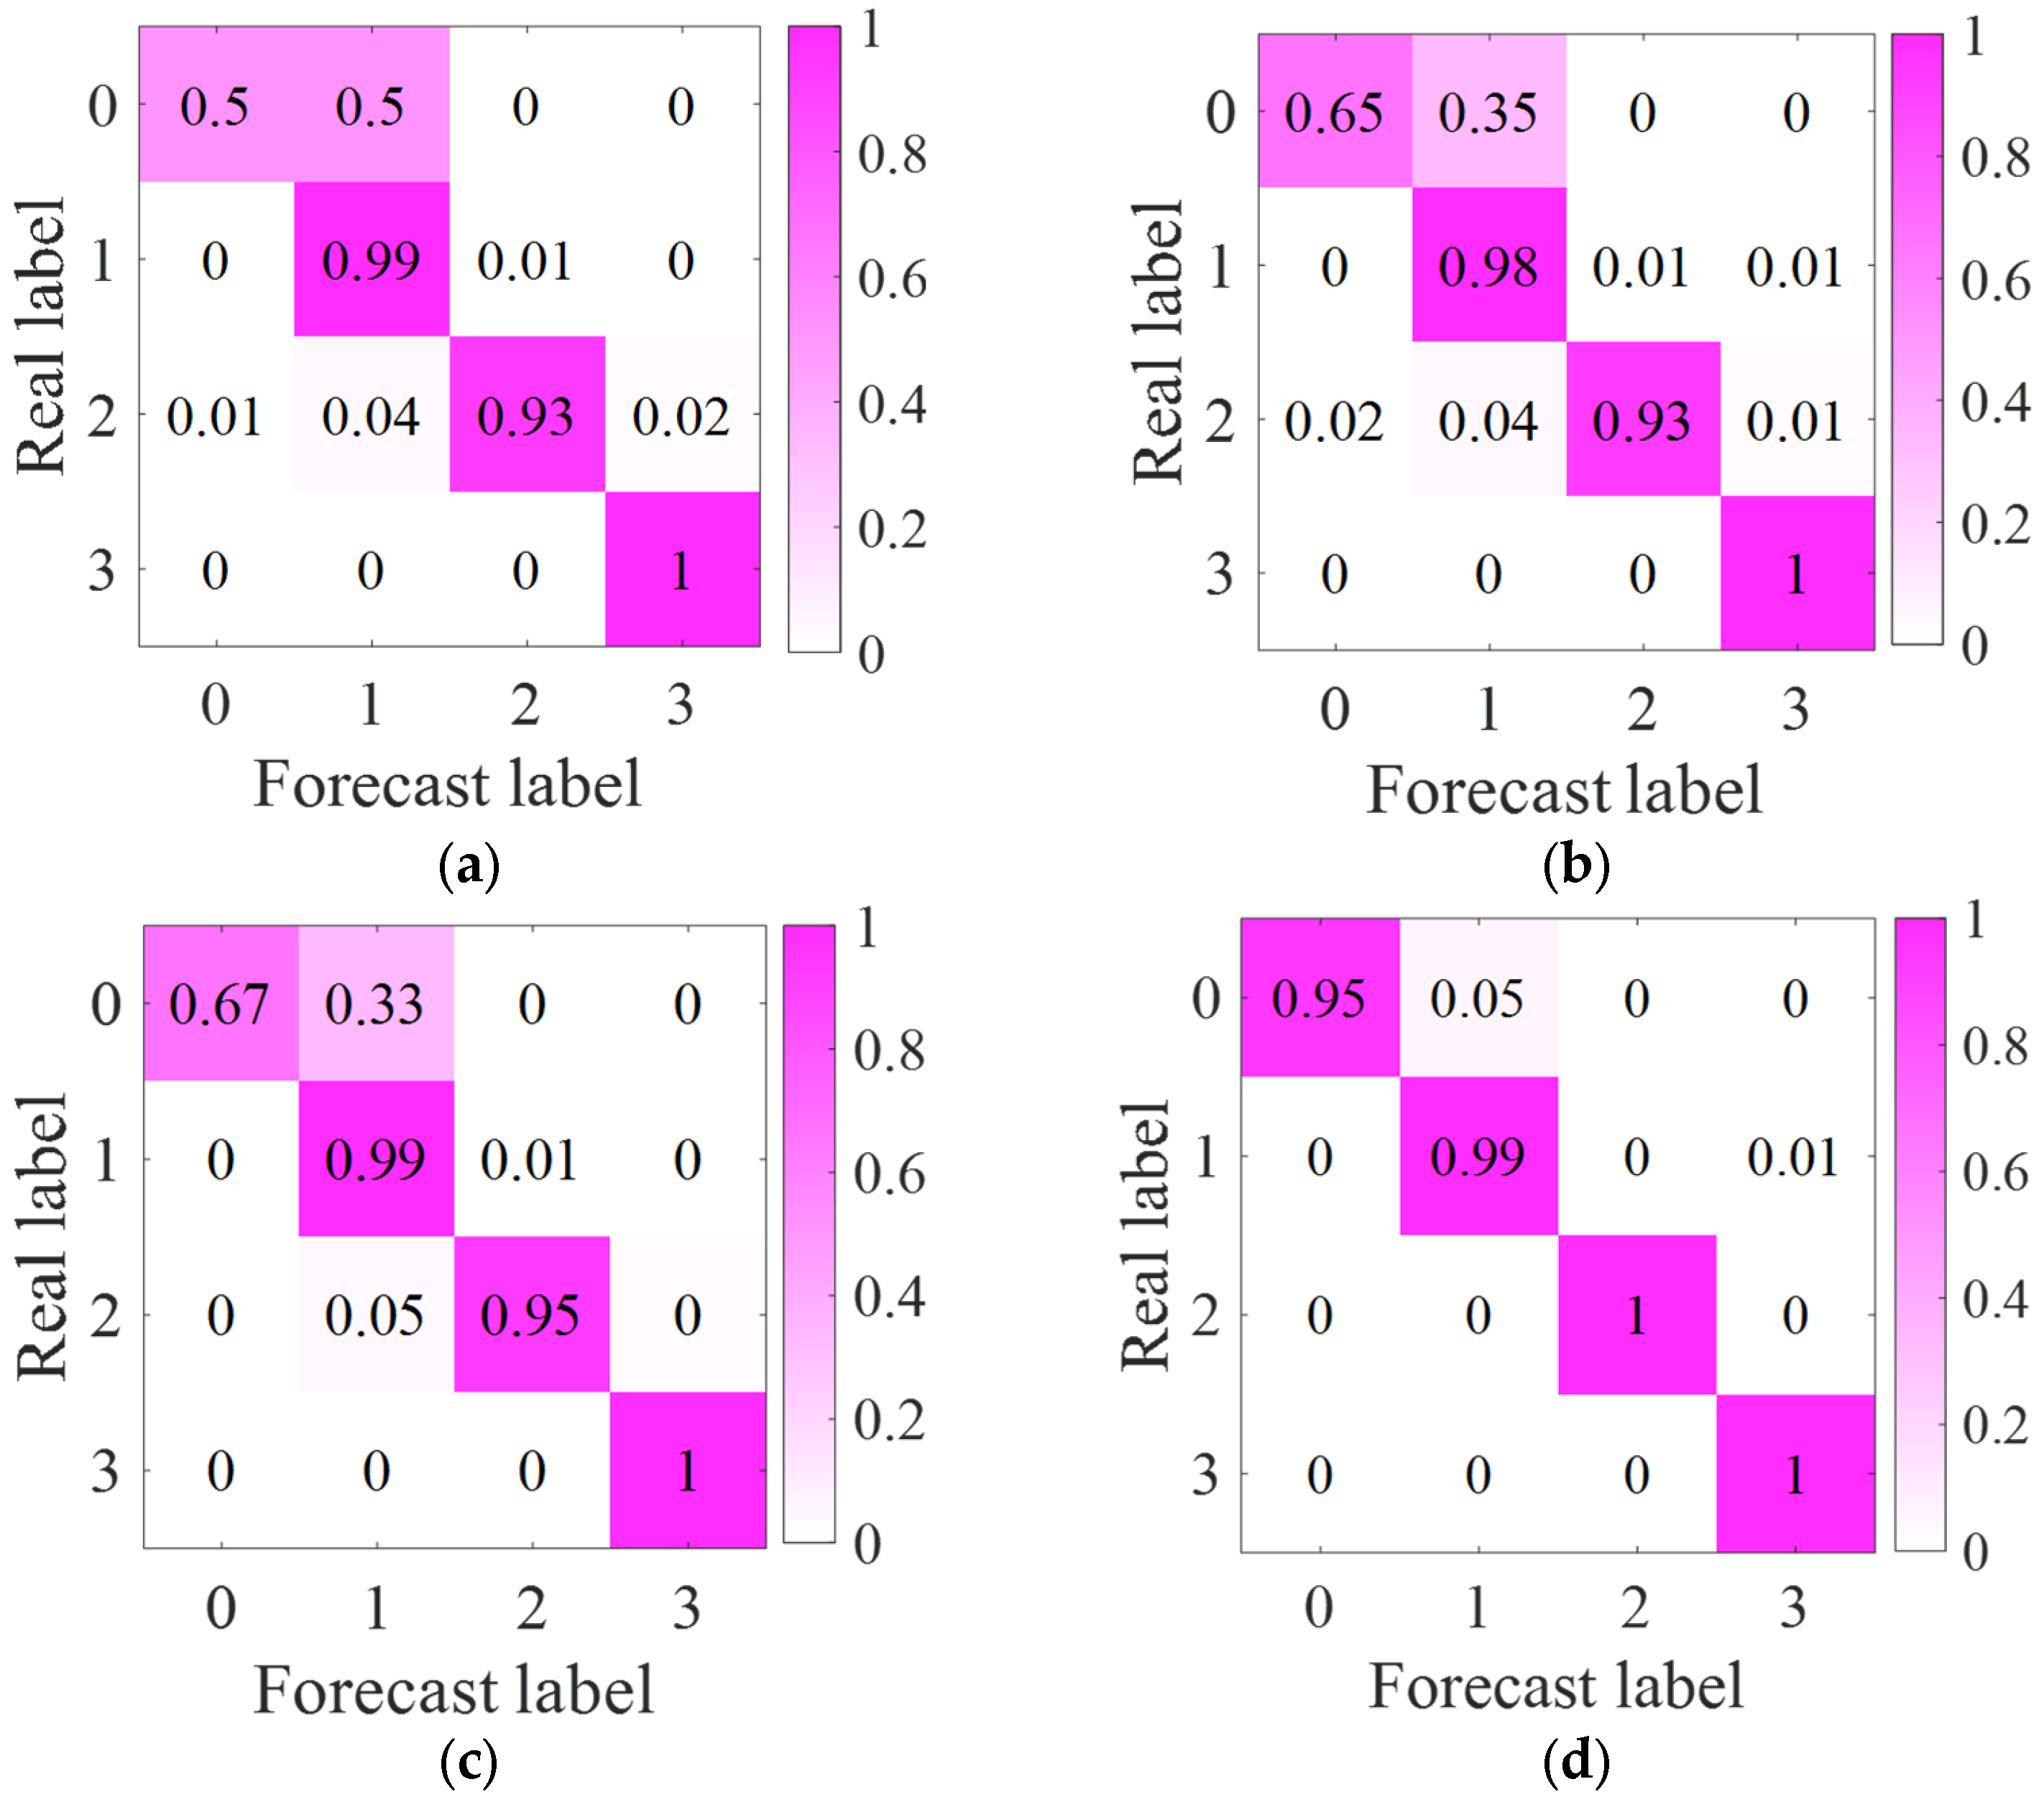
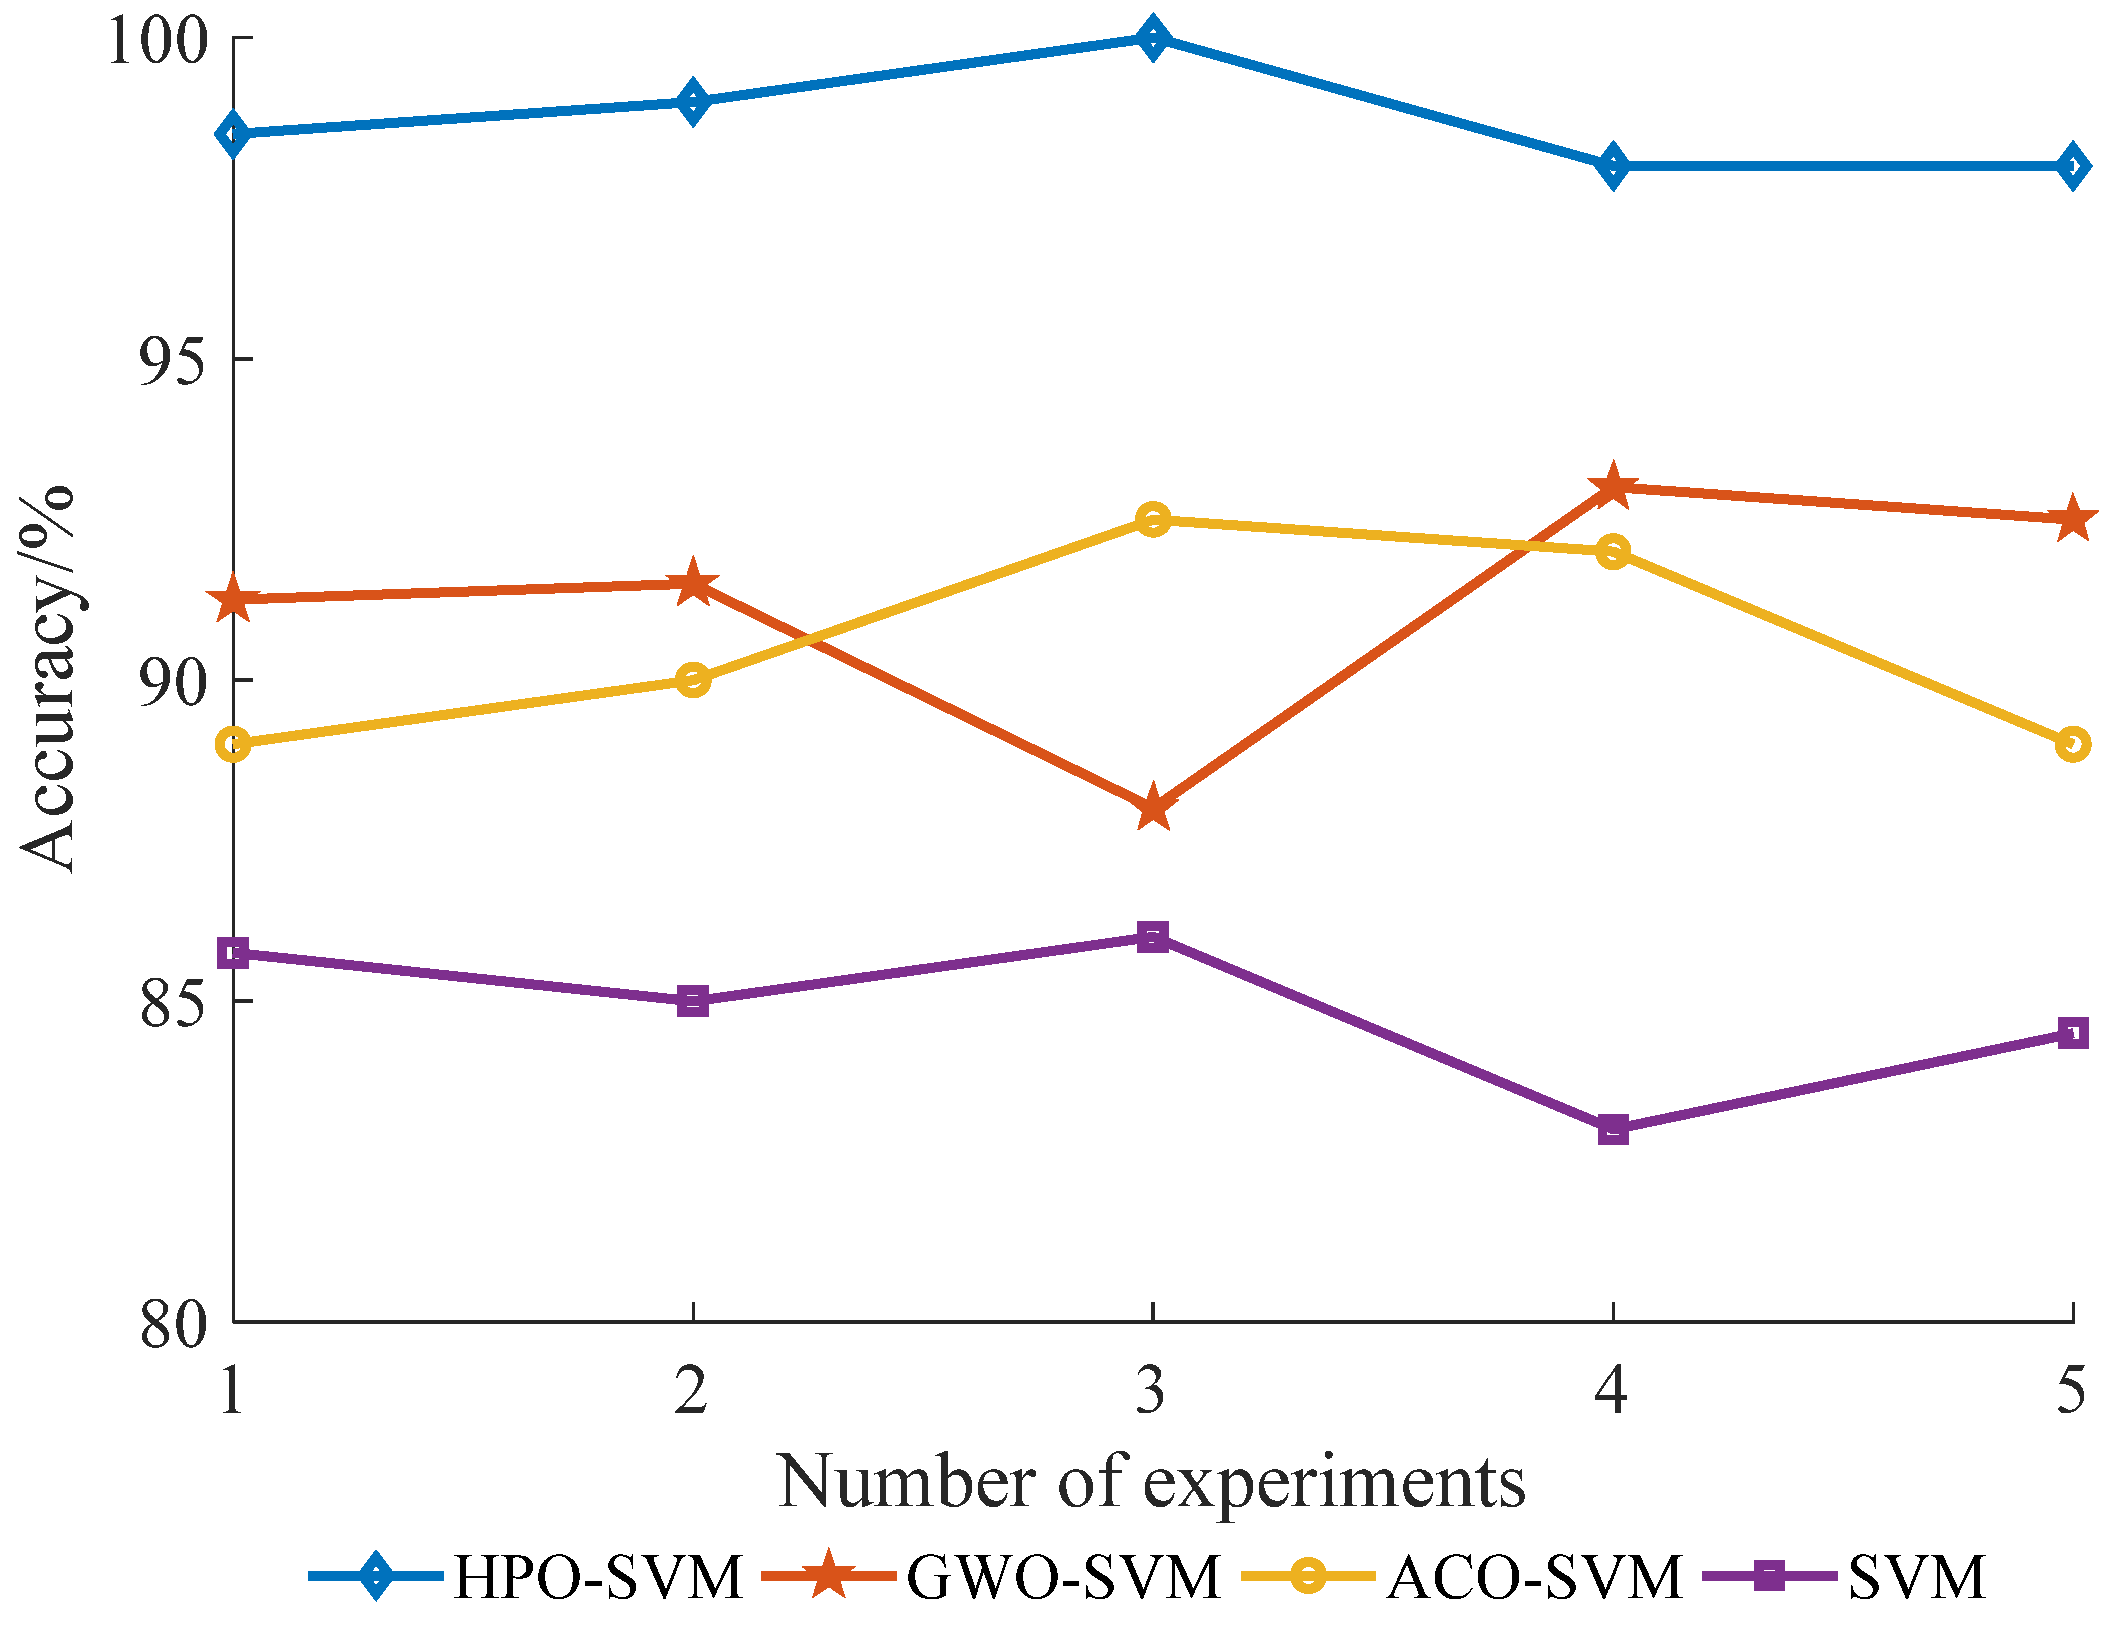
5.3. Experimental Results and Analysis

Introducing the denoised signal directly into SVM for fault diagnosis faced problems such as redundant data, which is not conducive to the division of hyperplanes. To achieve better diagnostic results, the denoised signal is subjected to principal component analysis, using the PCA method for time domain and frequency domain analysis of experimental signals. Five time domain and frequency domain features were selected for principal component analysis (time domain features: mean, root mean square, peak factor, kurtosis, variance; frequency domain features: power spectrum, mean frequency, Rice frequency, frequency center of gravity, and frequency variance, numbered A1–A10). The analysis results are shown in Table 2; the cumulative contribution rate of the first five principal components exceeded 90%, reaching 92.5185%. The contribution rates of the last five principal components are very small. To reduce the training time of the model, the first five factors are taken as input variables.
The HPO algorithm is used to optimize parameters C and g, the calculation results are assigned to SVM, and the constructed fault dataset is inputted into the HPO-SVM model for training. The classification ability of standard SVM and SVM models optimized by ACO and GWO on datasets are compared to verify the optimization effect of HPO in population optimization algorithms. The SVM kernel function and its parameter values are consistent with the HPO algorithm. The confusion matrix is used to measure the classification accuracy of each model. The classification results are shown in Figure 8. The diagnostic accuracy of the standard SVM algorithm is 85.50% due to the overlapping phenomenon between normal signals and short-circuit impulse faults, with 50% of normal signals being classified as short-circuit impulse faults. To address the aliasing phenomenon between normal signals and short-circuit impulse faults, spectral analysis is conducted on the reconstructed normal signals and short-circuit impulse signals; the results are shown in Figure 9. The main frequency of normal signals is close to the fault frequency of short circuit impacts, indicating the limitations of standard SVM algorithms in classifying signals with similar features and reflecting the importance of population algorithms in optimizing SVM parameters. ACO-SVM and GWO-SVM algorithms have improved accuracy compared to standard SVM; they reached 89.00% and 90.25%, respectively, increasing the recognition rate between normal signals and short-circuit impact signals by about 15%. The accuracy of the HPO algorithm proposed in this article reaches 98.50%. The recognition rate for normal signals has reached 95%, which is 45% higher than the standard SVM algorithm, This indicates that HPO optimization has enhanced the classification ability of the SVM algorithm and improved the diagnostic efficiency of the algorithm for voiceprint signals.
The training results of various swarm optimization algorithms are shown in Table 3. The iteration speed and optimization results of the HPO algorithm are superior to other population algorithms, proving that the HPO algorithm has better iterative efficiency and optimization ability in processing voiceprint signals of power transformers. The penalty factor C is optimized by the HPO algorithm, and the kernel function parameter g value is closest to the optimal solution, improving the diagnostic ability of the SVM model.
To avoid the contingency brought by a single test, five experiments are repeated on four SVM models, and the experimental results are shown in Figure 10. The diagnostic accuracy of the standard SVM algorithm is around 85%; ACO-SVM and GWO-SVM models have improved accuracy compared to standard SVM, but the accuracy fluctuates significantly between several experiments. The accuracy of the HPO algorithm has reached over 95%, proving that the HPO algorithm has strong parameter optimization ability and good stability when dealing with signals with overlapping features.
The types of noise interference that power transformers are subjected to during operation are unpredictable. To verify the generalization performance of the algorithm when dealing with different kinds of noise, based on collecting various voiceprint signals, speech and bird calls, continuous machine roar, aperiodic transient impact, and Gaussian white noise with a signal-to-noise ratio of 1 dB and 5 dB are added, respectively, to construct a new data set. Taking the fault signal of a short circuit impact as an example, the superimposed noisy signal is shown in Figure 11, The blue lines represent the fault signal, while the red lines represent the noise interference superimposed on the original signal. Using the algorithm presented in this article for analysis, the diagnostic results were compared with the other three SVM algorithms, and the results are shown in Table 4. After adding different types of noise to the dataset, the diagnostic accuracy of each model decreased. Among them, the standard SVM algorithm is the most affected. When it is subjected to strong noise interference with a signal-to-noise ratio of 1 dB, its diagnostic performance is greatly affected, with an accuracy rate of only 63.50%, a decrease of about 20%. When there is continuous machine roar signal interference in the environment, the diagnostic accuracy is also poor. The standard SVM algorithm is relatively less affected when processing voiceprint signals with speech sounds and bird calls, aperiodic transient impact signals, and Gaussian white noise with a signal-to-noise ratio of 5 dB, but the accuracy rate also drops by about 5%. The accuracy of GWO-SVM and ACO-SVM population optimization algorithms significantly decreases when processing voiceprint signals with different types of noise. The algorithm in this paper still maintains a good diagnostic effect when interfered with by various noise signals. The diagnostic efficiency can still reach 86.25% when interfered with by 1 dB Gaussian white noise, and the diagnostic efficiency when dealing with typical noise interference is more than 92%.
To further verify the superiority of the HPO-SVM algorithm, random forest, and KNN, classifiers are introduced based on the original four algorithms, with accuracy, precision, recall, and F1 value as the measurement indicators. The analysis results are shown in Figure 12. The accuracy and precision of the HPO-SVM algorithm are optimal, which is 8.4% higher than that of the random forest algorithm. The KNN algorithm has poor diagnostic performance for signals, with evaluation indicators below 50%. This indicates that it is sensitive and has poor classification performance when dealing with feature overlap issues. From this, it can be seen that the HPO-SVM model has a good diagnostic effect on the voiceprint signal of power transformers.

6. Conclusions

This article takes the voiceprint signal of 110 kv power transformer faults as the research object and proposes a power method transformer voiceprint fault diagnosis based on CEEMDAN and HPO-SVM.
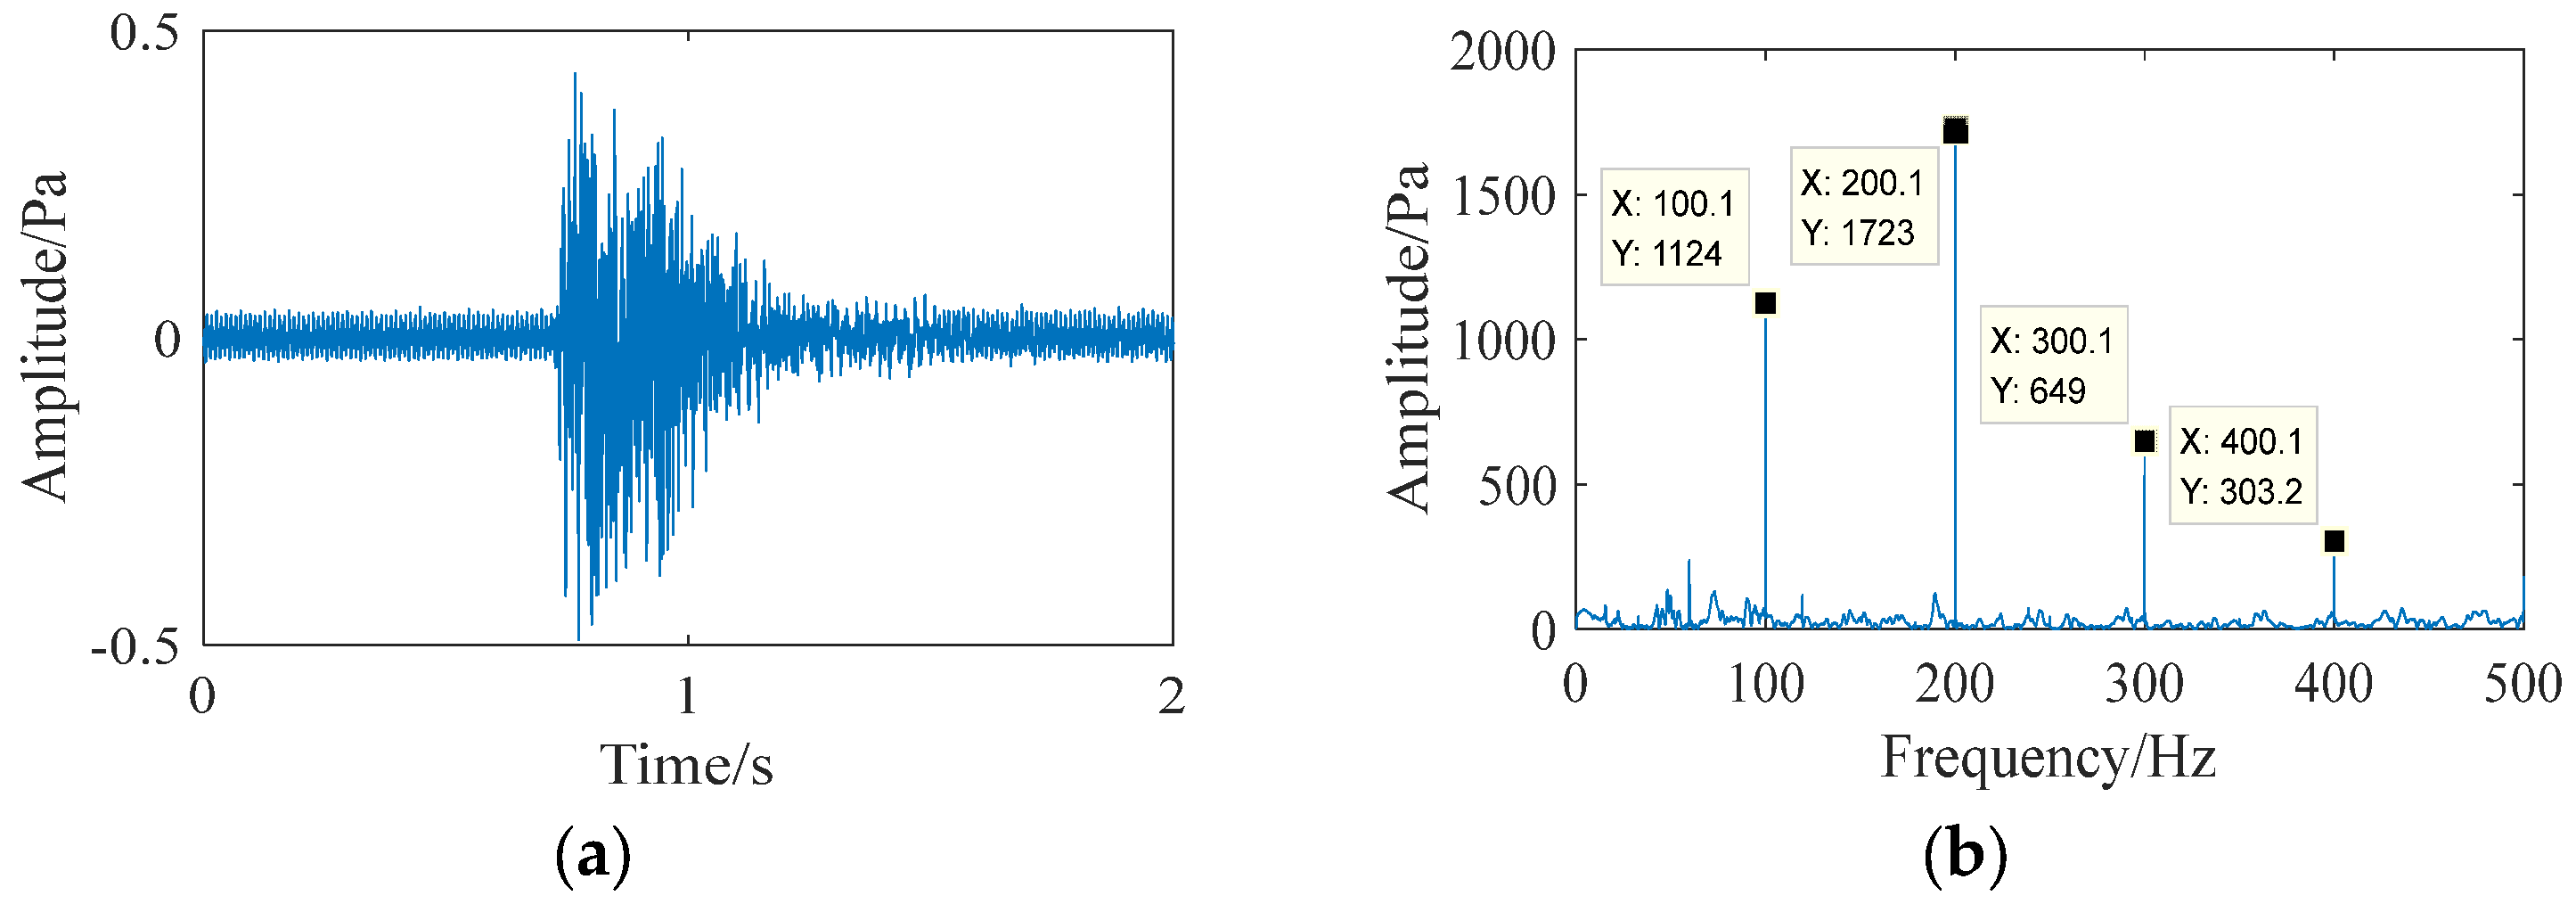
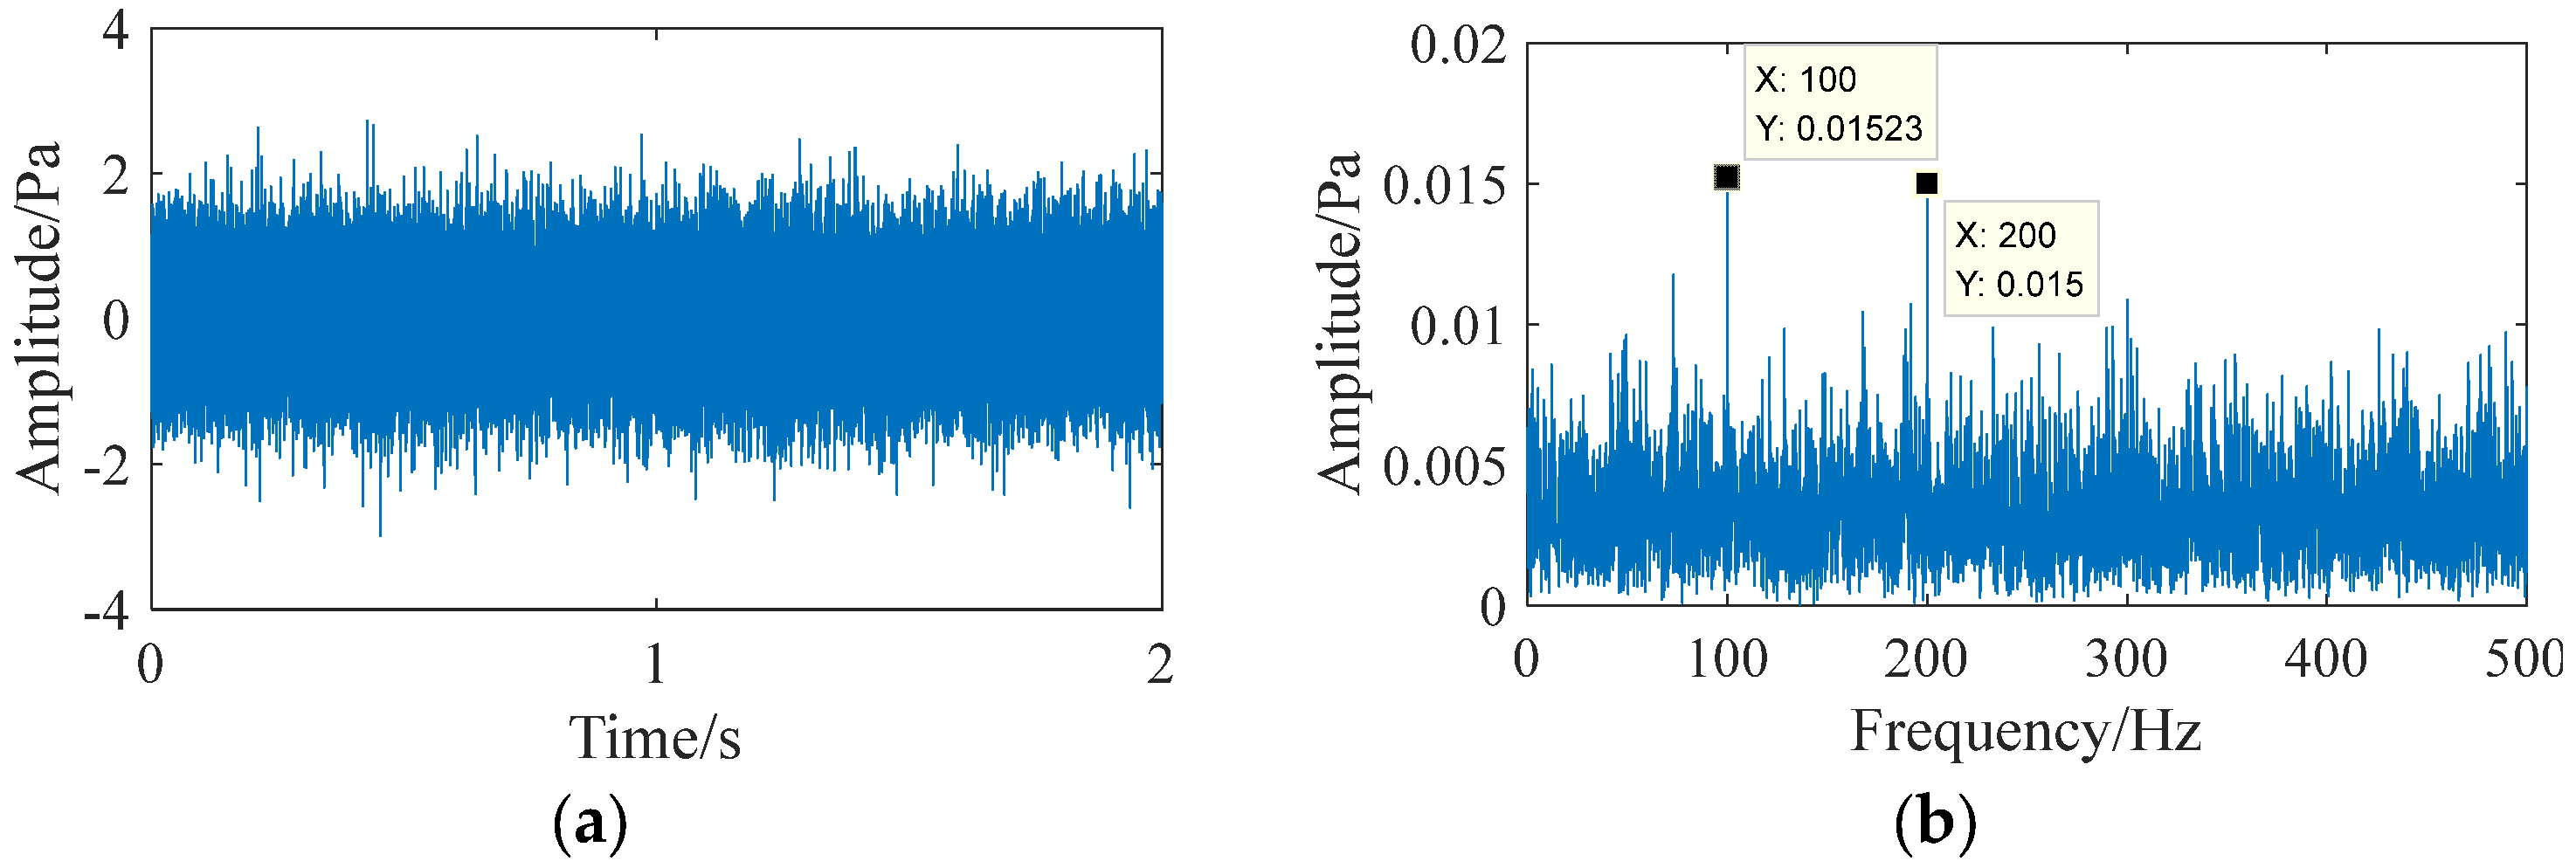
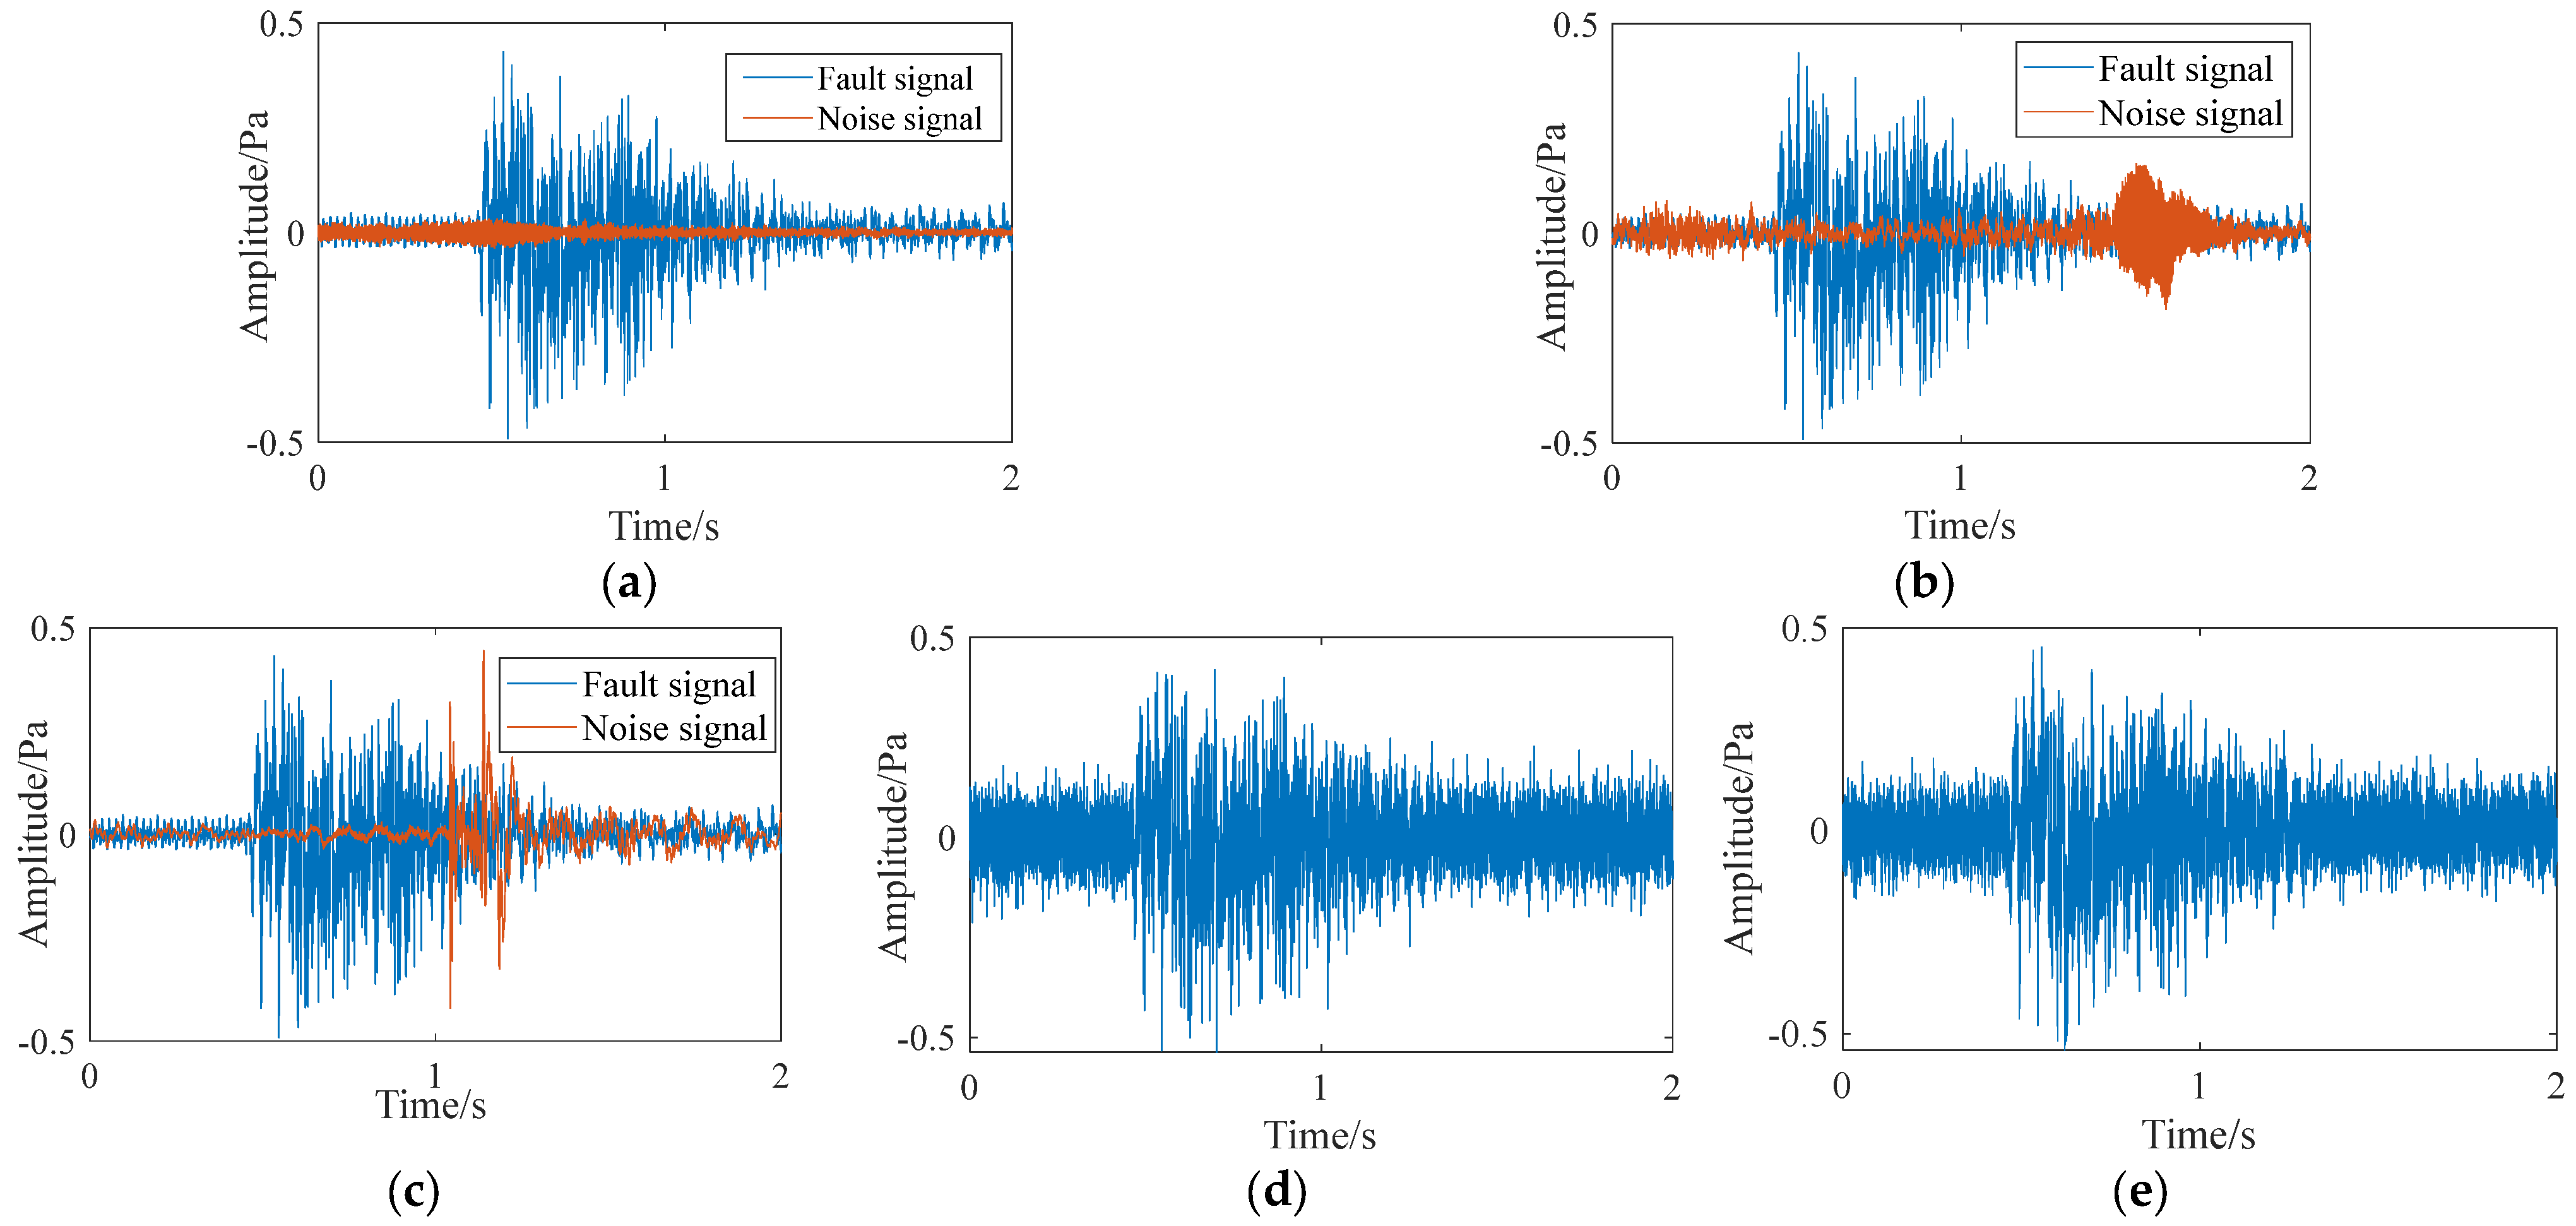
  • The transformer voiceprint signal is susceptible to interference from transmission path coupling noise during transmission. To address this issue, the use of CEEMDAN can achieve the separation of fault voiceprint information and transmission path interference factors and combine the envelope spectral kurtosis index to characterize voiceprint information in the frequency domain, achieving accurate extraction of fault information components.
  • The population optimization algorithm can improve the diagnostic ability of SVM for feature overlap problems by optimizing the parameters of SVM kernel functions C and g. The HPO algorithm has higher iteration efficiency and optimization ability compared to GWO and ACO algorithms, which can improve the generalization performance of the model, and combining the SVM algorithm can achieve good pattern recognition results.
This article provides a basis for the diagnosis of typical voiceprint faults in power transformers, but currently, the types of faults in power transformers are relatively limited. Other types of fault information need to be further collected and extracted. In the future, our work needs to supplement and improve the types of faults generated by power transformers, optimize diagnostic methods, and improve diagnostic efficiency.

Author Contributions

Conceptualization, F.D. and Z.Z.; methodology, X.L.; software, J.Z.; validation, J.W., Z.Z., and X.L.; formal analysis, F.D.; investigation, J.Z. and Z.Z.; resources, Z.Z.; data curation, J.Z.; writing—original draft preparation, J.W.; writing—review and editing, J.W. and Z.Z.; visualization, S.W.; supervision, J.Z. and X.L.; project administration, J.W.; funding acquisition, J.W. All authors have read and agreed to the published version of the manuscript.

Funding

This work is supported by State Grid Jibei Electric Power Co., Ltd. Technology Project (520105220008).

Institutional Review Board Statement

Not applicable.

Informed Consent Statement

Not applicable.

Data Availability Statement

Not applicable.

Conflicts of Interest

The authors declare no conflict of interest.

References

  1. Sun, X. Numerical analysis of an exponentially ill-conditioned boundary value problem with applications to metastable problems. IMA J. Numer. Anal. 2001, 21, 817–842. [Google Scholar] [CrossRef]
  2. Li, Z.; Jiao, Z.; He, A.; Xu, N. A denoising-classification neural network for power transformer protection. Prot. Control. Mod. Power Syst. 2022, 7, 52. [Google Scholar] [CrossRef]
  3. Chernov, A.; Butakova, M.; Kostyukov, A.; Kartashov, O. Intelligent Framework and System for Remote Monitoring and Prediction of Power Transformer Conditions. In Proceedings of the 21st International Multidisciplinary Conference on Reliability and Statistics in Transportation and Communication (RelStat), Riga, Latvia, 14–15 October 2021; pp. 321–330. [Google Scholar]
  4. Yao, D.; Li, L.; Zhang, S.; Zhang, D.; Chen, D. The Vibroacoustic Characteristics Analysis of Transformer Core Faults Based on Multi-Physical Field Coupling. Symmetry 2022, 14, 544. [Google Scholar] [CrossRef]
  5. Zhang, L.; Sheng, G.; Hou, H.; Jiang, X. A Fault Diagnosis Method of Power Transformer Based on Cost Sensitive One-Dimensional Convolution Neural Network. In Proceedings of the 2020 5th Asia Conference on Power and Electrical Engineering (ACPEE), Chengdu, China, 9–12 April 2020; pp. 1824–1828. [Google Scholar]
  6. Wang, Y.; Li, X.; Ma, J.; Li, S. Fault diagnosis of power transformer based on fault-tree analysis (FTA). In Proceedings of the International Symposium on Resource Exploration and Environmental Science, Ordos, China, 14–16 April 2017. [Google Scholar]
  7. Jin, L.; Kim, D.; Abu-Siada, A.; Kumar, S. Oil-Immersed Power Transformer Condition Monitoring Methodologies: A Review. Energies 2022, 15, 3379. [Google Scholar] [CrossRef]
  8. Yu, D.; Zhang, W.; Wang, H. Research on Transformer Voiceprint Anomaly Detection Based on Data-Driven. Energies 2023, 16, 2151. [Google Scholar] [CrossRef]
  9. Tianlu, C.; Gui, Y.; Ali, S.; Pei, W. Feature extraction and selection for defect classification of pulsed eddy current NDT. NDT E Int. 2008, 41, 6. [Google Scholar]
  10. Mian, T.; Choudhary, A.; Fatima, S. Vibration and infrared thermography based multiple fault diagnosis of bearing using deep learning. Nondestruct. Test. Eval. 2023, 38, 2. [Google Scholar] [CrossRef]
  11. Chen, L.; Zhi, X.; Wang, H.; Wang, G.; Zhou, Z.; Yazdani, A.; Zheng, X. Driver Fatigue Detection via Differential Evolution Extreme Learning Machine Technique. Electronics 2020, 9, 1850. [Google Scholar] [CrossRef]
  12. Jiang, F.; Kutia, M.; Sarkissian, A.J.; Lin, H.; Long, J.; Sun, H.; Wang, G. Estimating the Growing Stem Volume of Coniferous Plantations Based on Random Forest Using an Optimized Variable Selection Method. Sensors 2020, 20, 7248. [Google Scholar] [CrossRef] [PubMed]
  13. Pietrzak, P.; Wolkiewicz, M. On-line Detection and Classification of PMSM Stator Winding Faults Based on Stator Current Symmetrical Components Analysis and the KNN Algorithm. Electronics 2021, 10, 1786. [Google Scholar] [CrossRef]
  14. Liu, B.; Zhou, Y.; Feng, L.; Fu, H.; Fu, P. Hybrid CNN-SVM Inference Accelerator on FPGA Using HLS. Electronics 2022, 11, 2208. [Google Scholar] [CrossRef]
  15. Li, X.; Liao, X.; Lu, D.; Qiu, Z. A Robust Classification Method for Power Transformer Status Recognition Based on Sound Signals. In Proceedings of the 2021 5th International Conference on Power and Energy Engineering (ICPEE), Xiamen, China, 2–4 December 2021; pp. 153–157. [Google Scholar]
  16. Li, X.; Li, Y.; Xu, Y.; Li, R.; Zhang, G. Fault Diagnostics of Oil-immersed Power Transformer via SMOTE and GWO-SVM. In Proceedings of the 2022 4th Asia Energy and Electrical Engineering Symposium (AEEES), Chengdu, China, 25–28 March 2022; pp. 935–939. [Google Scholar]
  17. Duan, P.; Yang, Z.; He, Y.; Zhang, B.; Zhang, L.; Liu, F.; Shi, Y. Research on Identification of Magnetizing Inrush Current Based on PSO-SVM. In Proceedings of the 2022 4th Asia Energy and Electrical Engineering Symposium (AEEES), Chengdu, China, 25–28 March 2022; pp. 630–634. [Google Scholar]
  18. Zhou, Y.; Liu, Y.; Wang, N.; Han, X.; Li, J. Partial discharge ultrasonic signals pattern recognition in transformer using BSO-SVM based on microfiber coupler sensor. Measurement 2022, 201, 111737. [Google Scholar] [CrossRef]
  19. Li, L.; Meng, W.; Liu, X.; Fei, J. Research on Rolling Bearing Fault Diagnosis Based on Variational Modal Decomposition Parameter Optimization and an Improved Support Vector Machine. Electronics 2023, 12, 1290. [Google Scholar] [CrossRef]
  20. Hu, Y.; Yi, O.; Wang, Z.; Yu, H.; Liu, L. Vibration signal denoising method based on CEEMDAN and its application in brake disc unbalance detection. Mech. Syst. Signal Process. 2023, 187, 109972. [Google Scholar] [CrossRef]
  21. Zhu, X.; Guo, H.; Huang, J.J.; Tian, S.; Zhang, Z. A hybrid decomposition and Machine learning model for forecasting Chlorophyll-a and total nitrogen concentration in coastal waters. J. Hydrol. 2023, 619, 129207. [Google Scholar] [CrossRef]
  22. Lin, Y.; Lin, Z.; Liao, Y.; Li, Y.; Xu, J.; Yan, Y. Forecasting the realized volatility of stock price index: A hybrid model integrating CEEMDAN and LSTM. Expert Syst. Appl. 2022, 206, 117736. [Google Scholar] [CrossRef]
  23. Han, S.; Jin, Z.; Deji, D.; Han, T.; Zhang, Y.; Feng, M.; Hasi, W. Study on the classification and identification of various carbonate and sulfate mineral medicines based on Raman spectroscopy combined with PCA-SVM algorithm. Anal. Sci. 2022, 14, 1. [Google Scholar] [CrossRef]
  24. Zhou, J.; Yang, P.; Peng, P.; Khandelwal, M.; Qiu, Y. Performance Evaluation of Rockburst Prediction Based on PSO-SVM, HHO-SVM, and MFO-SVM Hybrid Models. Mining. Metall. Explor. 2023, 40, 617–635. [Google Scholar]
  25. Duan, Z.; Liu, T. Short-Term Electricity Price Forecast Based on SSA-SVM Model. In Advanced Intelligent Technologies for Industry; Springer Nature: Singapore, 2022; Volume 285. [Google Scholar]
  26. Naruei, I.; Keynia, F.; Sabbagh, M.A. Hunter–prey optimization: Algorithm and applications. Soft Comput. 2022, 26, 1279–1314. [Google Scholar] [CrossRef]
  27. Elshahed, M.; El-Rifaie, A.M.; Tolba, M.A.; Ginidi, A.; Shaheen, A.; Mohamed, S.A. An Innovative Hunter-Prey-Based Optimization for Electrically Based Single-, Double-, and Triple-Diode Models of Solar Photovoltaic Systems. Mathematics 2022, 10, 4625. [Google Scholar] [CrossRef]
  28. Petrović, K.; Petošić, A.; Župan, T. Grid-like Vibration Measurements on Power Transformer Tank during Open-Circuit and Short-Circuit Tests. Energies 2022, 15, 492. [Google Scholar] [CrossRef]
Figure 1. Schematic diagram of the location where hunters search for prey and escape: (a) Schematic diagram of hunter search behavior; (b) Schematic diagram of prey escape behavior.
Machines 11 00539 g001
Figure 2. Structural frame diagram.
Machines 11 00539 g002
Figure 3. Time−frequency domain diagram of short-circuit impulse signal. (a) Time domain diagram of short circuit impact signal. (b) Frequency domain diagram of short circuit impact signal.
Machines 11 00539 g003
Figure 4. Time−frequency domain diagram of short circuit impulse signal with noise. (a) Time domain diagram of short circuit impulse signal with noise. (b) Frequency domain diagram of short circuit impulse signal with noise.
Machines 11 00539 g004
Figure 5. Kurtosis diagram of the envelope spectrum of each component.
Machines 11 00539 g005
Figure 6. Frequency domain diagram of the reconstructed signal. (a) Time domain diagram of reconstructed signal. (b) Frequency domain diagram of the reconstructed signal.
Machines 11 00539 g006
Figure 7. Field test environment.
Machines 11 00539 g007
Figure 8. Fault classification confusion matrix. (a) SVM classification results; (b) ACO-SVM classification results; (c) GWO-SVM classification results; (d) HPO-SVM classification results.
Machines 11 00539 g008
Figure 9. Spectrum diagram of normal signal and short circuit impulse signal. (a) Normal signal spectrum; (b) Spectrum of short circuit impact signal.
Machines 11 00539 g009
Figure 10. Comparison of diagnostic results between different models.
Machines 11 00539 g010
Figure 11. Different types of noise interference signals: (a) speech and bird calls; (b) continuous machine roar; (c) aperiodic transient impact signal; (d) Gaussian white noise with a signal noise ratio of 1 dB; (e) Gaussian white noise with a signal noise ratio of 5 dB.
Machines 11 00539 g011
Figure 12. Multi-classifier diagnosis effect.
Machines 11 00539 g012
Table 1. Experimental data set classification.
Fault NumberFault TypeTraining Set (3/5)Validation Set (1/5)Test Set (1/5)
0normal1806060
1Short circuit impact1806060
2Partial discharge1806060
3DC bias1806060
Table 2. Principal component contribution rate.
PCA NumberFeature NumberContribution Rate/%Accumulated Contribution Rate/%
1A453.262753.2627
2A825.532378.7950
3A17.742586.5375
4A33.536189.8936
5A62.624992.5185
6A52.135694.6541
7A92.012596.6666
8A71.892198.5587
9A20.956299.5149
10A100.4851100.0000
Table 3. Training results.
ClassifierCgIteration Time/sAccuracy/%
HPO-SVM5.86260.0786798.50
GWO-SVM6.95100.07202590.25
ACO-SVM1.00.08563689.00
Table 4. Comparison of diagnostic results of different noise models.
Method/Noise Number1/%2/%3/%4/%5/%
Standard SVM80.7568.7573.0063.5079.55
GWO-SVM91.2577.0080.2569.2591.50
ACO-SVM90.2578.0086.5074.7591.25
HPO-SVM97.2592.0092.2586.2595.50
Noise category number: 1, speech and bird calls; 2, continuous machine roar; 3, aperiodic transient impact signal; 4, Gaussian white noise with signal noise ratio of 1 dB; 5, Gaussian white noise with signal noise ratio of 5 dB.
Disclaimer/Publisher’s Note: The statements, opinions and data contained in all publications are solely those of the individual author(s) and contributor(s) and not of MDPI and/or the editor(s). MDPI and/or the editor(s) disclaim responsibility for any injury to people or property resulting from any ideas, methods, instructions or products referred to in the content.

