Abstract
This paper presents the design of a switched reluctance motor (SRM) for a direct-drive propulsion application for a light sport aircraft. The SRM is designed to replace a 70 kW permanent magnet synchronous motor used in aerospace application with similar dimensional constraints. As a means of achieving high torque density and efficiency, a multi-objective design framework is used to optimize the geometry parameters of the motor. In order to further reduce the weight, rotor cutouts are implemented. The conduction angles for the asymmetric bridge converter are selected by employing a multi-objective genetic algorithm to map the torque speed characteristics of the motor. The core losses are evaluated with the modified Bertotti method to calculate the motor efficiency and determine the steady-state and transient thermal performance at the base speed. The designed coil winding is wound on a spindle winder, and the coil fitting, fill factor, and the coil retention are validated experimentally.
1. Introduction
There has been a paradigm shift in recent years in the transportation industry driven by climate concerns. The commercial aviation sector is responsible for 2.4% of the greenhouse gas (GHG) emissions in 2018, and the number of commercial aviation sector flights is to triple by 2050 [1]. Current battery technology cannot support large and medium commercial electric propulsion aircraft (EPA), but a bottom-up approach can be applied. This approach would require smaller aircraft to be electrified, as the current battery technology is sufficient. Light sport aircraft (LSA) are often driven by piston engines that use aviation gas. The GHG emission from small piston aircraft is only 0.13% of the total aviation emissions [2]. However, most aviation fuels contain lead, which is discharged into the atmosphere. Small piston aircraft contribute to 50% of the total lead discharged in the atmosphere. Exposure to lead can have considerable health effects on neurological and cognitive functions, especially in children [3]. It is estimated that there are 10,800 legacy training aircraft in the United States alone, which on average are 48.1 years old. An electrified LSA fleet could replace the older fleet with operational cost benefits that other fleet transportation sectors have gained. For example, the electrified bus industry has estimated a 45.28% decrease in operational cost [4]. The initial purchase price of an e-Flyer2, which is an electrified LSA, is USD $289,000. The price of Cessna 172, which is a similar-sized internal combustion engine LSA, costs USD $438,000. In addition, an electrically propelled aircraft can significantly reduce the operational cost per hour by 84% [5].
Permanent magnet synchronous motors (PMSMs) dominate the electrified aircraft industry due to their high-power density and high efficiency. SRMs are fault-tolerant, can operate at high temperatures, and have simple construction without rare-earth permanent magnets. For aviation applications, a fault-tolerant motor is essential for safety. PMSMs are not inherently fault-tolerant; they usually need redundant windings [6]. SRMs are inherently fault-tolerant due to electrically isolated phases. Additionally, SRMs do not have temperature sensitive magnets, allowing for a longer peak power duration [7].
SRM has a simple construction, which allows for more cost-effective mass production. PMSMs are price-sensitive due to the rare-earth magnets used within their rotors. As the industry moves towards electrification for various applications, the demand for electric motors will increase. Relying on PMSMs would result in even more volatility and instability on the rare-earth market and its supply chain. In addition, rare-earth materials such as neodymium have a significant material footprint and mining risk footprint [8]. Besides, the rare-earth mining, refining, and transport process have considerable effects in terms of human health, ecological health, carbon footprint, and mining waste [9].
The utilization of SRMs in all- and more-electric aircraft has attracted attention due to their high reliability, fault-tolerant operation, robustness, and high-speed operation. Specifically, SRMs have been proposed for use in flap actuators [10,11] and have been proposed in aerospace as high-speed integrated starter generators (ISGs) for all-electric aircraft applications [12,13]. The durability of the rotor and built-in fault tolerance of SRM-ISG make it an ideal option, and it has been rated and packaged by UTC Aerospace Systems (UTAS) with a 270 VDC bus voltage, rendering it suitable for use in F-16 military aircraft [14]. Moreover, there have been research efforts to explore the feasibility of utilizing SRMs in aircraft propulsion units. For instance, researchers adopted a reluctance mesh-based magnetic equivalent circuit to design a high-lift motor (HLM) for NASA’s Maxwell X-57 [15].
Typically, SRMs have three main drawbacks compared to PMSMs: acoustic noise and vibration, torque ripple, and power density. But these drawbacks are not significant challenges to utilize SRMs in LSA applications. In an LSA, the pilot cabin is isolated from the power unit, and the propeller noise is considerably higher than the motor noise [16]. The main weight of electrified aircraft is the battery and the body weight; the motor contributes about 4% of the total weight. Therefore, if an SRM has slightly higher weight, that might not have significant impact to the overall weight of an LSA. In summary, SRM is a strong candidate for the LSA propulsion system, and the drawbacks of SRMs are not too challenging for LSA applications.
This paper presents the design of a switched reluctance propulsion motor proposed to replace a permanent magnet machine used in a direct-drive LSA propulsion application. The rest of the paper is organized as follows: Section 2 presents the benchmark motor. Section 3 describes the sizing and design of the LSA drive, and Section 4 investigates the coil design process and experimental validation. Section 5 demonstrates the rotor-mass reduction with cutouts. Performance results of the LSA SRM are presented in Section 6. Then, Section 7 provides the loss and efficiency calculations. Section 8 presents the steady-state and transient thermal analysis of the design. Finally, the conclusions are presented in Section 9.
2. Benchmark Motor Specifications and Operational Requirements
Different motor designs are currently offered for different applications, such as air taxi, unmanned aerial vehicle (UAV), LSA, and electrified regional aircraft. Some pioneers of EPA are Lilium Jet (eVTOL), VoltAero Cassio, X57 Maxwell from NASA, ZeroAvia (Hollister, CA, USA), and Skai (Tel Aviv-Yafo, Israel) (eVTOL). Several companies have designed electric motors for LSA applications, such as Magnix (Everett, WA, USA), Pipistrel (Ajdovščina, Slovenia), Rolls-Royce (London, UK), and Siemens (Munich, Germany). These companies use innovative and unique motor designs, cooling systems, winding techniques, and gearbox strategies. Pipistrel used axial flux permanent magnet synchronous motors (AFPMSM) to reduce the motor axial length [17]. Magnix uses direct-drive PMSM with redundant windings [18]. Siemens has designed several types of high-power density PMSMs, of which some are direct drive, and many others have simple gearboxes [19]. In this paper, an SRM is designed to replace a 70 kW direct-drive PMSM (SP70D) developed by Siemens. This motor was used by the Bye Aerospace company to produce the e-Flyer2 [20]. The motor specifications are presented in Table 1.

Table 1.
Specification of SP70d PMSM [19].
The motor is required to deliver 260 Nm at 2600 rpm at the take-off condition. During take-off, high power is required to accelerate the aircraft, allowing it to reach level flight [21]. Due to the direct drive setting, the maximum possible speed at which the motor can operate is limited by the propeller diameter and the speed of sound. In addition, to ensure that the motor can operate at high speed for non-direct drive applications and drive various propeller types, the motor should deliver 120 Nm at 4000 rpm.
3. Sizing and Design of LSA SRM
The synopsis of the SRM design is explored in this section. The number of electrical phases of the SRM is limited to three to simplify the drive system. Different rotor and stator pole numbers can operate in three phases. An 18/12 configuration is selected based on a trade-off between the stator coil area, torque ripple, and motor dimensions.
3.1. Selection of the Core Material
The performance of an SRM is highly dependent on the magnetic properties of the core material. To maximize torque density, the magnetic core material of the stator and rotor cores should be selected carefully. The material must exhibit low core loss and high saturation flux density. In light of their unique characteristics, HIPERCO® has been investigated as the core material. Iron–cobalt vanadium alloys, such as HIPERCO® 50 and HIPERCO® 50A, have the highest magnetic saturation (2.4 Tesla) of all soft magnetic alloys [22]. Besides, they have low core loss that can contribute to improving the efficiency of an SRM.
Figure 1 shows the magnetization characteristics of HIPERCO® 50/50A. They both have high magnetic saturation level, but slightly different permeability. Figure 2 shows the static torque performance for the same geometry and the current-density levels applied to LSA SRM. The static torque performances are close at low current density where the magnetic field intensity is small. As the current density increases, HIPERCO® 50A shows higher static torque in the entire electrical cycle. This helps improving the torque density of the LSA SRM design. Therefore, the HIPERCO® 50A with a lamination thickness of 0.1524 mm from Carpenter Technology is selected as the core material.
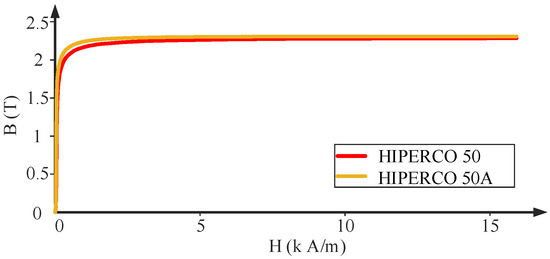
Figure 1.
Comparison of the magnetic properties of HIPERCO® 50/50A [22].
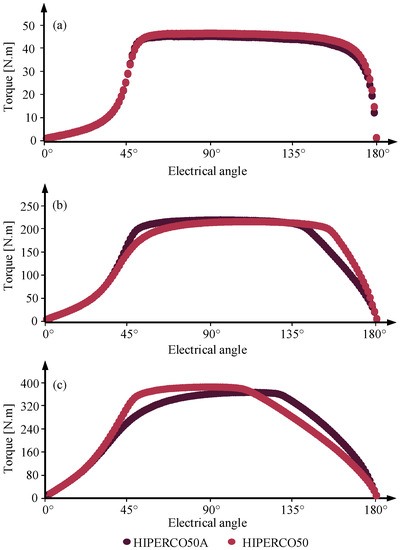
Figure 2.
Comparison of static torque production with HIPERCO® 50 and HIPERCO® 50A for the dimensional constraints and current density levels of LSA SRM: (a) J = 5 A/mm2, (b) J = 15 A/mm2, and (c) J = 25 A/mm2.
3.2. Electromagnetic Design with the Proposed Framework
The authors proposed a multi-objective design framework in [23] for the design of a high power density SRM. A similar approach is employed in the design process of the LSA SRM. The design process is divided into two stages for control optimization and geometry optimization. As illustrated in Figure 3, the first stage finds all the geometry combinations with high static average torque. The geometry combinations are clustered and put through the second layer of the framework, the dynamic design stage. The objective of the dynamic design stage is to improve the average torque, and reduce radial force and torque ripple. The dynamic design consists of a loop involving control and geometry optimization. The limited boundary of changes limits the variation of the optimum control parameters. After applying the dynamic design to all high-static-average-torque combinations, the best design is selected as the final design.
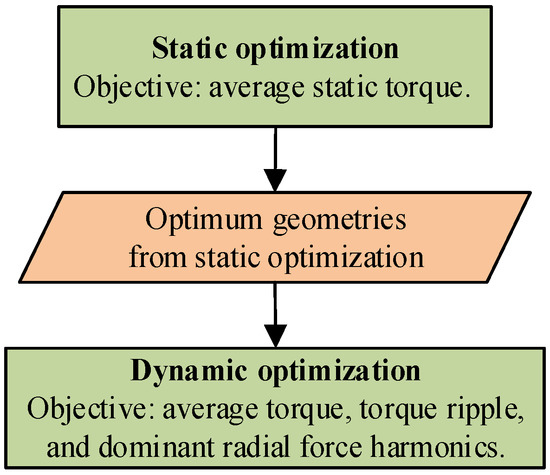
Figure 3.
Proposed multi-objective optimization framework [23].
3.3. Static Design and Results
The static characteristic of an SRM refers to its performance under a single-phase constant-current excitation. The static design aims to identify the geometry combinations with the best static performance, such as high average torque and low induced voltage.
Various geometry parameters, such as pole arc angles, rotor outer radius and radius of the stator back iron have been selected as design parameters in the design of experiment (DOE). In the static design loop, three different optimization algorithms (global response surface method (GRSM), genetic algorithm (GA), and particle swarm optimization (PSO)) with two different surrogate models (neural network (NN) and radial basis function (RBF)) were employed as shown in Figure 4 to include as many geometry variations as possible. Two different currents are used to ensure that the maximum induced voltage is limited at light- and full-load operation. The voltage drop across the switching devices is considered negligible compared with the DC link voltage.
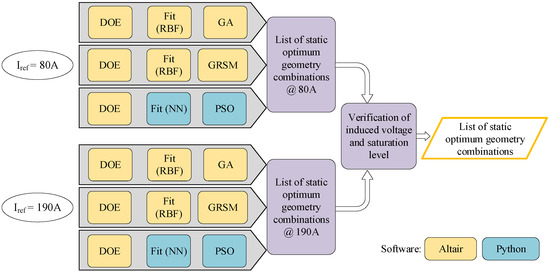
Figure 4.
Block diagram of the static design: fit models and global optimizations used for two different current ratings [23].
The static design for the given constraints and objectives found a list of more than 260 geometry combinations with high static average torque. Figure 5 shows the distribution of these combinations with respect to the geometry parameters that have the highest correlation to average torque. The resulting clustered data is verified with FEA models to ensure that the surrogate model was accurate. The error of the surrogate model was less than 0.9%.
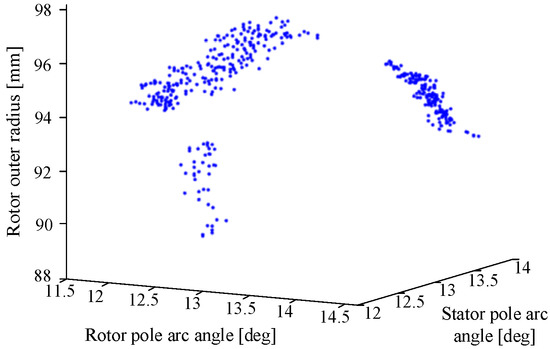
Figure 5.
Illustration of static design results with respect to the three geometry parameters with highest correlation to average torque.
3.4. Dynamic Design Process and Results
Figure 6 shows the block diagram of the dynamic optimization stage. It integrates the control optimization and tuning of the motor geometry in a design loop. The dynamic design process is performed for each of the geometry combinations calculated from the static design. Table 2 shows the changes in the motor geometry and performance improvements from the initial iteration to the last iteration for the selected final design. After five iterations of the dynamic optimization, 3.4% higher average torque was achieved, torque ripple remained the same, and the radial forces were improved.

Figure 6.
Block diagram of the dynamic optimization stage [23].

Table 2.
The improvements of the motor performance after five iterations in the dynamic design process for the selected design.
Figure 7 shows the reduction in the radial force harmonics after five iterations. Significant reductions are observed in the magnitudes of circumferential orders zero, six, and twelve. There was a slight increase in the magnitude of the circumferential order eighteen, which would potentially excite vibration mode zero due to sampling effect. The increase in the magnitude of the circumferential order eighteen is smaller than the decrease in the circumferential order zero. Therefore, the optimization process has reduced the radial force harmonics while improving the average torque.
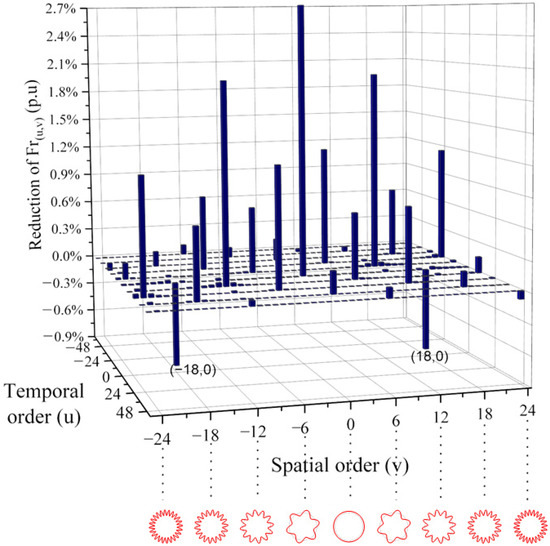
Figure 7.
The change in radial force after five iterations of dynamic optimization.
4. Coil Design
In the proposed framework, the coil design is based on a constant current density region in the static design stage. In the dynamic design stage, it uses a simplified stranded conductor region. This approach enables a faster design and optimization. In each case, the fill factor and maximum current density constraints were applied. For the final geometry, the other coil and winding parameters, such as the wire size, number of strands, and number of parallel paths, are determined.
4.1. Calculation of Coil Parameters
Figure 8 shows the block diagram of the script developed to identify the possible coil parameters based on the fill factor, current density limit, and magnetomotive force. The magnetomotive force is calculated based on the simplified stranded coil conductor region of the final model from the dynamic design loop. The current density limit is based on the cooling method, and the slot area is based on the selected geometry. Table 3 lists the feasible coil configurations calculated from the script. As highlighted in the table, the six parallel winding options are preferred. This is because parallel winding enables coils with a higher number of turns and fewer strands. Fewer strands allows an easier implementation of the coils. If a coil is designed for a high number of strands, it might be necessary to wind the strands one at a time for the given number of turns, especially when a winding machine is used. Therefore, using fewer strands helps avoid resistance mismatch between the strands of a coil. Fewer strands also enable better wire layout in the coil implementation, which helps achieve a more consistent resistance in each coil and, hence, more balanced phase resistances. Besides, a parallel winding configuration helps mitigate unbalanced magnetic pull in case of eccentricity [24].
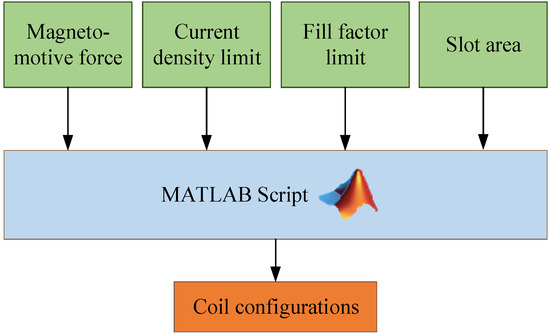
Figure 8.
Block diagram showing the operation of the script to determine the coil parameters.

Table 3.
Coil possibilities for the design.
4.2. Calculation of AC Copper Loss
The preferred coil options for parallel winding configuration are summarized in Table 4. Both options have similar phase resistance, fill factor, and current density. The first option uses a thicker wire (17 AWG), but a single strand. The second option uses a thinner wire (20 AWG), but two strands. In terms of practical implementation, the first option might require higher bending force and the second option might require more complicated layering. It is also essential to calculate the AC copper loss for these configurations to make the final decision. In order to simulate the AC copper loss, both coil options are tested with individual wires in FEA. A Python Pyflux function is developed to automate the conversion from solid conductors to individual wires, as shown in Figure 9.

Table 4.
Comparison of different coil options.
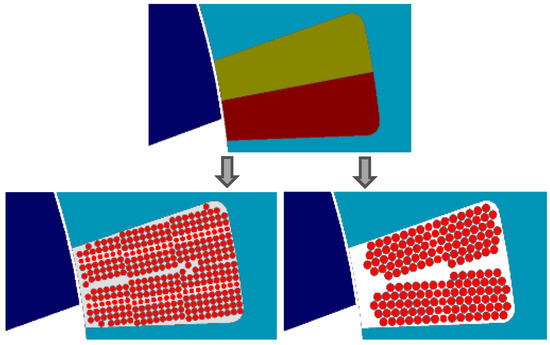
Figure 9.
Conversion of stranded coil region to coil with individual wires.
Figure 10 shows the AC copper loss for both options. The AC copper loss is about 1 to 6% higher than the power loss calculated from the RMS current and phase resistance. AC copper loss with thinner wire and more strands is slightly lower. However, the difference in the AC copper loss for the two options is not significant. The lower number of strands for Option 1 makes a better fit for coil implementation and assembly, and it is selected as the final coil design.
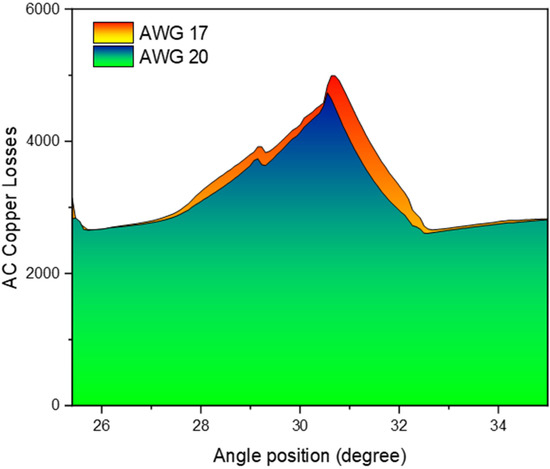
Figure 10.
Comparison of AC copper losses for two different coil options.
4.3. Coil Retention Design
In order to ensure that the coils are secure inside the stator slots, a slot wedge design is considered. The stator of the LSA SRM is designed without pole shoes so as not to impact the flux path and cause a potential reduction in electromagnetic torque. Therefore, the stator teeth are designed with grooves to insert the slot wedge as shown in Figure 11.
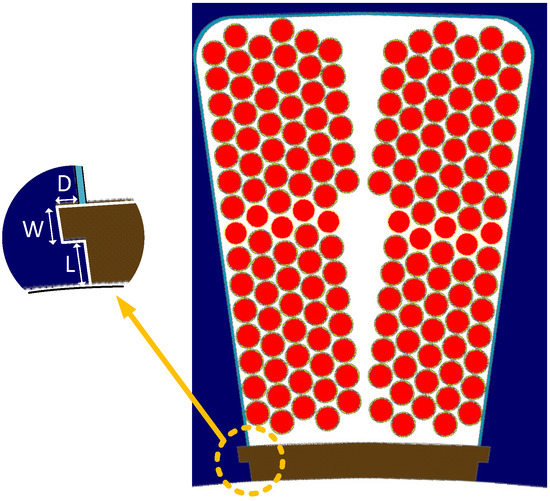
Figure 11.
Coil retention with grooves and slot wedge, and the geometry parameters of the slot wedge.
It is essential to design the size and the shape of the grooves so that they do not have a significant impact on the magnetic flux, slot area and, hence, the electromagnetic performance. A simple design of the experiment is performed by varying the parameters of the grooves to determine their location and size.
Figure 12 shows the effect of the groove on the torque production with a width of 0.8 mm. The boundary within which the groove parameters can be defined without a significant effect on the torque production is shown in a dashed rectangle. Based on the analysis, the dimensions of the grooves are set as W = 0.8 mm wide, D = 0.5 mm deep, and L = 1 mm away from the edge of the stator teeth, as referred to Figure 11.
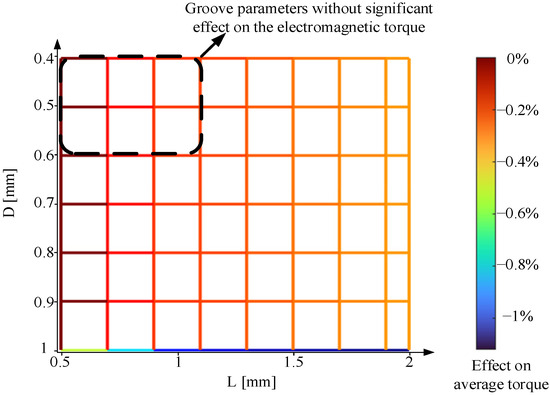
Figure 12.
Effect of groove dimensions on torque production with 0.8 mm groove width.
4.4. Experimental Verification of Coil Retention and Coil Fit
It is essential to experimentally verify that the designed coils can be wound, inserted into the stator slots, and then the designed slot wedges can be applied to retain the coils. This also confirms the fill factor calculations and ensures that the stator core can be manufactured with the optimized dimensions. For this purpose, the stator core is 3D printed as shown in Figure 13. The slot retention wedge is prototyped by 3D printing using glass-filled nylon or durable nylon. Considering the size of the part and the required accuracy, selective laser sintering (SLS) 3D printing is applied. These materials are mechanically and thermally strong; they have been used in prototyping for similar purposes.
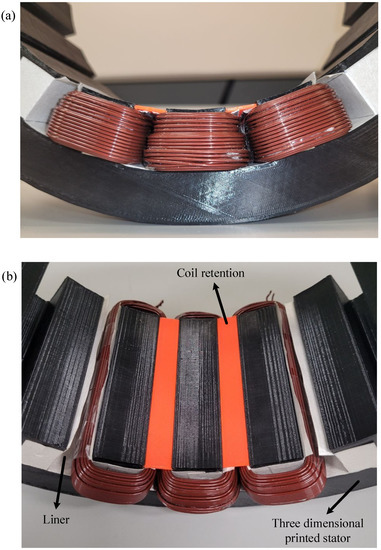
Figure 13.
Experimental verification of coil fit, fill factor, and slot retention with 3D printed stator core for optimized dimensions: (a) front view and (b) top view.
The coils are wound using a spindle winding machine for 17 AWG wire with 83 turns and using a single strand. As shown in Figure 13, the designed coils fit well in the slot when the ground wall insulation with slot liners and the coil retention with slot wedges are applied.
5. Rotor-Mass Reduction
To reduce the weight and inertia of the rotor, additional cutouts were introduced on the rotor. Different cutouts were explored, and their impact on the static electromagnetic torque waveforms were analyzed. Twelve tapered elliptical cutouts were applied in line with each rotor pole [25]. The dimensions of the cutouts are presented in Figure 14. Based on the flux paths in the rotor back iron shown in Figure 15, cutouts were placed 9.42 mm away from the shaft diameter and in line with the rotor poles. The rotor cutouts reduce the rotor core area by 19.15% and reduce the rotor mass by approximately 3 kg.
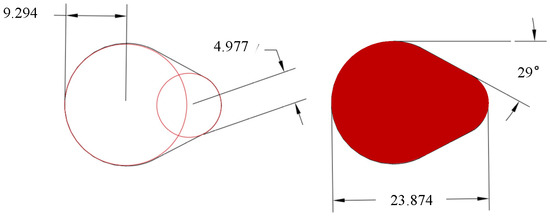
Figure 14.
Rotor cutout dimension and general geometry (dimensions are in mm).
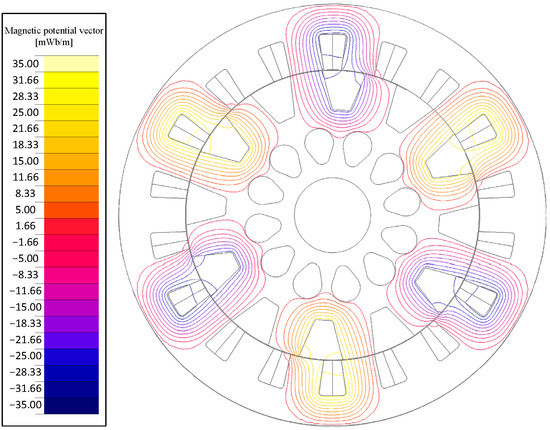
Figure 15.
Magnetic potential vector in the dynamic model of 18/12 SRM.
The static electromagnetic performance was analyzed for the new SRM geometry with the tapered elliptical rotor cutouts. The static electromagnetic torque was studied for half an electrical cycle in the motoring region at 2600 rpm with a current reference of 195 A. As shown in Figure 16, there was no significant difference in the torque with the proposed rotor cutouts. The maximum deviation in torque before and after the cutout is 3.36% near the aligned position. On average, the static torque production deviates only 0.35% compared with the case without the cutouts.
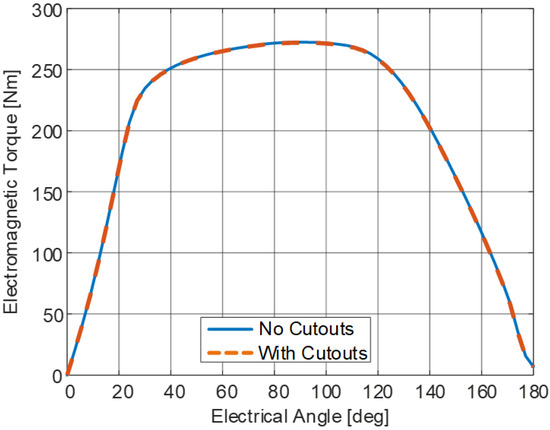
Figure 16.
Static torque for half of an electrical cycle with 195 A current reference before and after rotor cutouts.
A key consideration is the magnetic flux density level near the cutouts and rotor teeth. A time variant current based on the dynamic model was applied to the FEA model to verify the motor performance after the rotor mass reduction. In order to investigate the worst-case scenario for the magnetic flux density level, a large conduction interval is applied. The conduction angles are set to −50° and 125°. Figure 17 shows the magnetic flux density contour plot for this case, with phase C at the aligned position. The maximum flux density is observed near the rotor and stator poles of Phase B and it is within the material’s operating limits. Similarly, near the rotor cutouts and stator back iron, the maximum flux density is within the operating limits, and the magnetic flux density is homogeneously distributed.
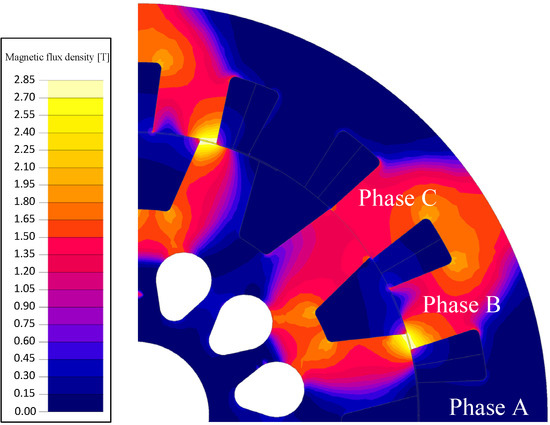
Figure 17.
Magnetic flux density distribution in the dynamic model of 18/12 LSA SRM.
The rotor cutouts are structurally validated using total deformation and von-Mises stress analysis as depicted in Figure 18 and Figure 19. For a single rotor lamination with the HIPERCO® 50A material, the analyses were carried out for the rotor with and without the cutouts at the maximum operating speed of 4500 rpm. The maximum displacement with no cuts is 1.3 µm, and with the cutouts it was 1.9 µm. The maximum deviation is within the rotor airgap clearance, and this ensures that there would be no contact. The maximum stress experienced by the reduced-weight rotor was 17.84 MPa, which is well below the material’s yield strength of 212 MPa. From the following analysis, it can be concluded that the rotor-mass reduction would not compromise the mechanical operation of the motor at the maximum operational speed.
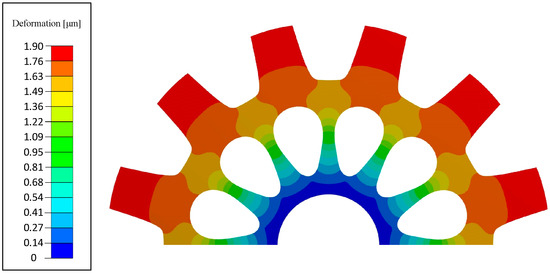
Figure 18.
Total deformation analysis with rotor cutouts at 4500 rpm.
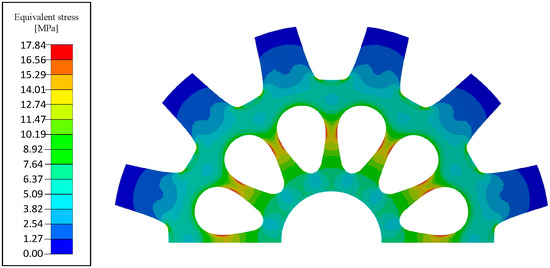
Figure 19.
Von-Mises Stress analysis with rotor cutouts at 4500 rpm.
6. Final Design and Performance Results
Table 5 presents the parameters for the final geometry and coil configuration of the SRM. The final design meets the physical constraints that were set out. The SRM stack length is 100 mm and the thickness of each lamination is 0.1524 mm. A stacking factor of 0.95 is estimated based on the given lamination thickness and manufacturing constraints.

Table 5.
18/12 SRM Final Geometry and Coil Configuration.
The static characterization of the final design is conducted in Altair Flux software by energizing a single phase of the motor with a DC current for one electrical cycle. The static voltage, torque, and flux linkage characterization were derived, as depicted in Figure 20, Figure 21 and Figure 22. For the dynamic analysis, an SRM drive model is built using the static flux-linkage and torque characteristics. A three-phase asymmetric bridge converter with current hysteresis control is modelled. The conduction angles obtained from a multi-objective genetic algorithm optimization to maximize the average torque and minimize the torque ripple. The dynamic current waveforms were acquired for the base speed of 2600 rpm with 200 A reference current, as shown in Figure 23. The average torque is 261.57 Nm with a maximum torque ripple of 26.42%. For the optimized conduction angles, the calculated current waveform is applied to the FEA model of the motor in Flux software and the dynamic torque waveform is validated. In addition to the 2D electromagnetic FEA model, a 3D electromagnetic FEA model is developed, as shown in Figure 24, to validate the results. The discrepancy between the average torque production in 2D and 3D FEA is 2.5%.
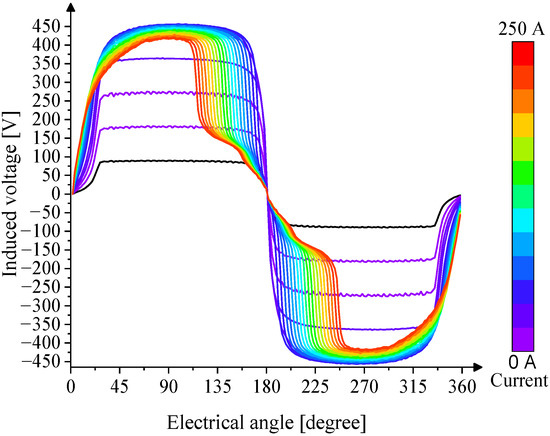
Figure 20.
Static voltage waveform at 2600 rpm for different current references.
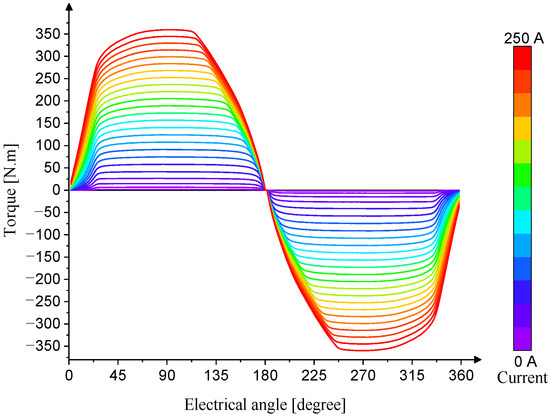
Figure 21.
Static electromagnetic torque for different current references.
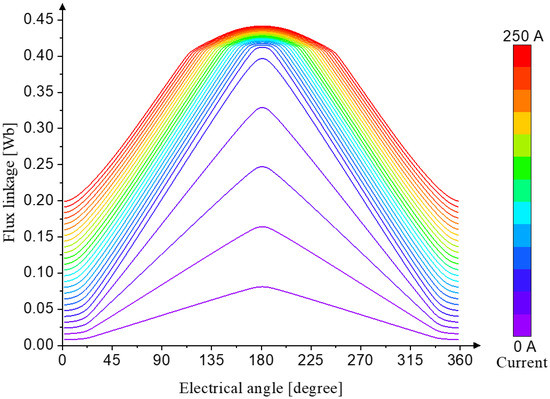
Figure 22.
Phase flux linkage for different current references.
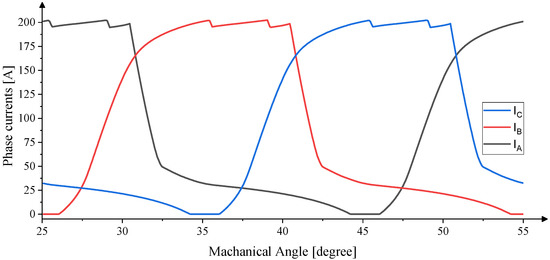
Figure 23.
Dynamic phase current waveforms of LSA SRM at 2600 rpm.
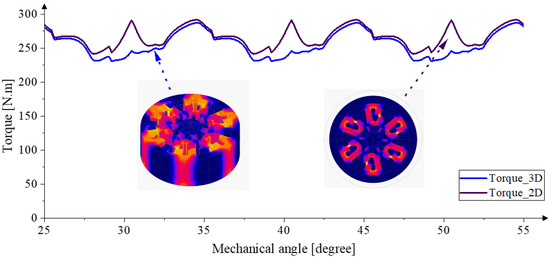
Figure 24.
Comparison of torque production with three-dimensional and two-dimensional FEA at 2600 RPM with conduction angle −47.9° and 125°, and reference current of 200 A.
The motor performance at different speed conditions is investigated by optimization of control parameters. In Figure 25, the torque-speed characteristics and the optimized turn-on and turn-off angles are presented. Based on the LSA load characteristics, the motor speed is mainly limited to the region highlighted as the main operational region in Figure 25. The torque required for critical speed points of 2600 rpm and 4000 rpm are achieved.
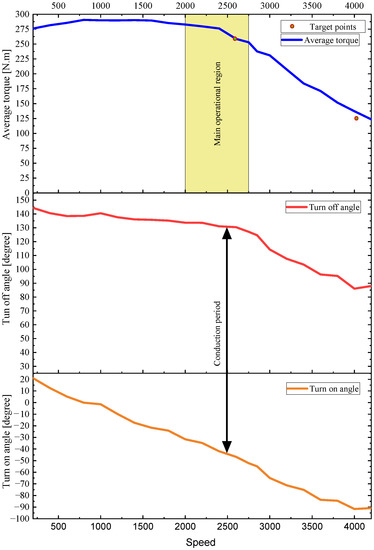
Figure 25.
Torque speed characteristics of the designed motor with optimized turn-on and turn-off angles.
7. Loss Calculation and Efficiency Analysis
The loss calculations were performed by applying the dynamic current waveforms to the FEA model. A modified Bertotti core loss method was used, in which the coefficients and exponents are estimated based on the core loss data for the HIPERCO® 50A core material [22]. The steady-state core loss equation is presented in (1), and the transient core loss equation is presented in (2). The function g() in (2) is defined as in (3),
where is the maximum magnetic flux density, is frequency, and are coefficient and exponent for hysteresis loss term, and are coefficient and exponent for classical loss term, and and are coefficient and exponent for excess loss term [26]. The estimated coefficients and exponents for HIPERCO® 50A alloy are presented in Table 6. The average error between calculated core losses from the defined model and core losses provided by in the material datasheet is less than 3%.

Table 6.
Modified Coef. and Exp. of Bertotti Method.
The copper losses were calculated considering the AC losses with an estimated operating temperature of 150 °C. In Table 7, the calculated core loss, copper loss, and the efficiency at 2600 rpm are presented, which is the main operating point of LSA SRM.

Table 7.
Calculated Losses and Efficiency for Nominal Current Reference and Conduction Angles of −47.9° To 125°.
8. Thermal Analysis
This section aims to analyze the steady-state and transient thermal analysis of the proposed SRM based on the maximum continuous power operation and for the given cooling system constraints. For the LSA SRM, thermally conductive and durable materials are considered for the thermal management of the motor. Magnet wires are selected for 240 °C thermal class which are commercially available with polyimide or polyether–ether–ketone (PEEK) insulation [27]. The Nomex® 818 is selected as the slot liner paper due to its higher voltage endurance compared to traditional options. The slot area is also filled with a low viscosity thermally conductive epoxy from Lord company. For thermal analysis, the conductivity characteristics of the materials and maximum operating temperatures are provided in Table 8.

Table 8.
Thermal Conductivity Characteristics for Materials.
A water jacket is considered for the LSA motor with a 50/50 water–glycol coolant. A finite element model is developed to analyze the performance of the thermal management system. The convection coefficients and boundary conditions are selected based on the thermal management system constraints [33]. Table 9 shows the coefficients used in the thermal model. Some additional simplifications are also considered, such as neglecting endcap cooling to reduce the model complexity. Figure 26 shows the results for the steady-state thermal analysis at the base speed and the maximum continuous power. The maximum temperature within the stator slot area is 170.2 °C, which is below the temperature limit of the materials.

Table 9.
Heat Transfer Coefficients Guideline.
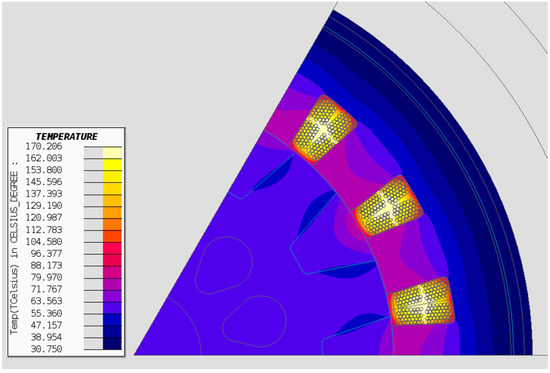
Figure 26.
Steady-state thermal FEA result for LSA SRM at the base speed and maximum continuous power.
In addition to the steady-state thermal FEA simulation with forced boundary conditions, MotorCAD software is used to perform a three-dimensional analytical transient thermal simulation to incorporate more details of the cooling system in the analysis. The transient thermal performance of the motor is shown in Figure 27. As compared with steady-state FEA with boundary conditions, the steady-state temperature of the winding (hotspot) is higher, but the steady-state temperatures are still lower than the thermal limit of the selected magnet wire and impregnation epoxy material.
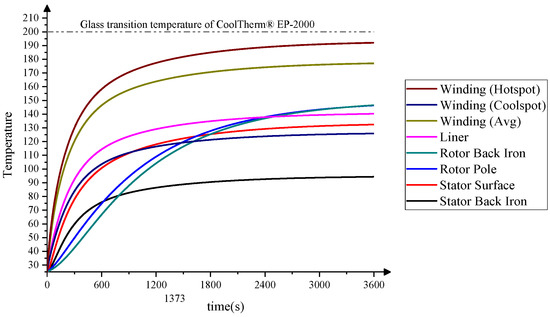
Figure 27.
Transient thermal performance of the LSA SRM calculated in MotorCAD.
9. Conclusions
In this paper, the design of a direct drive 18/12 switched reluctance motor (SRM) for a light sport aircraft (LSA) propulsion has been presented. A multi-objective design framework was used for the design of the motor to obtain the required performance. The required torque of 260 Nm at the base speed of 2600 rpm is achieved, while the radial force magnitudes were reduced for the dominant circumferential orders. The winding of the designed coils, the slot fill factor, and the slot wedge designed for coil retention are experimentally validated on a 3D printed stator core for the optimized geometry. For the base speed operation, the calculated efficiency is higher than 94%. The LSA SRM design meets the torque speed, efficiency requirements, and dimensional constraints. To further reduce the weight of the motor, rotor cutouts were applied without mechanical and electromagnetic performance deterioration. The steady-state and transient thermal performance of the LSA SRM were investigated both with steady-state thermal FEA simulations and analytical three-dimensional transient simulations. At the continuous operation of the motor, the maximum temperature is lower than the thermal class of the insulation material. Hence, the final design is a suitable for the benchmarked LSA motor, Siemens SP70D PMSM; it proposes significant advantages for this application, such as fault-tolerant operation and no use of temperature-sensitive and volatile rare-earth materials.
Author Contributions
Conceptualization, M.E.A. and A.Z.; methodology, M.E.A.; software, M.E.A. and A.Z.; validation, M.E.A., B.B. and N.V.; formal analysis, M.E.A. and B.B.; investigation, M.E.A., B.B. and N.V.; resources, B.B. and N.V.; original draft preparation, M.E.A., A.Z. and B.B.; review and editing, M.E.A., A.Z. and B.B.; visualization, M.E.A., B.B. and N.V.; supervision, B.B. and N.V.; project administration, B.B.; funding acquisition, B.B. and N.V. All authors have read and agreed to the published version of the manuscript.
Funding
This research was funded by Carpenter Technology and McMaster Automotive Resource Centre (MARC).
Data Availability Statement
Not applicable.
Acknowledgments
The authors acknowledge Nir Vaks and Surya Saket from Carpenter Technology for their technical contribution to the paper, and their support with HIPERCO® 50A material data. The authors would also like to thank Altair Engineering Inc. (Troy, MI, USA) for their support with FluxTM2022, ComposeTM 2022 and ActivateTM 2022 software, and MathWorks (Natick, MA, USA) for their support with MATLAB® 2022A and Simulink® 2022A software in this research.
Conflicts of Interest
The authors declare no conflict of interest.
References
- Overton, J. Fact Sheet|The Growth in Greenhouse Gas Emissions from Commercial Aviation|White Papers|EESI. Available online: https://www.eesi.org/papers/view/fact-sheet-the-growth-in-greenhouse-gas-emissions-from-commercial-aviation (accessed on 29 January 2023).
- Regulatory Brief-General Aviation and Greenhouse Gas Emission–AOPA. Available online: https://www.aopa.org/advocacy/advocacy-briefs/regulatory-brief-general-aviation-and-greenhouse-gas-emission (accessed on 29 January 2023).
- Thanikasalam, K.; Rahmat, M.; Fahmi, A.G.M.; Zulkifli, A.M.; Shawal, N.N.; Ilanchelvi, K.; Ananth, M.; Elayarasan, R. Emissions of piston engine aircraft using aviation gasoline (avgas) and motor gasoline (mogas) as fuel A review. IOP Conf. Ser. Mater. Sci. Eng. 2018, 370, 012012. [Google Scholar] [CrossRef]
- PowerON and TTC Agree to Drive Transit Electrification. Available online: https://www.opg.com/media_releases/poweron-and-ttc-agree-to-drive-transit-electrification/ (accessed on 29 January 2023).
- Bye, G. Sun Flyer. Available online: https://nbaa.org/wp-content/uploads/events/Sun-Flyer-PP_NBAA-template.pdf (accessed on 29 January 2023).
- Guo, H.; Xu, J.; Kuang, X. A novel fault tolerant permanent magnet synchronous motor with improved optimal torque control for aerospace application. Chin. J. Aeronaut. 2015, 28, 535–544. [Google Scholar] [CrossRef]
- Bilgin, B.; Jiang, J.; Emadi, A. Switched Reluctance Motor Drives-Fundamentals to Applications, 1st ed.; CRC Press: Boca Raton, FL, USA, 2018. [Google Scholar]
- Nansai, K.; Nakajima, K.; Kagawa, S.; Kondo, Y.; Shigetomi, Y.; Suh, S. Global Mining Risk Footprint of Critical Metals Necessary for Low-Carbon Technologies: The Case of Neodymium, Cobalt, and Platinum in Japan. Environ. Sci. Technol. 2015, 49, 2022–2031. [Google Scholar] [CrossRef] [PubMed]
- Rare Earth Elements: A Review of Production, Processing, Recycling, and Associated Environmental Issues. Available online: https://cfpub.epa.gov/si/si_public_record_report.cfm?dirEntryId=251706&Lab=NRMRL (accessed on 29 January 2023).
- Tursini, M.; Villani, M.; Fabri, G.; Di Leonardo, L. A switched-reluctance motor for aerospace application: Design, analysis and results. Electr. Power Syst. Res. 2017, 142, 74–83. [Google Scholar] [CrossRef]
- Castellini, L.; Lucidi, S.; Villani, M. Design optimization of switched reluctance motor for aerospace application. In Proceedings of the 2015 IEEE International Electric Machines Drives Conference (IEMDC), Nagercoil, India, 10–12 April 2015; pp. 1678–1682. [Google Scholar] [CrossRef]
- Nøland, J.K.; Leandro, M.; Suul, J.A.; Molinas, M. High-power machines and starter-generator topologies for more electric aircraft: A technology outlook. IEEE Access 2020, 8, 130104–130123. [Google Scholar] [CrossRef]
- Sedky, M.M.; Abdel-Azim, W.E.; Abdel-Khalik, A.S.; Massoud, A.M. Integrated Switched Reluctance Starter/Generator for Aerospace Applications: Particle Swarm Optimization for Constant Current and Constant Voltage Control Designs. Appl. Sci. 2022, 12, 7583. [Google Scholar] [CrossRef]
- Wiegand, C.; Bullick, B.; Catt, J.; Hamstra, J.; Walker, G.; Wruth, S. F-35 Air Vehicle Technology Overview. In Proceedings of the 2018 Aviation Technology, Integration, and Operations Conference, Atlanta, Georgia, 25–29 June 2018. [Google Scholar] [CrossRef]
- Watthewaduge, G.; Bilgin, B. Sizing of the Motor Geometry for an Electric Aircraft Propulsion Switched Reluctance Machine Using a Reluctance Mesh-Based Magnetic Equivalent Circuit. Machines 2023, 11, 59. [Google Scholar] [CrossRef]
- Filipenko, M. Electric and Hybrid-Electric Aircraft: A Pragmatic View. Available online: https://indico.cern.ch/event/760666/contributions/3481376/attachments/1888359/3113576/20190708_CECICMC_2019_plenary_talk_filipenko_pub.pdf (accessed on 29 January 2023).
- Pipistrel Aircraft E-811 EASA TC–Pipistrel Aircraft. Available online: https://www.pipistrel-aircraft.com/products/other-products/e-811/ (accessed on 29 January 2023).
- MagniX Co. Products. Available online: https://www.magnix.aero/services (accessed on 29 January 2023).
- Anton, F.; Otto, O.; Hetz, J.; Olbrechts, T. Presentation on Behalf of Siemens eAircraft Siemens eAircraft Siemens Next47 Siemens Digital Factory PLM Software Simulation & Testing Solutions. Available online: https://www.ie-net.be/sites/default/files/Siemens%20eAircraft%20-%20Disrupting%20Aircraft%20Propulsion%20-%20OO%20JH%20THO%20-%2020180427.cleaned.pdf (accessed on 29 January 2023).
- eFlyer Begins Flight Tests with Production Motor. Available online: https://flyer.co.uk/eflyer-begins-flight-tests-siemens-production-motor/ (accessed on 29 January 2023).
- Cervinka, D.; Knobloch, J.; Prochazka, P.; Kadlec, J.; Cipin, R.; Pazdera, I. Electric powered airplane VUT 051 RAY. In Proceedings of the 16th International Conference on Mechatronics-Mechatronika 2014, Brno, Czech Republic, 3–5 December 2014; pp. 6–10. [Google Scholar] [CrossRef]
- HIPERCO® 50A Datasheet. Carpenter. 2020. Available online: https://www.carpentertechnology.com/alloy-finder/hiperco-50a (accessed on 29 January 2023).
- Abdollahi, M.E.; Vaks, N.; Bilgin, B. A Multi-objective Optimization Framework for the Design of a High Power-Density Switched Reluctance Motor. In Proceedings of the 2022 IEEE Transportation Electrification Conference Expo (ITEC), Anaheim, CA, USA, 15–17 June 2022; pp. 67–73. [Google Scholar] [CrossRef]
- Jiang, J.W.; Bilgin, B.; Sathyan, A.; Dadkhah, H.; Emadi, A. Analysis of unbalanced magnetic pull in eccentric interior permanent magnet machines with series and parallel windings. IET Electr. Power Appl. 2016, 10, 526–538. [Google Scholar] [CrossRef]
- Kasprzak, M. 6/14 Switched Reluctance Machine Design for Household HVAC System Applications. Ph.D. Thesis, Department of Mechanical Engineering, McMaster University, Hamilton, ON, Canada, 2017. Available online: http://hdl.handle.net/11375/20877 (accessed on 29 January 2023).
- Altair FluxTM 2019.1 User Guide. Available online: https://altair.com/ (accessed on 29 January 2023).
- ANSI/NEMA MW 1000-2018; American National Standard for Magnet Wire. NEMA: Rosslyn, VA, USA, 2018.
- Ghose, S.; Watson, K.; Delozier, D.; Working, D.; Connell, J.; Smith, J.; Sun, Y.; Lin, Y. Thermal Conductivity of Polyimide/Carbon Nanofiller Blends. Available online: https://ntrs.nasa.gov/api/citations/20080013603/downloads/20080013603.pdf (accessed on 29 January 2023).
- Startseite|KHP Kunststofftechnik. Available online: https://www.khp-kunststoffe.de/ (accessed on 29 January 2023).
- CoolTherm® EP-2000 Thermally Conductive Epoxy Encapsulant. Parker Lord. 2021. Available online: https://ph.parker.com/us/en/cooltherm-ep-2000-thermally-conductive-epoxy-encapsulant (accessed on 29 January 2023).
- DuraForm® PA plastic. 3D Systems Corp. 2017. Available online: https://www.3dsystems.com/sites/default/files/2017-03/3D-Systems_DuraForm_PA_DATASHEET_USEN_2017.03.22_a_WEB.pdf (accessed on 29 January 2023).
- DuPont™ Nomex® 818 Datasheet. DuPont. 2016. Available online: https://www.dupont.com/content/dam/dupont/amer/us/en/safety/public/documents/en/DPT16_21668_Nomex_818_Tech_Data_Sheet_me02_REFERENCE.pdf (accessed on 29 January 2023).
- Staton, D. Thermal analysis of traction motors. In Proceedings of the 2014 IEEE Transportation Electrification Conference and Expo (ITEC), Dearborn, MI, USA, 15–18 June 2014; pp. 1–139. [Google Scholar] [CrossRef]
Disclaimer/Publisher’s Note: The statements, opinions and data contained in all publications are solely those of the individual author(s) and contributor(s) and not of MDPI and/or the editor(s). MDPI and/or the editor(s) disclaim responsibility for any injury to people or property resulting from any ideas, methods, instructions or products referred to in the content. |
© 2023 by the authors. Licensee MDPI, Basel, Switzerland. This article is an open access article distributed under the terms and conditions of the Creative Commons Attribution (CC BY) license (https://creativecommons.org/licenses/by/4.0/).