Abstract
The quality of additively produced parts and the achievable mechanical response may be affected by several factors, such as build orientation, heat treatment, or machining. A further rarely investigated factor is the position of the built part in the chamber with respect to inert gas flow. Previous studies have highlighted that the interaction between gas flow and laser track may induce an intense vaporization with consequent lack of fusion, particle entrainment, drop in density and denudation of the produced part, which is likely to detrimentally affect mechanical properties. This study addresses the effect of part position on the fatigue strength of heat-treated maraging steel MS1 produced by an EOSINT M280 machine in a nitrogen environment. Novelty arises from the lack of studies in this field, especially under fatigue. A factorial plan with subsequent statistical analysis highlighted that positioning the part upstream with respect to the gas flow leads to a slightly lower fatigue strength; however, no significant differences are observed. The failure mode, involving initiation from subsurface porosities of the same size, is also unaffected. Finally, a fatigue limit of 26% of the ultimate tensile strength is found, which is consistent with previous outcomes.
1. Introduction
Current additive manufacturing techniques have impressive features from the point of view of fabricating complexly shaped components in a monolithic form, starting from a 3D drawing of the part. Laser Powder Bed Fusion (L-PBF), often referred to as Direct Metal Laser Sintering (DMLS) or Selective Laser Melting (SLM), is a powerful stacking process based on powder-bed high-speed scanning by a laser beam. The first step consists of slicing a 3D virtual model of the part into a number of cross sections, accounting for layer thickness. Afterwards, a small laser beam follows a strictly controlled path, reproducing the actual cross section at the generic layer. Powder irradiation along this specific path implies powder melting, involving a small thickness on the order of some tens of μm. Following powder melting, cooling and solidification occur with melting pool penetration over contiguous layers. Afterwards, the baseplate is moved downwards by a step corresponding to layer thickness, and the cycle is repeated until the completion of the component fabrication. It is clear that, due to the high-speed scanning and the high-speed hydrodynamic flow involving melted powder, some spattering may take place, which can have a detrimental effect on the component surface finish, and, especially, on its density and achievable mechanical performance. A proper choice of the build parameters may mitigate these consequences; however, an important role is played by the inert gas, mainly argon, helium or nitrogen, flowing in the chamber [1]. These protective gases interact with laser beam irradiation, thus affecting the quality of the fabricated component. The protective feature is usually related to protection against oxidation [2,3,4,5]: as the powder bed is hit by the laser beam, the temperature rises and oxide generation is promoted, which has a detrimental effect on the powder bed. The flowing gas, which is usually a noble gas, builds up a pure and protective atmosphere that contributes to reducing oxygen concentration and diluting the oxides. Gas recirculation control is usually based on on-line monitoring of oxygen presence in the chamber. Gas flow may be implemented by different procedures, ranging from an undirected, uncontrolled flow from the ceiling of the build chamber to a directed flow over the powder bed from one side to the other, for instance from the left to the right side or from the rear to the front. Another important feature of this gas flow is related to process by-product removal, such as the spatter of inter-layer welding fumes, as otherwise they may detrimentally interact with the laser, which could result in a not-fully- dense matrix due to voids. This effect is sometimes referred to as denudation, which may arise from the interaction between laser tracks and gas flow. As observed in [6] by an experimental and numerical study, this interaction induces extensive vaporization and, consequently, small metal particles may not be incorporated into the melting pool, and may even be pulled away along a vertical direction and/or rearward with respect to the scan direction. In other words, they may be spread all around the build chamber and, therefore, affect the quality of the process and the achievable features of the fabricated component. Material pulled away leaves tracks quite powderless, which may turn into unmolten spots and porosities. Therefore, inert gas flow does have an effect on particle entrainment, which, in turn, results in denudation and may affect density, roughness, and the static or fatigue responses. The study in [7] highlighted that improper removal of by-products may result in a scattering affecting the width of single scans. Their experimental study also investigated the primary reasons for by-products during the stacking process. The results indicate undirected gas flow and insufficient local gas flow velocity have a major role on the aforementioned phenomenon, because they both induce a balling effect, resulting in lack of fusion. The detrimental effect of balling has also been highlighted by [8]. Conversely, the basic role of a properly directed and controlled inert gas flow has been emphasized in [9]: this experimental and simulative investigation highlighted that uniformity of property is strictly related to uniformity of flow. Their studies, regarding SLM-produced titanium alloy, highlighted that a proper modification of inert gas outlets may significantly affect the process and the achievable quality of the produced parts. In particular, outlet shape that produces a uniform flow throughout the build chamber, results in a sharp reduction of the standard deviation affecting some performance indicators. Focus was given to porosity as a reliable indicator of the quality of the additive process and compression strength. Other studies [10,11] have also highlighted the strict relationship between the gas flow and the achievable part quality.
Other studies have focused on comparisons between the effects of different chamber environments, making use of different gases. For instance, in [2], the effects of argon and nitrogen environments have been investigated in terms of the static strength of SLM-fabricated stainless steel specimens, finding no significant differences. The difference between an argon and a helium environment in terms of induced spatter and of achievable surface quality was the topic of [12]. Results indicate that an argon atmosphere may be associated with more significant powder entrainment, which results in more spatter and a poor smoothness of the surfaces of built parts. Conversely, helium flowing in the chamber results in reduced spattering, taking advantage of better diffusivity and conductivity. A more uniform flow, also in agreement with [9,13], results in a better-refined surface, which may also allow for higher scanning speeds with respect to an argon-vented chamber. These results are also confirmed in [14], although some more denudation issues are highlighted.
The considerable impact of spattering is also highlighted in [15], where the authors focused on the effects of the position in the chamber, gas flow velocity, and the relative direction of inert gas flow with respect to the laser scanning pattern. For this purpose, a three-factor, two-level plane was implemented, addressing the achievable mechanical performance. However, only static properties, namely the ultimate tensile strength (UTS), along with an indicator for surface smoothness, were investigated. The results, processed by the tools of ANOVA, indicate that the higher the inert gas velocity in the chamber, the higher the UTS; moreover, static properties may take advantage of scanning against gas flow. As for part position throughout the building process, it is worth mentioning that, based on the reported results, it has an insignificant effect on UTS: the retrieved distributions for UTS are statistically the same regardless of upstream or downstream location with respect to flow. Further studies [16,17] have dealt with the root causes and the effects of spattered powder, considering an SLM additive process. A detrimental effect of contaminated (generally burnt) powder has been observed in this case, in terms of a lower UTS with respect to that achievable with fresh powder due to a higher amount of inclusions. This phenomenon also negatively affects part quality. The amount of burnt particles that may mix up with fresh powder is mainly affected by process parameters, such as gas velocity and direction with respect to scanning path. However, it may be higher for parts in the upstream position, i.e., close to the gas outlet [15], where spattered particles are burnt and disintegrated by the laser. The study in [18] is the only one that addresses the effect of part position in the chamber on the fatigue response of the fabricated parts. This experimental campaign, focused on heat-treated 18Ni300 maraging steel, has led to the conclusion that specimens in the downstream position exhibit a higher fatigue strength. Further microscopy analyses have indicated cracks most often generated from surface or sub-surface porosities. Their size was taken as an indicator of position criticality and of the expected fatigue response: larger porosities were observed in the upstream position, meaning that the larger the porosities, the lower the fatigue strength. This outcome could be due to the aforementioned phenomenon.
A literature review has highlighted that inert gas flow has an impact on the achievable features for the built part. These may be affected by number and shape of the outlets, and, in turn, by the uniformity of flow. Another important parameter is related to the interaction of gas flow speed with scanning speed. Finally, the type of the gas flowing in the chamber may also affect powder entrainment and spattering, and, consequently, the smoothness and overall finish of the surface. The effects in terms of the achievable strength have been more rarely investigated, mainly with regard to static properties, with the exception of [18]. In the latter, the effect of the position in the chamber on fatigue was observed in an argon environment in the framework of a more extended campaign. Based on the hypothesis that flow characteristics may affect the mechanical properties of the built parts, it is clear that this point may be tackled, addressing different features of the gas and its flow, or considering the possible effect of different positions in the chamber with respect to gas flow. This study follows the latter approach, considering upstream, midstream and downstream locations in the build chamber of a commercial DMLS machine, where nitrogen flows from the rear to the front. The output variable is the fatigue response in the finite and infinite life domains. The study is focused on aged maraging steel MS1. This material has wide applications in many fields, including the automotive, aeronautical, biomechanical, tool and die, and marine industries [19,20]. Moreover, it has already been the topic of previous studies by the working group [21,22,23], dealing with the possible effects of build orientation, thickness of allowance for machining, and aging treatment. Based on the retrieved outcomes, it has been proven that this material exhibits quite stable properties regardless of different fabrication, machining and heat-treatment strategies. Issues of novelty of the present study arise from the lack of data regarding this topic, which has never been investigated with reference to this heat-treated material under a nitrogen environment. Moreover, an additional level (midstream location) has been added with respect to the study in [18], where just two locations, close and far away from the inlets, was considered. Finally, sample shapes, dimensions and load type are different with respect to those in [18], which considered flat samples under axial load.
2. Materials and Methods
The material involved in the present research was maraging steel MS1, equivalent to 1.2709 steel and also reported as 18% Ni Maraging 300 or AISI 18Ni300. The chemical composition of the material, in terms of wt%, is provided in Table 1.

Table 1.
Chemical composition (weight percentage) of maraging steel MS1.
Material powder was supplied by EOSGmbH—Electro Optical Systems, Krailling/Munich, Germany, which certified the aforementioned composition and a maximum particle size of 60 μm (mean size around 40–50 μm). The fatigue campaign, which was run according to the procedure below, made use of cylindrical samples with a shape compliant with the recommendations in Standard ISO 1143 [24]. A 6 mm diameter was chosen as a good trade-off between production costs and recommended design. All the samples were manufactured by Powder Bed Fusion (PBF), namely by Direct Metal Laser Sintering (DMLS). For this purpose, samples were built by an EOSINT M280 machine (by EOS GmbH—Electro Optical Systems, Krailling/Munich, Germany), equipped with an Ytterbium fibre laser up to 200 W power. This machine can be regarded as an evolution of EOS M270, in which an undirected and uncontrolled gas flowed from the top of the build chamber. Conversely, the EOS M280 features a directed flow from the rear to the front, in order to take advantage of a more uniform flow with parallel horizontal path with respect to the powder bed.
Its technical characteristics also include 0.2032 mm thickness and 1064 nm-wavelength infrared light beam; moreover, the scanning task may be speeded up to 7000 mm/s. The fabrication chamber consists of a 250 mm × 250 mm horizontal plane for baseplate accommodation, and a 325 mm height. The sample stacking process was assisted by the “Performance” program by EOS that features a 40 μm thickness layer, a 67° rotation scanning strategy and other parameters optimized by EOS (laser speed, laser power, laser offset). A vertical stacking direction was kept unchanged for all the specimens, meaning the main axis of inertia was perpendicular with respect to the horizontal baseplate. All the samples underwent the same post-manufacture treatments. Heat-treatment was performed by age-hardening: samples were heated to a 490 °C temperature in one hour in an oven; afterwards, this temperature was kept unchanged for the following 6 h. Finally, samples underwent gradual cooling in fresh air. This treatment is usually recommended (by EOS, serving and both machine and powder supplier), to relax the detrimental residual stresses that are introduced by the stacking process and increase hardness up to 50HRC. At the same time, UTS is increased from 1100 to 2050 MPa and the Yield Point (YP) is incremented from 1050 to 1990 MPa [25].
The following step consisted of machining by grinding with a 0.5 mm allowance, which led to the shape shown in Figure 1.
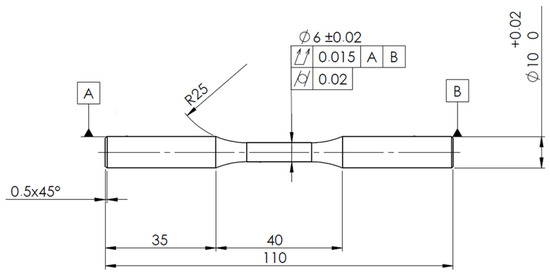
Figure 1.
Sample geometry in agreement with ISO 1143 Standard (all dimensions in mm).
The final task consisted of micro-shot-peening performed with a flow of stainless steel shots with 0.4 mm average diameter. The samples were treated under a 5-bar pressure up to complete coverage. This procedure was suggested by the promising results highlighted in [23,26]. These were yielded by surface peening treatment being run after machining instead of just after additive fabrication. Running shot-peening just after part building is usually recommended [27] to close the process-induced porosities and to build up a beneficial residual stress state. However, it is generally effective over a surface layer not beyond a 0.1 mm depth that is subsequently completely erased upon machining. A 0.5 mm allowance, as in the described processing, is indeed to be regarded as a minimum threshold for machining by turning and grinding. Therefore, the rationale for running shot-peening after machining is taking advantage of the compressive residual stress at the surface, while simultaneously achieving a sufficiently smooth surface. On the one hand, roughness asperities that may act as crack triggers are truncated [26]; on the other hand, the compressive residual stress state prevents propagation or reduces its rate with beneficial outcomes on the fatigue performance. Impact dimples may lead to a further roughness increase, but previous studies have shown this is of minor importance [26,28].
Samples were split into three sets, depending on their position in the working chamber. During the additive process an inert gas, in particular nitrogen, flowed in the chamber from the rear to the front. The rear location, close to the gas inlets, was regarded as upstream, whereas the frontal one, close to the door, was regarded as downstream. The analysis was run over three levels: an intermediate region (between upstream and downstream locations), tagged as midstream, was considered as well. The experimental plan was arranged, according to Table 2, to be regarded as a 1-factor design investigating the effect of the position of the chamber (single factor) on the fatigue response and related failure mode. The investigated positions in the chamber are also highlighted in the sketches in Figure 2A,B, where the gas path is highlighted as well. Each set consisted of 12 samples and all the samples were produced within the same batch.

Table 2.
Experimental design involving three sample sets fabricated at upstream, midstream and downstream locations.
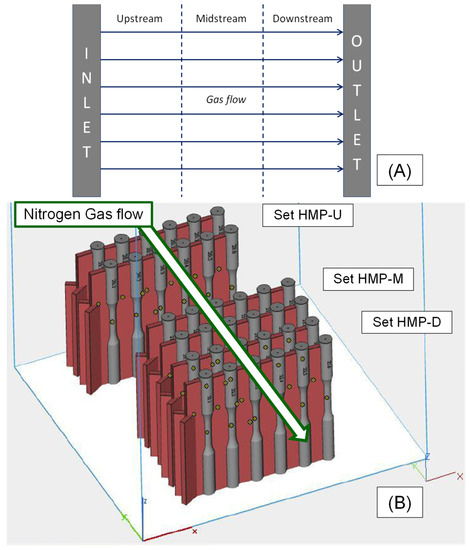
Figure 2.
Sample production in the build chamber: (A) plan view highlighting the three locations with respect to gas flow; (B) isometric view with actual location of sample sets.
3. Experimental Section
All the samples were checked for both dimensions and roughness, in order to ensure the fulfilment of the related specifications. Tests were run under four-point rotating bending (stress ratio, R = −1) by an RB35 machine produced by Italsigma (Forlì, Italy). The testing machine is depicted in Figure 3 and further details and schemes are included in [21]. The testing frequency was kept at 60 Hz for all the trials.
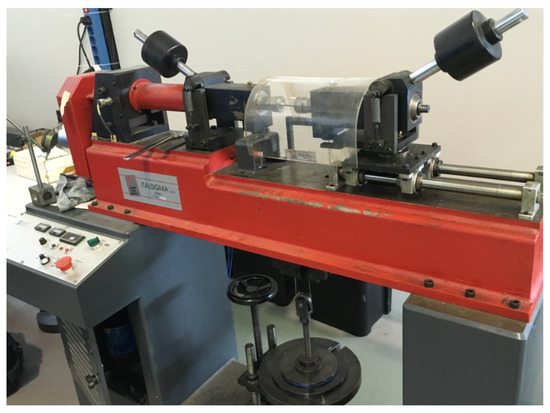
Figure 3.
A photo of the testing machine for fatigue tests under rotary bending. The displayed picture was taken during a trial.
The fatigue tests were initially run in the finite life domain, aimed at determining the S-N curves for the three sample sets. Standard ISO 12,107 [29] was used for this purpose to conduct the experiment and to process the results by linear and quadratic interpolations in the logarithmic scale. The general linear test was then applied to assess the significance of interpolation improvement when applying the non-linear model. A confidence band corresponding to 10% and 90% failure probabilities and to 90% confidence level were determined as well. A 107 runout was considered for fatigue limit determination, based on the previous experience with fatigue testing with specific reference to this material [21,22,23]. An ANOVA-based extended statistical analysis for the comparison of fatigue curves was applied as well, as described below; its basic principle consists in comparing the distance between S-N curve trends and their scattering due to uncertainty.
Fatigue data were also processed by a Maximum Likelihood Estimation (MLE) approach, taking both complete and censoring (namely, runouts) data into account. This approach has the capability of modelling both the sloping part of the S-N curve in the finite life domain and its curvature at runout lifecycle range, which makes it possible to estimate the fatigue limit for infinite life. The utilized algorithm is based on the maximization of a likelihood function for different values of failure probability [30,31,32].
Eventually, an overall fatigue limit with related 90% confidence bands was worked out based on all the determined results, and following the Dixon method [33]. It was worked out based on a unique failure and not-failure sequence, involving samples from the three sets. Finally, fracture surfaces and related failure modes were investigated by stereoscopic microscope (Stemi 305, by ZEISS, Oberkochen, Germany). Sample set relative densities were determined by the immersion method, working out the overall volume based on Archimedes’ thrust.
A further analysis was also performed in order to determine the porosity level and to get a better awareness of porosity distribution. Three specimens per type were cut by a saw; their cross sections were then included in plastic-embedded specimens. A careful polishing was carried out with sandpaper and a water and alumina solution. Cross sections were then examined by the aforementioned stereoscopic microscope, taking a suitable number of pictures. This procedure makes it possible to easily detect porosities: as an effect of the stereoscopic light, the entire surface appears black except for porosities, which are bright due to different light reflection. Image-processing software was utilized to invert colors and to determine the proportion between dark and white pixels, which yields the porosity level. This parameter indicates the number of voids over the considered cross section.
4. Results and Discussion
Roughness Ra proved to be the same (0.8 μm) for all the sample sets: its value is consistent with that observed in [23] and is due to the effect of peening-induced dimples. Relative density and, consequently, the porosity level, also proved to be the same, in the range of 99–99.5%.
This outcome was also confirmed by the porosity analyses. A processed image with inverted colors is displayed in Figure 4, where voids and porosities are highlighted in black over a white landscape. The porosity level is related to the amount of black (ratio between the black and the white pixels) that can be easily determined by graphic processing: several freeware programs are available for this purpose. Based on the retrieved data, the porosity level is generally low and varies between 0.4 and 0.7%, regardless of sample type. This outcome is consistent with the measured relative densities. Moreover, porosities appear to be generally quite uniformly distributed.
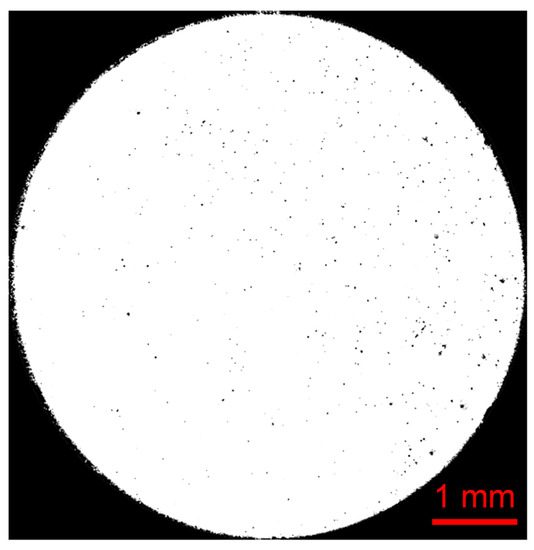
Figure 4.
Porosity analysis assisted by image-processing software (porosities are highlighted as dark pixels over a white landscape): a sample of the HMP-U set with 0.4% porosity level.
Each S-N fatigue curve is plotted in the finite life domain with the related confidence band in Figure 5A–C; moreover, their trends and corresponding strengths are compared in Figure 6A. The general linear test always led to the conclusion that the enhancement yielded by the second-order model was always under the significance threshold. Therefore, the linear model was utilized for all the sample sets instead, and was also applied in the framework of the MLE approach. The curve trends following the latter methodology are displayed in Figure 6B.
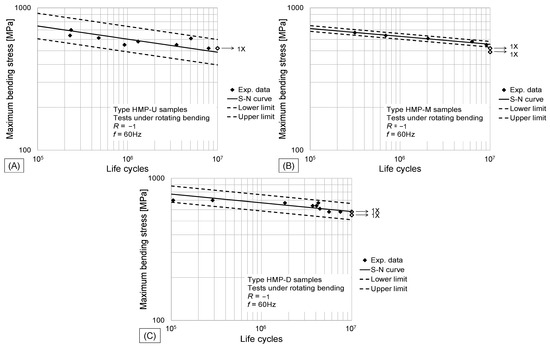
Figure 5.
S-N curves with related confidence bands for sets (A) HMP-U, (B) HMP-M, and (C) HMP-D.
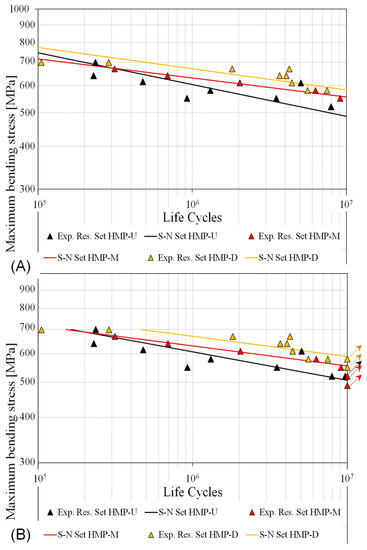
Figure 6.
Fatigue curves in the finite life domain for the investigated data sets, (A) according to ISO 12,107 [29] and its linear regression model (runouts are omitted here, because they are not used for interpolation) and (B) complying with the MLE method (runouts are highlighted by slanted arrows).
Linearly interpolated S-N curves have been determined according to Equations (1) and (2), whereas their 10% and 90% probability of failure lower and upper bounds have been sketched complying with Equation (3). The calculated coefficients b0 and b1 are provided in Table 3.

Table 3.
S-N curves in the finite life domain: related coefficients for nominal trend and confidence bounds.
A second point was S-N curve comparison. For this purpose, an ANOVA-based statistical assessment for the comparison of fatigue curves was utilized. This method, developed in [34] and successfully applied in the subsequent studies [21,22,23,26,28,35] was used to assess the impact of the position in the chamber factor. The rationale of this analysis is to compare the different trends of fatigue curves, and consequently, the resulting strengths over the entire lifespan, to the uncertainty affecting the entire experimental campaign, which results in data scattering. The first point to address the present one-factor analysis is determining a grand-mean curve, as in Equation (4). In this formula, S corresponds to the 10-base logarithm of the stress for a generic number of lifecycles in the finite life domain. The subscript refers to the position in the chamber the set is referred to (HMP-U = upstream, HMP-M = midstream, HMP-D = downstream).
Then, an SSBC′ term, i.e., a term being related to the effect of the considered factor, must be determined as in Equation (5). This term can be regarded as the sum of the squares of the differences between strengths for each curve and the corresponding strength for the same value of lifecycles, according to the aforementioned grand-mean curve. From this point of view, it is a reliable indicator of the different trends and distances among the retrieved curves, and, therefore, of the potential influence of the position in the chamber on the fatigue response.
A scalar term, SSBC, is then worked out in Equation (6), computing the integral mean of the aforementioned term over the explored lifespan, in order to account for the global response over the entire investigated life range. The error term (“SSE”) was estimated as the sum of the squares of the residuals between the experimental data and the predicted ones by linear regression. These residuals were computed as the differences between the 10-base logarithms of the fatigue experimental and predicted strengths for the same lifecycles upon failures. The aforementioned terms were then treated as in a conventional one-factor ANOVA. The sum of squares, corresponding to the effect of the position in the chamber and to the experimental uncertainty affecting the campaign, were suitably scaled by the respective degrees of freedom. The Fisher ratio and p-value were finally computed, to draw a conclusion regarding the significance of the impact of the investigated factor.
This outcome, reported in Table 4, indicates that, based on the retrieved results, the differences are not significant, meaning they are bounded within the experimental uncertainty. Although no significant differences have been observed, the fatigue strength for the HMP-U Set, corresponding to the upstream position, seems to be a bit lower. Some authors, as in the study [15] concerning static properties, have highlighted that a few burnt particles may mix up with fresh powder. This occurrence seems to be more relevant for the components being fabricated close to the gas inlet. At this location, many metal particles are spattered, as they are burnt and disintegrated by the laser, which may result in a reduced density and lower mechanical strength. This result seems to be in agreement with the observed lower fatigue strength for the HMP-U Set. However, a conclusion regarding this point cannot be drawn due to the aforementioned not-significant differences among the determined fatigue strengths and the observed densities and porosities. As for fatigue limits for infinite life, the curves yielded by the MLE approach exhibit a curvature in the neighbourhood of runout, which makes it possible to run a rough estimation of the fatigue limits. It is worth mentioning the three curves converge to close fatigue strengths at runout, which also supports the final outcome of the performed statistical analysis.

Table 4.
ANOVA Table regarding the effect of the position in the chamber on the fatigue strength.
Following this outcome, the fatigue limit (strength at runout, i.e., 107 cycles) was determined by the staircase approach, processing a unique sequence of failure and non-failure events yielded by the merge of the results for the three sets. This merge staircase sequence is provided in Table 5, which yields a fatigue limit of 543 MPa according to the Dixon method [33]. This result (tagged as that for Set HMP-U-M-D), with related confidence band, is compared to the results for the same material reported in [23] with reference to different combinations of heat, machining and surface treatments and related order. In particular, Set N refers to just shot-peened samples, Set H refers to shot-peening with subsequent heat-treatment, Set M refers to peened and subsequently machined samples. The last two Sets, HM and MP, respectively refer to shot-peening with subsequent heat-treatment and to machining with subsequent shot-peening without heat treatment. All the fatigue limits are collected in the bar graph in Figure 7, where confidence intervals corresponding to 90% confidence level are plotted as well. In addition, considering that, based on [36] and many other references, the fatigue limit for finite life may be roughly estimated as 50% of the UTS; the latter value is also added to the graph. Regarding this point, two dashed lines are added, as reference thresholds for the non-heat-treated and heat-treated conditions. The results may be interpreted in light of what was observed in [23], where it was highlighted that machining and heat treatment, when applied together, have a positive synergic effect on the fatigue strength. Therefore, the fatigue limit is approximately 25% incremented, when comparing the joint response of Set HMP-U-M-D to that of Set MP, as an effect of heat treatment being executed as a post-manufacture procedure before machining and shot-peening. Conversely, a slight reduction occurs when comparing the responses of Set HMP-U-M-D and HM. A possible reason for this drop can be related to heat treatment making material more brittle against fatigue and fracture, also in agreement with the remarks for PH Stainless Steel in [35]. When the surface is treated by shot-peening, material ductility is furtherly reduced. These two effects are combined, and consequently, crack initiation and propagation is promoted from sub-surface porosities. As highlighted in the microscopy analyses below, these are located beneath the treated surface, where residual stresses turn from compressive to tensile. Consequently, fatigue strength is lowered. However, this slight decrease, on the order of just a few percentage points, does not appear to be relevant. Regarding ratios with respect to the material UTS, that for Set HMP-U-M-D is 26% and is well aligned with previous results retrieved for maraging steel MS1 in heat-treated and machined conditions [21,22,23]. Considering the entire study, the highest ratio, 38%, was retrieved for Set MP (UTS for untreated material is considered here), which indicates that running shot-peening after machining yields very good properties that are quite close to those for wrought material. In this case, there is no need for heat treatment, which has a worsening effect, and it is possible to take advantage of peening-induced negative residual stresses as well as a quite smooth surface.

Table 5.
Failure–not-failure sequence at staircase involving specimens of Sets HMP-U-M-D.
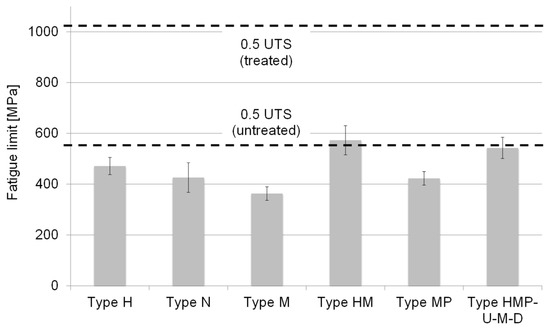
Figure 7.
Fatigue limit for infinite life for HMP-U-M-D compared to those of the complete experimental campaign (with reference to [23]).
As mentioned in the Introduction, the study [18] is the only one that has dealt with the possible effect on fatigue of part position in the chamber with respect to gas flow. In that case, for a different heat treatment performed on a maraging steel, and for a different machine making use of a different inert gas, it was found that samples in a downstream location seem to exhibit better performance. An interesting point is that the aforementioned outcome was related to the size of sub-surface porosities that triggered fatigue failure. Porosity size was regarded as a valid indicator of the expected fatigue strength, meaning that the larger the porosity, the lower the observed fatigue strength. Therefore, the microscopy analysis was focused on the investigation of the failure modes involving the fatigued samples. The first point is that all the fatigue cracks did not initiate from the surface, but were triggered from sub-surface porosities. In particular, it was observed that cracks started from sub-surface porosities with 40–50 μm diameter, at the depth of 150–200 μm, regardless of the sample set, and, consequently, of the position in the chamber. Therefore, the failure modes appear to be the same ones, as highlighted by porosities in Figure 8, Figure 9 and Figure 10 for the three sets investigated here. A possible reason for this different conclusion is that the machine involved here for sample production, EOSINT M280, features a well-controlled directional gas flow that is able to remove burnt powder and by-products, which is not the case of the machine utilized in [18]. Having a uniform flow, indeed, proves to be a key feature to achieve uniform properties of the built parts, as highlighted in [6].
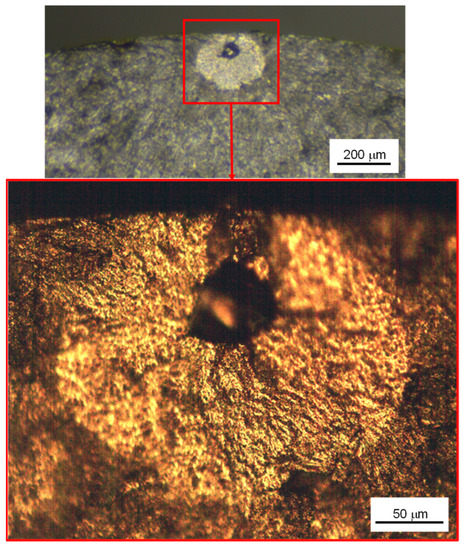
Figure 8.
Crack initiation site in a sample of Set HMP-U.
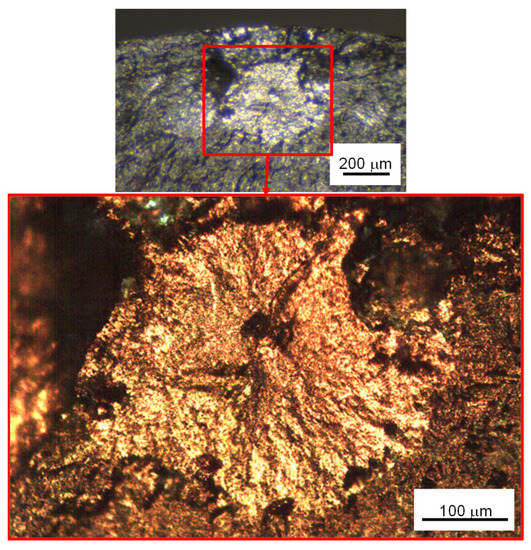
Figure 9.
Crack initiation site in a sample of Set HMP-M.
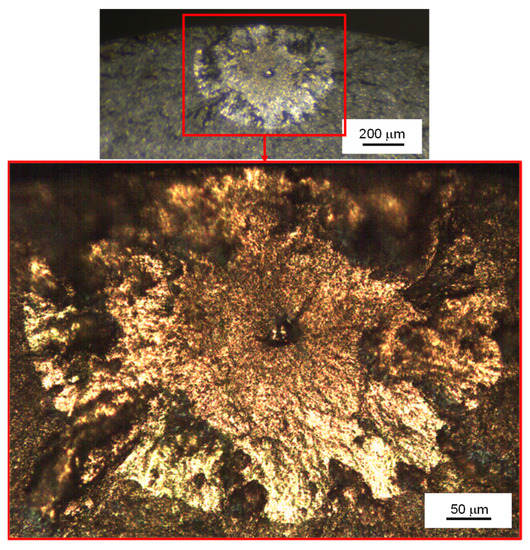
Figure 10.
Crack initiation site in a sample of Set HMP-D.
5. Conclusions
This study dealt with an experimental investigation of the effect of the position in the chamber on the fatigue response of a maraging steel MS1 produced by additive manufacturing, in particular by Direct Metal Laser Sintering. A literature survey has indicated this topic has been rarely investigated, especially with reference to the fatigue response of the material. Moreover, issues of innovation regarding this research arise from the experimental assessment of the fatigue response of MS1, following an aging heat treatment, which has never been the topic of a previous analysis. In addition, the manufacturing procedure was conducted on a commercial EOS M280 machine with nitrogen flowing from the rear to the front, and three different locations of the parts were considered, whereas previous investigations have been mainly concentrated on argon or helium environments with just two locations. The study was arranged by a factorial plan. All the samples were fabricated in the same batch, but at different locations: upstream, midstream and downstream with respect to the nitrogen gas flow. All the samples then underwent aging heat treatment, machining and final shot-peening.
Statistical processing of the results indicates that no significant differences may be observed. This outcome seems also to be related to the same failure mode of the samples, regardless of their respective positions in the build chamber: all the fatigue cracks were initiated from sub-surface porosities with the same sizes (40–50 μm) and approximately at the same depth of 150–200 μm, beneath the layer affected by shot-peening. This minimal effect of sample position appears to be due to the particular features of this machine, which features an improved control of gas flow with respect to previous ones.
Therefore, an overall fatigue limit at runout could be determined. The latter is 26% of the ultimate tensile strength of the aged material, which is well aligned with values determined in previous research by this group.
Author Contributions
Conceptualization, D.C., G.O., S.Ć.-K. and Z.Š.; methodology, G.O., D.C., S.Ć.-K. and Z.Š.; validation, G.O.; formal analysis, G.O.; investigation, G.O.; resources, N.B., Z.Š. and S.Ć.-K.; data curation, G.O., M.D.A. and S.F.; writing—original draft preparation, G.O.; writing—review & editing, G.O.; visualization, G.O., M.D.A., S.F., N.B. and Z.Š.; supervision, D.C. and G.O.; project administration, Z.Š. and S.Ć.-K.; funding acquisition, S.Ć.-K. and D.C. All authors have read and agreed to the published version of the manuscript.
Funding
The research presented in the paper represents a part of the research carried out within the project “Advanced design rules for optimal dynamic properties of additive manufacturing products—A_MADAM”. This project has received funding from the European Union’s Horizon 2020 research and innovation programme under the Marie Skłodowska-Curie grant agreement No 734455: the authors wish to acknowledge the financial support by the European Commission. The authors from Serbia (S.Ć.-K., N.B. and Z.Š.) are obliged to acknowledge the support of Ministry of Education, Science and Technology Development of Republic of Serbia to its institution through grant No. 451-03-68/2022-14/200108.
Data Availability Statement
Further experimental data are unavailable due to privacy.
Conflicts of Interest
The authors declare no conflict of interest.
Nomenclature
The following symbols and abbreviations are used in this manuscript:
| AM | Additive Manufacturing |
| ANOVA | Analysis of Variance |
| b0, b1 | S-N curve coefficients according to ISO 12107 Standard |
| DMLS | Direct Metal Laser Sintering |
| k | Confidence-related tabled coefficient from ISO 12107 Standard |
| MLE | Maximum Likelihood Estimation |
| L-PBF | Laser-Powder Bed Fusion |
| N | Lifecycles (for S-N curve) |
| R | Stress Ratio (fatigue tests) |
| Ra | Roughness Average [μm] |
| Overall mean (for ANOVA computations) | |
| SLM | Selective Laser Melting |
| S | Maximum Bending Stress (for S-N curve) |
| SHMP-U | 10-base logarithm of stress, for Set HMP with upstream location (for ANOVA computations) |
| SHMP-M | 10-base logarithm of stress, for Set HMP with midstream location (for ANOVA computations) |
| SHMP-D | 10-base logarithm of stress, for Set HMP with downstream location (for ANOVA computations) |
| S-N curve | Maximum Bending Stress vs. Life Cycles curve in the finite life domain |
| SSBC′, SSBC | Sum of Squares between Columns (for ANOVA computations, for a generic life N and integral mean over the considered lifespan) |
| SSE | Sum of Squares Error, taking experimental scattering into account (for ANOVA computations) |
| UTS | Ultimate Tensile Strength [MPa] |
| YP | Yield Point [MPa] |
| σ | Standard deviation of the S-N curve linear regression according to ISO 12107 Standard |
References
- Vukkum, V.B.; Gupta, R.K. Review on corrosion performance of laser powder-bed fusion printed 316L stainless steel: Effect of processing parameters, manufacturing defects, post-processing, feedstock, and microstructure. Mater. Des. 2022, 221, 110874. [Google Scholar] [CrossRef]
- Pauzon, C.; Hryha, E.; Forêt, P.; Nyborg, L. Effect of argon and nitrogen atmospheres on the properties of stainless steel 316 L parts produced by laser-powder bed fusion. Mater. Des. 2019, 179, 107873. [Google Scholar] [CrossRef]
- Dai, D.; Gu, D. Effect of metal vaporization behavior on keyhole-mode surface morphology of selective laser melted composites using different protective atmospheres. Appl. Surf. Sci. 2015, 355, 310–319. [Google Scholar] [CrossRef]
- Delacroix, T.; Lomello, F.; Schuster, F.; Maskrot, H.; Baslari, C.; Gaumet, U.; Flici, Y.; Garandet, J.-P. Influence of build characteristics and chamber oxygen concentration on powder degradation in laser powder bed fusion. Powder Technol. 2023, 416, 118231. [Google Scholar] [CrossRef]
- Pauzon, C.; Raza, A.; Hryha, E.; Forêt, P. Oxygen balance during laser powder bed fusion of Alloy 718. Mater. Des. 2021, 201, 109511. [Google Scholar] [CrossRef]
- Matthews, M.J.; Guss, G.; Khairallah, S.A.; Rubenchik, A.M.; Depond, P.J.; King, W.E. Denudation of metal powder layers in laser powder bed fusion processes. Acta Mater. 2016, 114, 33–42. [Google Scholar] [CrossRef]
- Ladewig, A.; Schlick, G.; Fisser, M.; Schulze, V.; Glatzel, U. Influence of the shielding gas flow on the removal of process by-products in the selective laser melting process. Addit. Manuf. 2016, 10, 1–9. [Google Scholar] [CrossRef]
- Li, R.; Liu, J.; Shi, Y.; Wang, L.; Jiang, W. Balling behavior of stainless steel and nickel powder during selective laser melting process. Int. J. Adv. Manuf. Technol. 2012, 59, 1025–1035. [Google Scholar] [CrossRef]
- Ferrar, B.; Mullen, L.; Jones, E.; Stamp, R.; Sutcliffe, C.J. Gas flow effects on selective laser melting (SLM) manufacturing performance. J. Mater. Process. Technol. 2012, 212, 355–364. [Google Scholar] [CrossRef]
- Ly, S.; Rubenchik, A.M.; Khairallah, S.A.; Guss, G.; Matthews, M.J. Metal vapor micro-jet controls material redistribution in laser powder bed fusion additive manufacturing. Sci. Rep. 2017, 7, 4085. [Google Scholar] [CrossRef]
- Schniedenharn, M.; Schleifenbaum, J.H. On the Correlation of the Shielding Gas Flow in L-PBF Machines With Part Density. In Proceedings of the DDMC 2018, Fraunhofer Direct Digital Manufacturing Conference: Proceedings, Berlin, Germany, 14–15 March 2018. [Google Scholar]
- Bidare, P.; Bitharas, I.; Ward, R.M.; Attallah, M.M.; Moore, A.J. Laser powder bed fusion in high-pressure atmospheres. J. Mater. Process. Technol. 2018, 99, 543–555. [Google Scholar] [CrossRef]
- Pauzon, C.; Mishurova, T.; Fischer, M.; Ahlström, J.; Fritsch, T.; Bruno, G.; Hryha, E. Impact of contour scanning and helium-rich process gas on performances of Alloy 718 lattices produced by laser powder bed fusion. Mater. Des. 2022, 215, 110501. [Google Scholar] [CrossRef]
- Traore, S.; Schneider, M.; Koutiri, I.; Coste, F.; Fabbro, R.; Charpentier, C.; Lefebvre, P.; Peyre, P. Influence of gas atmosphere (Ar or He) on the laser powder bed fusion of a Ni-based alloy. J. Mater. Process. Technol. 2021, 288, 116851. [Google Scholar] [CrossRef]
- Anwar, A.B.; Pham, Q.-C. Selective laser melting of AlSi10Mg: Effects of scan direction, part placement and inert gas flow velocity on tensile strength. J. Mater. Process. Technol. 2017, 240, 388–396. [Google Scholar] [CrossRef]
- Raza, A.; Pauzon, C.; Hryha, E.; Markström, A.; Forêt, P. Spatter oxidation during laser powder bed fusion of Alloy 718: Dependence on oxygen content in the process atmosphere. Addit. Manuf. 2021, 48, 102369. [Google Scholar] [CrossRef]
- Liu, Y.; Yang, Y.; Mai, S.; Wang, D.; Song, C. Investigation into spatter behaviour during selective laser melting of AISI 316L stainless steel powder. Mater. Des. 2015, 87, 797–806. [Google Scholar] [CrossRef]
- Douellou, C.; Balandraud, X.; Duc, E.; Verquin, B.; Lefebvre, F.; Sar, F. Rapid characterization of the fatigue limit of additive-manufactured maraging steels using infrared measurements. Addit. Manuf. 2020, 35, 101310. [Google Scholar] [CrossRef]
- Rajesh, K.V.D.; Shaik, A.M.; Buddi, T. Wear and corrosion analysis on Maraging Steel MS1 and Stainless Steel 316L developed by direct metal laser sintering process. Adv. Mater. Process. Technol. 2022, 8, 1135–1150. [Google Scholar] [CrossRef]
- Ebrahimi, A.; Mohammadi, M. Numerical tools to investigate mechanical and fatigue properties of additively manufactured MS1-H13 hybrid steels. Addit. Manuf. 2018, 23, 381–393. [Google Scholar] [CrossRef]
- Croccolo, D.; De Agostinis, M.; Fini, S.; Olmi, G.; Vranic, A.; Ciric-Kostic, S. Influence of the build orientation on the fatigue strength of EOS maraging steel produced by additive metal machine. Fatigue Fract. Eng. Mater. Struct. 2016, 39, 637–647. [Google Scholar] [CrossRef]
- Croccolo, D.; De Agostinis, M.; Fini, S.; Olmi, G.; Robusto, F.; Ćirić-Kostić, S.; Moraca, S.; Bogojević, N. Sensitivity of direct metal laser sintering maraging steel fatigue strength to build orientation and allowance for machining. Fatigue Fract. Eng. Mater. Struct. 2019, 42, 374–386. [Google Scholar] [CrossRef]
- Croccolo, D.; De Agostinis, M.; Fini, S.; Olmi, G.; Robusto, F.; Ćirić-Kostić, S.; Vranic, A.; Bogojević, N. Fatigue response of as-built DMLS maraging steel and effects of aging, machining, and peening treatments. Metals 2018, 8, 505. [Google Scholar] [CrossRef]
- International Organization for Standardization ISO 1143:2010; Standard-Metallic Materials-Rotating Bar Bending Fatigue Testing. International Organization for Standardization (ISO): Geneva, Switzerland, 2010.
- EOS GmbH. Available online: https://www.eos.info/material-m (accessed on 28 January 2023).
- Ćirić-Kostić, S.; Croccolo, D.; De Agostinis, M.; Fini, S.; Olmi, G.; Paiardini, L.; Robusto, F.; Šoškić, Z.; Bogojević, N. Fatigue response of additively manufactured Maraging Stainless Steel CX and effects of heat treatment and surface finishing. Fatigue Fract. Eng. Mater. Struct. 2022, 45, 482–499. [Google Scholar] [CrossRef]
- Sanz, C.; Garcia Navas, V.; Gonzalo, O.; Vansteenkiste, G. Study of surface integrity of rapid manufacturing parts after different thermal and finishing treatments. Procedia Eng. 2011, 19, 294–299. [Google Scholar] [CrossRef]
- Croccolo, D.; Bogojević, N.; De Agostinis, M.; Fini, S.; Olmi, G.; Robusto, F.; Šoškić, Z.; Ćirić-Kostić, S. Fatigue response of additively manufactured as-built 15-5 PH stainless steel and effects of machining and thermal and surface treatments. Fatigue Fract. Eng. Mater. Struct. 2022, 46, 433–451. [Google Scholar] [CrossRef]
- International Organization for Standardization ISO 12107:2012; Metallic Materials–Fatigue Testing–Statistical Planning and Analysis of Data. International Organization for Standardization (ISO): Geneva, Switzerland, 2012.
- Pascual, F.G.; Meeker, W.Q. Estimating fatigue curves with the random fatigue-limit model. Technometrics 1999, 41, 277–289. [Google Scholar] [CrossRef]
- Pollak, R.D.; Palazotto, A.N. A comparison of maximum likelihood models for fatigue strength characterization in materials exhibiting a fatigue limit. Probabilistic Eng. Mech. 2009, 24, 236–241. [Google Scholar] [CrossRef]
- Paolino, D.S.; Chiandussi, G.; Rossetto, M. A unified statistical model for S–N fatigue curves: Probabilistic definition. Fatigue Fract. Eng. Mater. Struct. 2013, 36, 187–201. [Google Scholar] [CrossRef]
- Dixon, W.J.; Massey, F., Jr. Introduction to Statistical Analysis; McGraw-Hill: New York, NY, USA, 1983. [Google Scholar]
- Olmi, G. Low cycle fatigue experiments on Turbogenerator steels and a new method for defining confidence bands. J. Test. Eval. 2012, 40, JTE104548. [Google Scholar] [CrossRef]
- Croccolo, D.; De Agostinis, M.; Fini, S.; Olmi, G.; Bogojevic, N.; Ciric-Kostic, S. Effects of build orientation and thickness of allowance on the fatigue behaviour of 15–5 PH stainless steel manufactured by DMLS. Fatigue Fract. Eng. Mater. Struct. 2018, 41, 900–916. [Google Scholar] [CrossRef]
- Niemann, G.; Winter, H.; Hohn, B.R. Maschinenelemente; Springer: Berlin, Germany, 2005. [Google Scholar]
Disclaimer/Publisher’s Note: The statements, opinions and data contained in all publications are solely those of the individual author(s) and contributor(s) and not of MDPI and/or the editor(s). MDPI and/or the editor(s) disclaim responsibility for any injury to people or property resulting from any ideas, methods, instructions or products referred to in the content. |
© 2023 by the authors. Licensee MDPI, Basel, Switzerland. This article is an open access article distributed under the terms and conditions of the Creative Commons Attribution (CC BY) license (https://creativecommons.org/licenses/by/4.0/).