1. Introduction
In the new era of Industry 4.0, equipment availability is desired to decrease downtime and increase productivity. Maintenance costs account for 15–40% of the overall cost of goods production. Therefore, maintenance activities have become a significant factor in manufacturing. With the development of technologies, numerous sensors monitor and inspect the conditions of industrial systems for maintenance activities, and significant amounts of data from sensors have been collected. Therefore, anomaly detection methods of industrial systems have been extensively studied to improve equipment availability [
1,
2,
3,
4,
5,
6].
Machine tools are essential industrial elements because they are used in a wide range of applications and can flexibly manufacture workpieces. A computer numerical control (CNC) machine processes a product through spinning a tool. During machining, the sharp edge of the tool is deformed or damaged; this is called tool wear. Worn tools can cause accidents and produce defective products. Therefore, an anomaly detection method of tool conditions is important because it is related to accident prevention, product quality, and manufacturing costs. Various models have been proposed to diagnose tool wear, including statistical, machine learning, deep learning, and hybrid models. In particular, deep learning models are growing as tool diagnosis models because of their improved computational performance and the increased amount of data collected from sensors [
7,
8,
9,
10,
11,
12].
To apply a deep learning model to tool diagnosis in a CNC machine, sufficient training data must be prepared to train a deep learning network. Additionally, the number of data points in each class should be balanced to improve the performance of the deep learning model. However, the collection of abnormal data from CNC machines is limited. This leads to data deficiencies and imbalances, degrading the performance of deep learning models. These are crucial problems in the research field of anomaly detection. Therefore, this study proposes an anomaly detection method based on a deep learning model and puzzle-based data augmentation for CNC machine tools to overcome data deficiencies and imbalance problems and improve the classification accuracy.
The proposed method involves converting time-series data to image data, extracting the features, augmenting the training data based on cutting and re-assembling images like a puzzle, and applying double-transfer learning with two training datasets. Currently, the CNC machine data used for anomaly detection in tool conditions are time-series data. However, it is difficult to distinguish between normal and abnormal data because they are similar. In addition, the amount of data currently available is insufficient for training deep learning networks. To extract the features effectively and increase the amount of training data, we converted the time-series data to image data using a wavelet transform, and color space conversion and color extraction were applied. Moreover, puzzle-based data augmentation was applied to overcome data imbalances and deficiencies. The images were divided into several sections. A new training dataset based on cutting and reassembling the images was generated. In addition, to avoid overfitting and improve the performance of the anomaly detection model, we applied double-transfer learning with two training datasets. Our study makes four major contributions to the literature, as follows:
The use of wavelet transform, color space conversion to overcome data deficiencies, and effective feature extraction, as well as improved classification accuracy;
Color extraction through the elimination of a specific color to extract features effectively and improve the classification accuracy;
Puzzle-based data augmentation to overcome data imbalances and data deficiencies;
Double transfer learning with two training datasets to avoid overfitting and improve classification accuracy.
The remainder of this paper is organized as follows:
Section 2 introduces the related studies on tool diagnosis methods and data augmentation.
Section 3 discusses the proposed anomaly detection method for CNC machine tools that overcomes data imbalances and deficiencies.
Section 4 presents the experimental results of the proposed method. Finally, the conclusions are presented in
Section 5.
2. Related Works
Machine tools are used in a wide range of applications, and they can flexibly manufacture workpieces. Furthermore, they incur maintenance costs, which constitute a significant portion of the overall costs and effect product quality. Thus, an anomaly detection method of tool conditions is required, because these tools are essential industrial elements. To diagnose tool conditions, data are first collected from a sensor. Generally, the data type is time-series data. Next, data analysis is conducted. In this step, data pre-processing is performed. Researchers analyze meaningful data and subsequently an anomaly detection model of tool conditions is implemented. Therefore, it is important to select an appropriate anomaly detection model. This is because tool conditions are related to the performance of the anomaly detection model. Currently, deep learning models are widely applied to diagnose tool conditions.
Furthermore, to improve the performance of the anomaly detection model, data imbalances and deficiencies should be overcome. If there are insufficient data for training a model, the trained model tends to be biased toward one class. These problems decrease the classification accuracy of an anomaly detection model. To overcome these problems, data augmentation methods have been investigated. Because the data augmentation method can increase the amount of data, it can overcome data imbalances and deficiencies. This leads to effective training of the model, and the trained model can achieve a higher performance.
2.1. Anomaly Detection Method for Tool Condition
To implement anomaly detection model for the tool condition of a CNC machine, statistical, machine learning, and deep learning models have been studied. As an example of a statistical model, the dynamic Bayesian network (DBN) was applied to assess the health condition of a CNC machine and to estimate its remaining useful life. The proposed method extracted features from raw data and trained a model that represented the wear behavior of the cutting tool using the extracted features. A mixture of Gaussian hidden Markov models (MoGHMMs) was implemented to calculate degradation. DBNs have been used to model HMMs. In addition, a machine learning model was applied to diagnose the tool condition. Support vector machine, a well-known machine learning technique, was applied to diagnose tool breakage faults. Decision trees have also been used to monitor and diagnose tools in industrial production systems [
2,
3].
Deep learning has been widely applied as it has become possible to collect big data and increase computational power. Therefore, deep learning has also been applied to determine the early wear progress. A neural network was trained using an acoustic emission to predict tool wear. The proposed method showed that the trained neural network can predict tool wear. In addition, Gramian angular summation fields (GASFs) and a convolutional neural network (CNN) were applied to classify the tool wear. GASF images were effective in distinguishing normal and abnormal data. A CNN-based model was used to classify images [
8,
13].
2.2. Data Augmentation
To improve the performance and avoid overfitting, the number of each class in the training data was balanced. In addition, if the training data showed a similar tendency, there was a limit to increasing classification accuracy. Therefore, researchers have applied various data augmentation methods rather than oversampling. The experimental results showed the data augmentation is effective. For the time-series data, data augmentation was applied by injecting Gaussian noise or more complex noise patterns. In addition, window cropping or slicing can be applied, such as cropping for image data augmentation. Window warping is a distinctive method used for time-series data; it compresses or extends the range of randomly selected data. In addition, the frequency and time–frequency domains are considered for time-series data augmentation [
14,
15].
Image data augmentation has also been widely studied. This is because CNN, best known as deep learning network, specializes in image classification technology and is widely used. Common image data augmentation is the geometric transformation. Conventional methods include cropping, flipping, rotation, translation, scaling, color jittering, shifting, and shearing. Geometric transformations can be used simply, and are widely applied to increase the amount of training image data. Generative adversarial networks (GANs) are currently used for image data augmentation. The actions of the generator and discriminator generate new data similar to the original data. The generator captures the data distribution and the discriminator estimates the probability related to the training data. Various models based on GANs have been implemented for augmenting images such as CycleGAN and StarGAN [
16,
17,
18,
19,
20].
Because image data augmentation methods have been widely researched, we implemented anomaly detection method based on image data augmentation. To implement this method, we convert the data from the time-series data into images. After applying the proposed image-processing method to effectively extract features, the proposed puzzle-based data augmentation method, which is related to image data augmentation, was applied.
3. Anomaly Detection Method Using Puzzle-Based Data Augmentation and Deep Learning
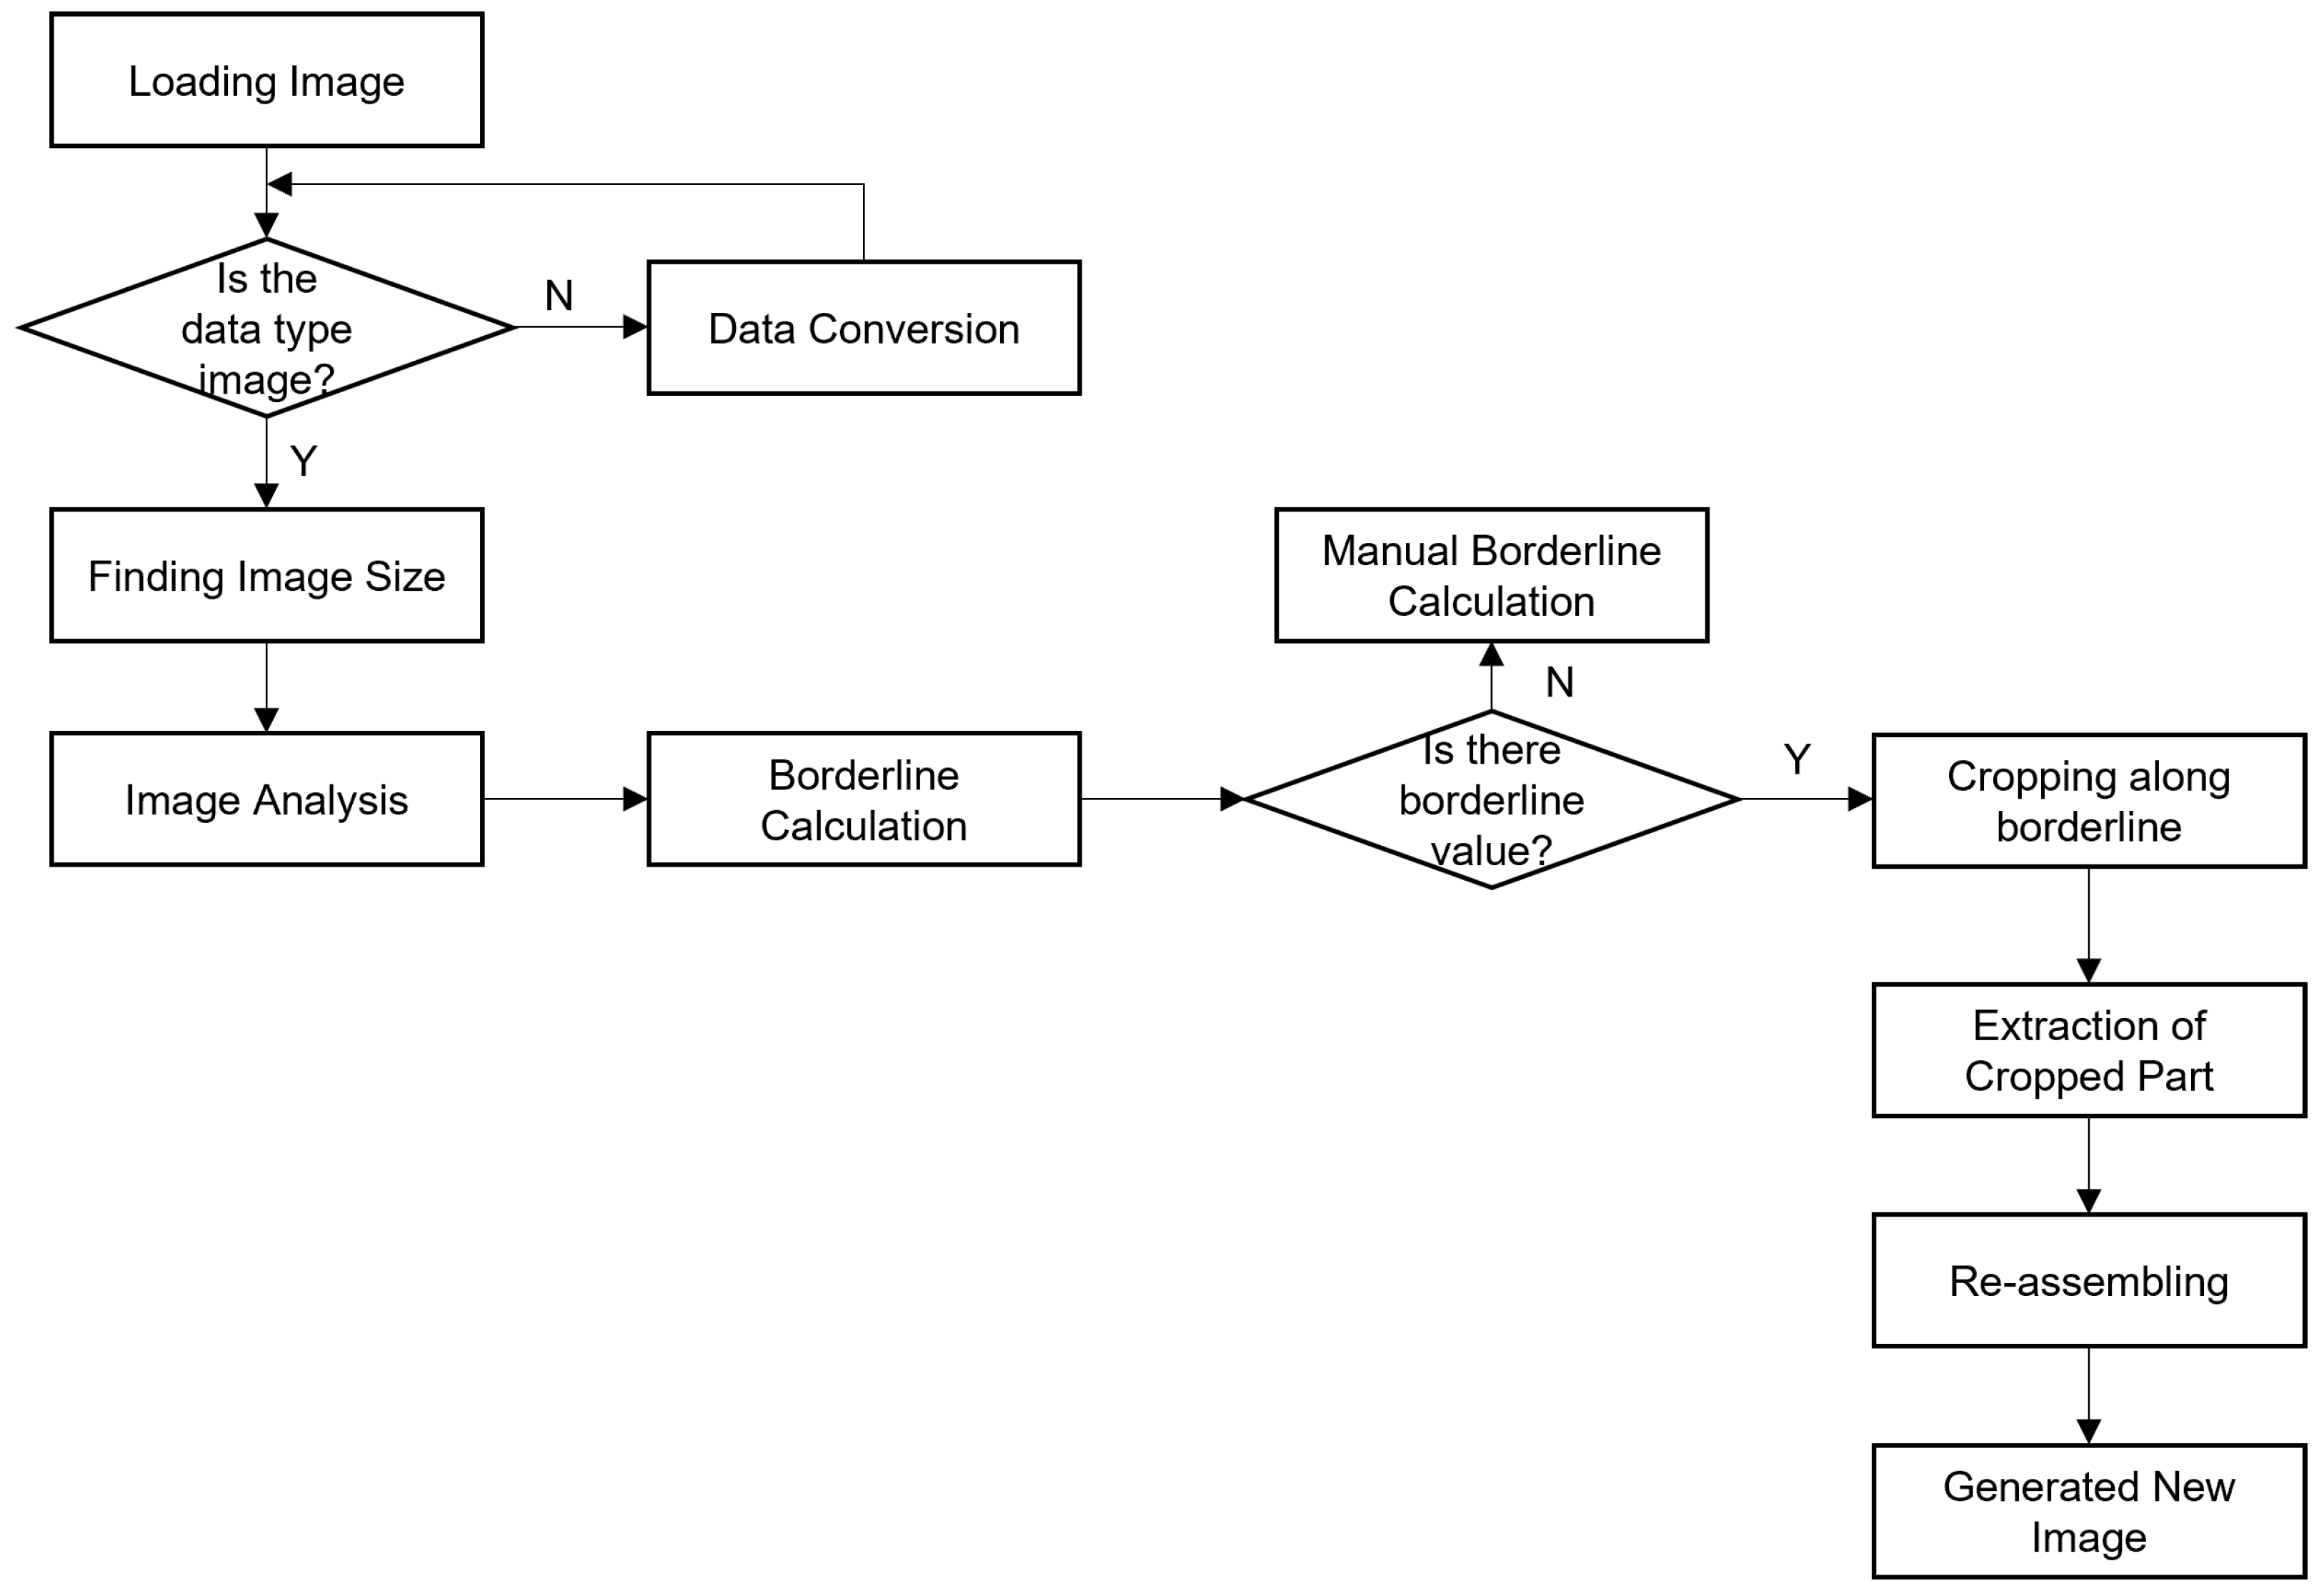
To overcome the data imbalance and deficiency, this study proposes anomaly detection method for CNC machine tools using puzzle-based data augmentation and deep learning. The proposed method can improve the performance of anomaly detection model and overcome data imbalances and deficiencies. An overview of the proposed method is presented in
Figure 1.
As shown in this figure, there are two types of rectangles: rectangular boxes with rounded corners represent the input/output of data processing, and rectangular boxes represent the step of data processing. The proposed method was divided into five parts: data conversion, color space conversion and data augmentation, generation of the first training dataset and transfer learning, color extraction and puzzle-based data augmentation, and generation of a second training dataset and double-transfer learning.
Current data were collected to analyze the tool condition of a CNC machine. The current data from CNC machine are time-series data related to the sequential data. However, it is difficult to classify the normal and abnormal (defective) data based on the current data of the CNC machine. This is because it is similar to that of the naked eye, as shown in
Figure 2.
To effectively distinguish normal and abnormal data, we focused on a deep learning algorithm for anomaly detection in a CNC machine tool. To improve the performance of anomaly detection model based on deep learning, sufficient training data must be collected and the features of the training data must be extracted. However, abnormal data are insufficient to train deep learning networks for implementing an anomaly detection model. Therefore, this study proposes converting the current data from time-series data to image data. This is because image data can be generated simply by data augmentation and can be distinguished better than time-series data. This overcomes data deficiency and imbalance, and improves the classification accuracy of the normal and abnormal data [
21,
22].
To remove unnecessary data, the current data were extracted during pre-processing. Furthermore, to extract features and apply data augmentation, the current data were converted into images using a continuous wavelet transform.
Figure 3 shows the resulting images of converting current data. This shows that the image data are visually distinguishable compared to time-series data. However, some abnormal data were similar to the normal data. Therefore, we focused on color space conversion to extract features and improve classification accuracy. This is because the color space conversion could noticeably change an image while containing meaningful information that the pixels represented.
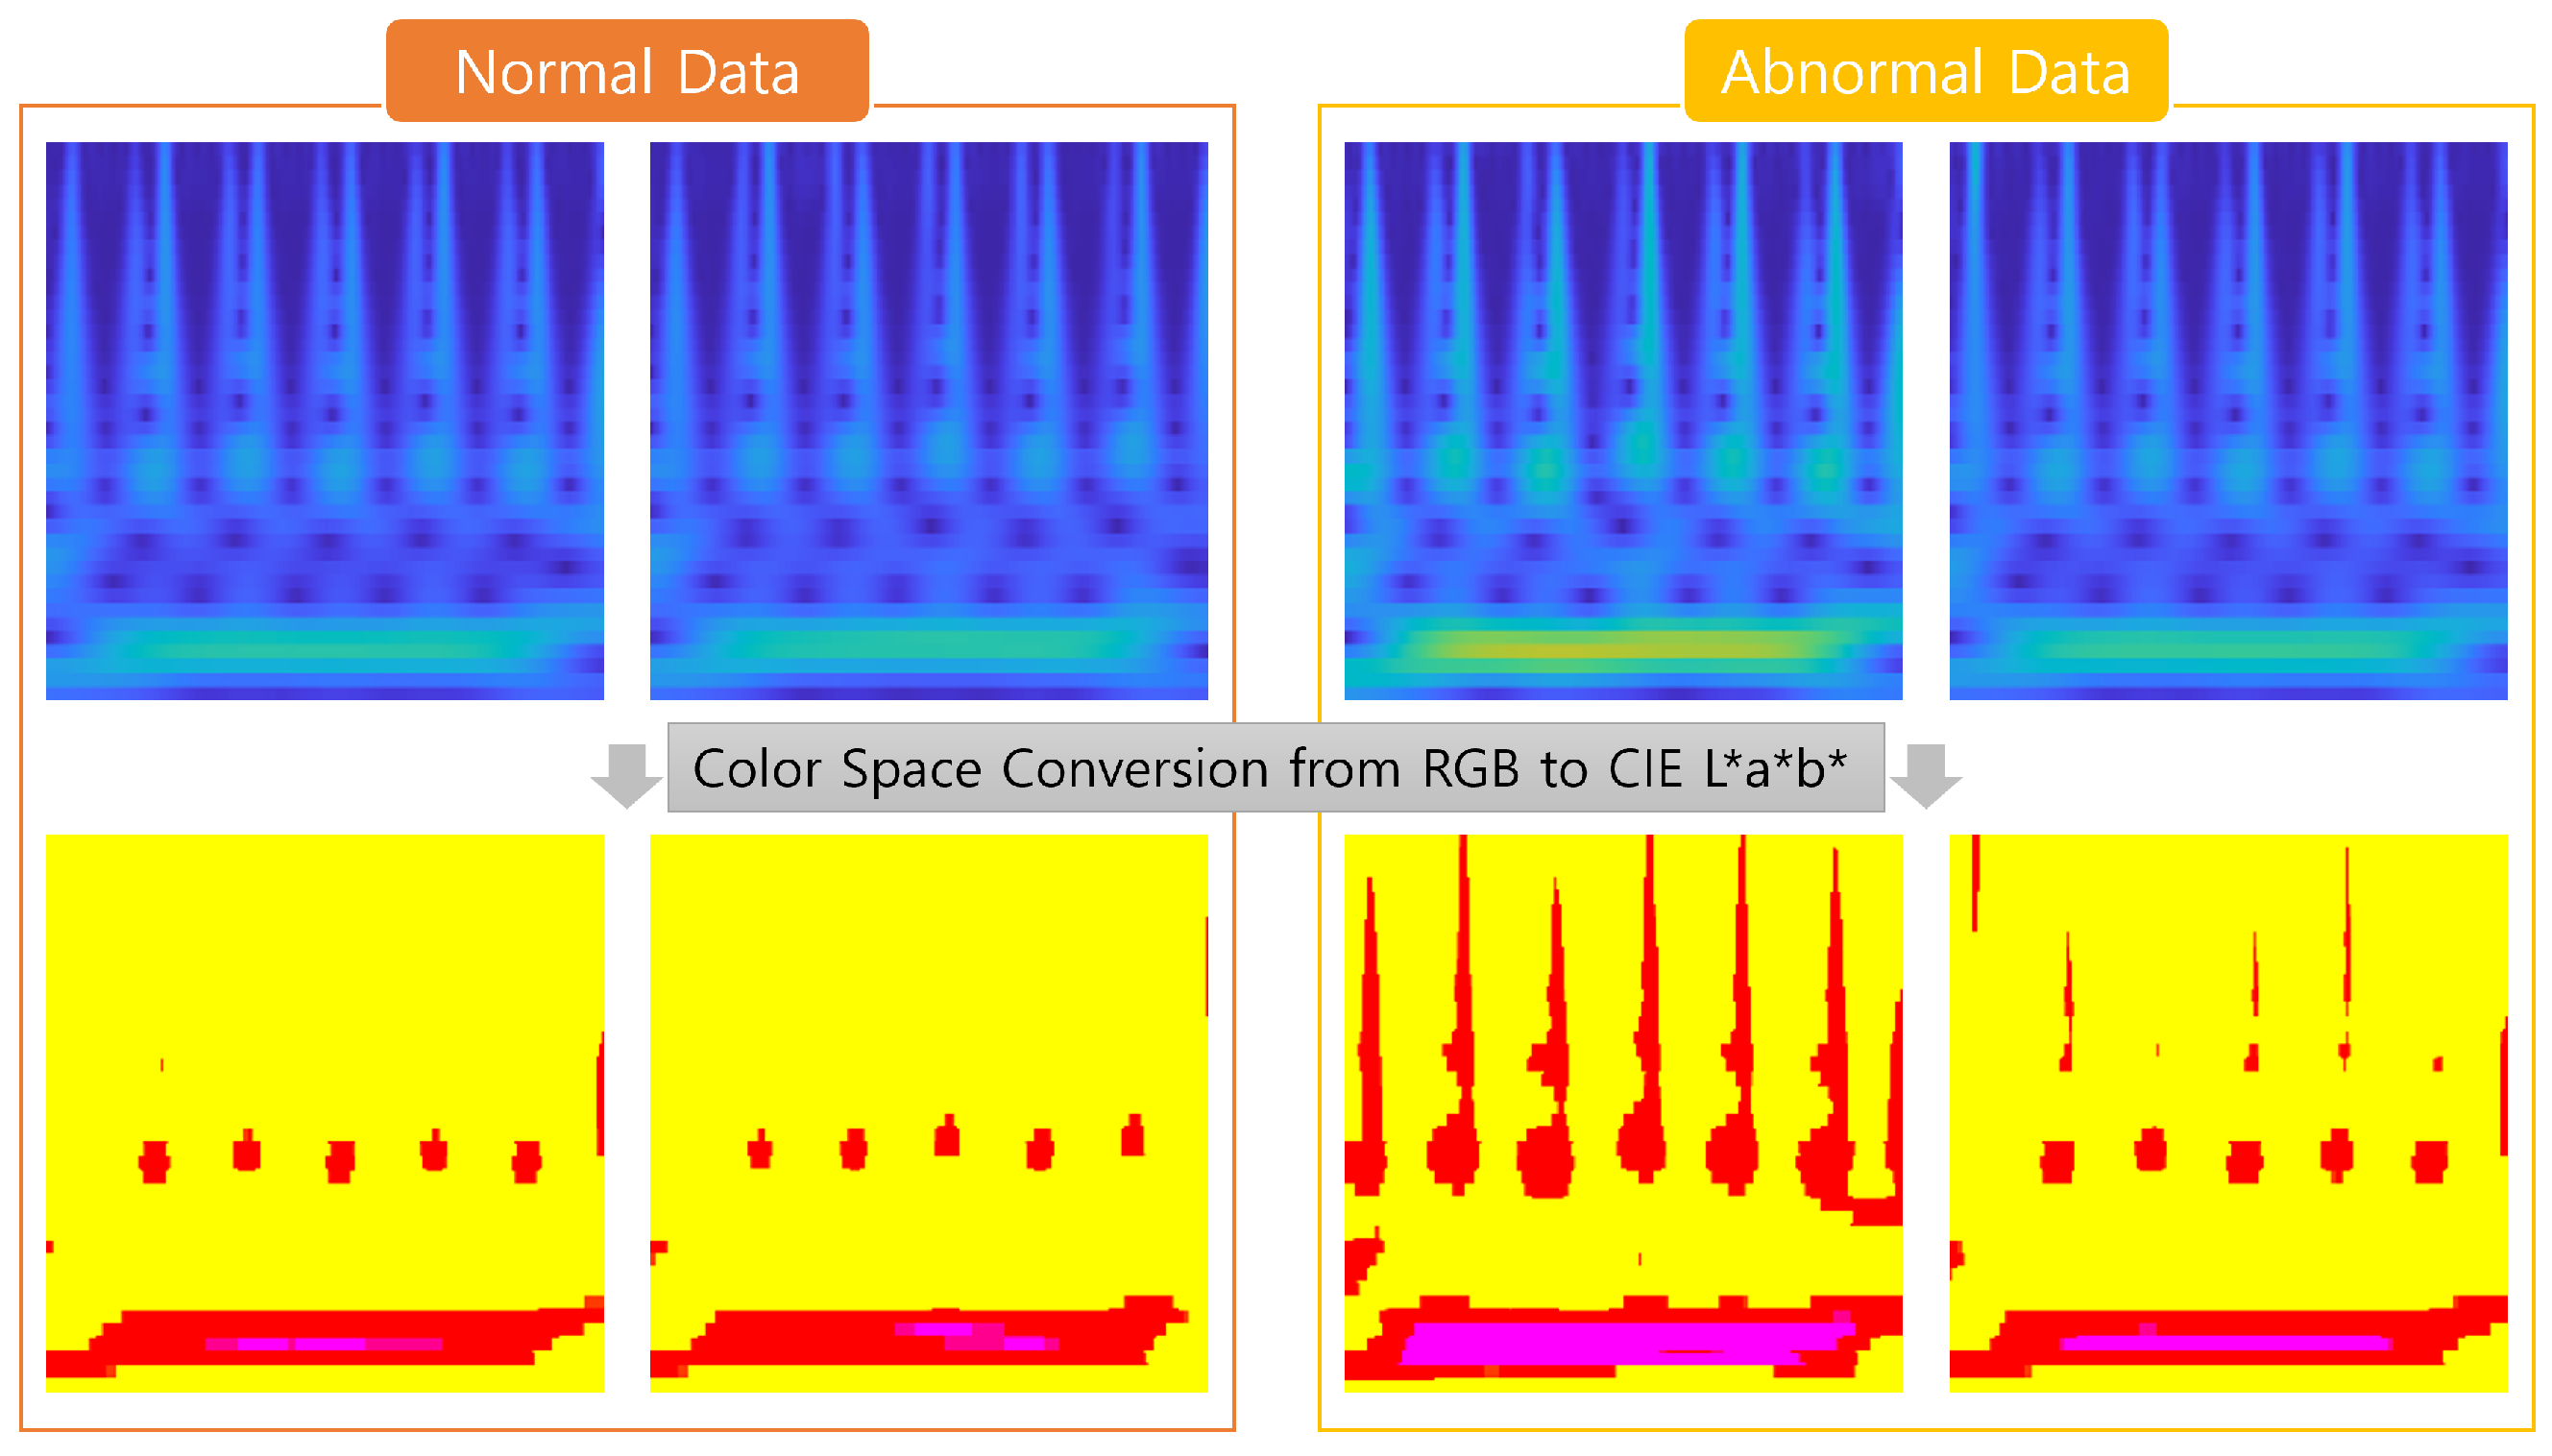
Among color spaces, the CIE L*a*b* color space comprises three color spaces: luminance, red–green axis, and blue–yellow axis. Because it organizes one axis with blue and yellow colors, it can effectively distinguish between blue and yellow. The images converted by the wavelet transform contained a large amount of blue. Therefore, we selected the CIE L*a*b* color space conversion. The resulting images after the conversion to the CIE L*a*b* color space are shown in
Figure 4. The CIE L*a*b images of normal and abnormal data can be distinguished from each other better than RGB images can.
As mentioned previously, the collection of abnormal data was limited. This led to data imbalances and deficiencies when deep learning was applied. This is a crucial problem in anomaly detection research. To obtain sufficient abnormal data to overcome data deficiencies and imbalances, we considered a data augmentation method. After data augmentation, the training dataset #1 was generated, and we retrained a pre-trained network using the training dataset #1. The pre-trained network is well known and has a higher classification accuracy performance. This process is known as transfer learning. Transfer learning is an effective training method because it can show good performance in terms of classification accuracy, even when there are few training data with a short computational time. Some studies have demonstrated that the transfer learning is effective when training data is small. Because it is based on a well-trained (pre-trained) network, the performance is improved simply by fine-tuning the parameters while training on a small new dataset. Namely, the transfer learning can show the performance with shorter training times despite a smaller number of training data. Therefore, we applied transfer learning to implement the anomaly detection model because our dataset is insufficient to train the deep learning network. The transfer learning process is as follows: loading a pre-trained network, cutting off the classification part of the network, generating a suitable classification part, and training a network using a new training dataset. Transfer learning at this stage is the first training, and the network trained using the training dataset #1 becomes the basis for double-transfer learning to increase the classification accuracy [
23,
24].
After transfer learning, we generated the training dataset #2. As shown in the images, generated by the wavelet transform, blue occupied a large portion of the figure. As in the images generated by the wavelet transform, yellow occupies a large part of the CIE L*a*b* color space images. Therefore, we focused on colors that were not yellow. Therefore, we extracted specific colors from the images by eliminating yellow, setting it as the background.
Figure 5 shows the results of color extraction, in which pixels with eliminated colors were filled with white or black.
In the experiments, the training images—which were pixels with eliminated color—were filled with white, and they performed better than the training images—where pixels with eliminated color were filled with black. Therefore, the training images—where the pixels with eliminated colors were filled with white—were augmented.
After color extraction, puzzle-based data augmentation was applied, as shown in
Figure 6. Puzzle-based data augmentation represents the reassembly of cropped images, such as puzzles. The border line must be determined to crop the image. It is determined based on an image calculated using (3), which is related to analyzing the pixels in the input images.
The border line is determined excluding parts of an image that contain meaningful information. Therefore, it will be located in background pixels like white pixels. After determining border line, the images were cropped along the border. In this study, one horizontal border resulted from analyzing the input images. Therefore, all images were cropped along the border, and two images were selected and reassembled, like a puzzle: one located at the top of the image and the other at the bottom. This method can generate new images of up to a square of n (where n is the number of data points), is simple, and has a short computational time. Therefore, it is an effective data augmentation method because of the slight differences that exist with the original images and because it can generate numerous new data in a simple way.
Through puzzle-based data augmentation, training set #2 was generated. Using training set #2, we conducted transfer learning again. In other words, this study proposed double-transfer learning using two training datasets. The first transfer learning was performed before color extraction using training set #1. The second transfer learning step was performed after color extraction and puzzle-based data augmentation using training set #2. The two training datasets were similar with a slight difference. We believe that this difference avoids overfitting and improves the classification accuracy.
4. Experimental Results
We applied image processing and a deep learning algorithm to implement anomaly detection model for a CNC machine. In the manufacturing field, which requires anomaly detection, crucial problems exist when applying a deep learning network because of data deficiency and imbalance. Therefore, the proposed method can overcome data deficiency and imbalance by converting time-series data into image data, applying color space conversion, applying data augmentation and transfer learning, extracting specific color information, and applying puzzle-based data augmentation and double-transfer learning. Inception V3 was used for transfer learning. Inception V3 is a high-performance model based on GoogLeNet with a decreased number of parameters and reduced computational time. GoogLeNet utilized deeper and wider networks, and it improved the classification performance of network. Furthermore, the Inception architecture of GoogLeNet is effective with respect to memory and computational budget, and it showed higher performance with lower number of parameters. Inception V3 is developed model of GoogLeNet, that is flexible, deeper layer, but higher performance. It is based on several design principle for scaling up convolutional networks and considering Inception architecture. The network yielded high-quality results with a receptive-field resolution as low as 79 × 79 pixels. Therefore, we selected the Inception V3 network as the classification model for conducting anomaly detection of a CNC machine tool [
25,
26].
To train the model for anomaly detection, the current data of machining center (Doosan MYNX5400 made by Doosan (Korea)) depicted in
Figure 7 was collected at 160 ms intervals. The cutting time of one material was about 25 min, and 68 materials were processed using 10 pi endmill. Among 68 materials, the number of normal data is 43 and that of abnormal data is 25. The cases of abnormal data include material scratches and tool breakage.
As discussed, it is difficult to distinguish normal and abnormal data using the current data that are time-series data. Therefore, to improve the performance of anomaly detection, we converted the current data to image data, applied color space conversion, color extraction, puzzle-based data augmentation, and double-transfer learning. In the step of data conversion, the current data of one material were converted into one image. Then, we extracted to the part of the image that showed the features and divided into 28 images. The examples of divided images were represented in
Figure 3.
To verify the proposed method, we compared the classification accuracy values of network-trained models using various training datasets. The test results are presented in tables. The original data were divided into two datasets: training and test. The test dataset was excluded from the training dataset. After training, the classification accuracy was calculated using the test dataset.
The first step of the proposed method is data conversion. To overcome data deficiency and imbalance, the current data were converted into image data using a wavelet transform.
Table 1 presents the classification results of the network trained using the dataset-converted wavelet transform.
As shown in the table, the classification accuracy was low. The classification accuracy of the abnormal data was lower because the amount of abnormal data was smaller than that of normal data. Therefore, to effectively extract features and apply data augmentation, the images were converted from an RGB color space to a CIE L*a*b* color space.
Table 2 lists the classification accuracy of the network trained using the dataset converted into the CIE L*a*b* color space. Classification accuracy was significantly improved by converting the color space. This is because the features of an image became outstanding through color space conversion. Experiment #3 in
Table 2 shows that the classification accuracy of abnormal data is high. However, the classification accuracy of the normal data is lower than that of Experiments #1 and #2. This implies that the trained network is biased toward abnormal data. Therefore, to improve the classification accuracy by balancing the amount of data in the classes, we applied oversampling to augment the abnormal data.
Table 3 presents the classification accuracy of the network trained using the dataset by applying oversampling as data augmentation after color space conversion. The classification accuracy of the normal class was higher than that in
Table 2. Because the number of training data points was selected according to the smallest number of data points, the number of data points in each class matched the number of abnormal data points in
Table 2. However, as shown in
Table 3, the amount of data in the abnormal class increases until the amount of data in the normal class increases through oversampling. Therefore, the classification accuracy of normal data increased and that of abnormal data decreased. To improve classification performance, we applied color extraction.
Table 4 presents the classification accuracy of the network trained using the dataset to which color extraction was applied. The classification accuracy of the abnormal class increased by applying color extraction. To improve classification performance, we applied double-transfer learning with two training datasets.
Table 5 presents the classification accuracy of the network trained using the dataset by applying double-transfer learning to the two training datasets. The first training dataset consists of the resulting images after converting the color space and augmenting the data using oversampling. The second training dataset was the result of the color extraction from the first training dataset. Through double-transfer learning, the classification accuracy improved. In addition, puzzle-based data augmentation was applied to improve the classification accuracy.
Table 6 lists the classification accuracy of the network trained using the proposed method. The experimental results indicated that double-transfer learning was more effective than the results in
Table 5. Unlike
Table 5, the second training dataset of the proposed method is the resulting images of color extraction and puzzle-based data augmentation from the resulting images after converting the color space.
Table 7 presents the comparison of the average total classification accuracy of the experimental results for the training images. As mentioned previously, the abnormal classification accuracy of Experiment #2 was higher, and the model performed well. However, the classification accuracy of normal data was lower than that of the other methods, except when only the wavelet transform was applied. Therefore, the networks trained using the dataset generated by the wavelet transform and color space conversion did not perform well. This indicates that the classification accuracy gradually improved significantly and effectively. In conclusion, the proposed method is the most effective method for diagnosing the tool conditions of a CNC machine.
The variance of the classification accuracy was calculated using (
2) and is presented in
Table 7.
The variance of the classification accuracy of the network trained using a wavelet transform was 25.16. The variance of the classification accuracy of the network trained using the proposed method was 1.94. As the steps progressed, the variance decreased. This indicates that the performances of the trained networks remained similar.
Figure 8 shows a comparison of the classification accuracy with respect to the average value and the best performance. In this figure, WT indicates the wavelet transform, CC indicates color space conversion, O indicates oversampling, CE indicates color extraction, and DTL denotes double-transfer learning. The classification accuracy values of trained network using dataset generated by wavelet transform are 54.62% (average) and 60.24% (best). The classification accuracy values of the trained network using dataset generated by proposed method are 91.16% (average) and 92.77% (best). In other words, this figure shows that the more the proposed algorithms are combined, the higher is the classification accuracy. Therefore, the proposed method can improve the performance of anomaly detection model.
We compare the confusion matrices of the experimental results with respect to the best model shown in
Figure 9. The experimental results showed that the abnormal classification accuracy when only the wavelet transform was applied was 28.57%. Furthermore, the normal classification accuracy was 76.36%. This network can classify normal and abnormal data with low accuracy. However, after converting the color space from RGB to CIE L*a*b*, the classification accuracy improved significantly. Results revealed that color space conversion is effective for extracting features and training deep-learning networks. As the proposed method is approached, the classification accuracy gradually increases.
Table 8 lists the precision, recall, specificity, and F1-score of the best model trained using each method. The best model was the one with the highest classification accuracy for all data. If the highest classification accuracy of the total data was the same, the highest classification accuracy of the abnormal data was selected as the best model. The precision, recall, specificity, and F1-score were calculated using (
3).
As shown in the table, the precision and recall values of the proposed method were closer to one, compared to other methods. Therefore, the proposed method can overcome data deficiency and imbalance and improve classification accuracy.
The additional experiment was conducted about conventional methods. Scaling and rotation are common conventional methods for data augmentation. Furthermore, transfer learning was applied, the network is Inception V3 that is same with when verifying the proposed method. The classification accuracy values of the trained network using dataset generated by conventional methods are 62.65%, 65.06%, and 61.45%. The average classification accuracy is 63.05%. It is lower than that of the proposed method. Furthermore, the classification accuracy of abnormal data is 3.57% even though the classification accuracy of total data is 61.45%. It means that this method is difficult to overcome data deficiency and imbalance. Through the experimental results, our proposed method showed that they could overcome data deficiency and imbalance with higher classification accuracy.
5. Discussion and Conclusions
This study proposed anomaly detection method for a CNC machine tool to overcome data deficiency and imbalance and improve the performance of classification accuracy. Data deficiency and imbalance are critical problems in manufacturing fields because it is difficult to acquire the abnormal data. It is related to the performance of the anomaly detection model. Therefore, we focused on data augmentation and extracting effectively the features. To improve the effectiveness of the proposed method, the current data of the CNC machine was converted to image data, color space conversion was applied, and oversampling was performed. This overcomes data deficiency and imbalance, and effectively extracts features. In addition, color extraction, double-transfer learning, and puzzle-based data augmentation improve the performance of anomaly detection model and overcome data deficiencies and imbalances. Especially, puzzle-based data augmentation is effective method because it considers the pixel composition in an image.
Experiments were performed to compare the classification accuracy values of the networks trained using data generated through six methods, including the proposed method. The experimental results showed that color extraction, double-transfer learning with two training datasets, and puzzle-based data augmentation improved classification accuracy from 54.62% to 91.16%. Especially, the classification accuracy of abnormal data increased from 25.00% to 91.67%. It means that the proposed method can overcome data deficiency and imbalance and effectively extract features. In the future, we plan to develop a fault diagnosis and prognosis model for a CNC machine tool that considers other factors that are related to faults of a CNC machine tool. Furthermore, we will apply the proposed method to other datasets, such as medical images, with data deficiencies and imbalances.


 ,
, 


