1. Introduction
Although rolling bearings are the most widely used type of bearing, their application becomes more challenging with increasing machine or structure size. When large structures need to be moved or rotated, hydrostatic (HS) bearings offer numerous advantages. The HS lubricating film is created between sliding surfaces by an external hydraulic supply. It secures the complete separation of conformal surfaces, resulting in very low friction, almost no wear, very high precision [
1] without the appearance of a stick-slip effect, high stiffness, and vibration damping ability [
2,
3,
4]. A great advantage of HS bearings consists of the possibility of active control implementation [
5]. The use of fluid bearings could lead to higher energy efficiency compared to rolling or sliding bearings [
6], although HS lubrication requires a continuous external supply of pressurized lubricant. HS lubrication is a unique type of lubrication regime that is suitable for a wide range of applications—from millimetres up to tens of metres [
7]—for small ultra-precision machine tools [
8], through medium-sized machining centres, or even for moving large structures, such as giant telescopes, radio antennas, or large-scale machining centres [
9]. This type of bearing is frequently combined with hydrodynamic (HD) bearings to reduce wear in the start and stop phases [
10,
11]. In the case of such large scales, it is not possible to manufacture the slider and pad bodies in one piece because of manufacturing space, transportation, and assembly. The performance of the HS lubricating film is influenced by many factors, such as uneven loading, the elastic deformation of solid bodies, thermal effects [
12], manufacturing precision, and, primarily in the case of large-scale bearing, assembly precision.
Geometric errors negatively influence the lubricating layer of sliding bearings, whose performance decreases with the magnitude of surface irregularities [
13]. Two main types of geometric error that can be classified are manufacturing errors and assembly errors. This article focuses primarily on assembly errors. Misalignment causes serious problems leading to reduced bearing performance or even seizure [
14]. The misalignment of the HD bearing strongly influences the lubricating film. HS bearings are often combined with HD bearings to reduce wear during the start and stop phase [
15], compensate for misalignment, and are frequently mounted on the tilting support of the pad [
16]. The HS lubrication regime increases the thickness of the film and improves circulation and cooling [
17], thus improving its performance. This is one of the main reasons why HS lubrication is used as bearings on high-precision machines. However, HS bearings also have certain limits for geometric errors that could be compensated by the relatively thick lubricating film. The energetic demands needed to compensate for the geometric precision of the solid bodies surrounding the lubricating film [
18] increase with the magnitude of the error. Restrictors are often used to control flow distribution into the pads and recesses in case of single-pump multi-pad HS bearings. They also serve as a safety element that helps to align the surfaces using the pressure difference they generate. There are various types, from basic, such as orifice (see [
19,
20] or [
21]), to more sophisticated, including membranes [
22] or controllable elements, such as electromagnetic valves [
23,
24]. Previous research aimed to compensate for pad misalignment using compliant support numerically [
25,
26] and experimentally [
27], respectively.
Numerical modelling was used to investigate geometric errors. The model for the analysis of the motion error of closed guideways lubricated with the HS regime, based on the kinetic equilibrium of the table taking into account the effect of the squeeze film, was proposed by Wang et al. [
28], who found that with increasing speed, the error is more significant but can be compensated for with higher lubricant supply. Rajput and Sharma [
29] investigated different geometric imperfections of defined shapes and the misalignment of the HS-lubricated journal bearing using FEM formulation. All imperfections caused an observably lower minimal film thickness, whereas the minimal film thickness was twice as much lower in all cases with journal misalignment. As later observed by Zoupas et al. [
30] using CFD analysis, different types of manufacturing error (convex, concave, and sine wave) have similar effects on HD thrust bearings, as in the case of journal bearings. Fedorynenko et al. [
20] proposed a new design of adjustable HS bearing with improved precision [
31]. Zhang et al. [
32] presented a model based on formulations that describe the relationship between geometric errors and motion errors in bearings lubricated with the HS regime with experimental validation. Zha et al. [
33] later proposed a tolerance design method for HS guideways based on the error averaging effect, considering geometric parameters of guide rails with experimental validation.
The certain misalignment of multi-pad HS bearing can be compensated by the lubricating film itself [
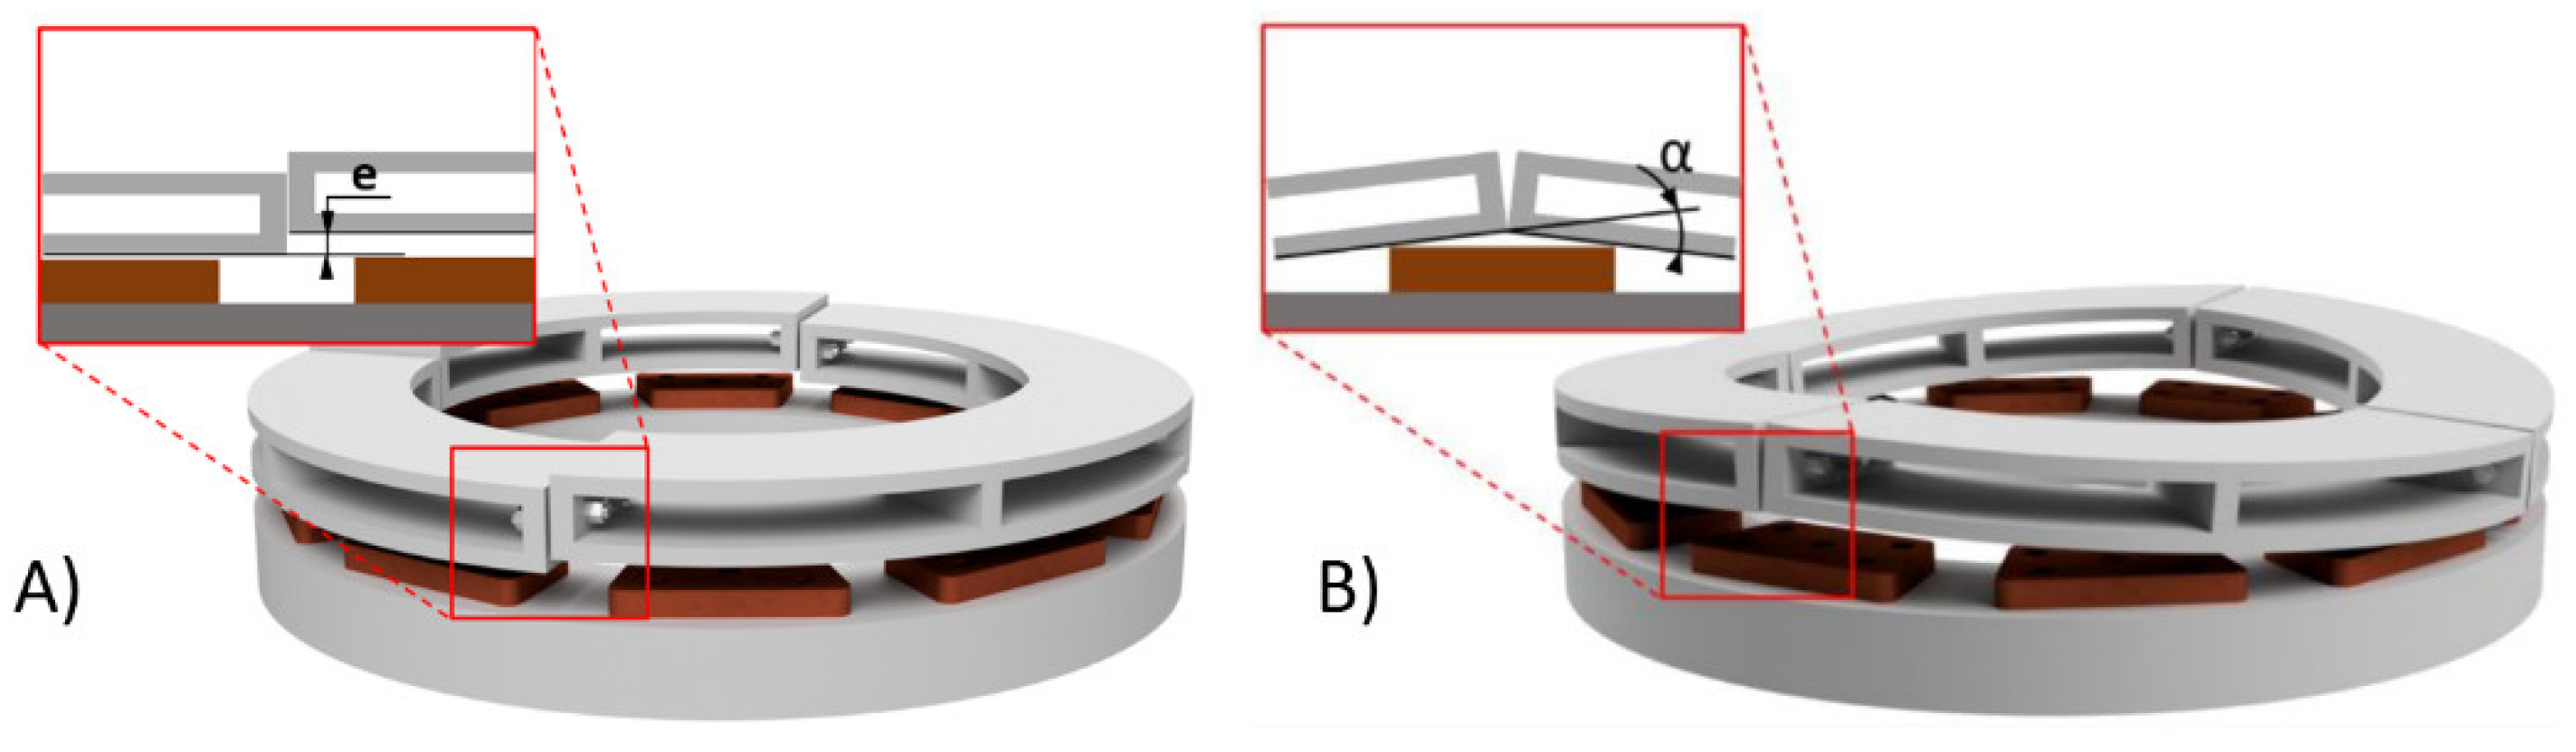
27]; nonetheless, if the slider is assembled from smaller segments and is not aligned properly, it might result in edge collision and thus bearing failure. Compared to pad misalignment, slider segment misalignment is far more serious. This article focuses on assembly errors of segmented sliders, in which we identified two primary cases (
Figure 1): offset (A) and tilt (B) of the neighbouring segments of the slider. Although a great deal of research work has focused on manufacturing errors in hydrostatic bearings and guideways, the following question remains unanswered: “What is the assembly error tolerance of a segmented hydrostatic bearing (guideway) slider?”. This study will try to provide answers to this question.
2. Materials and Methods
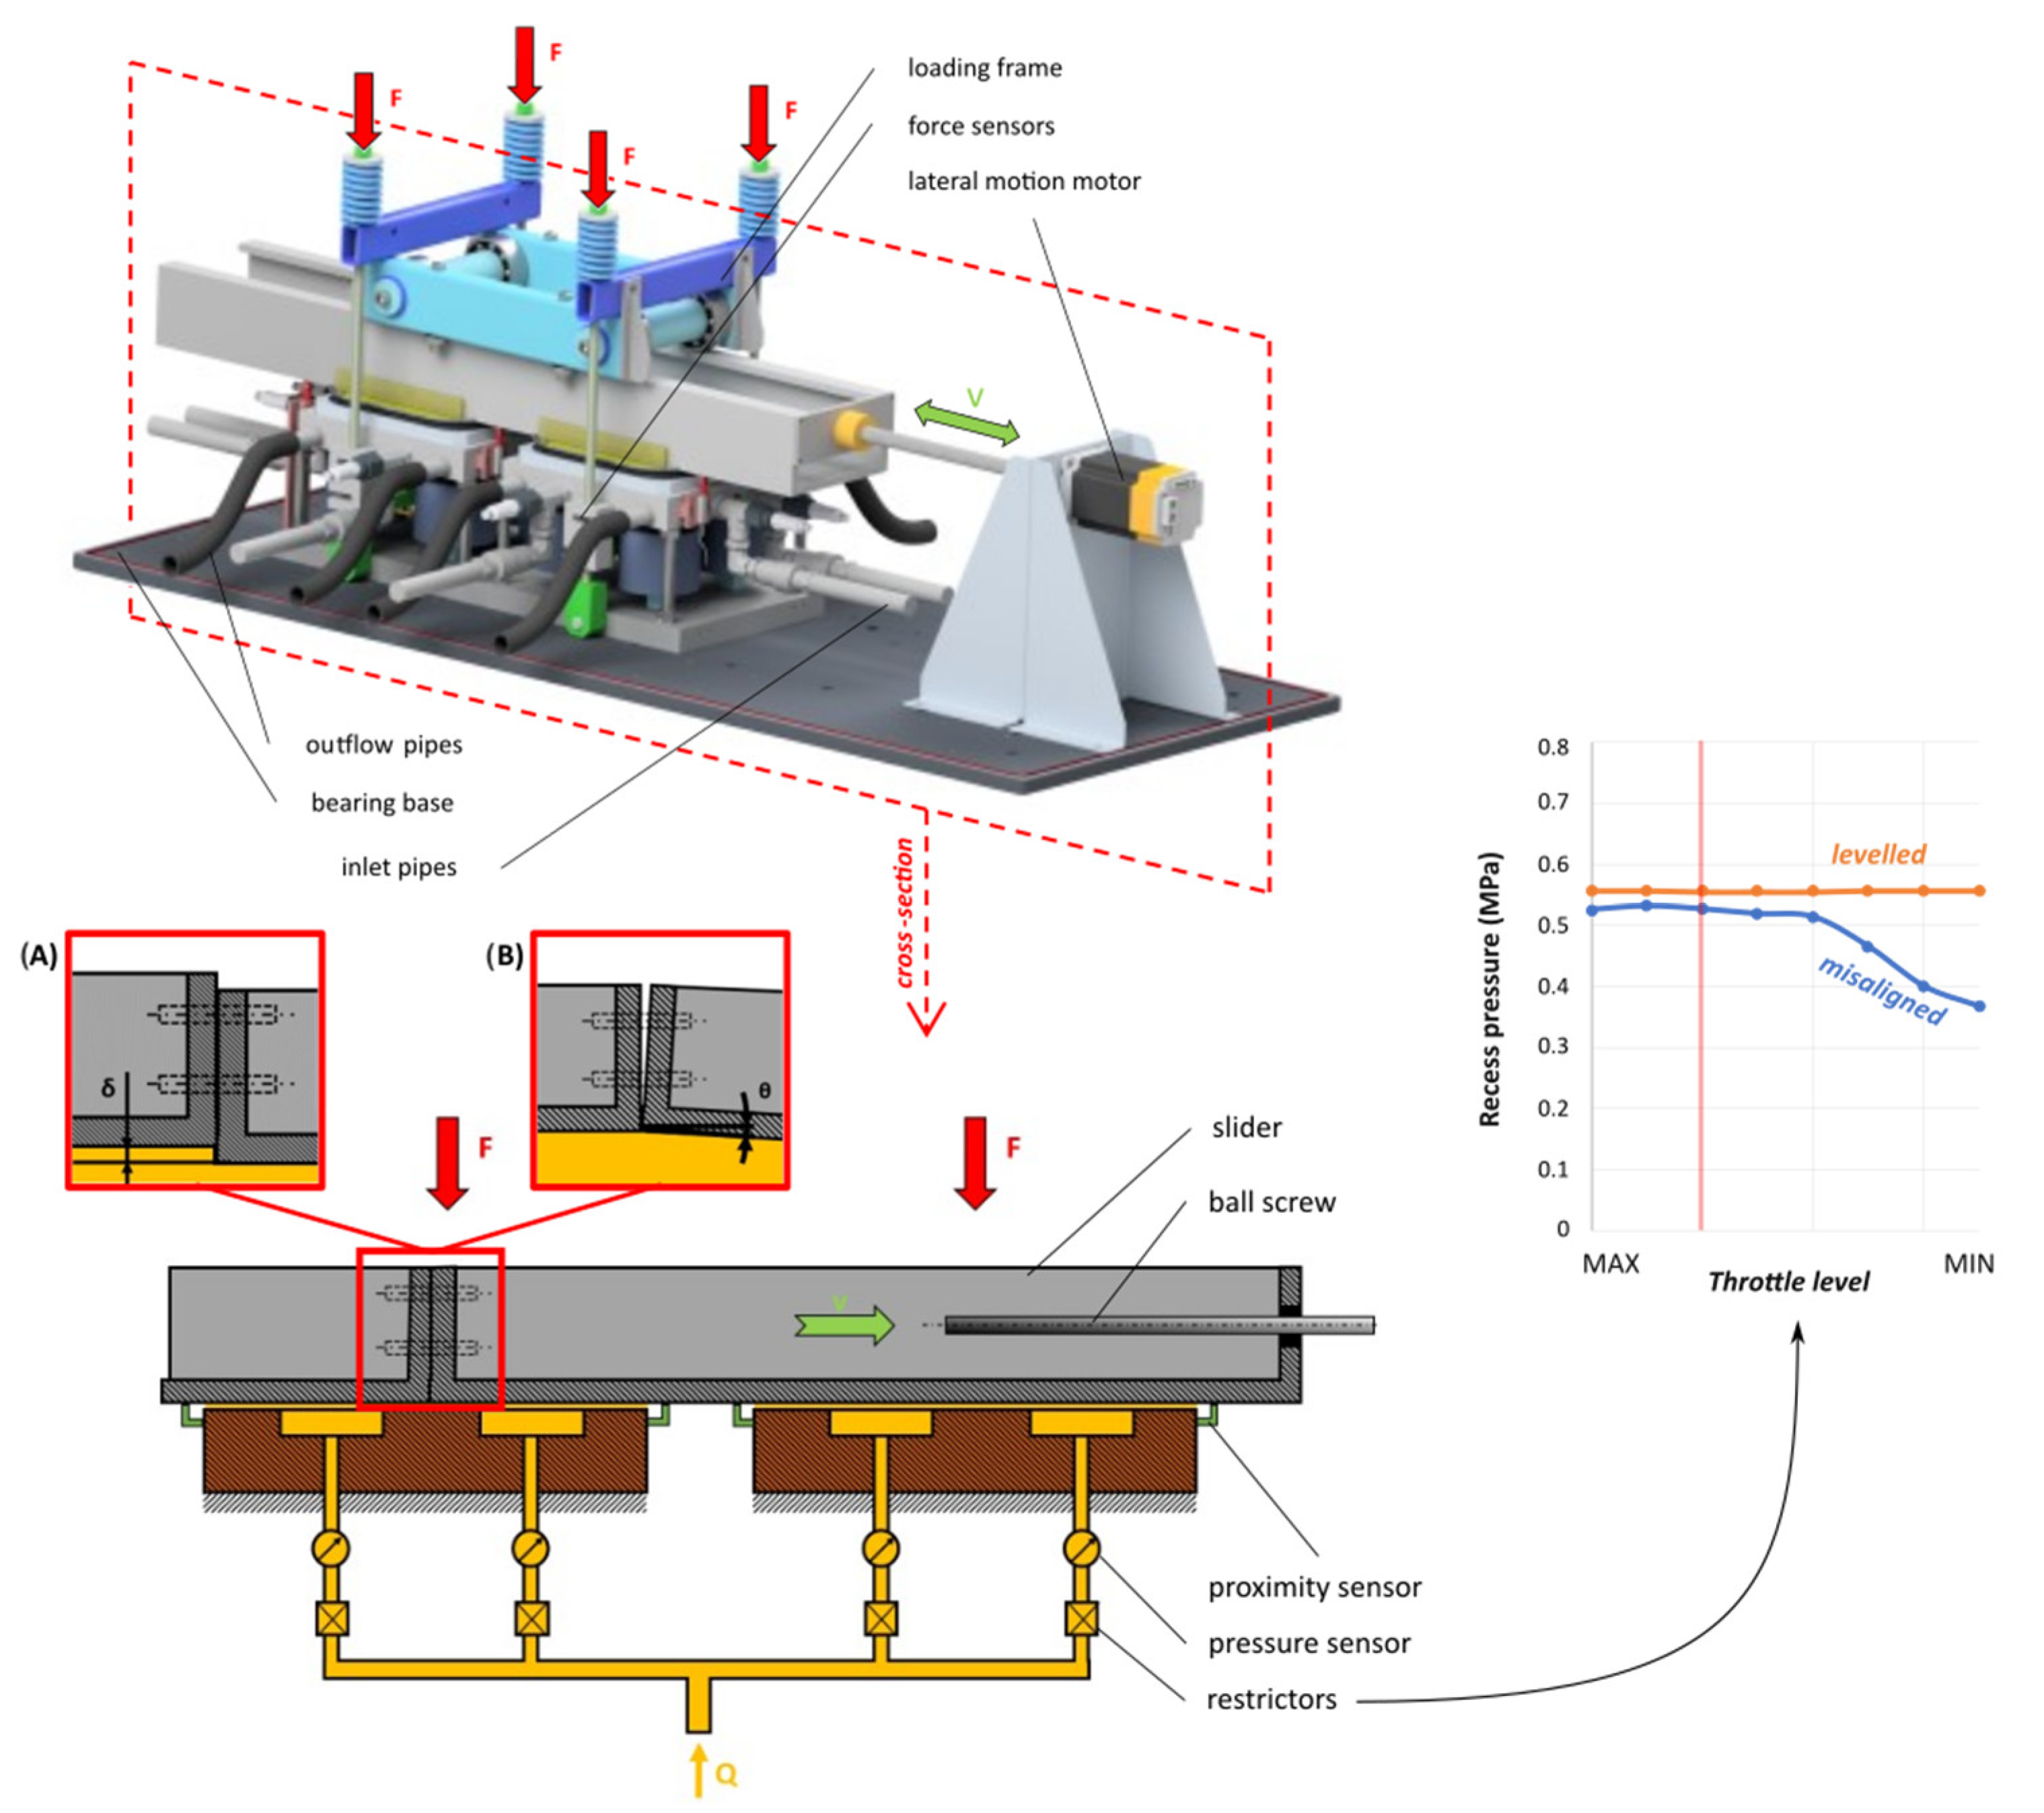
The dual pad experimental hydrostatic bearing (2PAD) was used for measuring the effect of assembly error on bearing performance. 2PAD (
Figure 2) consists of two pads with oil inlets and outlets mounted on supports. The load was generated using four threaded rods and springs for even loading. Force sensors with a range of 10 kN mounted on each of the threaded rods were used to obtain loading force. The loading frame transferred the load through four ball bearings onto the slider. The slider was divided into two parts, which are assembled using four bolts, to simulate assembly error cases. The motion of the slider was secured by a ball screw and an electromotor.
During all experiments, ISO VG 46 grade oil was used, with measured temperature-viscosity dependence (0.104 mPa·s at 23 °C). The selected oil type is normally used for hydraulic systems, while the specific grade was chosen according to the environmental condition—room temperature. The oil flowed from the hydraulic pump into the recess and through the oil film gap in between the slider and the pad land to the collector and then was returned to the tank. Excess oil was wiped using lip seal to prevent leakage and oil contamination outside the pad area. The oil temperature was obtained from the temperature sensor at the inlet of the bearing. The laboratory has its own air conditioning, and the tests were relatively short; therefore, the temperature was stable at 23 ± 0.5 °C during all experiments. A pressure sensor of precision ±0.056 MPa was mounted at each inlet to recess.
Since the 2PAD is a single-pump HS bearing, a restrictor (needle flow control valve) was mounted at each inlet into for recess to compensate the pressure differences in the recesses. The throttle level was the same for all valves and was determined in a misaligned pad case (
Figure 2). The approximate pressure difference generated at each of the restrictors was 0.1 MPa. If there were no restrictors, the multi-recess pad would act as a single recess, and the pressure would be the same in each of the recess. Supplied oil flow was measured using flowmeter of range 15 L/min and precision 0.1 L/min.
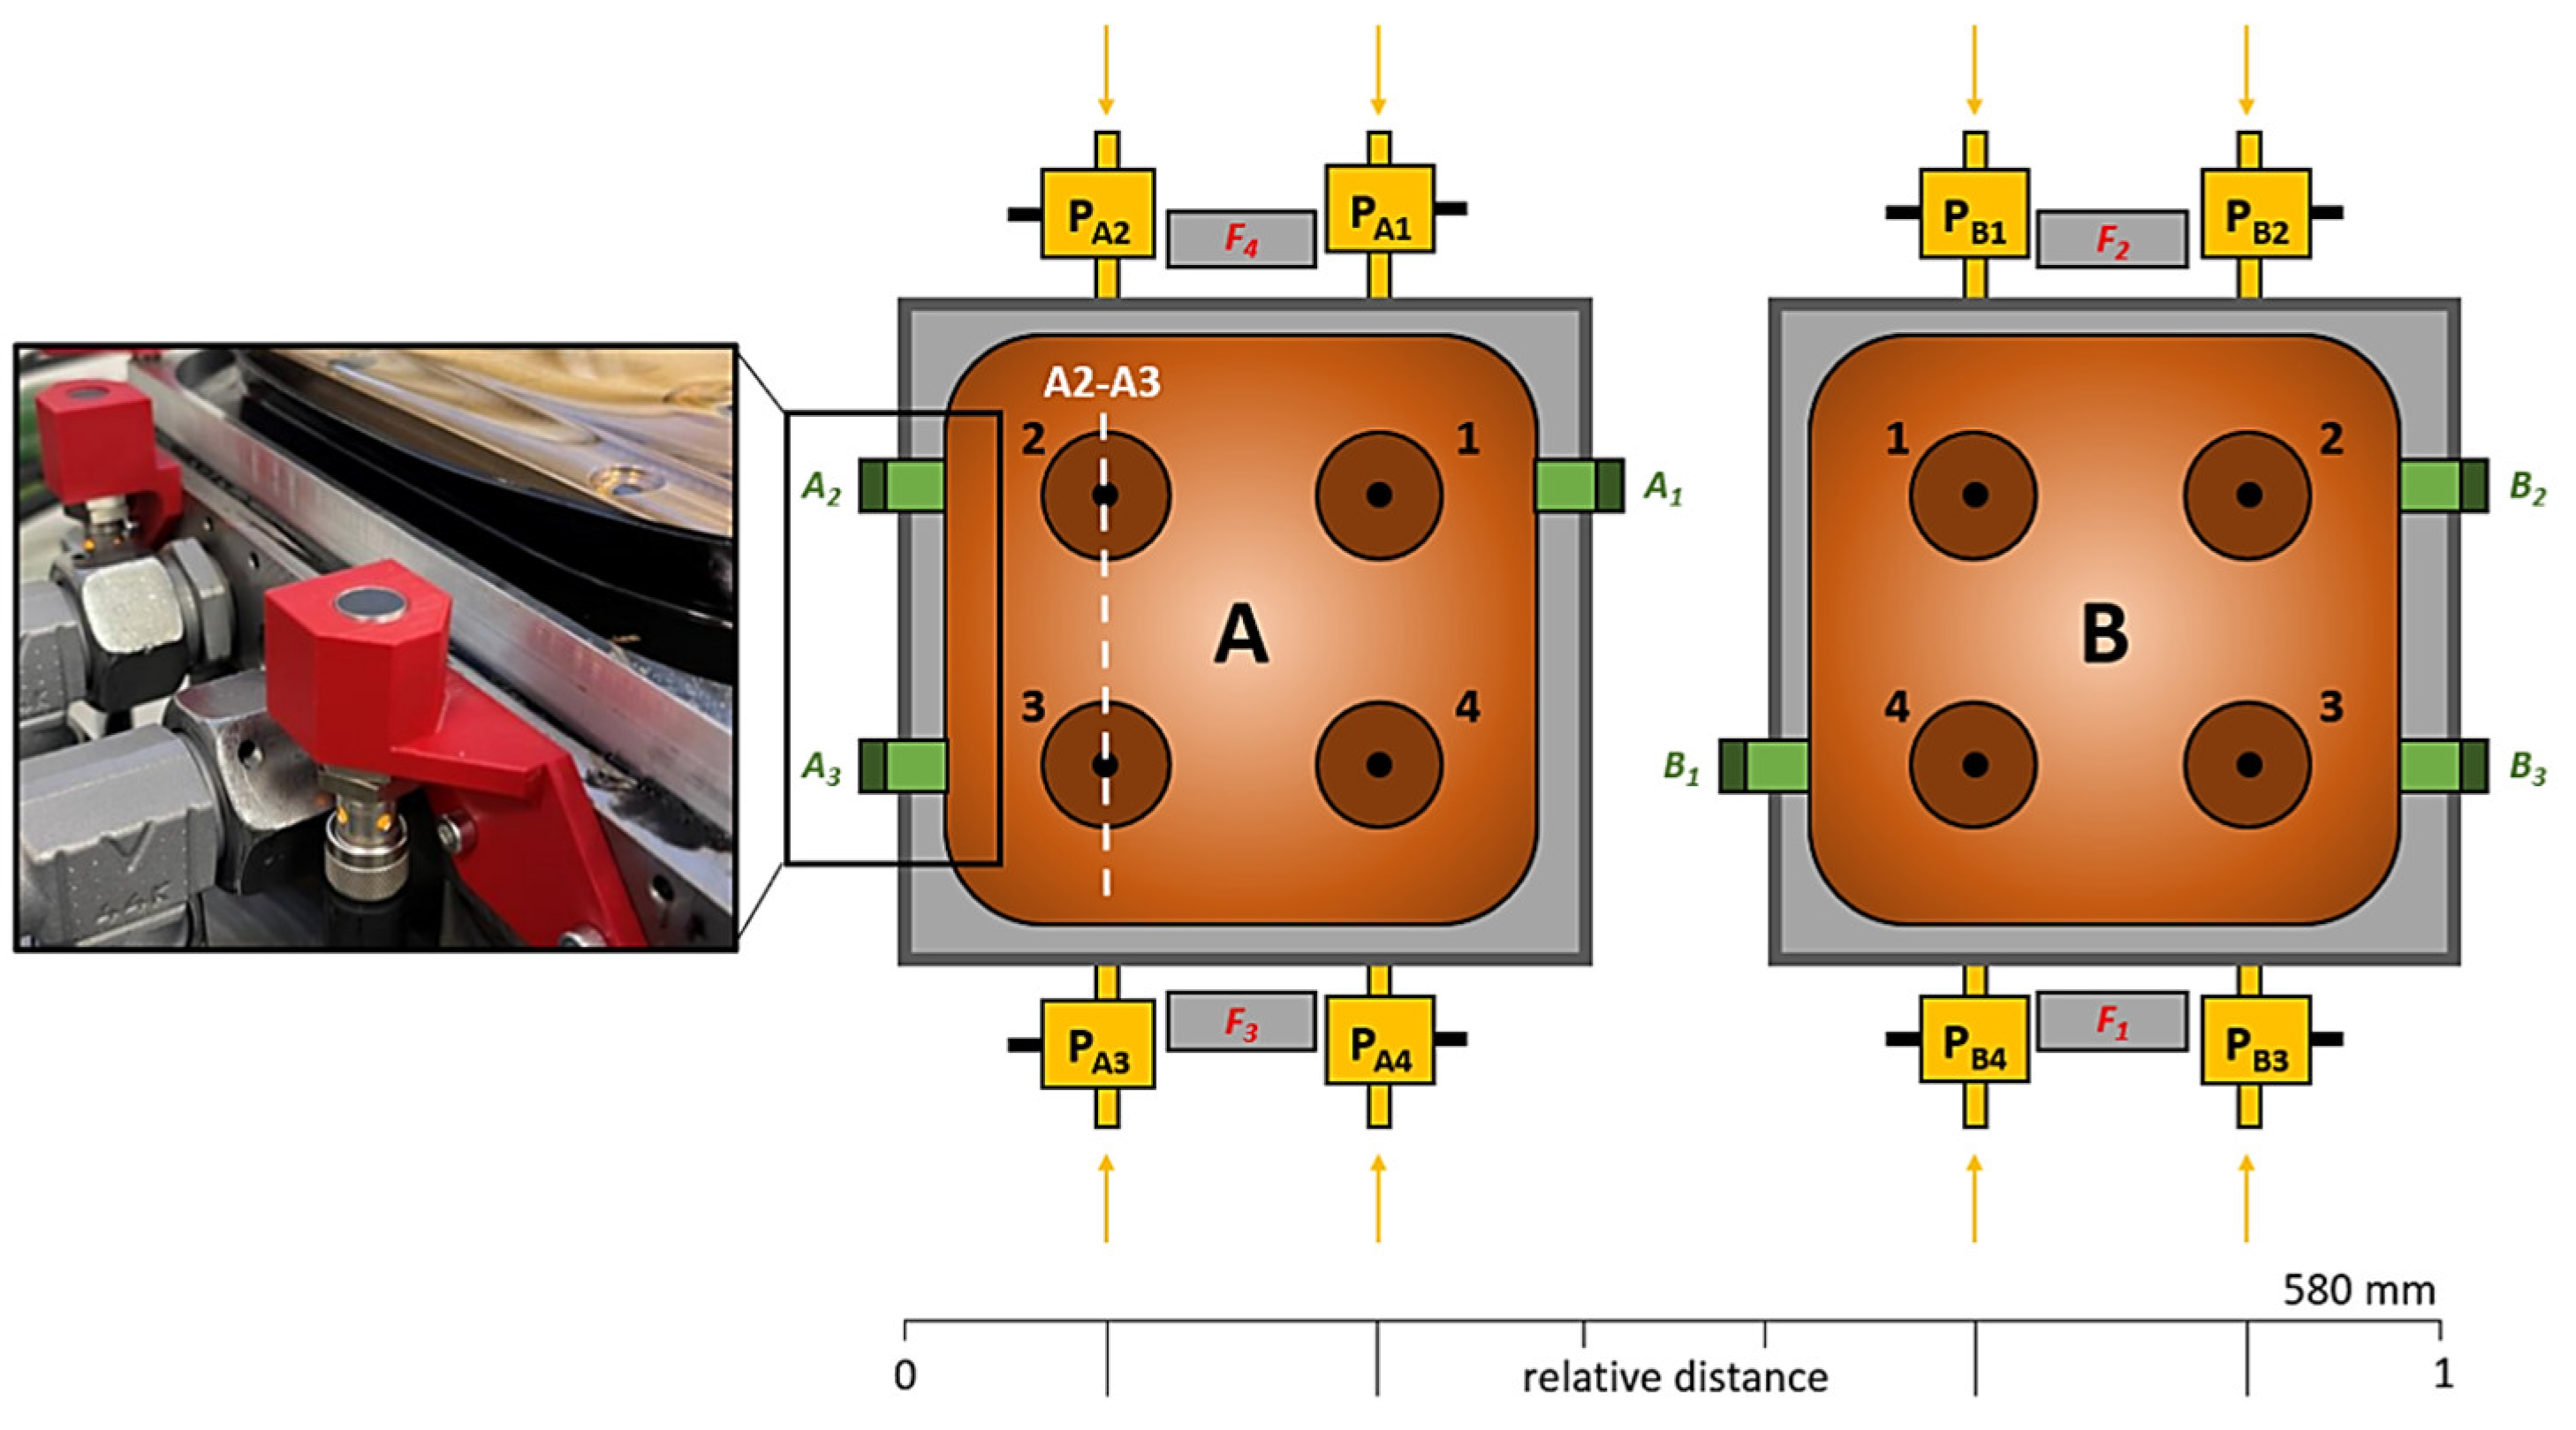
Six contactless proximity sensors with a precision of ±0.01 mm were mounted on the pads to obtain information about the film’s thickness. The sensor layout is shown in
Figure 3, with details on proximity sensors mounted on pad supports. The four recesses in each pad secured an even pressure distribution over the pad area, while providing information about the pressure in each of the corners of the pad. In this study, pressure information in each recess and film thickness from proximity sensors were used as primary performance evaluation parameters. Secondary parameters, such as the load and flow supplied, were held constant. Pads were levelled using straight slider with a flatness of 0.02 mm, calibration rods with a precision of ±0.001 mm, and combined information from pressure and proximity sensors to achieve distribution of film thickness and recess pressure values that are as similar as possible. The 2PAD central distance of pads to pad size (length) ratio in the presented configuration was 2.3. This ratio is given by the design of the test rig that is based on a large hydrostatic bearing. Nonetheless, it must be carefully considered in actual design with respecting structural deformations of the slider, applied load, and required precision or stiffness.
2.1. Static Tests
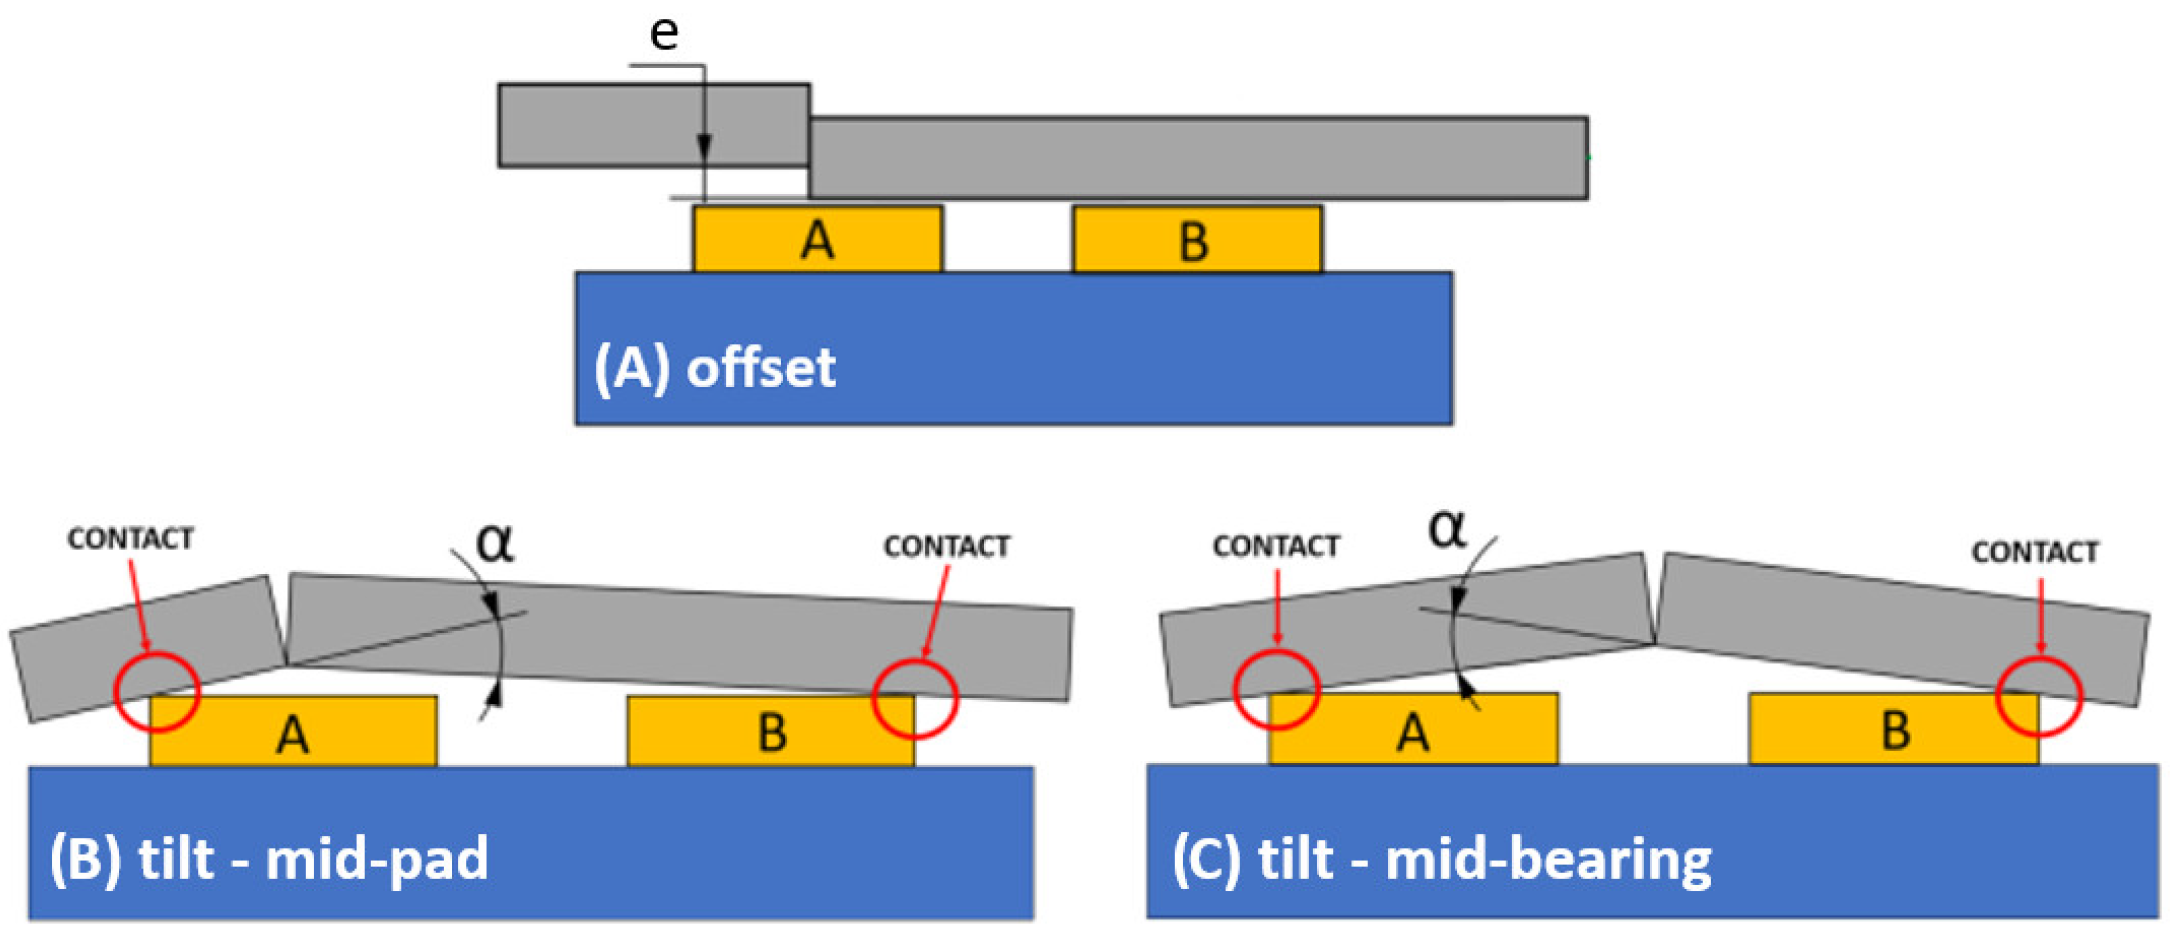
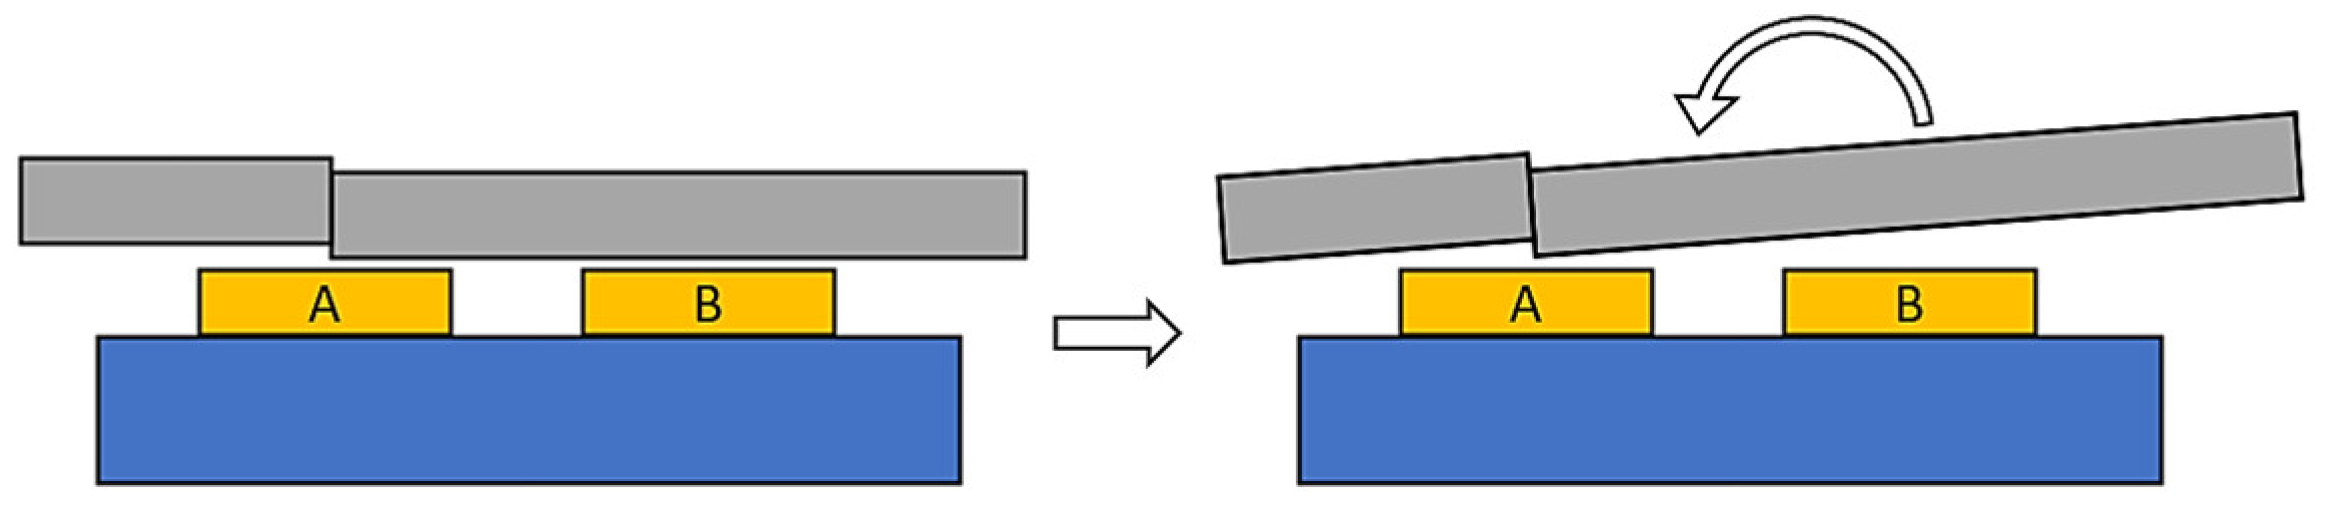
An evaluation of static performance was performed for three possible scenarios that might emerge during the assembly process. The error was generated on the surface plate using SKF calibrated shims that were underlaid under one side of the slider. The offset error (
Figure 4A) was assessed in the middle of pad A and in between the recesses. The tilt errors were investigated in two positions—in the middle of pad A (
Figure 4B) and between the two pads (
Figure 4C). Those two cases might occur when the slider connection is moving; thus, the two most critical scenarios were assessed.
2.2. Dynamic Tests
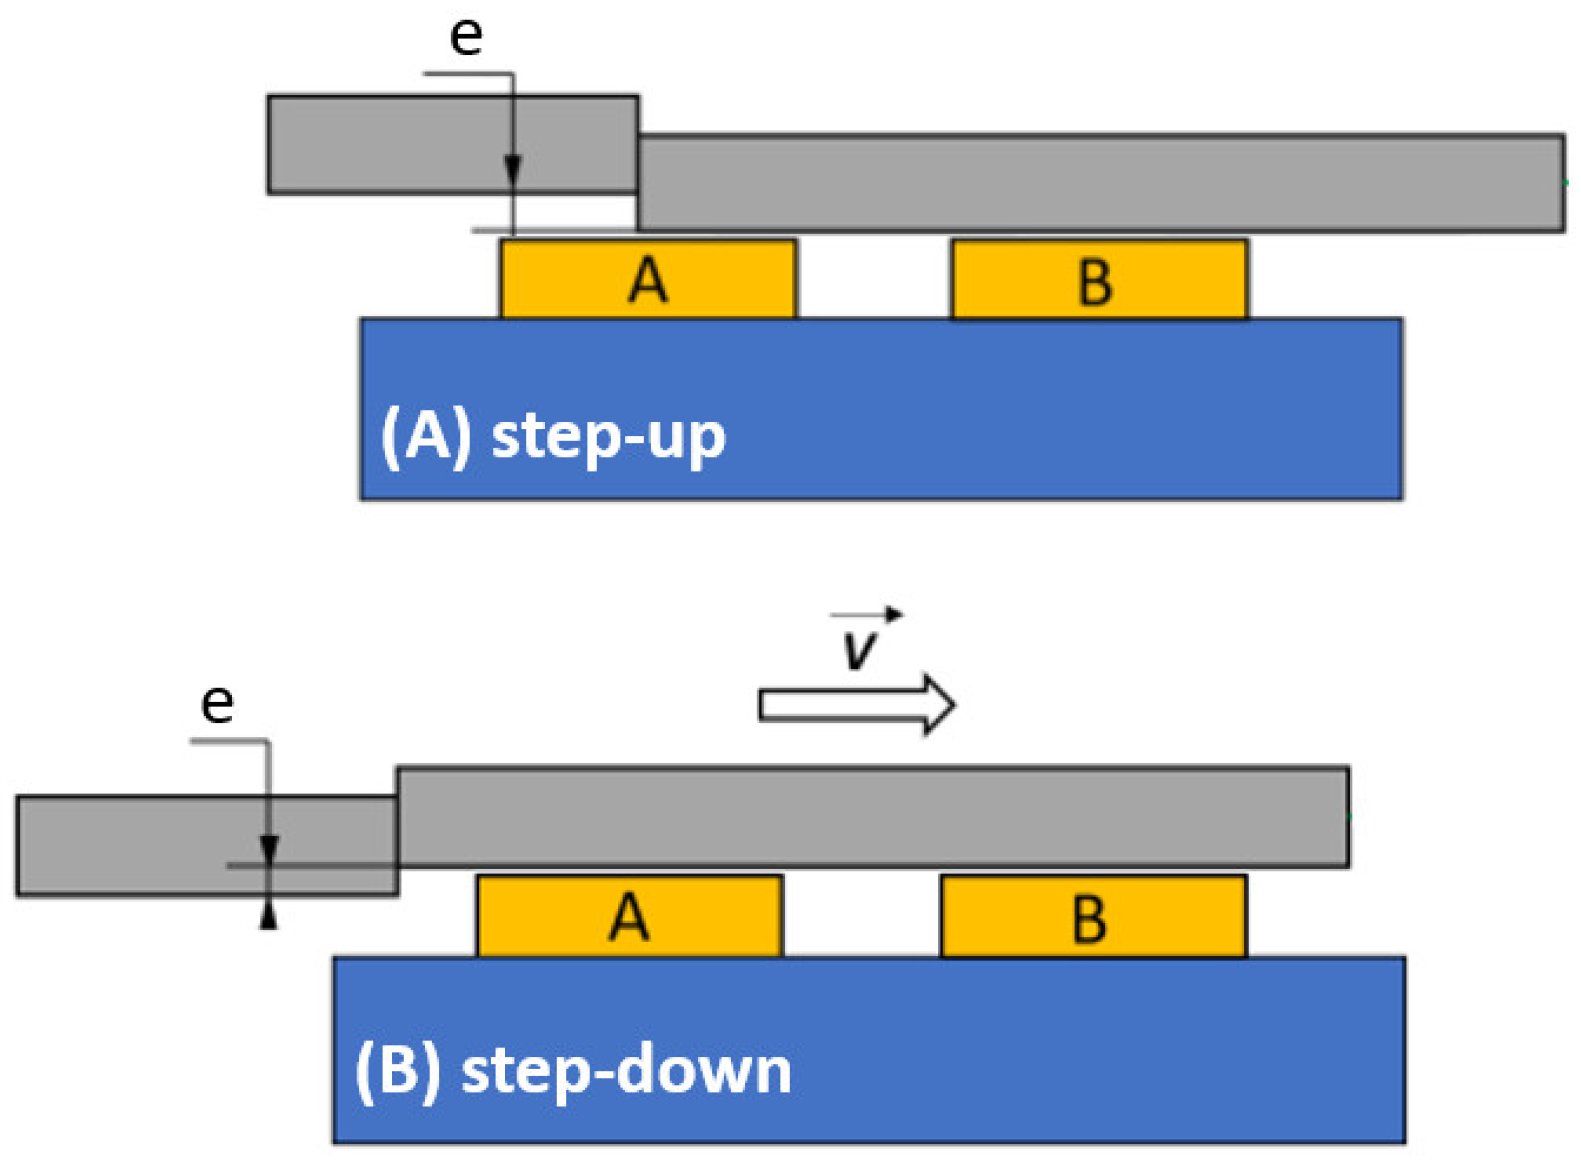
Dynamic tests were carried out only for offset errors. Two possible scenarios were identified: step-up (
Figure 5A), with the second part of the slider offset upwards relative to the other, and step-down (
Figure 5B), with the error created below the main slider. The latter is more dangerous since the collision of the slider and pad is inevitable for a certain error magnitude. This is the reason why the step-down dynamic experiment was conducted after all previous experiments were finished.
3. Results and Discussion
Experimentally obtained results are described for the cases of assembly errors investigated. First, the static performance characteristics for offset and tilt are presented and assessed. Then, the effect of assembly error on dynamic performance is discussed. The experimental conditions chosen for the tests reflected service conditions of a hydrostatic turntable but on a smaller scale. The film thickness for the case without an assembly error was 0.13 mm with a total flow supplied to both pads of 4.3 L/min. The predicted value of film thickness for the geometry used and experimental conditions based on Rippel [
34] was 0.14 mm. This value was used to validate the experimental setup and conditions. For all experiments, an evenly distributed constant 20 kN total load was applied. The load varied within 2% during experiments, thus was assumed as constant. The precision of the pressure sensor was considered in the performance evaluation and is highlighted in all graphs. We have set an additional 5% pressure difference that represents the critical pressure range. Within this range, the bearing can still perform normal functions, but it is necessary to proceed with caution. It can be also seen in
Figure 6 that the pressure varied within this range. Especially in large HS bearings, the pressures might fluctuate due to manufacturing and assembly errors of higher magnitude. However, this could compromise the bearing precision and should be reflected in bearing performance requirements. The difference in the recess pressure can be caused by lubricant temperature change, variable load, change in the supplied flow, or misalignment. The other effects were held constant throughout all measurements. Only the misalignment of the slider bodies, representing the assembly error, was varied.
3.1. Static Performance
The static performance of the assembly error was measured for both cases—the offset and tilt of the slider segments. To ensure the validity of the experimentally obtained data, all static measurements were repeated three times. Between each measurement, the bearing was turned off and back on. The loading frame and slider had to be disassembled with each error case. The repeatability of the static tests was within 2% error for pressure, 1% for film thickness, and 1% for load.
3.1.1. Offset of the Slider Bodies
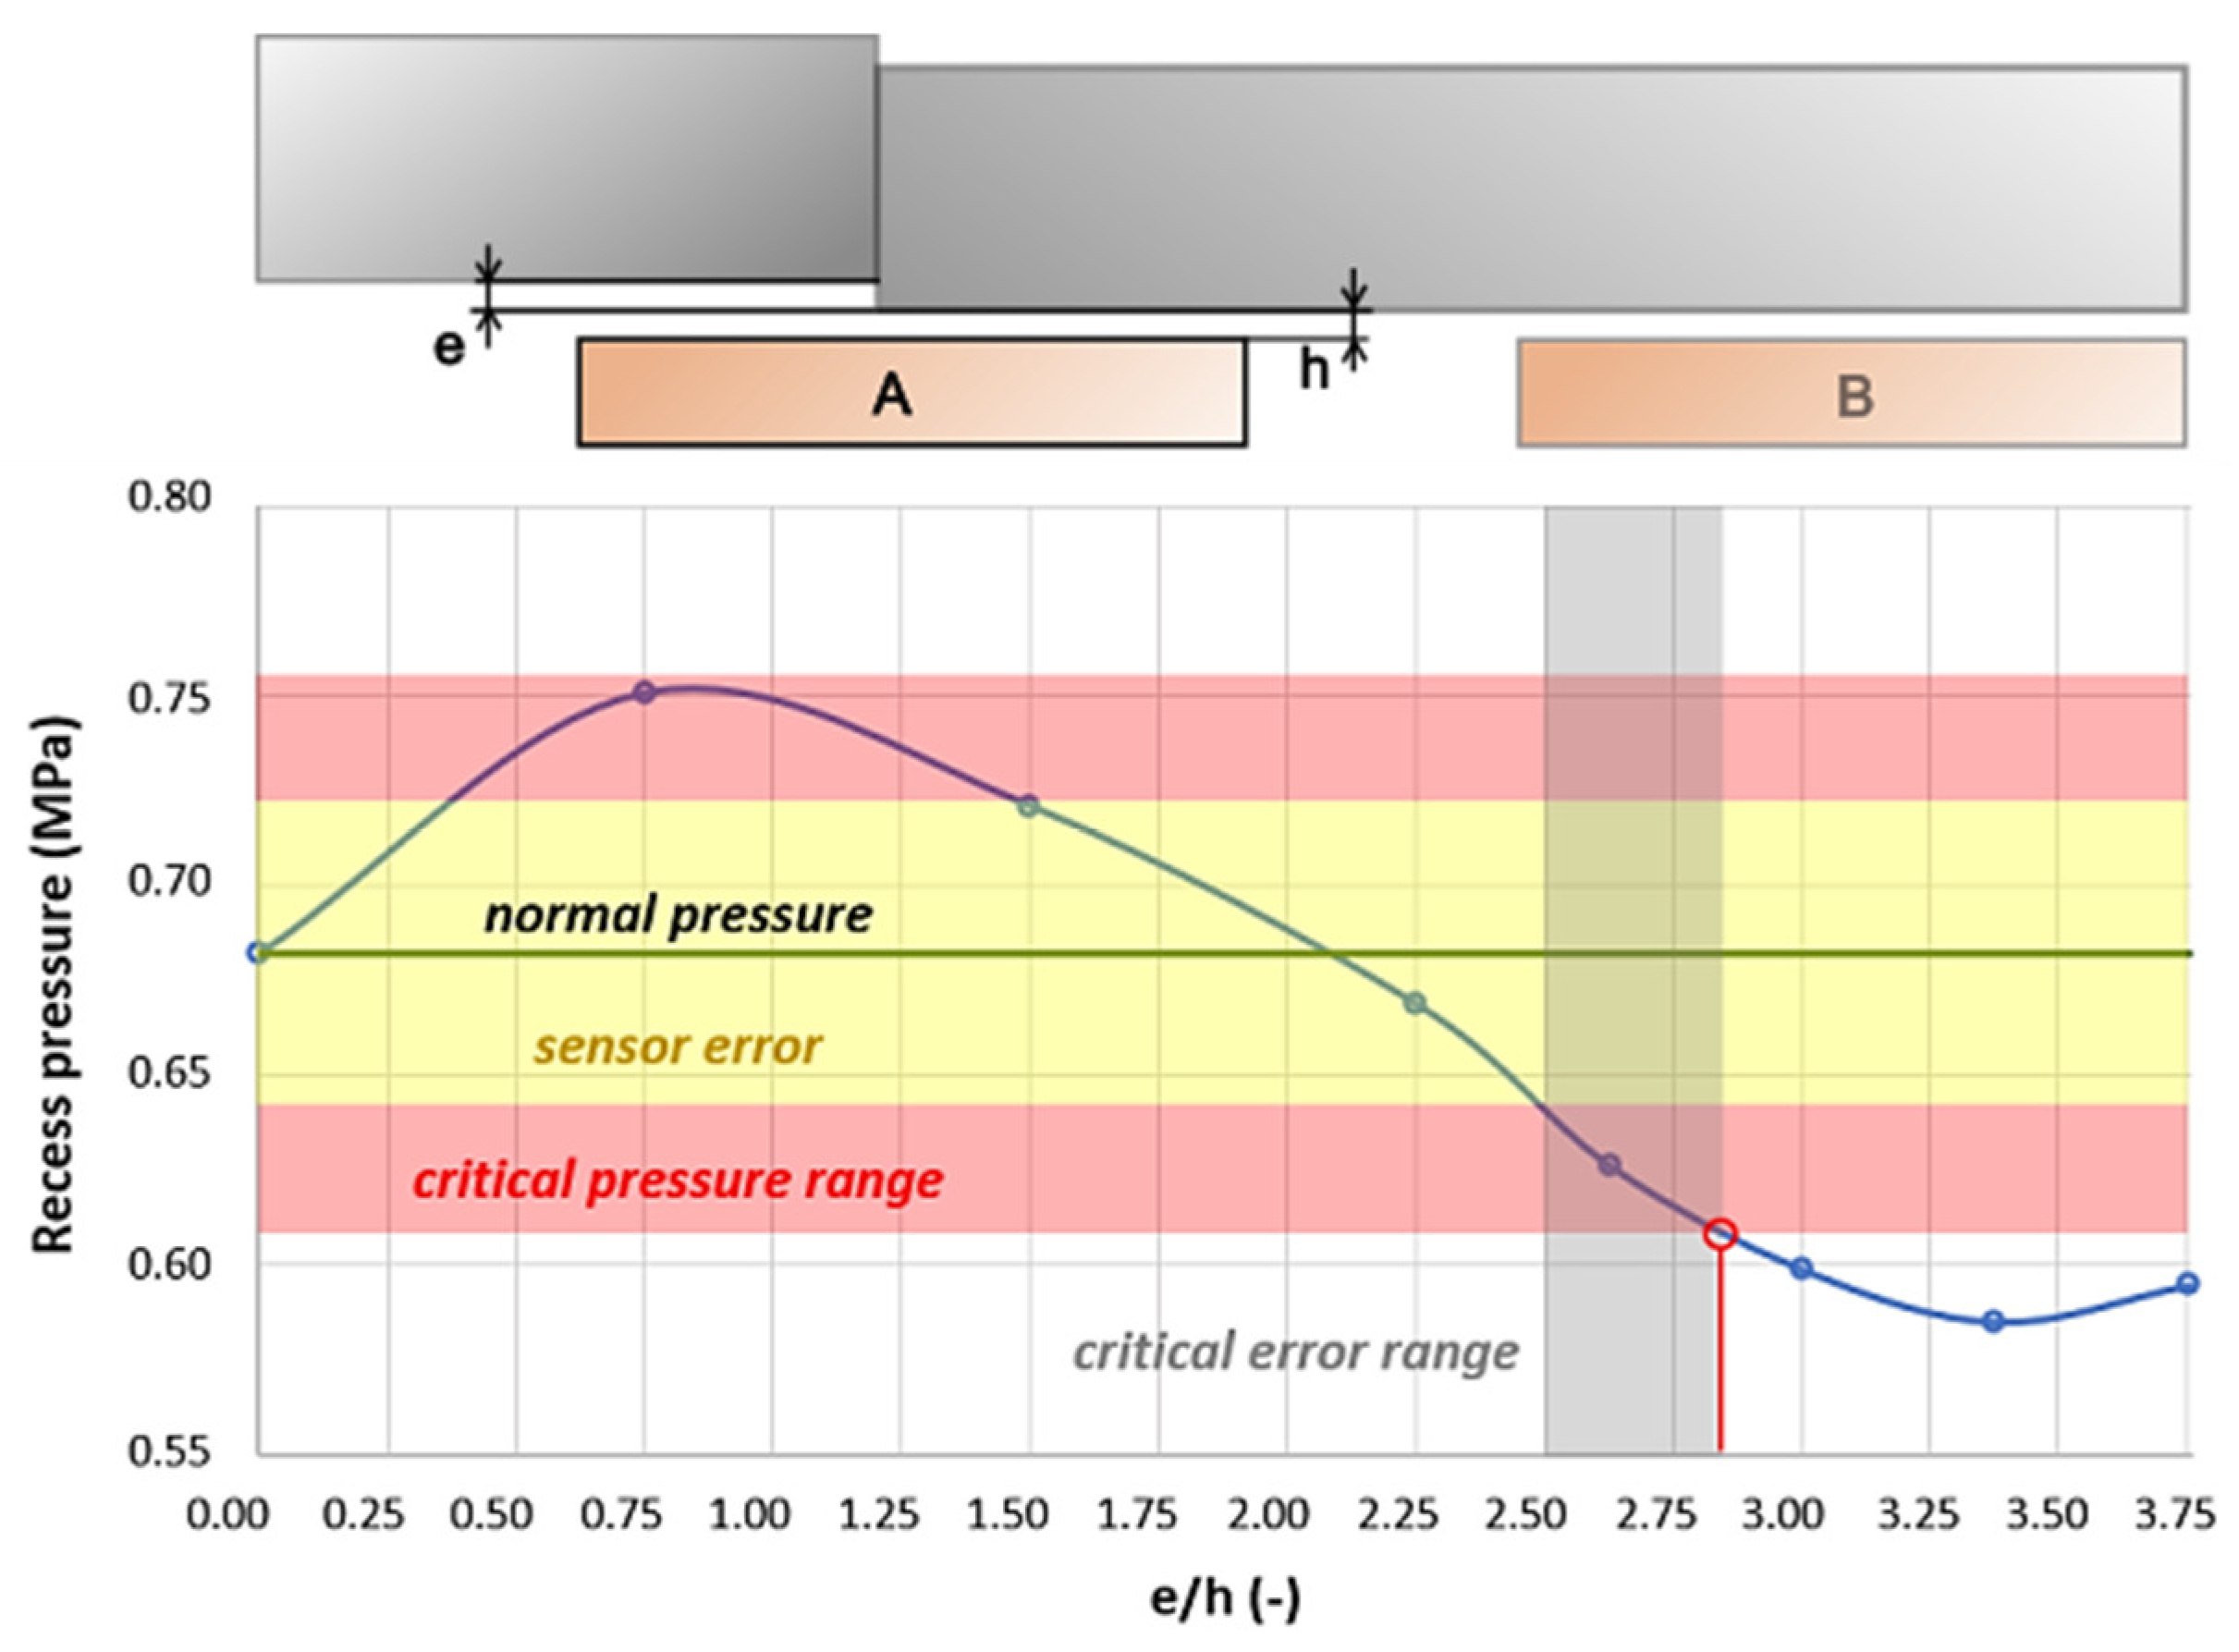
The offset assembly error type was assessed only for the “step-up” configuration. The judging criteria were the average pressure of the pad A, pressure in recess A2 and A3, film thickness obtained from proximity sensor A1, and the initial film thickness of 0.13 mm at e/h = 0. The normal pressure for the supplied flow and load was 0.68 MPa. The dependence of the average pressure in pad A on the error magnitude to the film thickness ratio is drawn in
Figure 6. An increase in the mean pressure was observed in pad A within the error ratio range e/h = 0–0.75. The overall average recess pressure rose by 0.03 MPa for this ratio, indicating that the slider might become slightly inclined due to the geometry change generated by the error. However, in the range of e/h = 0–2.25, the average pressure in pad A remained within the range of sensor error. The range of e/h = 2.5–2.8 was considered a critical error range because the average recess pressure in pad A fell into the critical pressure range, which was below the sensor error range. In this range, a contact between the solid bodies might occur since the load might not be carried only by the lubricating film. Therefore, the ratio e/h = 2.5 is considered as the limiting value in which the bearings can operate normally under static conditions. Regarding the ratio of e/h = 3 and higher, the contact of solid bodies was confirmed by the inability of the slider to move anymore.
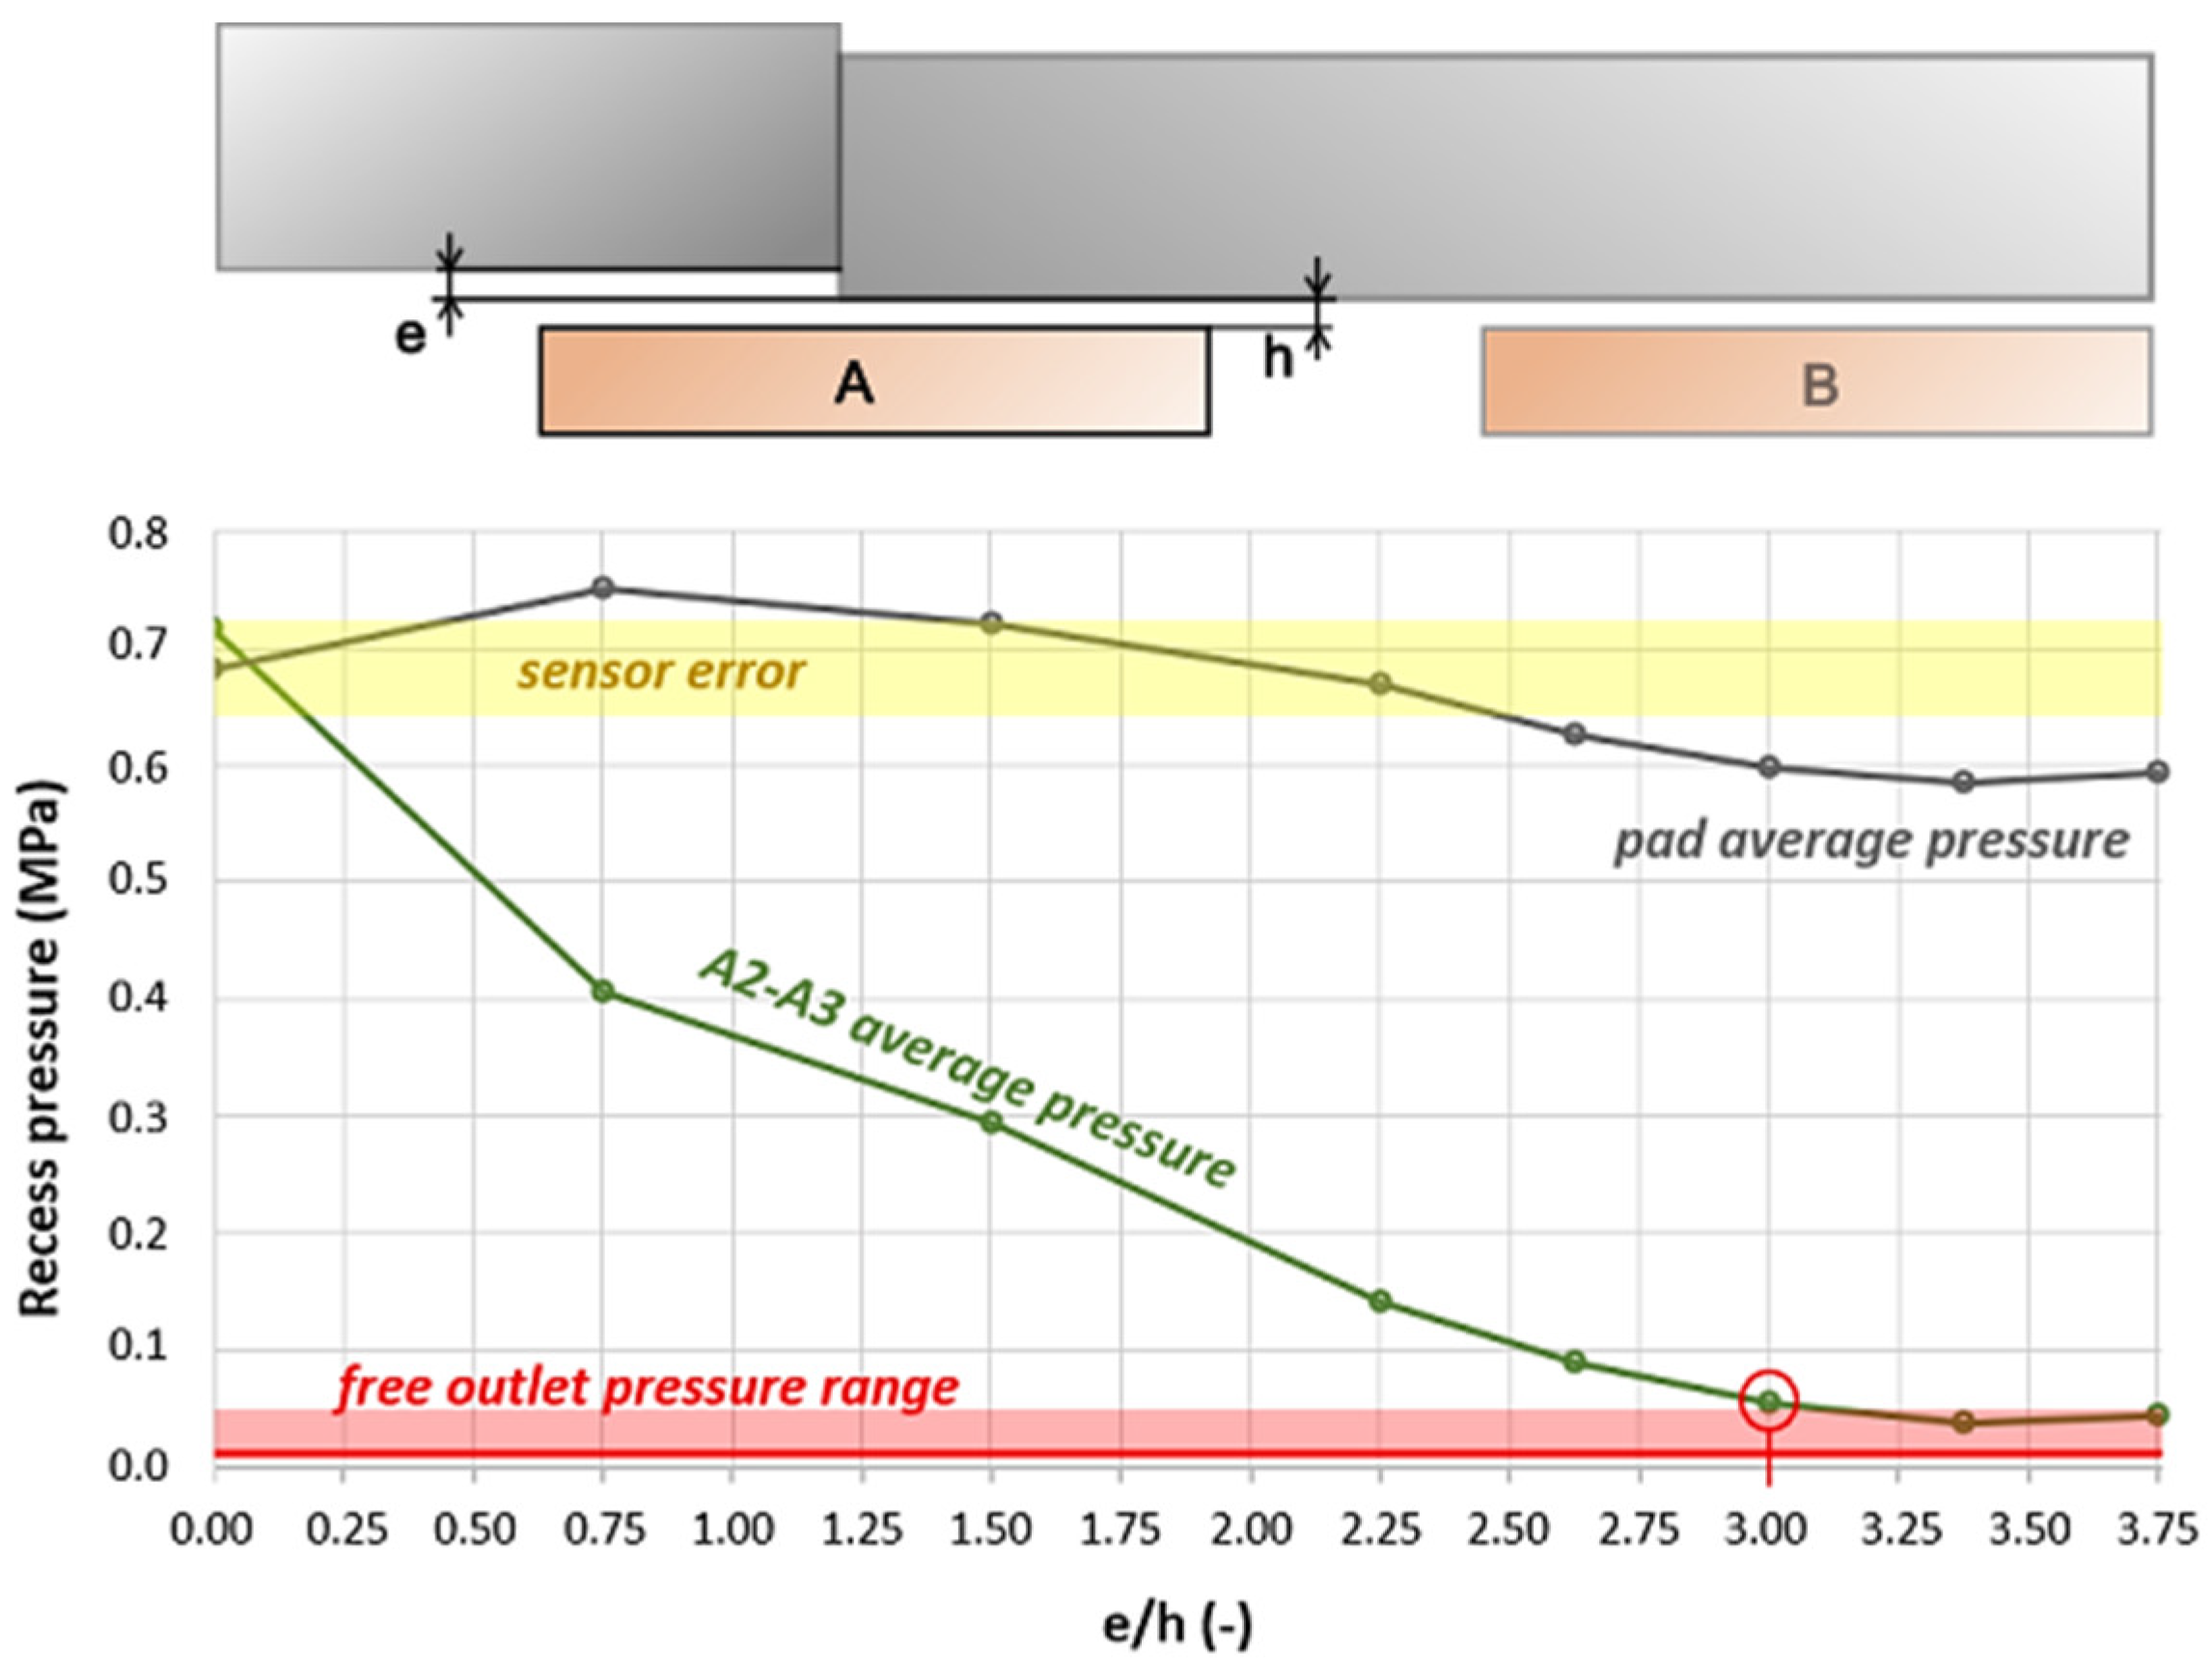
As seen in
Figure 7, the pressure decrease as the magnitude of the ratio increases. For the ratio e/h = 3, when a contact of solid bodies was confirmed, the average pressure in recesses pA2 and pA3 fell into the range of free outlet pressure. This means that those recesses did not carry load anymore, and that the remaining recesses could not sustain such load alone.
As observed from proximity sensors, the inclination of the slider, as shown in
Figure 8 was more significant as the error magnitude increased. A film thickness of 0.06 mm was measured at proximity sensor A1 at the highest offset error magnitude. From
Figure 3, it can be seen that the proximity sensor is not at the level of the edge of the pad, and therefore, a film thickness of 0.06 mm could already mean zero film thickness at the edge due to the slider inclination effect. Thus, during the offset static tests, the film thickness was considered as secondary criteria, and the main performance assessment criteria was the recess pressure in pad A.
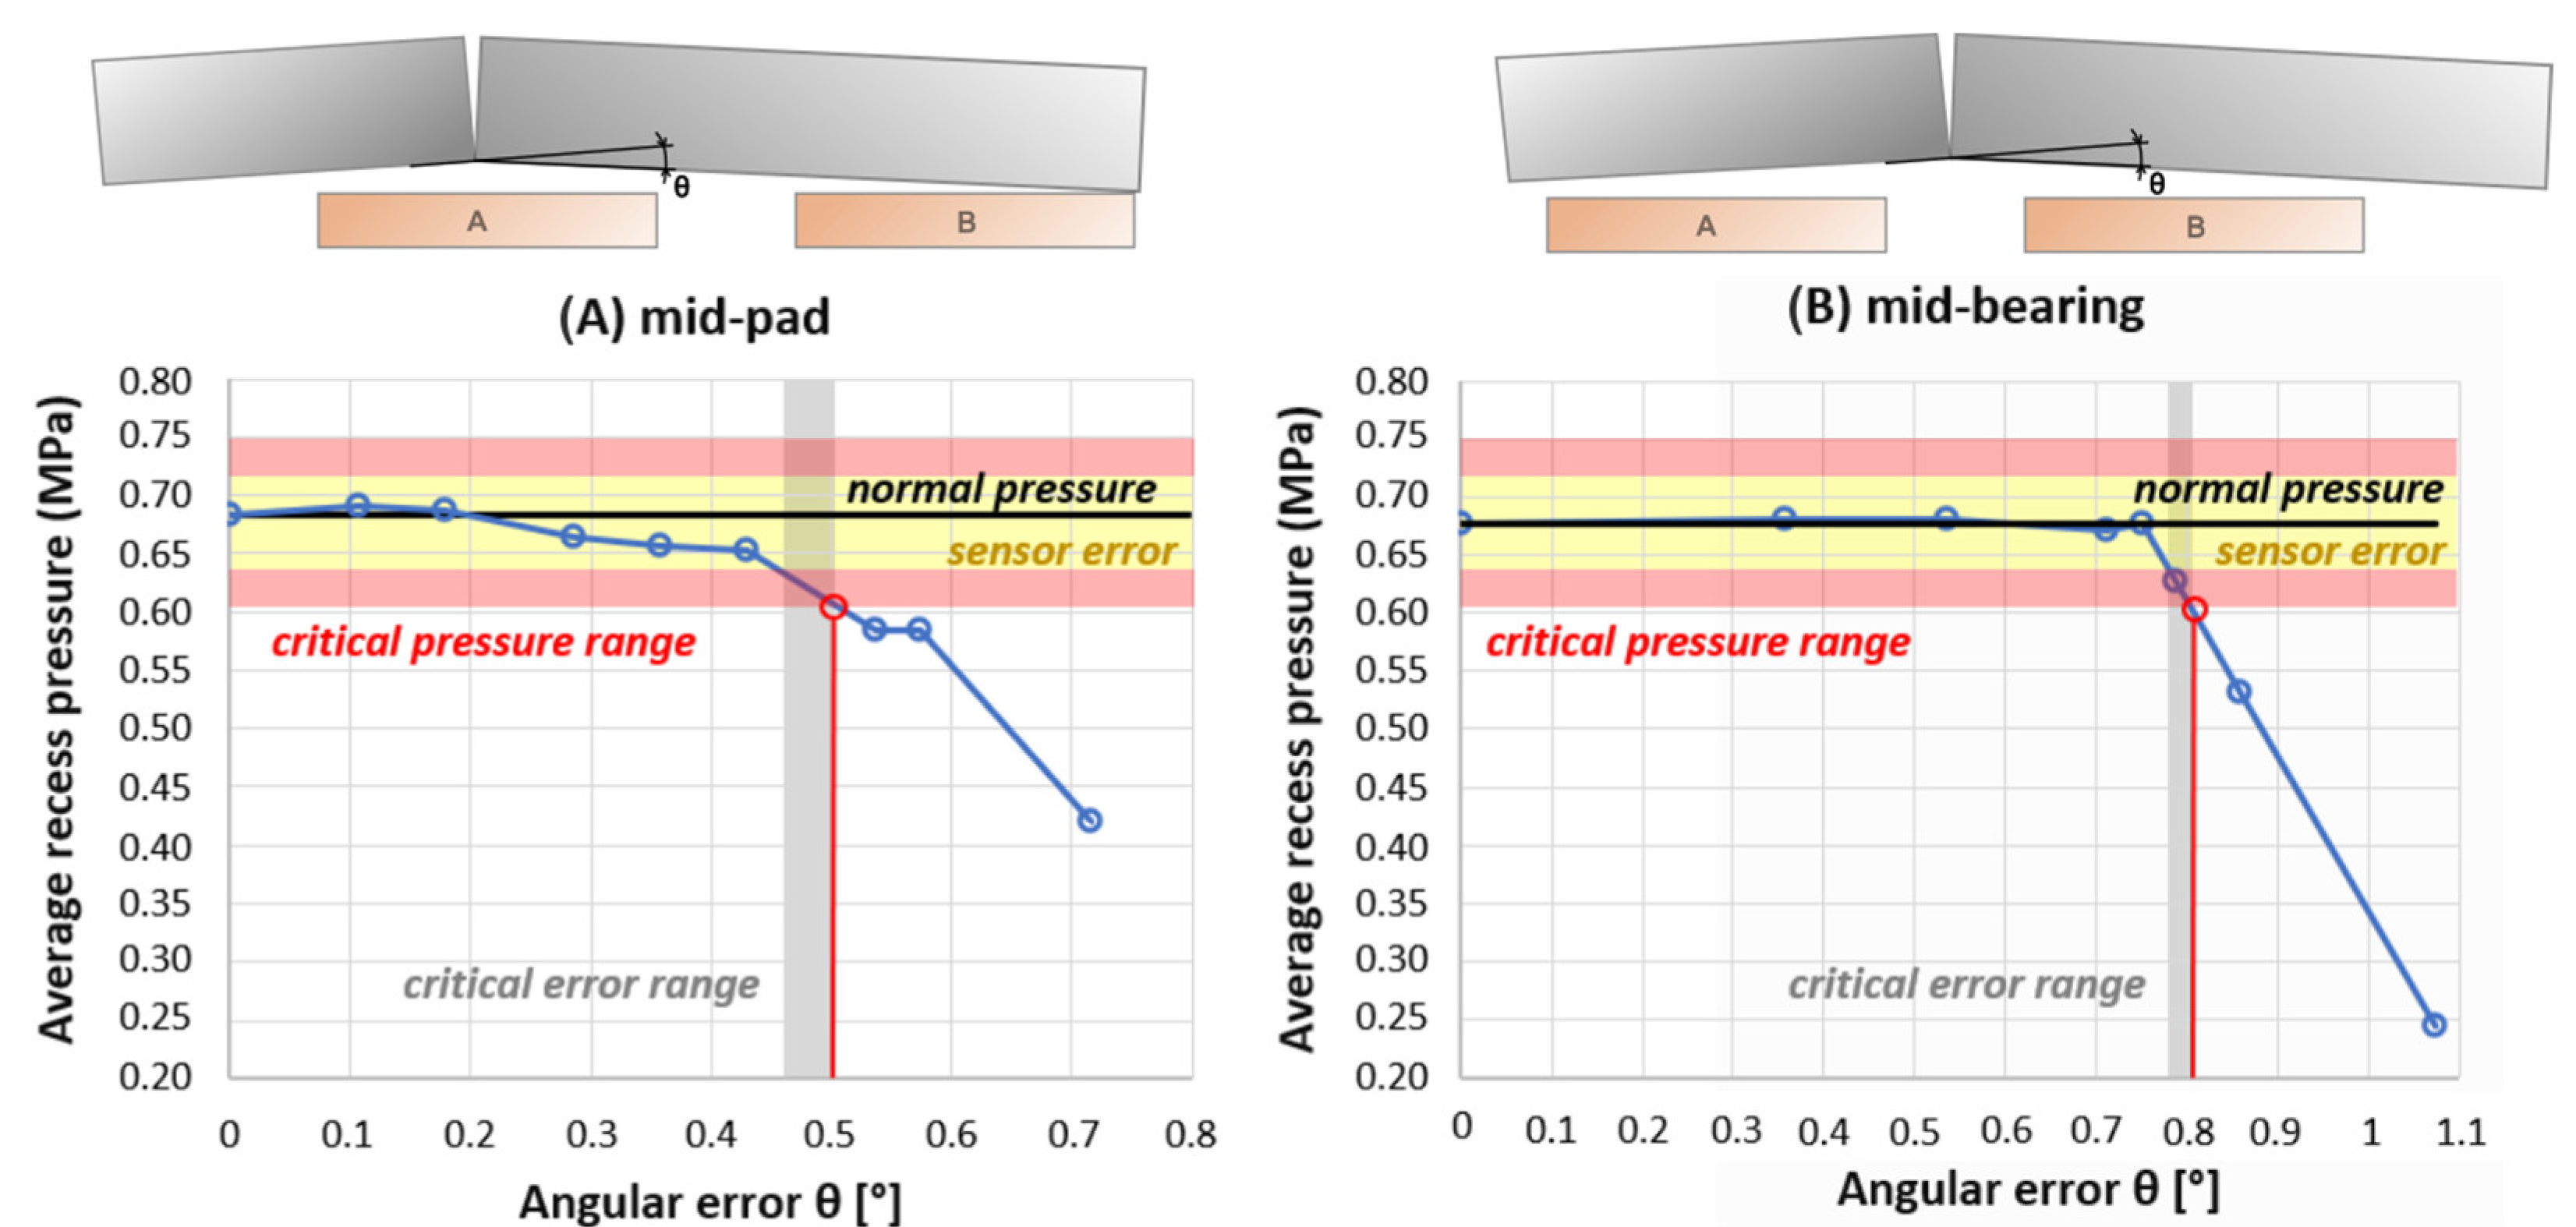
3.1.2. Tilt
The tilt assembly error type was assessed for two positions—“mid-pad” (
Figure 9A) and “mid-bearing” (
Figure 9B) configurations. The judging criteria were the average pressure of both pads, pressure in all recesses, film thickness obtained from proximity sensors, and an initial film thickness of 0.13 mm at θ = 0°. The normal pressure for the supplied flow and load was again 0.68 MPa. The bearing performed normal operation within the angular error of θ = 0–0.4°. In the case of the “mid-pad”, the average recess pressure slowly decreased, starting at θ = 0.2° until θ = 0.42°. The range of θ = 0.46–0.5° was considered as the critical error range for the “mid-pad” error type. The limiting value that would allow the bearing to be functional was 0.5°. Regarding the “mid-bearing” error type, the average recess pressure was relatively stable until the tilt angular error reached a value of θ = 0.75°. Any further added error caused the average recess pressure to rapidly decrease. Due to the rapid decrease in the average recess pressure with increased error value, the critical error range is relatively small, within θ = 0.78–0.8°. Any error greater than θ = 0.8° would mean a loss of the load-carrying ability. However, a relative movement of the pad and slider bodies is required for proper bearing function. Therefore, the angular error of θ = 0.46° is considered the limit value for which the bearings can operate normally under static conditions in the two investigated positions. Considering that the slider will move during operation, the “mid-pad” error type allows for a smaller error tolerance. The highest value of θ is 0.5°. Any higher error would lead to a contact of solid bodies for the tilt error type. The pads were positioned at ratio of pad centre distance to pad edge length of 2.3. Nonetheless, if the distance of the pads were greater, the angular tolerance would decrease.
3.2. Dynamic Performance
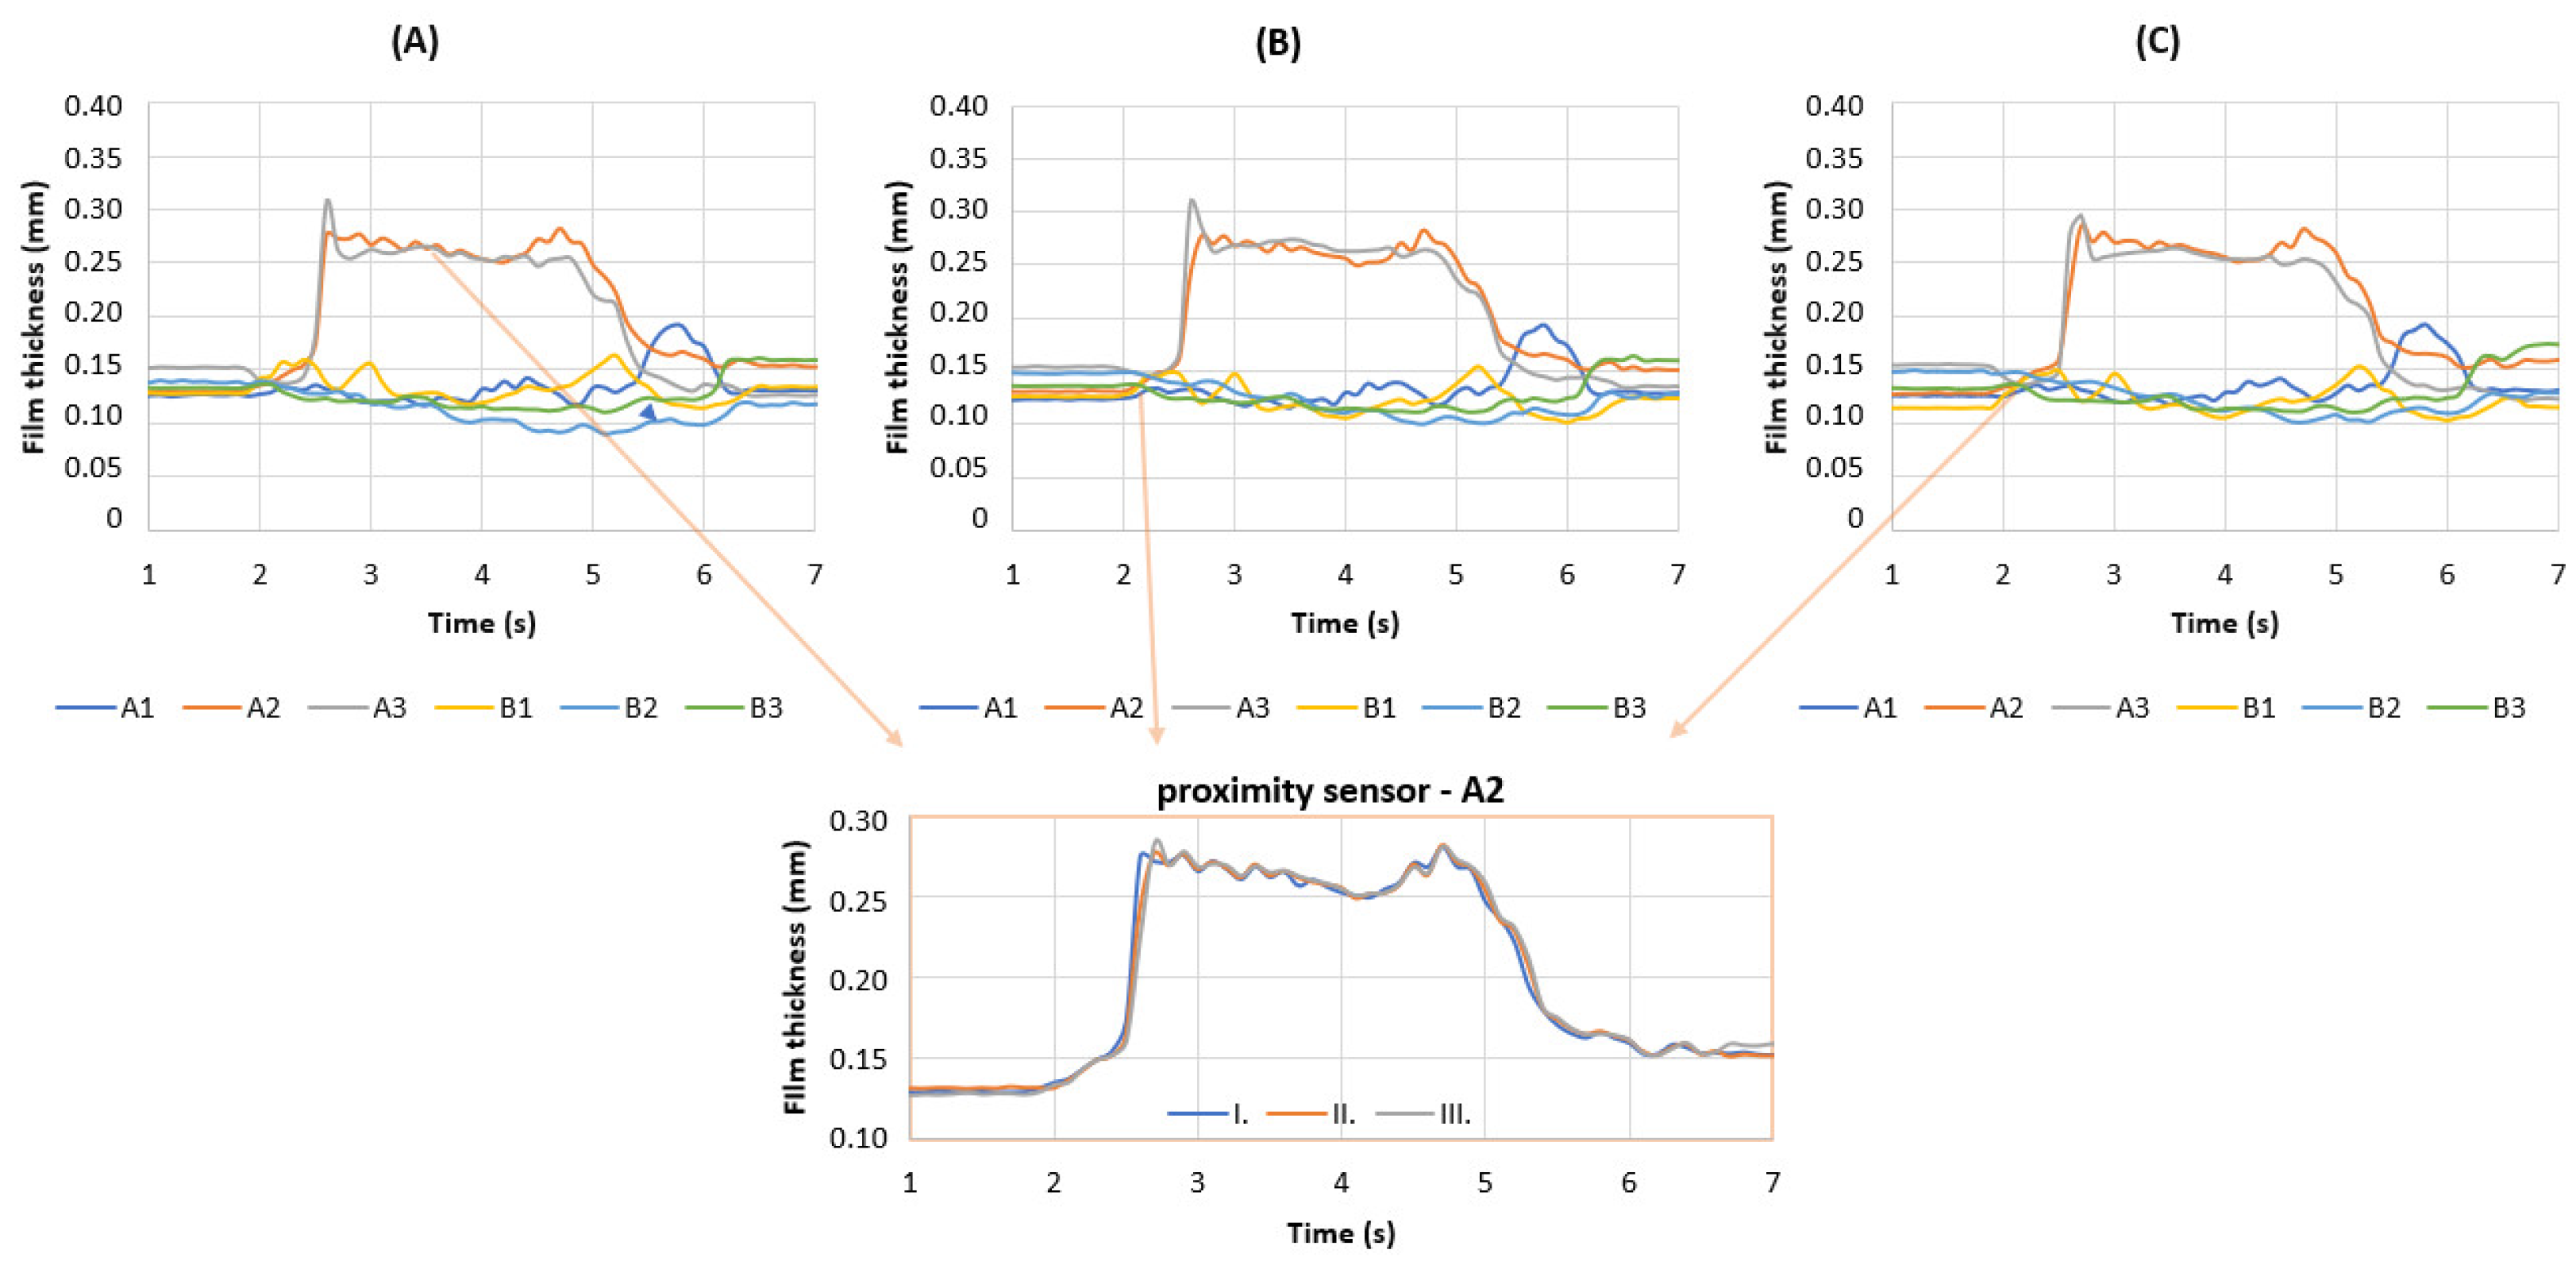
All dynamic tests were performed at a slider movement speed relative to the pads. To prove the repeatability of the dynamic tests, three initial measurements with 0.1 mm error (“STEP-UP” type) were carried out and compared. The following test were repeated three times as well, but only one run was plotted as they all exhibited high repeatability. As seen in
Figure 10, the data obtained from the proximity sensors show the same trends for film thickness with very few differences, as shown in the detailed comparison for the proximity sensors (see the scheme in
Figure 3). The repeatability of pressure sensors in all three measurements was within ±3%. For subsequent measurements, three measurements were carried out and thoroughly compared. All exhibited very high repeatability and the same deviation as in the initial experiment with 0.1 mm offset “step-up” type of error. The initial average film thickness was approximately 0.13 ±0.02 mm. A slightly higher deviation could be caused by the manufacturing error of the slider during movement compared to the static results.
3.2.1. Offset—“Step-Up”
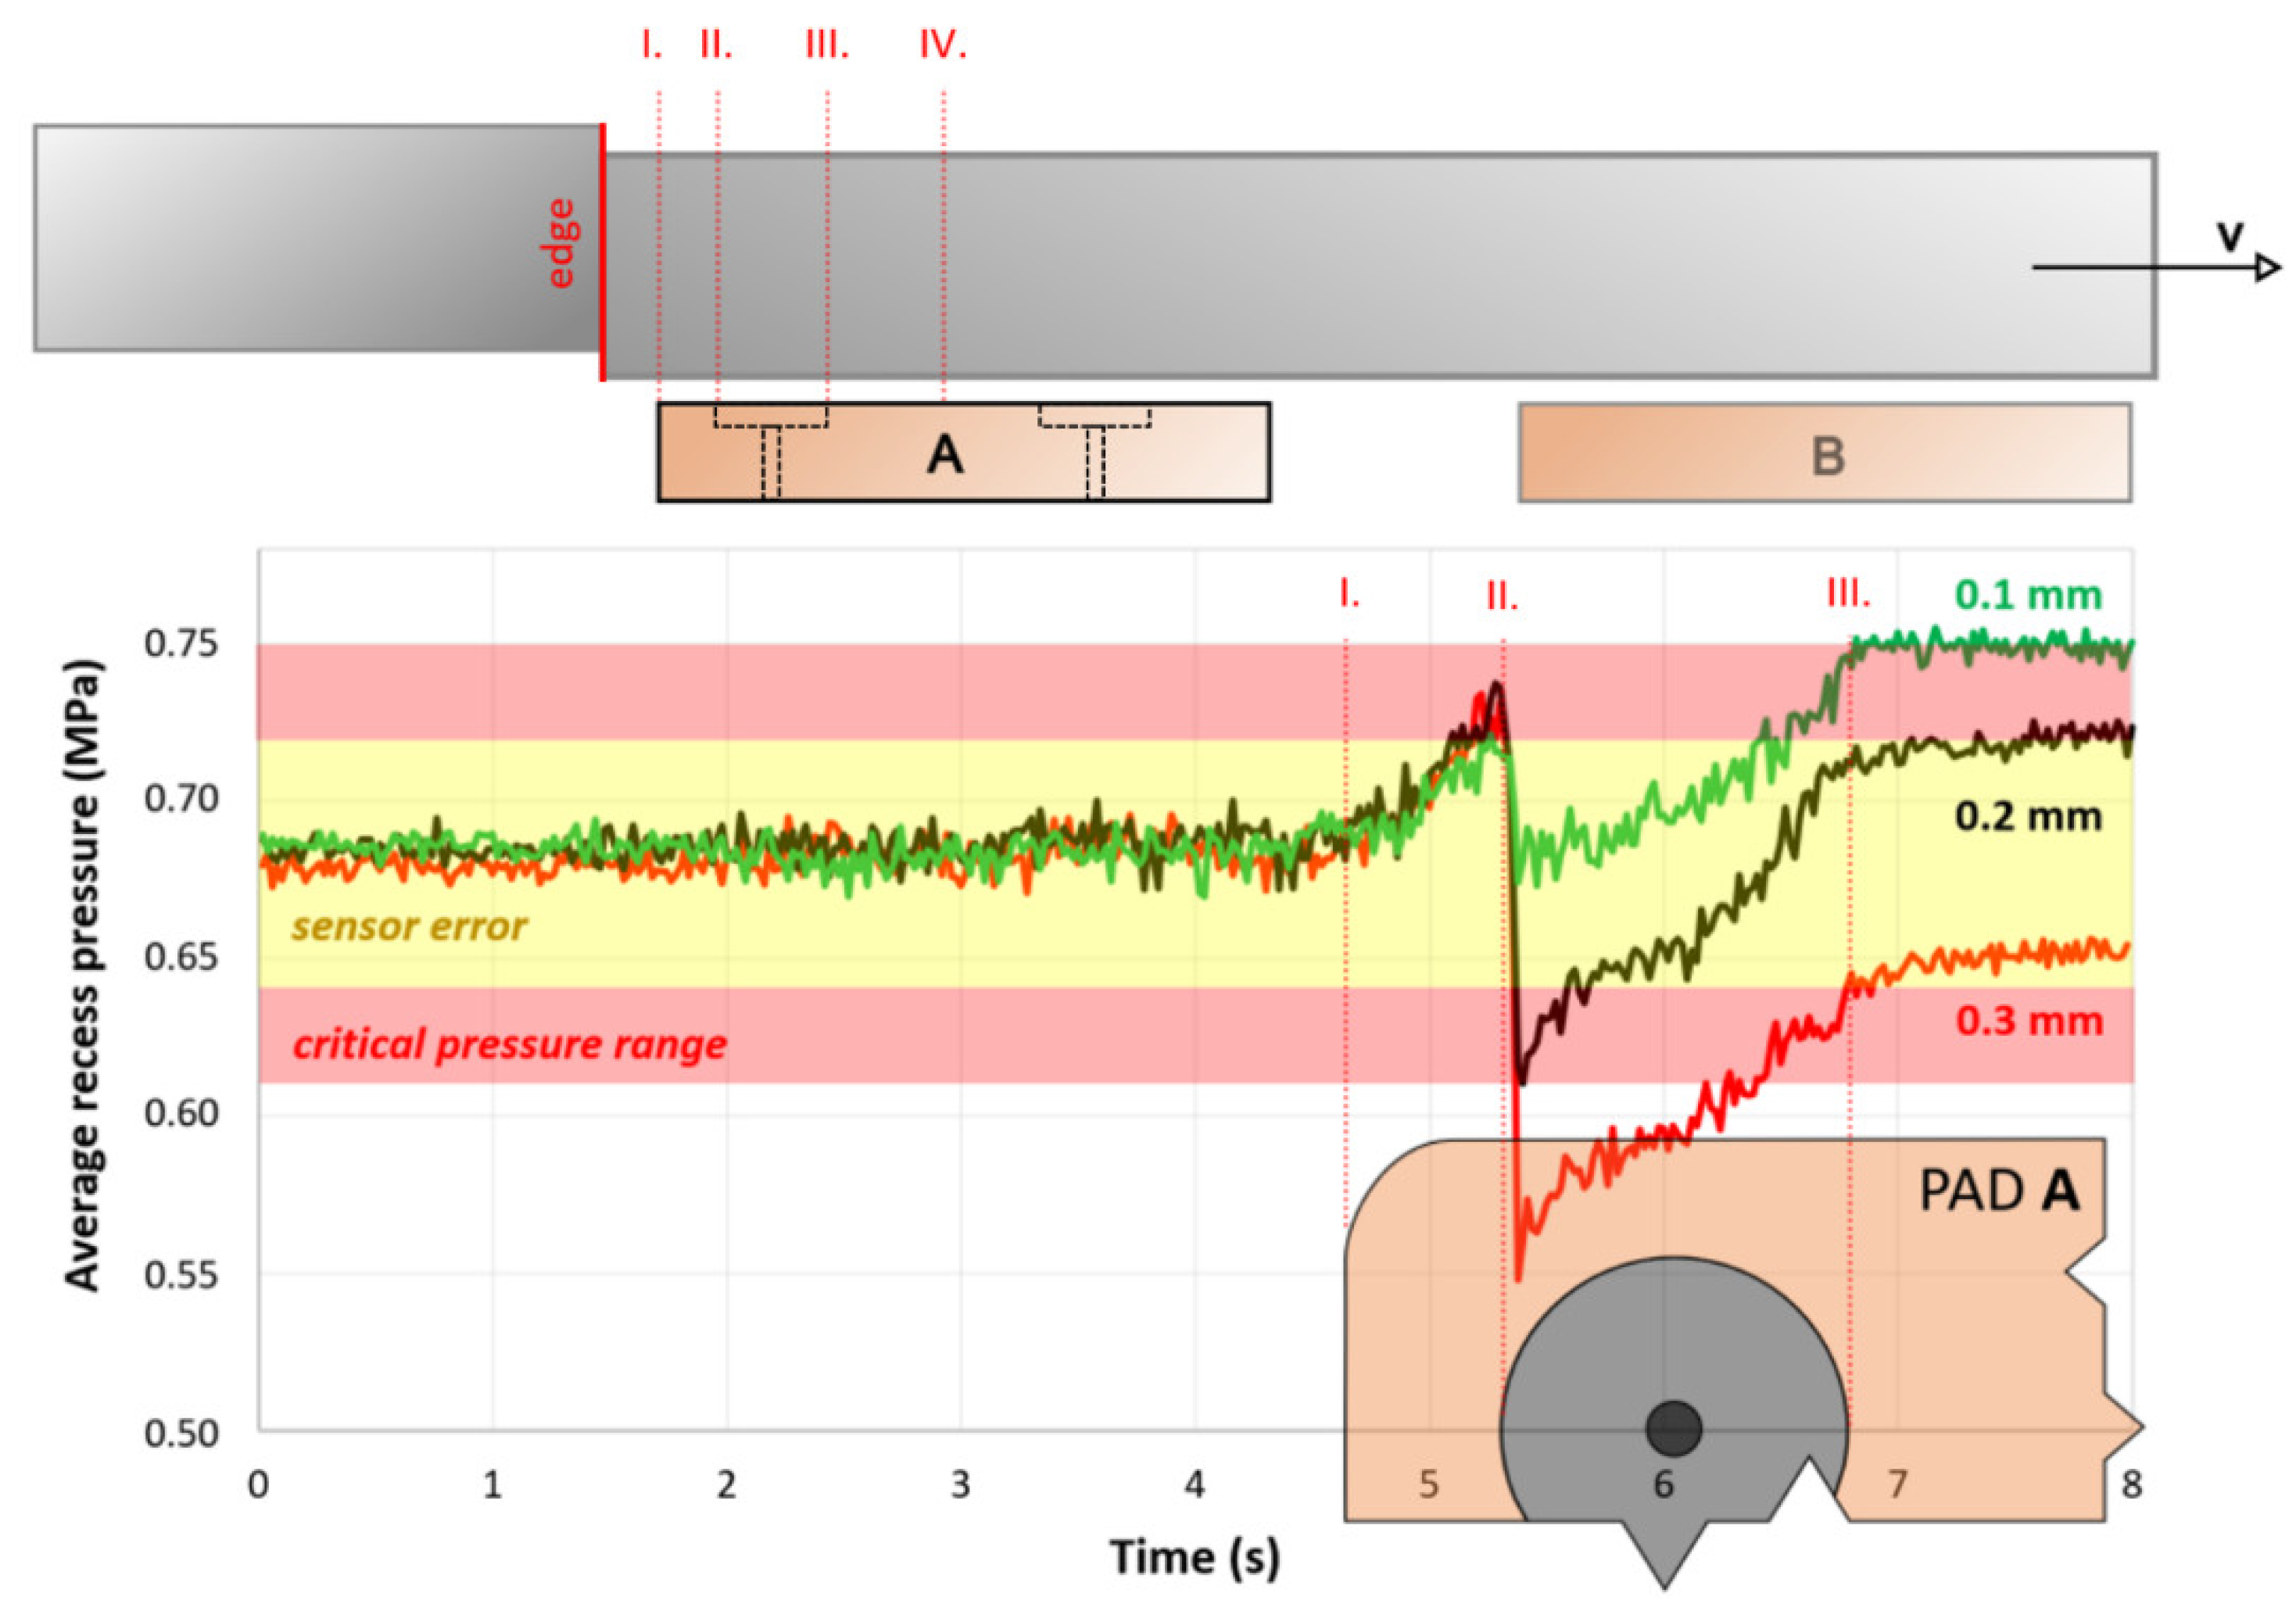
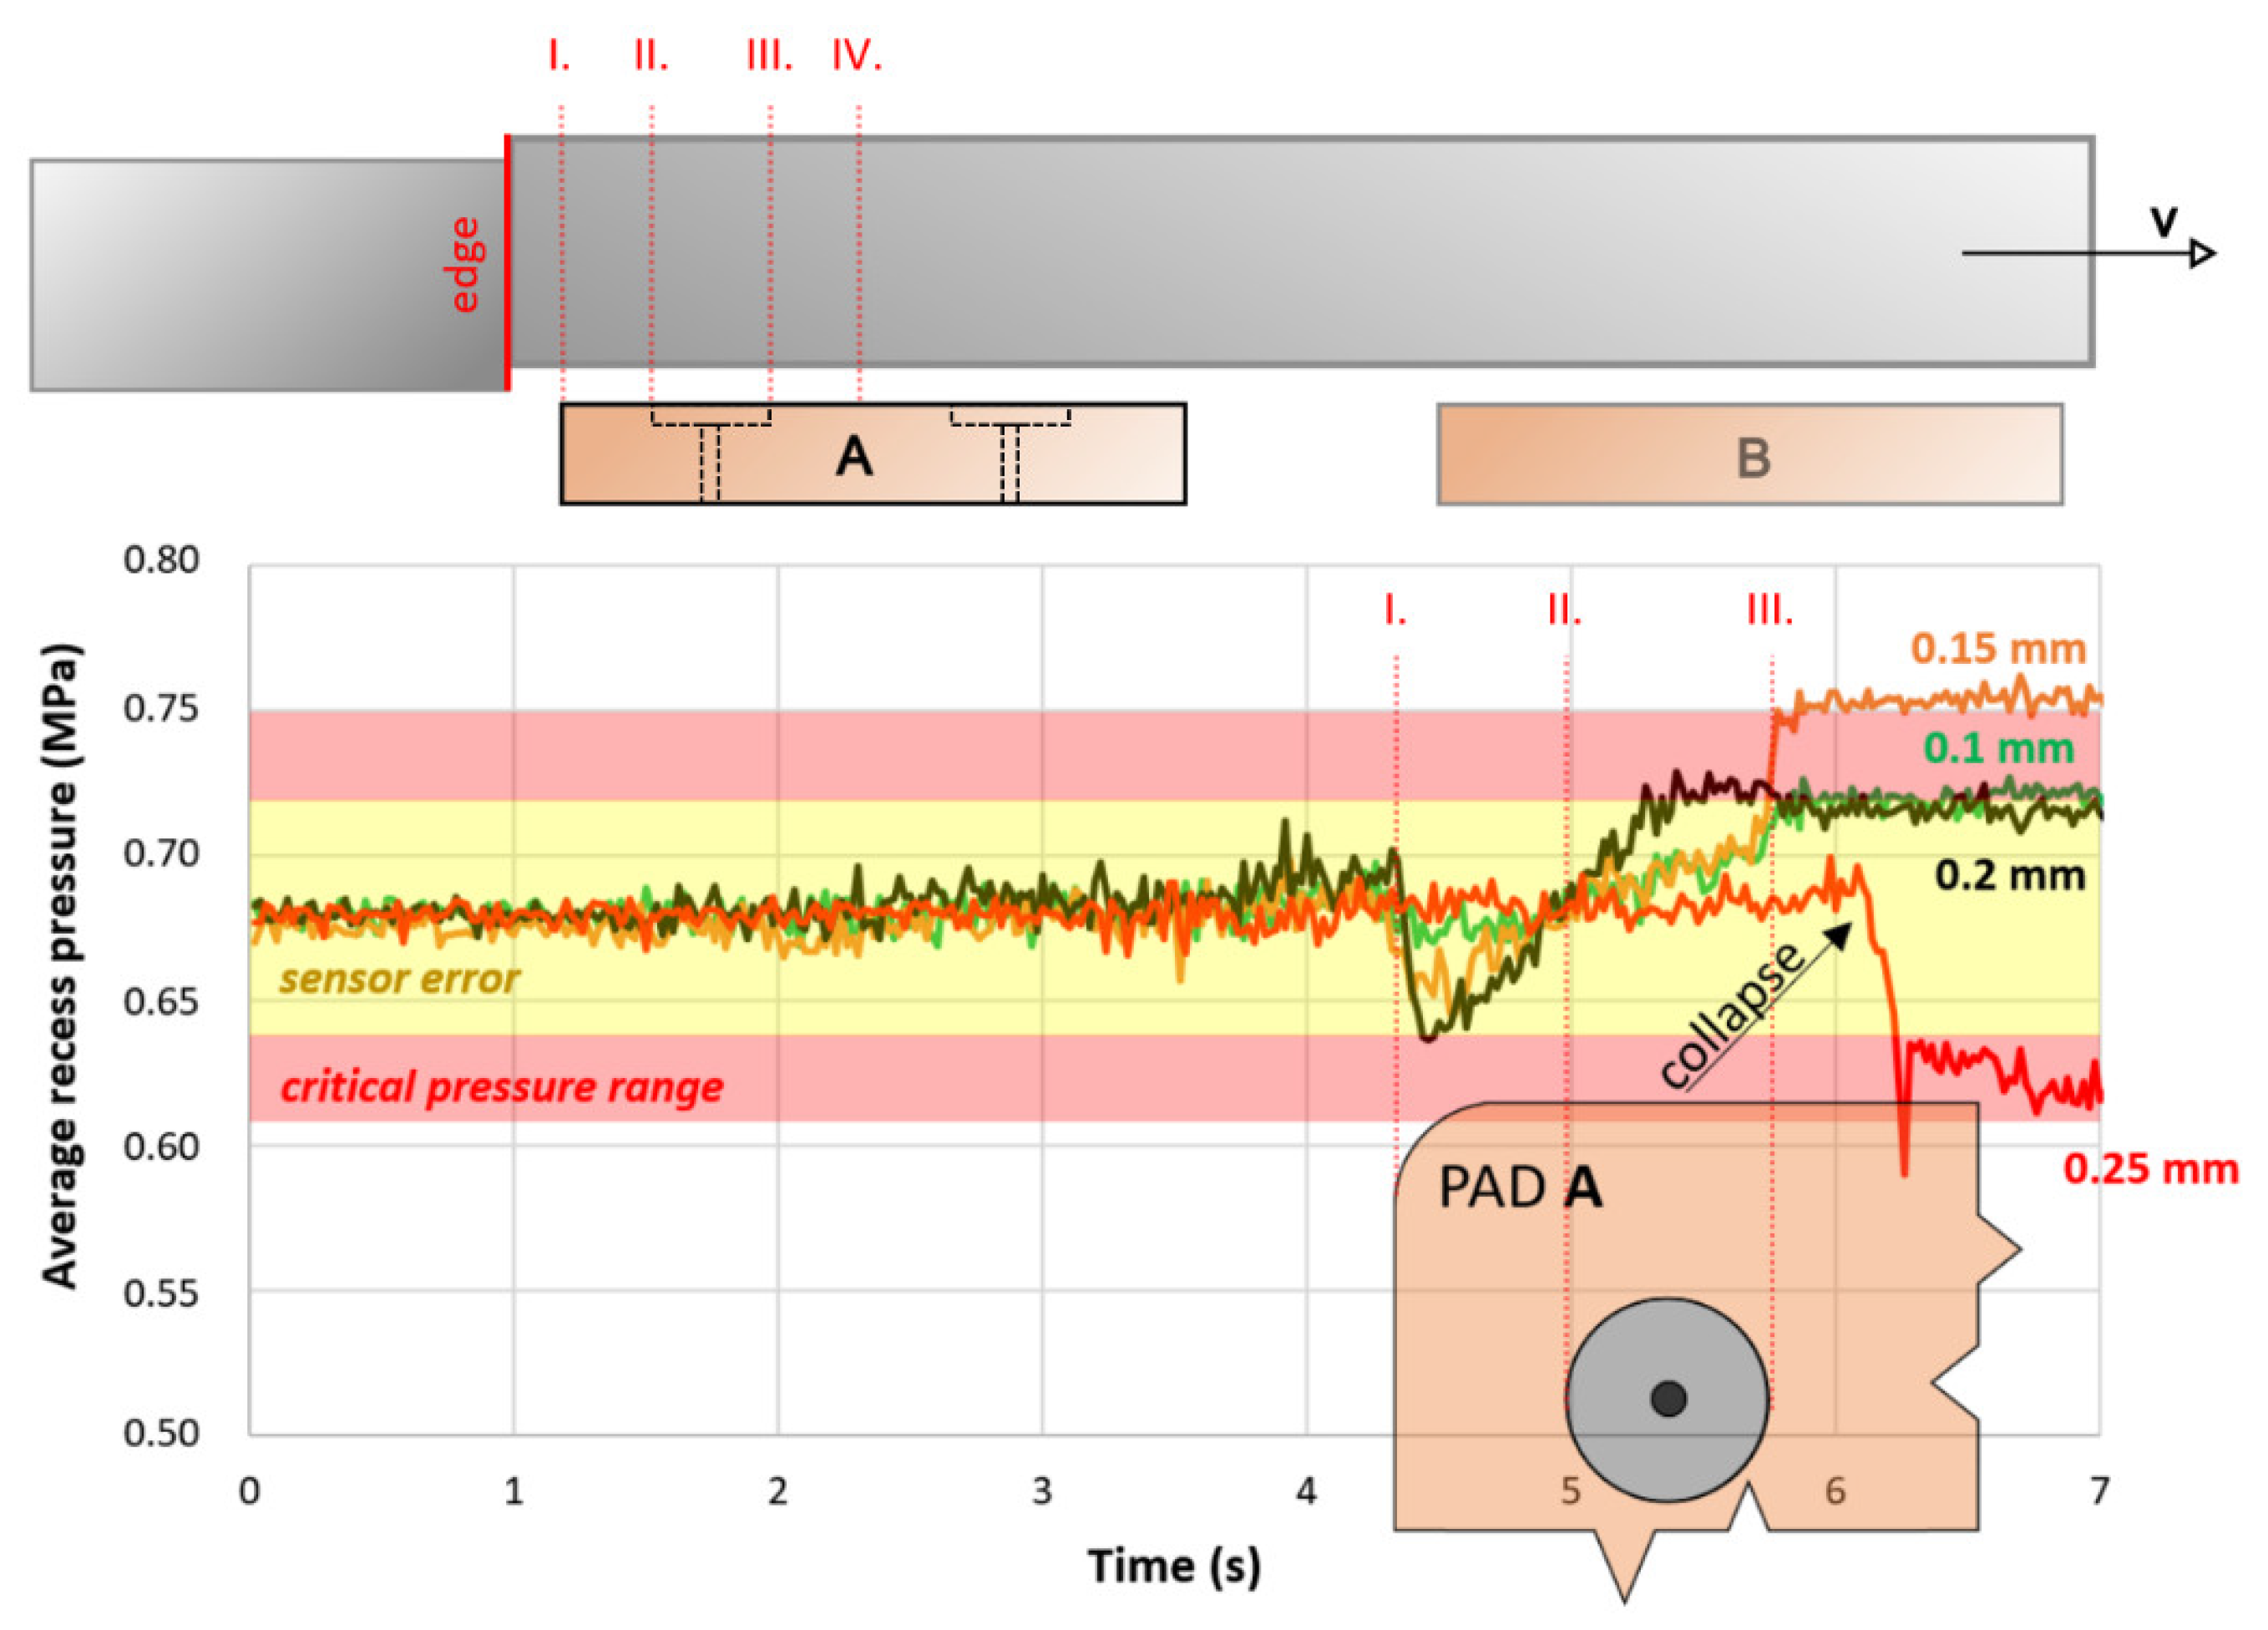
The “step-up” dynamic tests were performed for a range of errors (e) from 0.05 to 0.3 mm with 0.05 increment, as seen in
Figure 11. The average recess pressure trend was very similar for all cases; therefore, only runs of 0.1 mm, 0.2 mm, and 0.3 mm errors (e) are drawn in
Figure 11. The measured data show an almost identical rise of the average recess pressure when the edge passes through the pad land area (between points I. and II.). This is caused by decreasing the effective area of pad A while carrying the same load; thus, the pressure increases. However, as soon as the slider step approaches the recess area (point II.), the pressure rapidly decreases, depending on the magnitude of the error. If the error (e) was within 0.05–0.015 mm, the pressure was still within the sensor error area and did not reach the critical pressure range. However, the pressure with a 0.2 mm error (equivalent to the ratio e/h = 1.5) has already entered the critical pressure range and is considered as the limiting value of error for the investigated movement speed. After the edge passed the recess area, the average pressure stabilized at a higher value in the case of smaller errors (e < 0.2 mm). The errors within the range of 0.2–0.3 mm (e/h = 1.5–2.3) exhibited average pressures below the critical pressure range. This is also a matter of the restrictor setup and their performance. The test was terminated when the edge reached middle of the pad A (point IV).
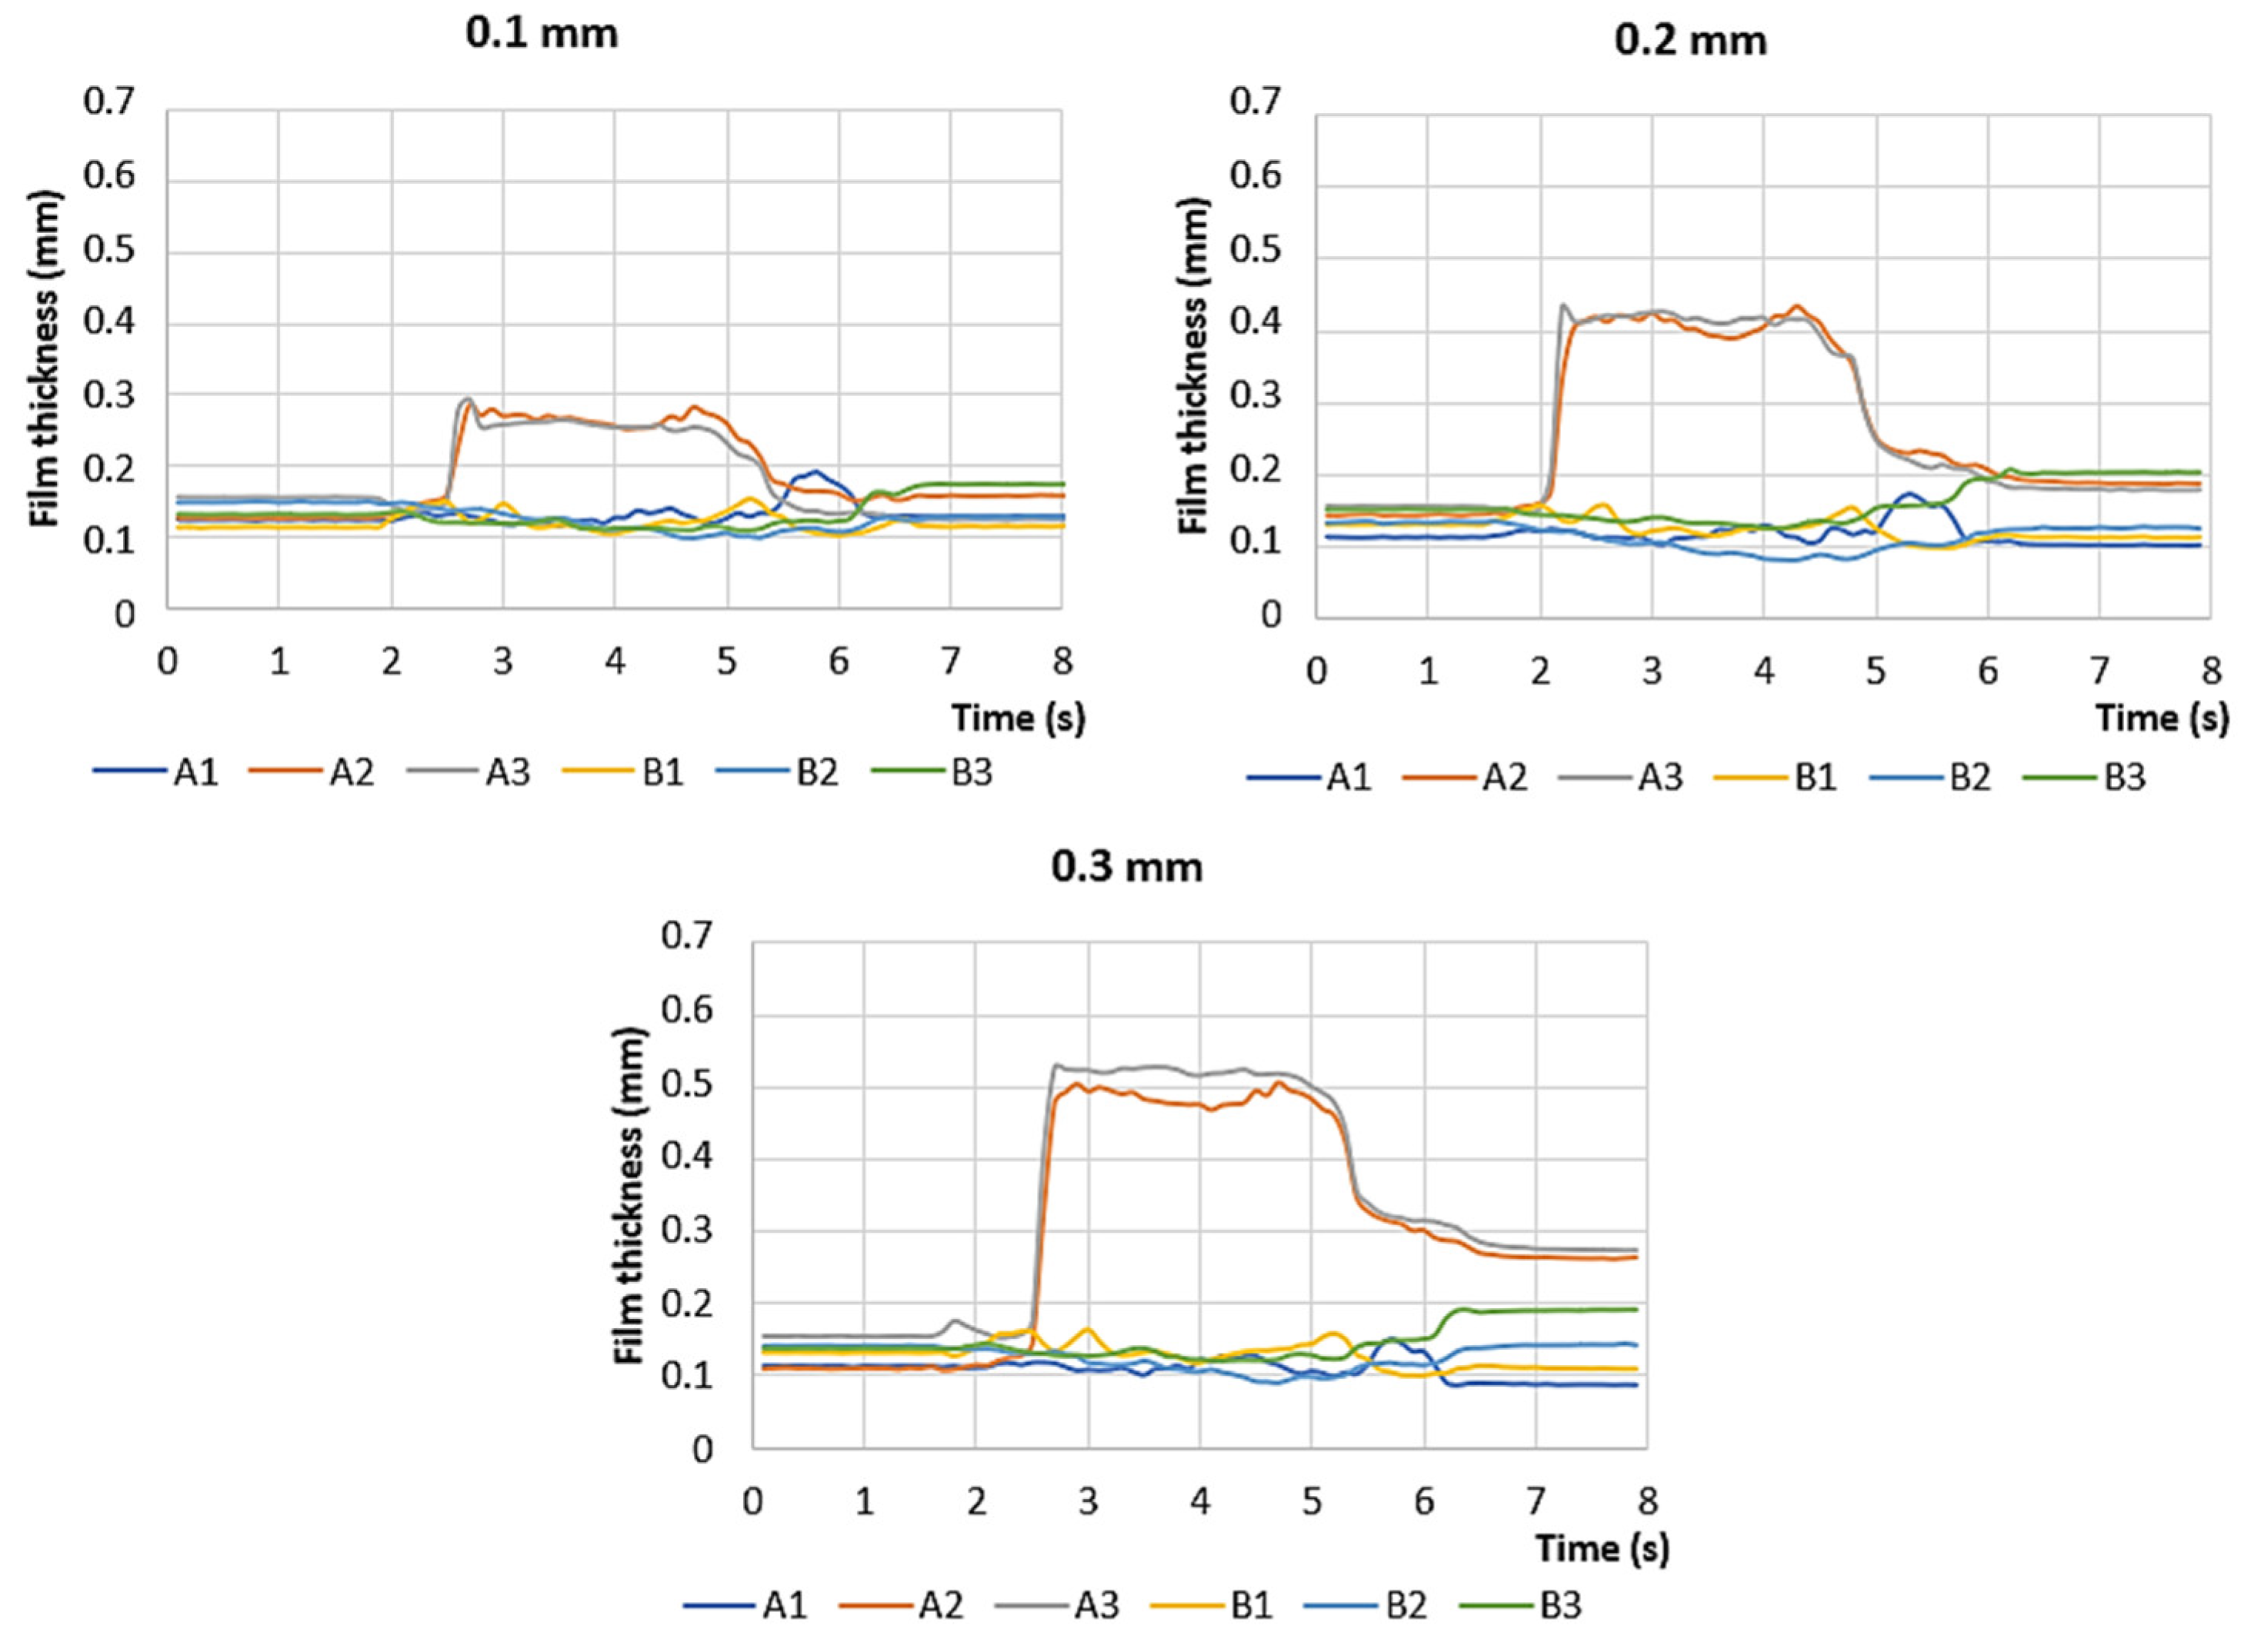
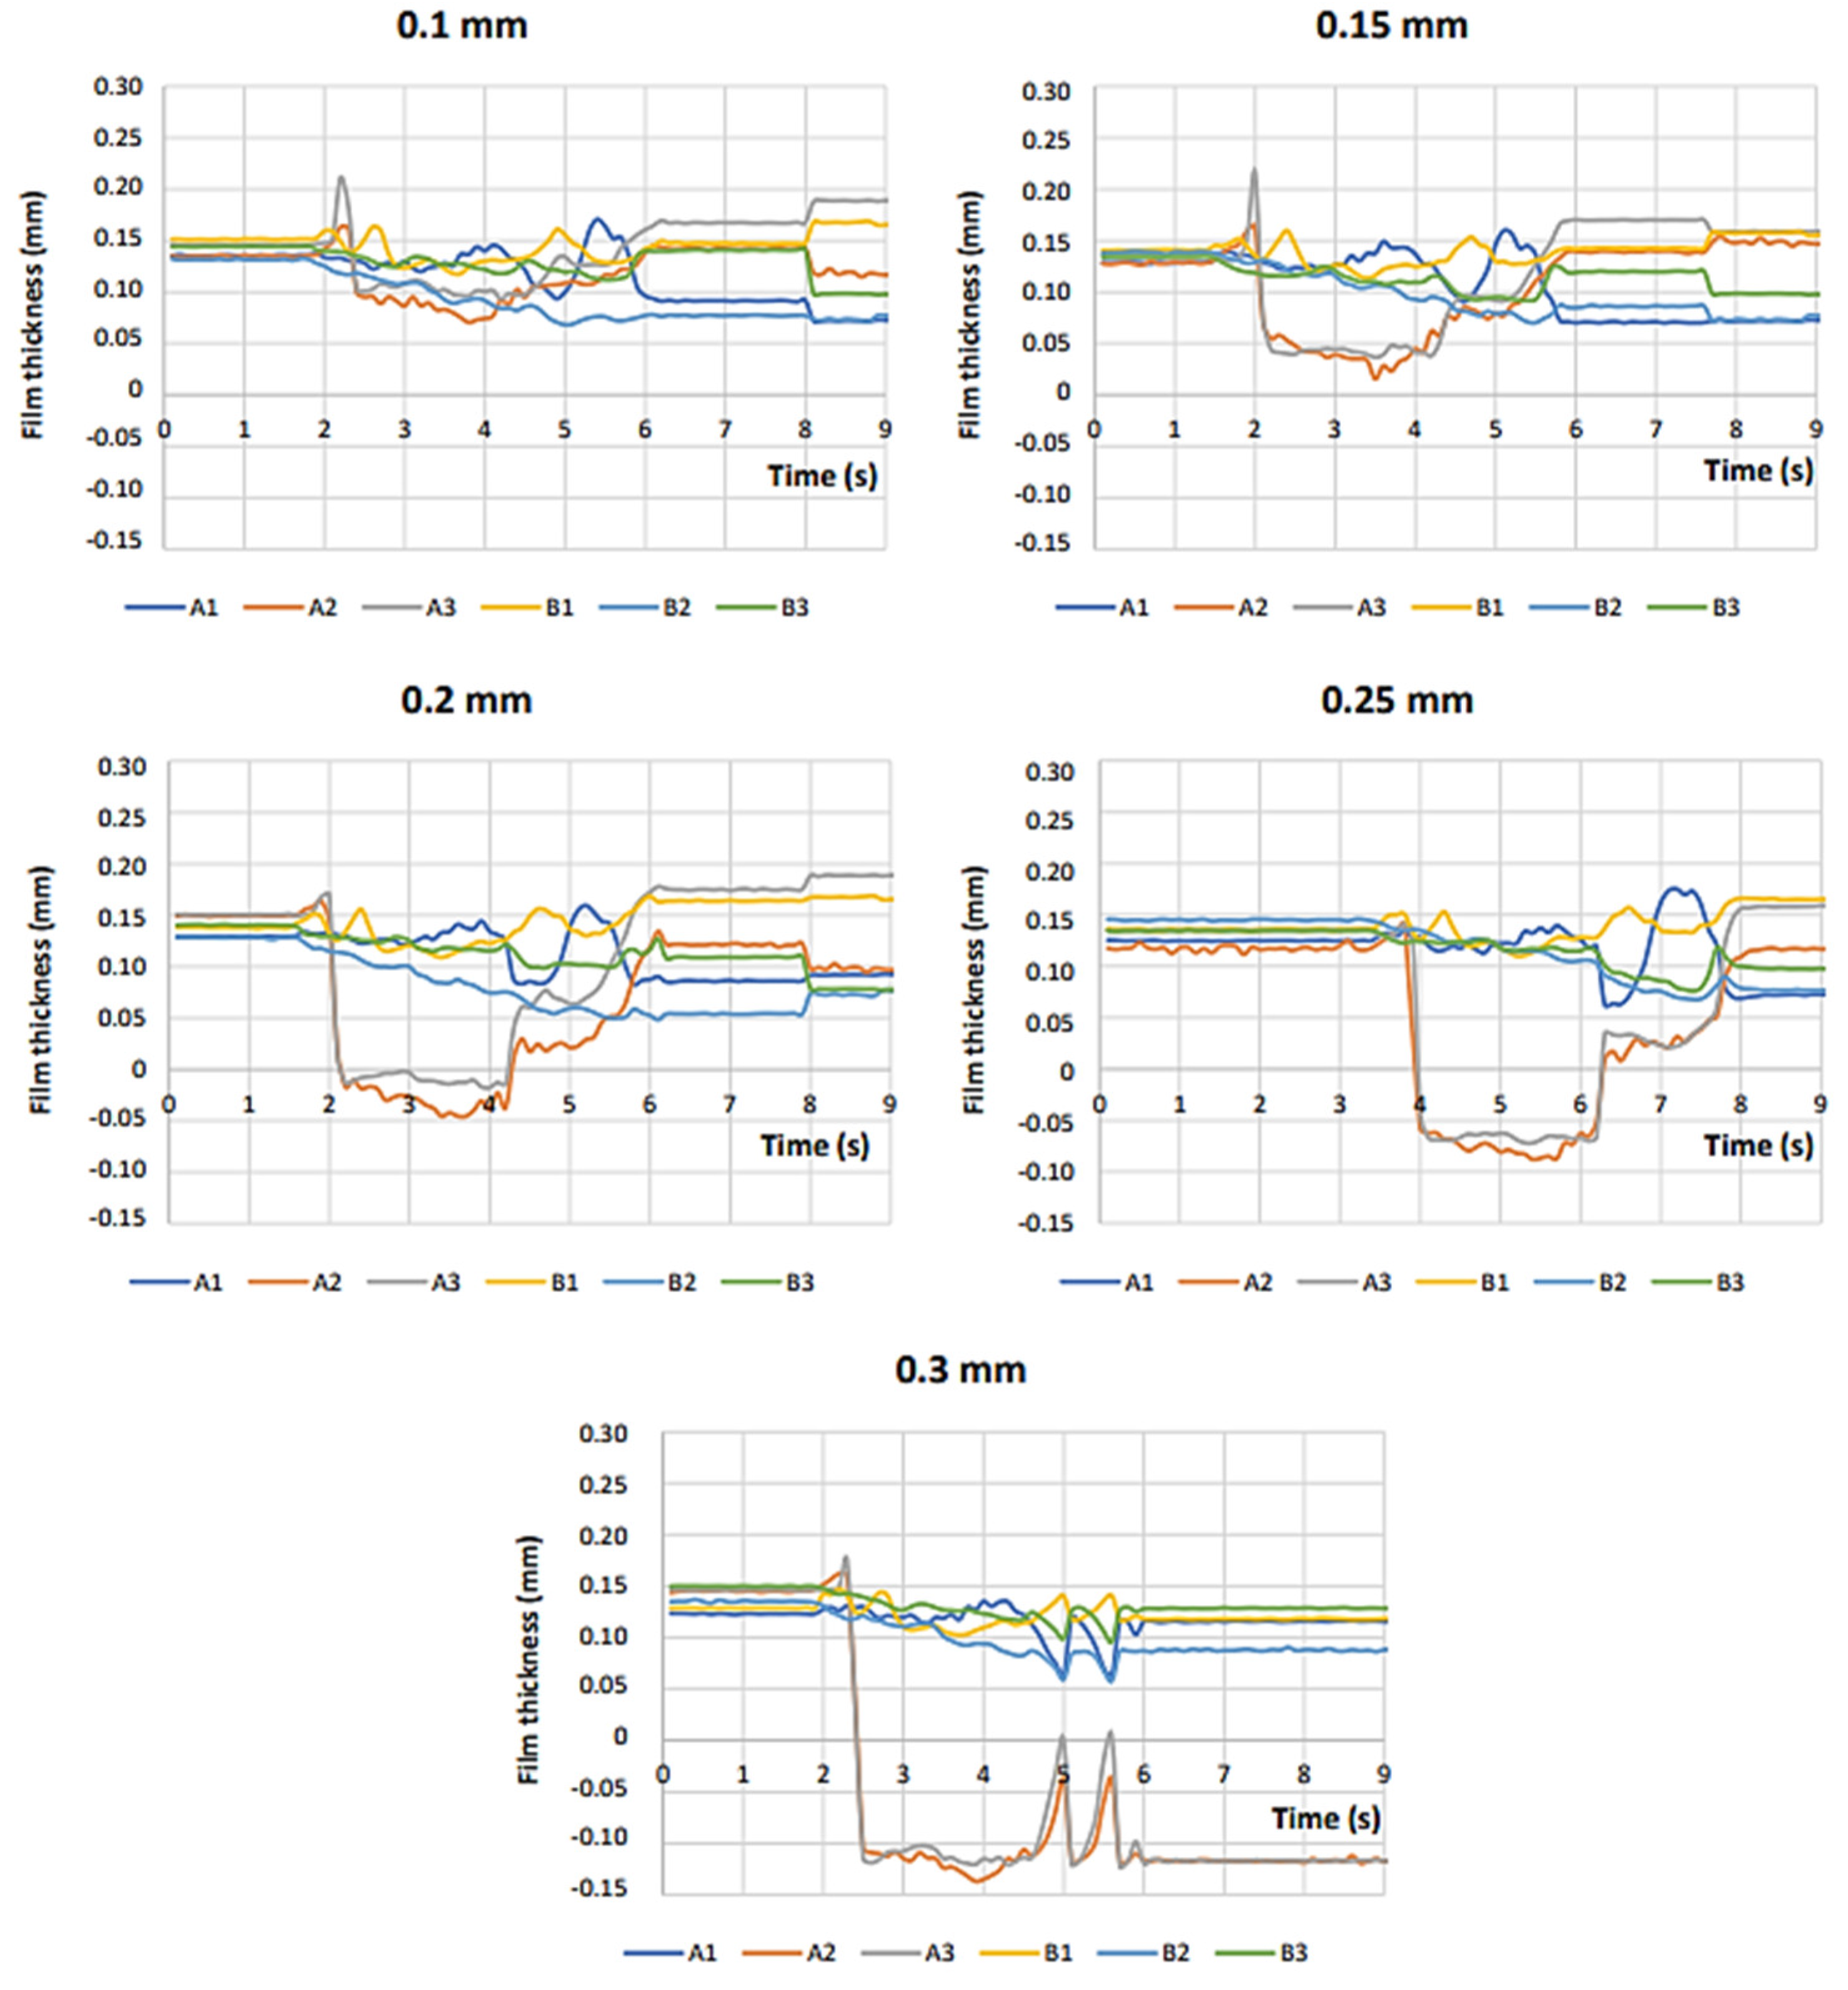
Although the returned pressure was above the critical pressure range, as in the case of a 0.3 mm error, the critical area when the slider is passing the edge and entering the bearing is more important. Furthermore, the precision is already compromised, because the thickness of the film becomes more non-uniform, as shown in
Figure 12. A similar effect is expected to occur, as described in
Figure 8. Nevertheless, the magnitude of error that the lubricating film can manage without suffering decreased performance would most likely be lower at higher movement speeds.
3.2.2. Offset—“Step-Down”
The “step-down” dynamic tests were also performed for a range of errors (e) of 0.05–0.3 mm with 0.05 mm increments, as seen in
Figure 13. However, the average recess pressure trend was different from that in the previous investigated case. In the error range (e) of 0.05–0.15 mm (e/h = 0.38–1.15), the bearing could still operate normally and did not exhibit any form of collision. As seen in
Figure 14, the assumed 0.15 mm error was smaller, approximately 0.1 mm instead of 0.15 mm. Moreover, the average recess pressure, as seen in
Figure 13, was slightly higher than the critical pressure after passing the recess area (starting with point III.). It did not fall below the lower critical value; thus, we assumed normal operation. The tests were terminated when the edge reached the middle of the pad A (point IV.). An actual problem with the bearing performance started to arise at an error of 0.2 mm (e/h = 1.54), whose real value seems to be, according to the obtained data from sensors, 0.15 mm. As seen in
Figure 13, the “0.2 mm” error exhibited a rapid decrease in the average pressure when the edge entered the pad area (point I.), but the bearing was able to react to the change with increased pressure. This type of error was not as sensitive to the average recess pressure (between points II. and III.) as the “step-up” type but was more dangerous from the film-thickness point of view. The bearing pad could not handle such an error at higher speeds. As expected, this type of offset error was more dangerous, and the slider and pad collision occurred at an error 0.25 mm (e/h = 1.92). The motor managed to pull the slider despite contact was observed (the slider stopped for a while and then continued with the movement). Therefore, the “step-down” tolerance must be within the film thickness height, and thus, the ratio e/h should be smaller than 1 to avoid the collision of the solid bodies. Although the average recess pressure almost did not reach the critical pressure area, the film thickness (
Figure 14) was already around zero, which means that the slider error edge and pad were almost at the same level.
The error of 0.3 mm (e/h = 2.3) caused a total failure of the bearing. As seen in
Figure 14, for this case, two sharp spikes were observed at sensors A2 and A3, respectively. The slider completely stopped its movement at the edge of the pad due to collision. The motor tried to pull the slider over the edge, which is what is explaining the two sharp spikes on the film thickness sensors, and then it was interrupted. The pads were manufactured without chamfers on the edges. This could surely help the bearing manage slightly higher assembly errors of the slider bodies but the contact of solid bodies would be inevitable. Considering the results obtained, we assume that the general recommendation for the offset error would be that the error value should be smaller than the film thickness, or rather, that the e/h ratio must be smaller than 1. The edge chamfer could help to avoid the impact, but most probably not the collision of the slider and pad bodies.
4. Conclusions
In this study, assembly error tolerance was assessed for large-scale HS bearings working under static and low-speed conditions. Two main types of errors were classified—offset and tilt. The study was carried out on an experimental HS bearing with complete performance diagnostics. The investigation was evaluated on information from pressure and distance sensors. Both types of errors were first investigated under static conditions. The maximum tolerance for offset error was found to be for the ratio of error-to-film-thickness of e/h = 2.5 for static conditions. Regarding tilt, two scenarios were tested: tilt centre in the middle of the pad and between the bearings. However, when assuming a movement of the slider, the maximum error tolerance was considered as θ = 0.46° at the investigated distance. Thus, the greater the pad distance, the smaller the angular error tolerance. The angular error tolerance will decrease with increasing distance of the pads. Subsequently, the offset error was investigated under low-speed conditions (38 mm/s) for two cases—“step up” and “step down” error types. The critical error value was estimated for ratio e/h = 1.5 for “step-up” and e/h < 1 for “step-down”, which means that the error tolerance is higher for static conditions, and that it is decreasing as the relative movement speed of the solid bodies increases. In case of bi-directional movement, the step-down error type should always be preferred, and the e/h ratio should not exceed 1 to avoid surface damage. The tolerance estimation approach provided in this study offers an experiment-based tool for design engineers and can help with assessment of the assembly process of such bearings on large scales. It can also be used to determine required film thickness for known magnitudes of error that occur in the final assembly, or to set limiting assembly errors based on the knowledge of the designed film thickness. Further research could aim to obtain error tolerance values depending on the relative speed of the solid bearing bodies. Numerical modelling of the case could provide insight into how the pressure field changes with different error magnitudes or during movement.

 ,
, 


