Article

Numerical Study on Aerodynamic and Noise Responses of Rotor with Ramp Increase in Collective Pitch Based on Time-Accurate Free-Wake Method

National Key Laboratory of Helicopter Aeromechanics, Nanjing University of Aeronautics and Astronautics, Nanjing 210016, China
*
Author to whom correspondence should be addressed.
Machines 2023, 11(11), 1007; https://doi.org/10.3390/machines11111007
Submission received: 21 August 2023 / Revised: 16 October 2023 / Accepted: 24 October 2023 / Published: 3 November 2023
(This article belongs to the Section Machine Design and Theory)

Abstract

:
Research on helicopter transient maneuvering flight noise is a hotspot and challenging topic in the fields of helicopter design and application. A new time-accurate free-wake (TAFW) method and the Fowcs Williams-Hawkings (FW–H) equations are applied to analyze the aerodynamic and noise responses of a rotor subjected to a ramp increase in collective pitch, in hover, and in forward flight. First, a TAFW algorithm suitable for rotor aerodynamic simulation in steady-state flight and transient maneuvers is developed using modified third-order upwind backward differentiation formulas. Then, to verify the effectiveness and accuracy of the proposed method, various parameters are calculated for two scenarios and compared with corresponding results from experiments by the University of Maryland: the Langley 2MRTS rotor and the NACA rotor with ramp increases in collective pitch. Finally, the influence of collective pitch increase rate, the total increase of collective pitch, and the start and stop azimuth of ramp increase on the aerodynamic and loading noise responses of the rotor are analyzed in hover and forward flight conditions. The results show the ramp increase in collective pitch will affect the loading noise in three timescales: short-term, medium-term, and long-term. The change of the loading noise is greater when the collective pitch increase rate is greater, and the start and stop azimuth angles of the ramp increase are also important factors affecting the aerodynamic load distribution and directionality of the noise.

1. Introduction

The complex flow field dominated by the tip vortex is an important feature of helicopter aerodynamics, and the asymmetry of the flow field in forward flight brings significant challenges to the numerical simulation of the rotor flow field. Compared to steady-state flight, the helicopter in maneuvering flight has a variable translational or angular velocity and further has translational or angular acceleration. This means that the transition from steady-state flight to maneuvering flight, as well as the transition between different maneuvering flight states, needs to be realized by changing the control inputs, then changing the aerodynamic forces on the main rotor and on the tail rotor. The main rotor is the most important source of the aerodynamic forces and control forces of the helicopter; it is also the main source of aerodynamic noise in the helicopter field. The dynamic variations in the main rotor’s flow field and aerodynamic forces induced by transient maneuvering will directly affect the aerodynamic and noise responses of the rotor. Hence, the study of the transient maneuvering state of the rotor occupies an important position in the study of helicopter maneuvering flight [1,2,3].
The study of aerodynamics and noise responses of helicopters during maneuvering flight can be divided into experimental research [4,5,6], semi-empirical model analysis [7,8,9,10], and numerical simulation [11,12,13,14]. Early numerical simulation research focused more on studying helicopter flight mechanics, such as the aerodynamic performance and control response of various helicopters. However, there were few studies on the aerodynamic noise of the rotor in corresponding states due to the limited accuracy of the simulation methods.
Chen [15] and Ananthan [16] conducted aerodynamic noise research on some maneuvering flight states based on the time-accurate free-wake (TAFW) method. Sickenberger [3] compared maneuvering flight noise between numerical prediction based on a prescribed wake model and experimental measurement results, thus indicating that the aperiodic motion of blades and instantaneous loads are important sources of maneuvering flight noise. Wang [17] conducted preliminary research based on the modified Beddoes prescribed wake model. Since the prescribed wake model is usually modified by experimental data, when applied to the prediction of a rotor with a different number of blades or with a configuration such as the coaxial rotors, the accuracy of such a model can be highly influenced.
In the last decade, computational fluid dynamics (CFD) solvers based on the Euler equation or Navier–Stokes equations have been widely used in the numerical simulation of helicopters [18,19]. CFD methods, however, have only been applied to the study of maneuvering flight in recent years. Woodgate et al. [20] used a CFD solver in the numerical simulation of the flow field of the main rotor with a ramp increase in collective pitch in hover conditions, while the acoustic response was not considered. Chen et al. conducted research on the impact of ramp increases in collective pitch on rotor aerodynamic forces based on a CFD solver [21], as well as the study of noise characteristics during collective pitch aperiodic variation in hover conditions [22]. However, as the computational resources and time cost of the CFD method for steady-state flight simulation are very large already, the physical timescale of the analysis of maneuvering flight is much larger than the analysis of steady-state flight, which leads to the fact that the computational efficiency obviously restricts the application prospect of CFD solvers in maneuvering flight simulations. These studies based on CFD solvers focused only on the ramp increase in collective pitch in hover conditions rather than more dynamic flight states.
Since the computational efficiency of the TAFW method is significantly greater than the efficiency of CFD methods, to give a deeper look at the mechanism in the aerodynamic and noise response with ramp increases in collective pitch, numerical studies on flight conditions both under hover and in forward flight were carried out based on the TAFW method in the present research. In Section 2, we first developed a TAFW algorithm using the improved third-order upwind backward differential formula (3-upwind BDF), which can be used to simulate rotor aerodynamics in both steady-state and maneuvering flight. Then, based on the source time method, a fast aeroacoustic noise prediction method suitable for rotors is established by solving the FW–H equation in the F1A formula. Subsequently, in Section 3, multiple conditions are calculated and compared with experiment results to verify the accuracy of the proposed methods in predicting aerodynamic loads and noise for steady-state and maneuvering flight. Finally, in Section 4, the aerodynamics and noise responses to variations in the parameters of ramp increase in collective pitch in hover and forward flight states were studied. This section discusses the effects of factors such as collective pitch rate, the total increase of collective pitch, and the start and stop azimuth angle of ramp increase. The variation in rotor load and loading noise in three timescales, the significant aperiodicity in short-term and medium-term variations, and the aperiodic variation of BVI load and noise in the medium-term timescale were revealed and analyzed. The significant influence of the start and end azimuth angles of the maneuver on aerodynamic and noise characteristics was pointed out. Based on the conclusions drawn in the research, a new approach to controlling rotor noise in maneuvering flight states by active control of the start and end azimuth angles is proposed.

2. Calculation Methods

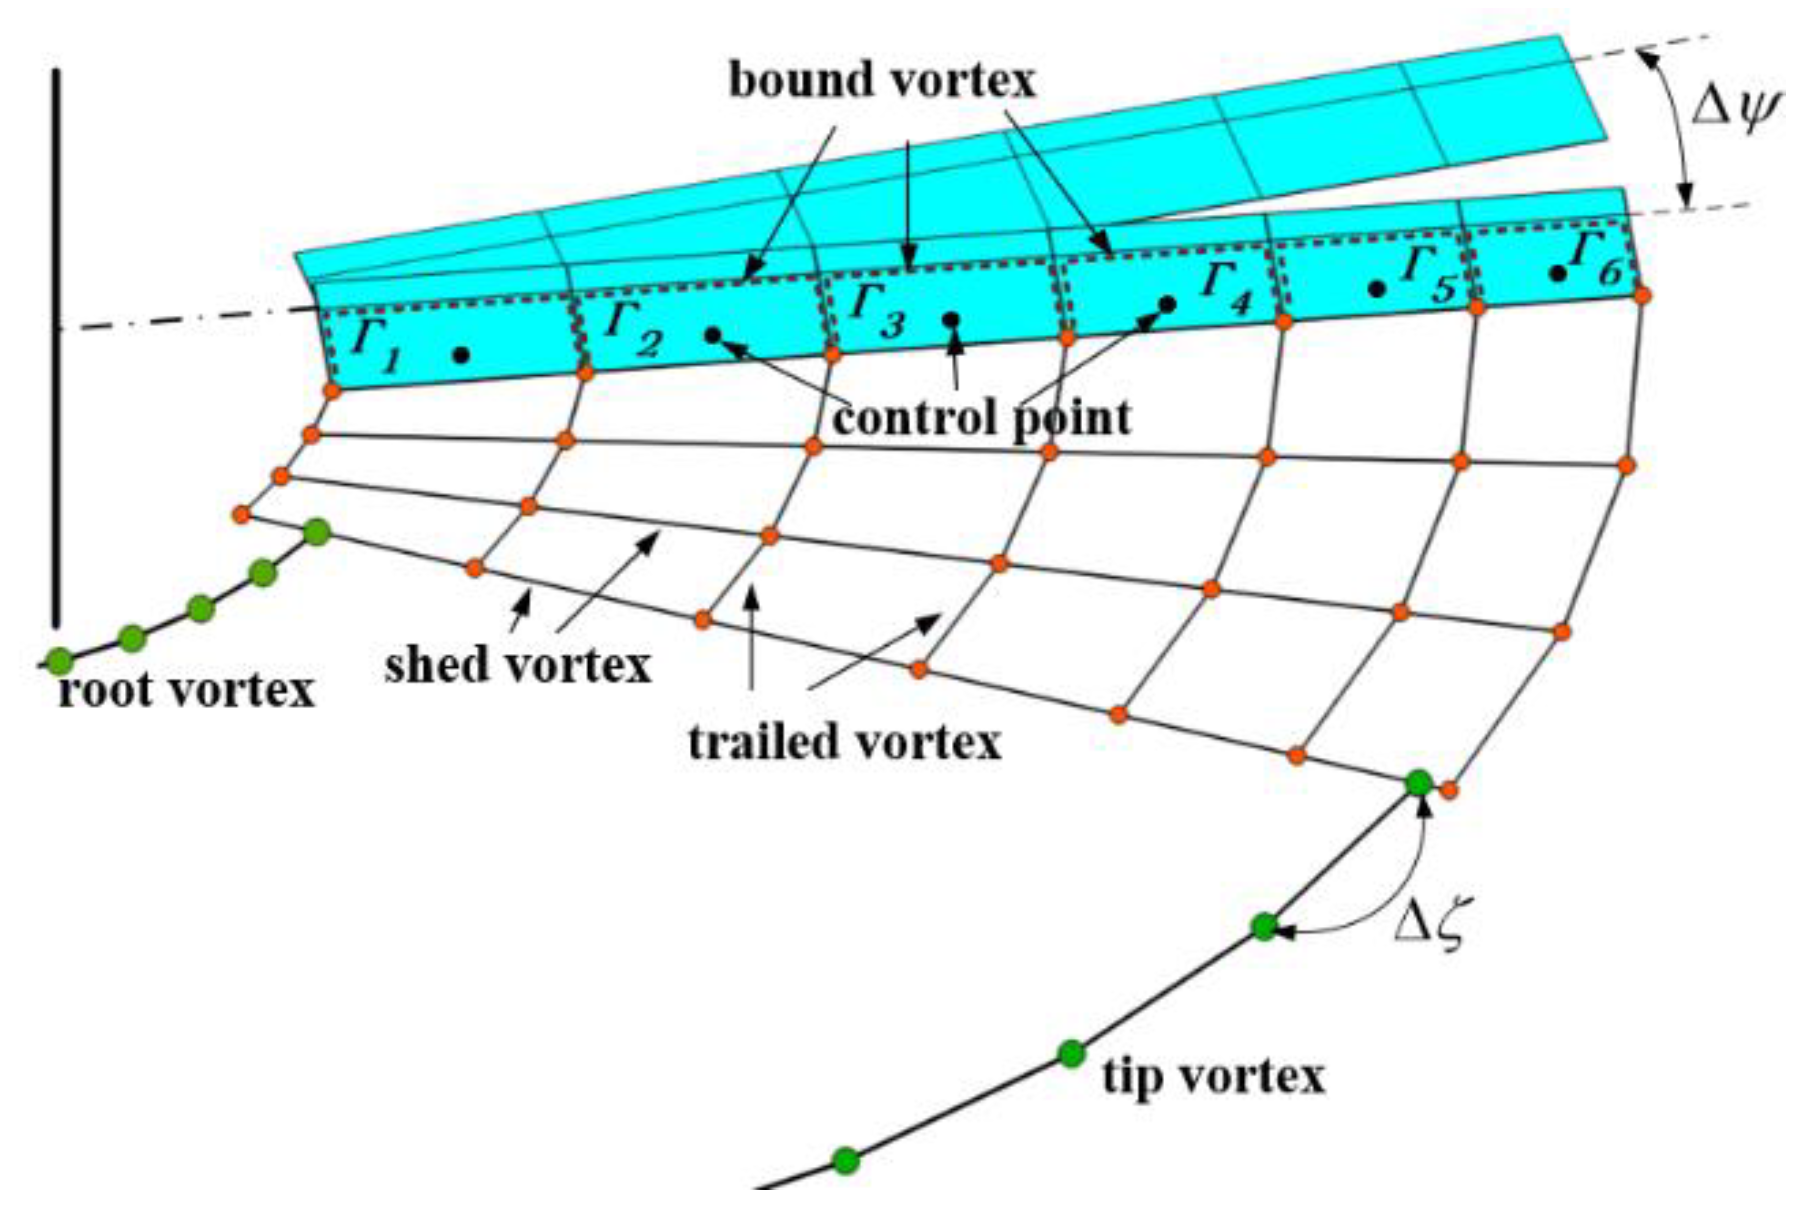
2.1. Time-Accurate Free-Wake Model

The modeling of the blade vortex system is based on the Weissinger L-model [23]. This model was extended from a two-dimensional lift line model to a three-dimensional one, and the blades were represented as several segments. Among them, the bound vortex coincides with the 1/4 chord line, and the control point is located at the midpoint of the 3/4 chord of the segment, as shown in Figure 1.
The control points of the blade need to meet the wall’s normal non-penetrating boundary condition. By applying this condition to each control point, the linear equation system A Г n = B n can be obtained, which is represented as
A 11 A 1 N A N 1 A N N Г 1 Г N = B 1 B N
In Equation (1), A is the influence coefficient matrix, A i j is the induced velocity coefficient of the j-th segment blade bound vortex and the near wake at the i-th segment blade control point, Г i is the vorticity magnitude of the i-th segment blade bound vortex, B i is the velocity at the i-th segment blade caused by the superposition of inflow, blade motion, and far wake induced velocity, etc. n represents the outer normal at the control point. The bound vortex vorticity at the corresponding segment can be obtained by solving the equations. At this time, the blade’s trailing edge automatically satisfies the Kutta condition, which means that the velocity of the fluid at the trailing edge is finite [24]. Since the rolling forms of the tip vortex and the rotor blades do not have flap components similar to wings, it can be assumed that all wake vortices converge on the tip vortex [25], and according to the Betz curling theory, the tip vortex vorticity is equal to the maximum value of the bound vortex vorticity [26,27].
In Figure 1, ψ is the azimuth angle of the blade, and ζ is the age angle of the wake vortex. The vortex-induced velocity is calculated based on the Biot–Savart law. The aerodynamic force is obtained by the two-dimensional Leishman-Beddoes unsteady aerodynamic model [28]. Among them, the trapped vortex is generated by the variation of the bound vortex in a spanwise direction. The interpretation of the bound vortex with azimuth angle generates the shed vortex. These two types of vortices in this article were obtained from the vortex lattice model [29].
The vortex points in the flow field are convected in a force-free manner, and the governing equation can be expressed as [30]:
r ψ + r ζ = V Ω = 1 Ω V + V i n d ψ , ζ
where r is the position vector of the vortex point, V is the velocity of the vortex point, V is the velocity of the far flow, V i n d is the induced velocity at the vortex point, and Ω is the rotation speed of the rotor.
Several schemes have been developed to solve the control equation numerically while maintaining the stability of the solution. Bagai [25] proposed the PIPC (Pseudo-Implicit Predictor-Corrector) scheme, but this algorithm requires periodic boundary conditions at azimuth in topological space. Although this periodic boundary condition provides good numerical stability for relaxed free-wake methods, it also makes these methods only applicable to steady flight states.
In order to apply the free-wake model in non-periodic conditions such as maneuvering flight, Bhagwat [31] proposed the PC2B (Predictor-Corrector second-order backward difference) scheme, Li [32] proposed the CB2D (Center difference and backward difference second-order scheme with numerical dissipation) scheme, and Lv [33] proposed the 3-upwind BDF scheme. A formula based on a modified 3-upwind-BDF scheme is proposed in the present work; the proposed formula has proved to have good numerical stability and third-order accuracy. The prediction step of the scheme is:
r i , j = r i 1 , j + Δ ψ Ω 3 2 V i 1 , j 1 2 V i 2 , j + ϑ 3 2 d r d ζ i 1 , j + 1 2 d r d ζ i 2 , j
d r d ζ i 1 , j = 11 6 r i 1 , j 3 r i 1 , j 1 + 3 2 r i 1 , j 2 1 3 r i 1 , j 3 Δ ζ
where ϑ = Δ ψ / Δ ζ . The artificial dissipative term γ Δ ζ 2 r ζ ζ [32] is applied in the correction step to compensate for negative dissipation effects in numerical errors, γ = 0 ( ζ 6 π ) and γ = Δ ζ / 2 ( ζ > 6 π ) . Equation (2) can be converted to:
r ψ + r ζ = V Ω + γ Δ ζ 2 r ζ ζ
The fourth-order Adams–Moulton scheme [34] is applied to calculate the induced velocity in the correction step:
V i n d = 1 24 9 V i n d r i , j + 19 V i n d r i 1 , j 1 5 V i n d r i 2 , j 2 + V i n d r i 3 , j 3
Considering the numerical error introduced by Equation (6) and the Biot–Savart law of the linear vortex segment, a modified equation m t e r m is introduced as:
m t e r m = 1 24 2 V ψ 2 Δ ψ 2 + 2 2 V ψ ζ Δ ψ Δ ζ + 3 2 V ζ 2 Δ ζ 2 = 1 48 8 V i , j 9 V i , j 1 + 3 V i , j 2 3 V i 1 , j 4 V i 1 , j 1 + 3 V i 1 , j 2 + V i 2 , j + V i 2 , j 1
To construct an explicit scheme, the term r i , j is split from the artificial dissipative term. Take a r t i to represent the remainder term, then:
a r t i = γ Δ ζ 2 r ζ ζ r i , j 2 Δ ζ 2 = 1 2 Δ ζ 2 2 r i , j 1 + r i , j 2 + r i 1 , j 2 r i 1 , j 1 + r i 1 , j 2
The correction step of the scheme is:
r i , j = 18 r i 1 , j 9 r i 2 , j + 2 r i 3 , j ϑ 2 r i , j + 1 6 r i , j 1 + r i , j 2 + 6 Δ ψ V i , j + m t e r m Ω + a r t i 11 + 3 ϑ 3 γ Δ ψ
The TAFW method and the noise prediction method in the present work are solved by a numerical simulation program developed by the authors and written in Fortran. It should be noted that although wake-based methods have computational efficiency advantages over CFD methods, they can also accurately solve the wake geometry and induced velocity field distribution of rotors. However, it is limited by the accuracy of blade shape modeling and difficult to simulate blade on-surface loads accurately. Furthermore, due to the assumption of incompressible inviscid flow, there may be deviations in its predictions under high-speed forward flight conditions.

2.2. Noise Prediction Method

The F1A formula [35] of the FW–H equations is applied to calculate the rotor aerodynamic noise, with the integration surface located on the surface of the blade. The total noise p can be expressed as the sum of thickness noise p T and loading noise p L .
4 π p x , t = 4 π p T x , t + p L x , t 4 π p T x , t = f   =   0 ρ 0 u ˙ n r 1 M r 2 + ρ 0 u n r ^ i M ˙ i r 1 M r 3 r e t d S + f   =   0 ρ 0 a 0 u n M r M 2 r 2 1 M r 3 r e t d S 4 π p L x , t = f   =   0 p ˙ cos   θ a 0 r 1 M r 2 + r ^ i M ˙ i p cos   θ a 0 r 1 M r 3 r e t d S + f   =   0 p cos   θ M i n i r 2 1 M r 2 + M r M 2 p cos   θ r 2 1 M r 3 r e t d S
where x is the observer’s coordinate; t is time; f = 0 represents blade surface; ρ 0 and a 0 are density and sound speed in undisturbed air, respectively; u n is the local normal velocity of the blade surface; r is the length of the radiation vector; M is the sectional Mach number. The subscript r denotes radiation direction; p is the pressure on the blade surface. The tittle (.) above a variable denotes the rate of variation with respect to source time. The subscript ret indicates that the integrals are evaluated at a retarded time; S is the integral surface.
It takes a certain amount of time for the sound waves from a sound source to reach the observer point after generation by the sources. Take x , t as the spatial and time variables at the observer and y , τ as those at the source, for simplification. When solving the F1A formula, it is a more intuitive way to calculate the sound pressure of a specific observer at a specific time. By solving the retarded time equations for each sound source separately, the total sound pressure can then be calculated by integrating. In the retarded time equations, x n , t n are known quantities and y , τ are unknown quantities to be solved. The retarded time equation is:
τ t n + x n y τ r / a 0 = 0
In order to improve computational accuracy, the calculation process of rotor aerodynamic noise typically introduces numerous matrix operations to consider the rotation, flap, pitch, and other movements of the blades, which will significantly increase the computational workload. Therefore, the source time method proposed by Casalino [36] is applied, which takes the rotor hub time as the reference time, so that each sound source has the same generation time. Due to the avoidance of corresponding matrix operations, the computational workload is significantly reduced. In the source time method, y , τ are known quantities and x n , t n are unknown quantities to be solved. The retarded time equation is now:
τ t n + x n y τ r / a 0 = 0

3. Validation for Proposed Methods

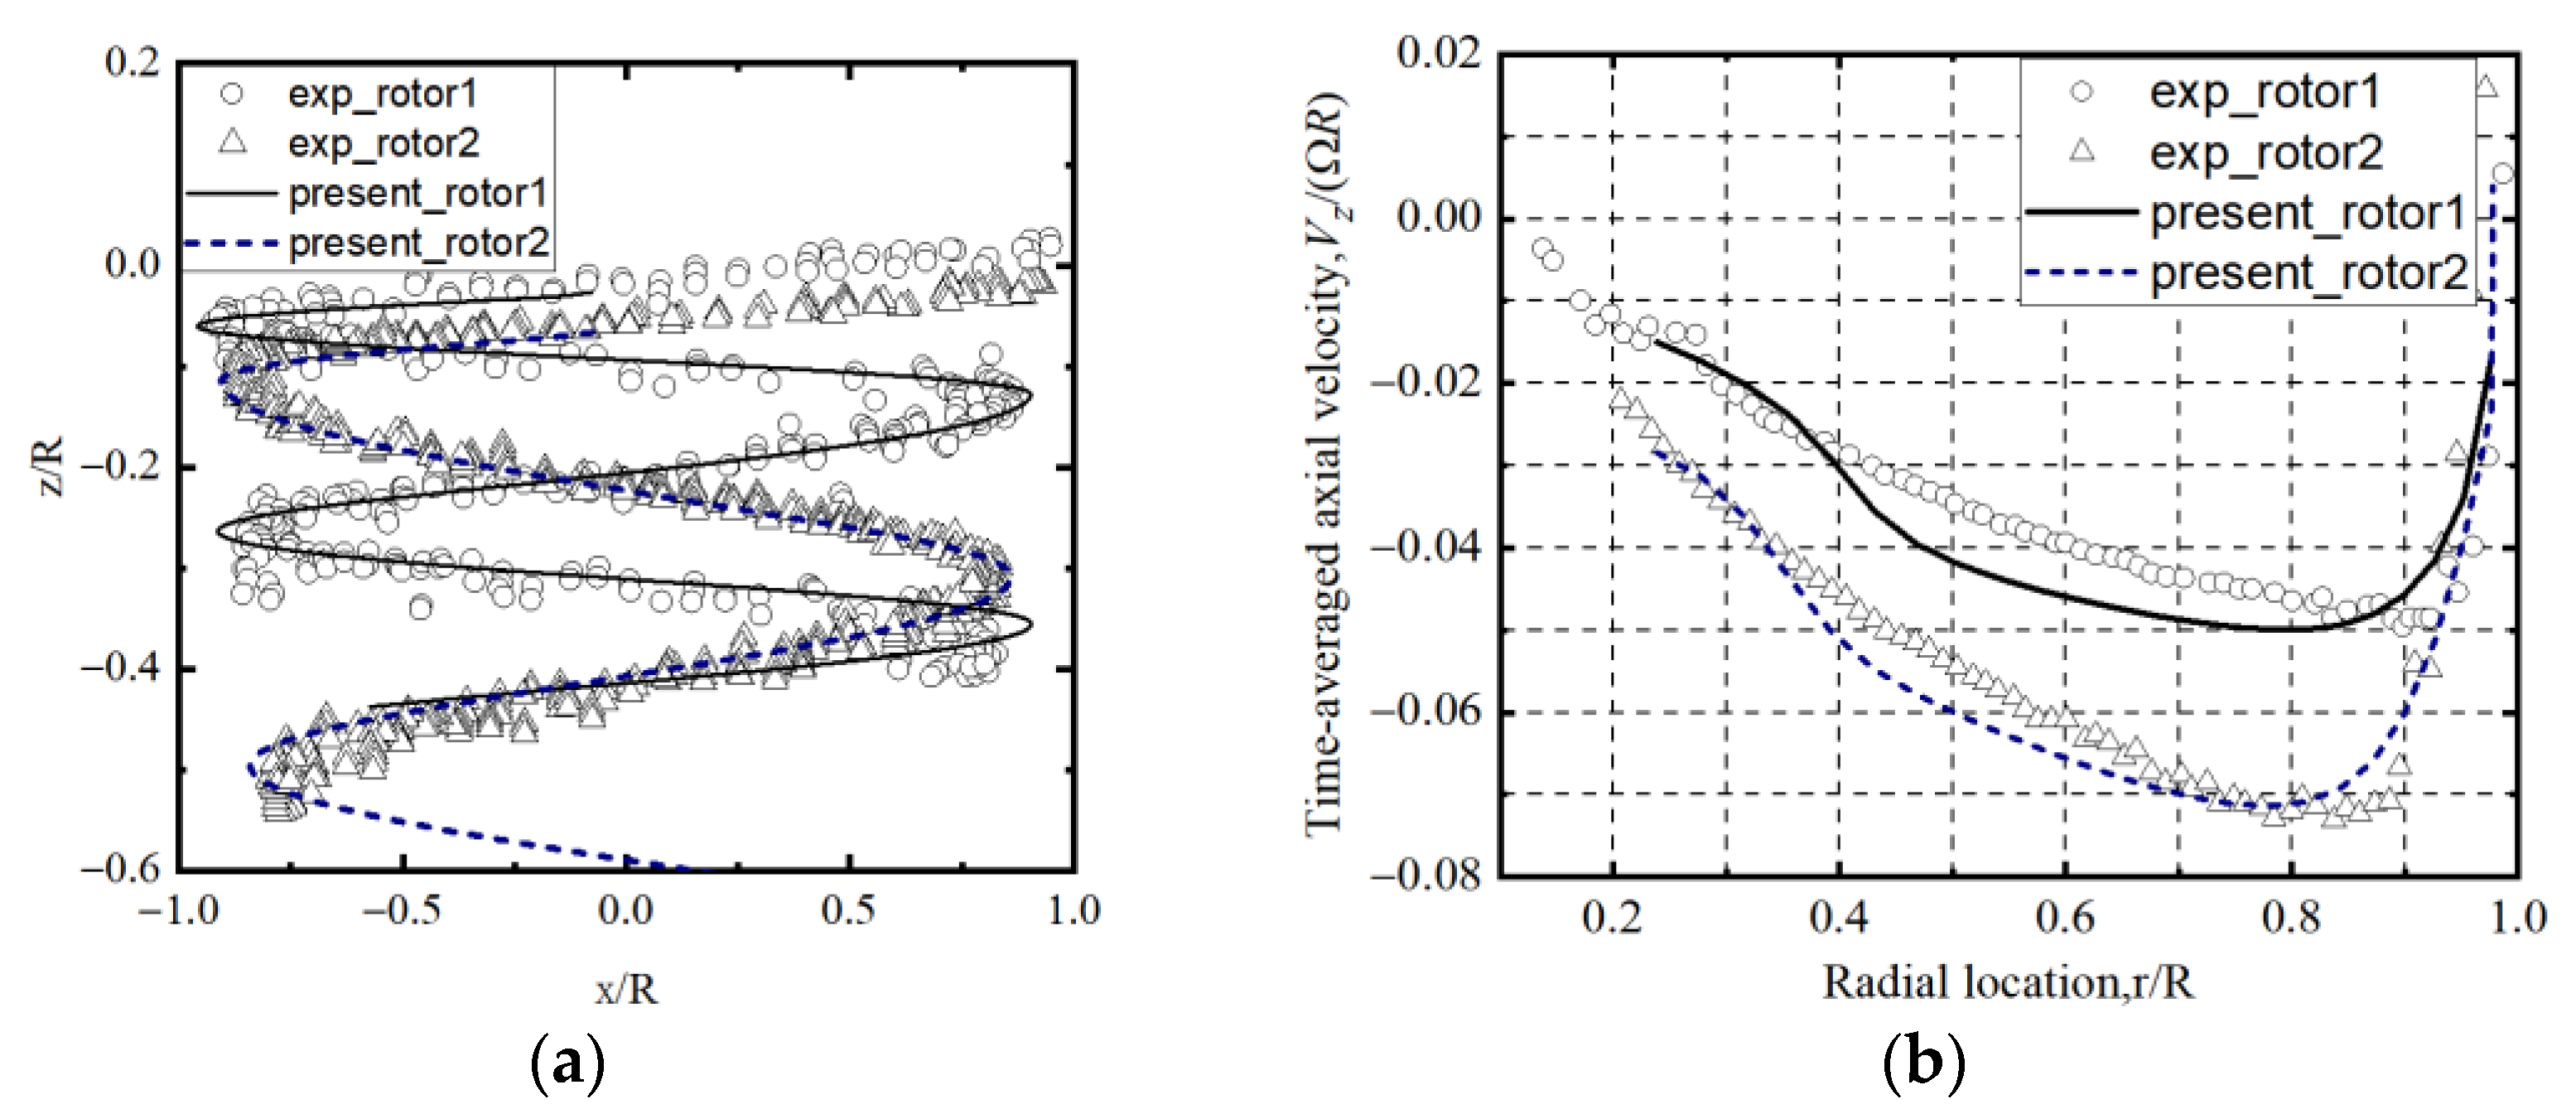
3.1. Hover Tests by the University of Maryland

Two sets of hover and forward flight experiment results conducted by the University of Maryland [37,38] were selected to verify the effectiveness and stability of numerical simulations of hover states. The two rotors have the same blades, with a blade radius of 0.4064 m and a chord length of 0.0425 m. Both adopt the NACA 2415 airfoil profile [39] and are rectangular, non-twisted blades. The difference is that Rotor 1 has only one blade at a rotation speed of 2100 rpm, a 4° collective pitch with a thrust coefficient of 0.0025, while Rotor 2 has two blades at 2010 rpm a 5° collective pitch, and with a thrust coefficient of 0.005.
Figure 2 shows the comparison of tip vortex geometry and time-averaged experimental measurements and predicted results of the proposed TAFW method (the earlier vortex age angle is not displayed due to the vortex lattice model); the figure shows that the predicted results are in good agreement with the experimental data, which proves that the proposed scheme has enough accuracy and numerical stability and can predict the rotor flow field in hovering state.
Figure 3 shows the comparison of the tip vortex geometry of Rotor 2 predicted by the original scheme 3-upwind BDF and the modified scheme proposed in the present work. The tip vortex geometry predicted by the original scheme exhibited significant non-physical diffusion distortion in the far field, while the prediction result of the modified scheme effectively suppressed the diffusion in the far field wake, which is consistent with the experimental tests. The modified scheme effectively improved the prediction accuracy.

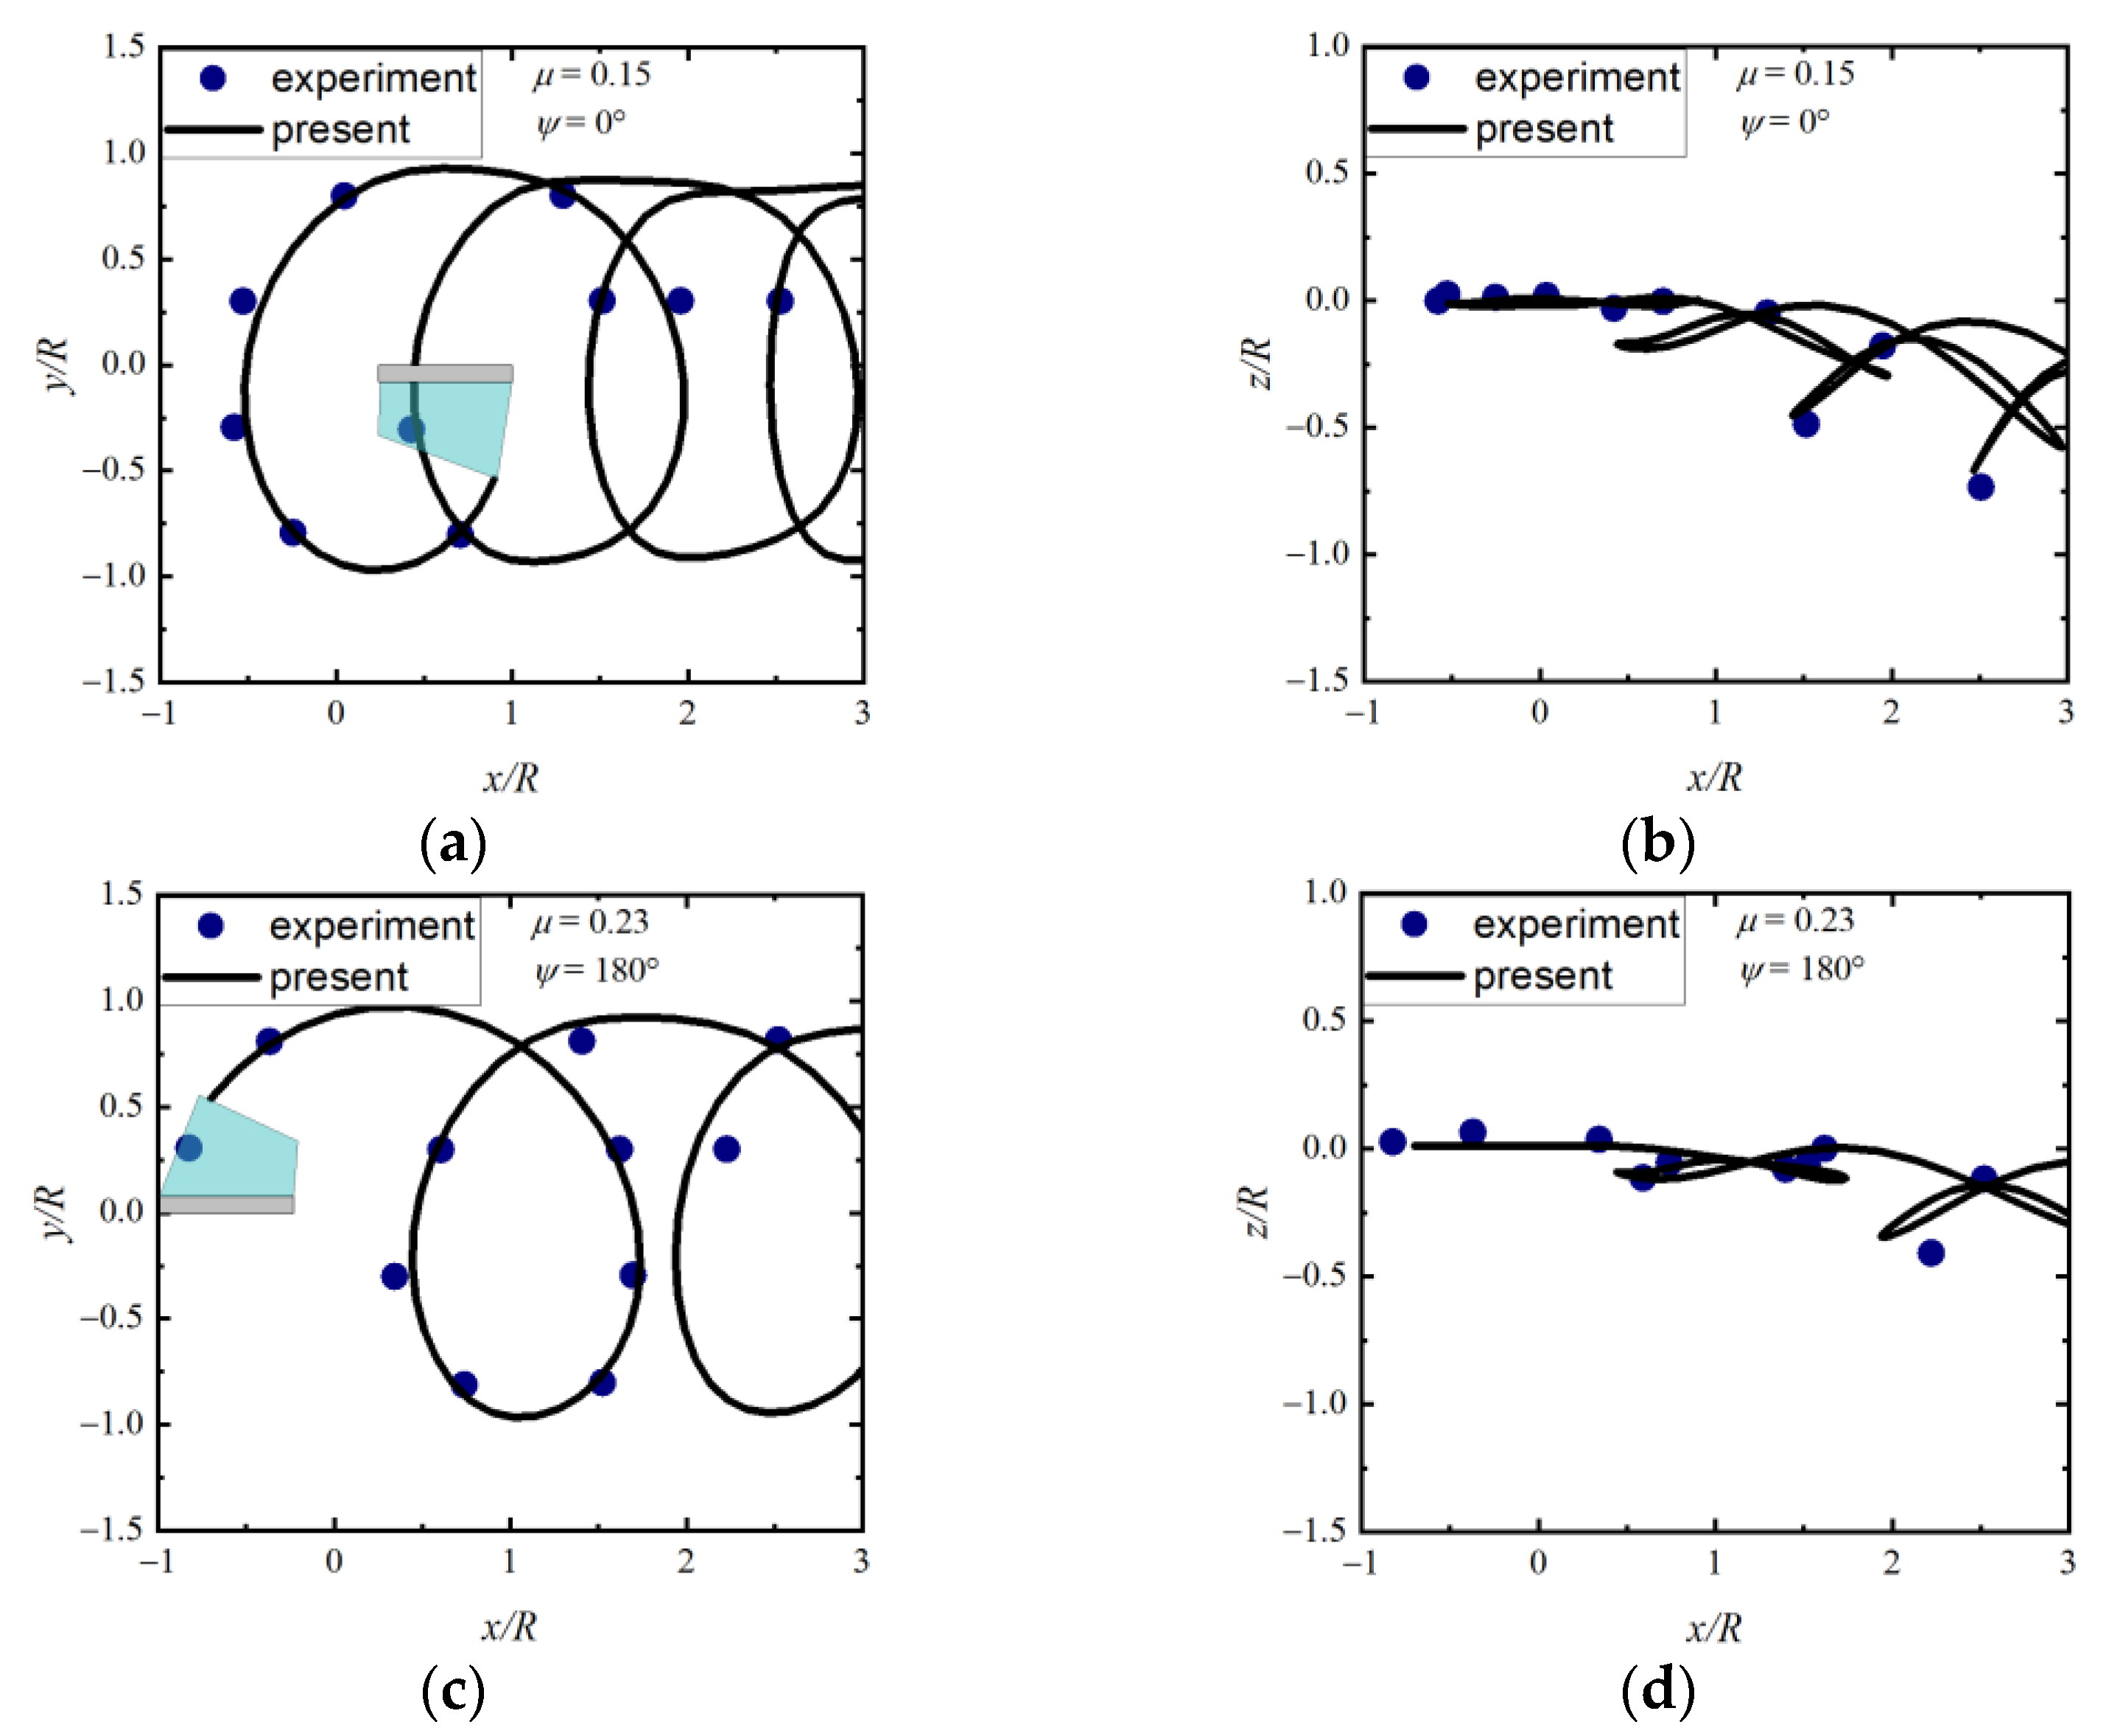
3.2. The Langley 2MRTS Rotor Test

The forward flight test of the Langley 2MRTS rotor [40,41] with an advance ratio of 0.15 is selected to verify the effectiveness of the prediction of forward flight conditions. The rotor had four blades with a radius of 0.86 m, a chord length of 0.066 m, and a pre-cone of 1.5°. The profile adopted the NACA 0012 airfoil. The blade was rectangular with a linear twist of −8° from root to tip. The rotation speed was 2113 rpm. The thrust coefficient is 0.0063 and 0.0064 at forward ratios of 0.15 and 0.23, respectively, and the rotor shaft was both tilted forward at an angle of 3°. Figure 4 shows the comparison of tip vortex trajectories between predicted and measured when the first blade was at azimuth angles of 0° and 180°. Figure 5 shows the comparison of the time-averaged induced inflow distribution between the predicted and experimental results. The predicted tip vortex trajectories, as well as the induced velocity, showed good agreement with the experimentally measured data.

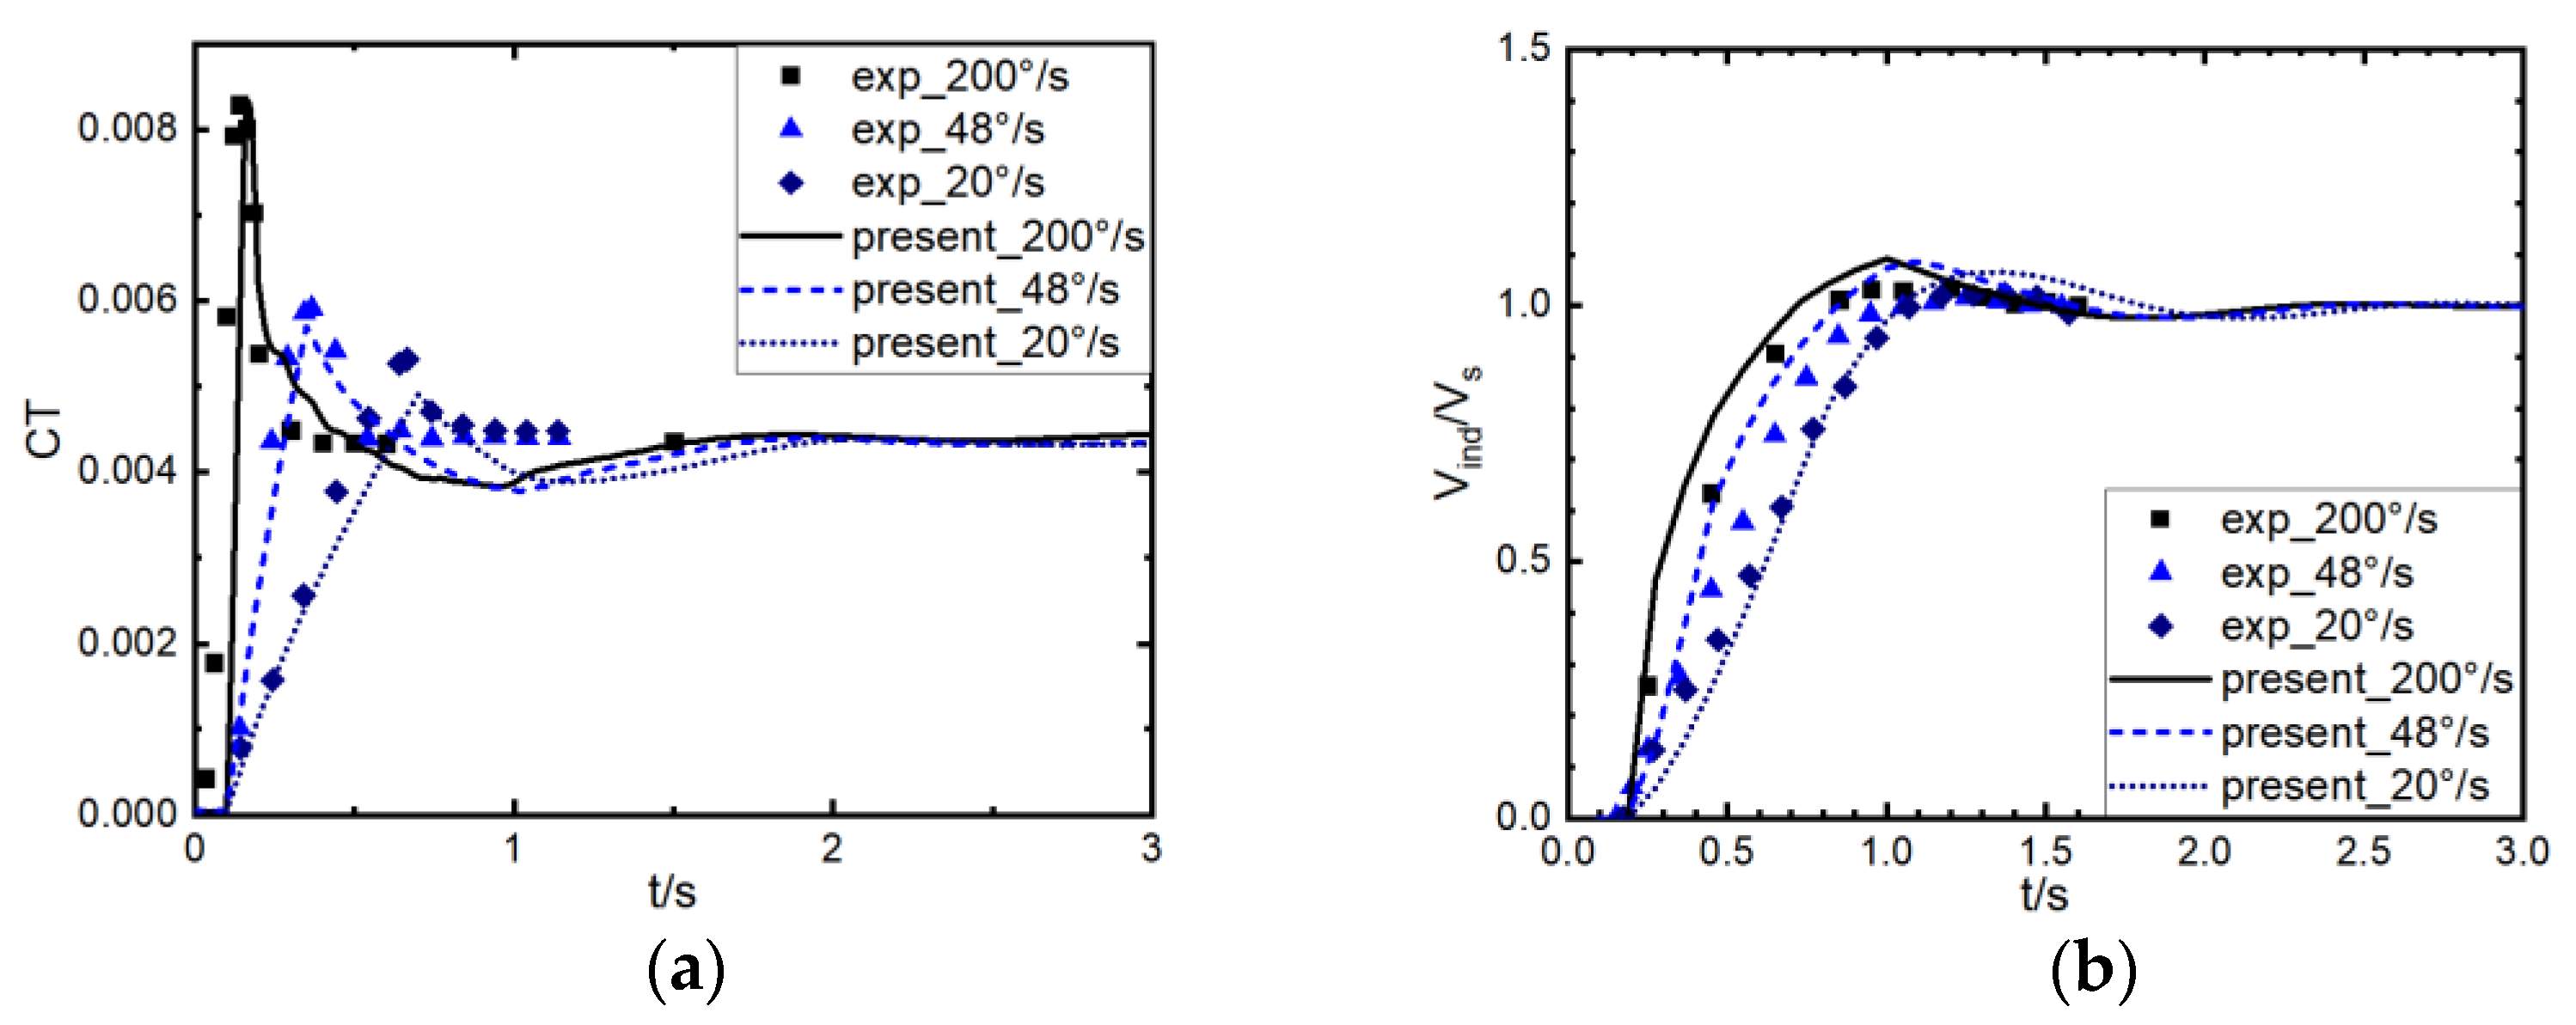
3.3. NACA Rotor with a Ramp Increase in Collective Pitch

The experiment on the NACA rotor with a ramp increase in collective pitch conducted by Carpenter and Fridovich [42] was selected to verify the effectiveness of the prediction of maneuvering flight conditions. The rotor had three blades with a radius of 5.7912 m and a chord length of 0.2551 m. The profile adopted the NACA 23015 airfoil. The blade was rectangular with no twist. The rotation speed was 220 rpm. In the three sets of experiments, the collective pitch increased from 0° to 12° with pitch rates of 200°/s, 48°/s, and 20°/s, respectively. Figure 6 shows the comparison of the thrust coefficient as well as the induced velocity between the experimental and predicted values in three different conditions, indicating that the TAFW method proposed in the present work can accurately predict the aerodynamic response in the analysis of ramp increases in collective pitch.

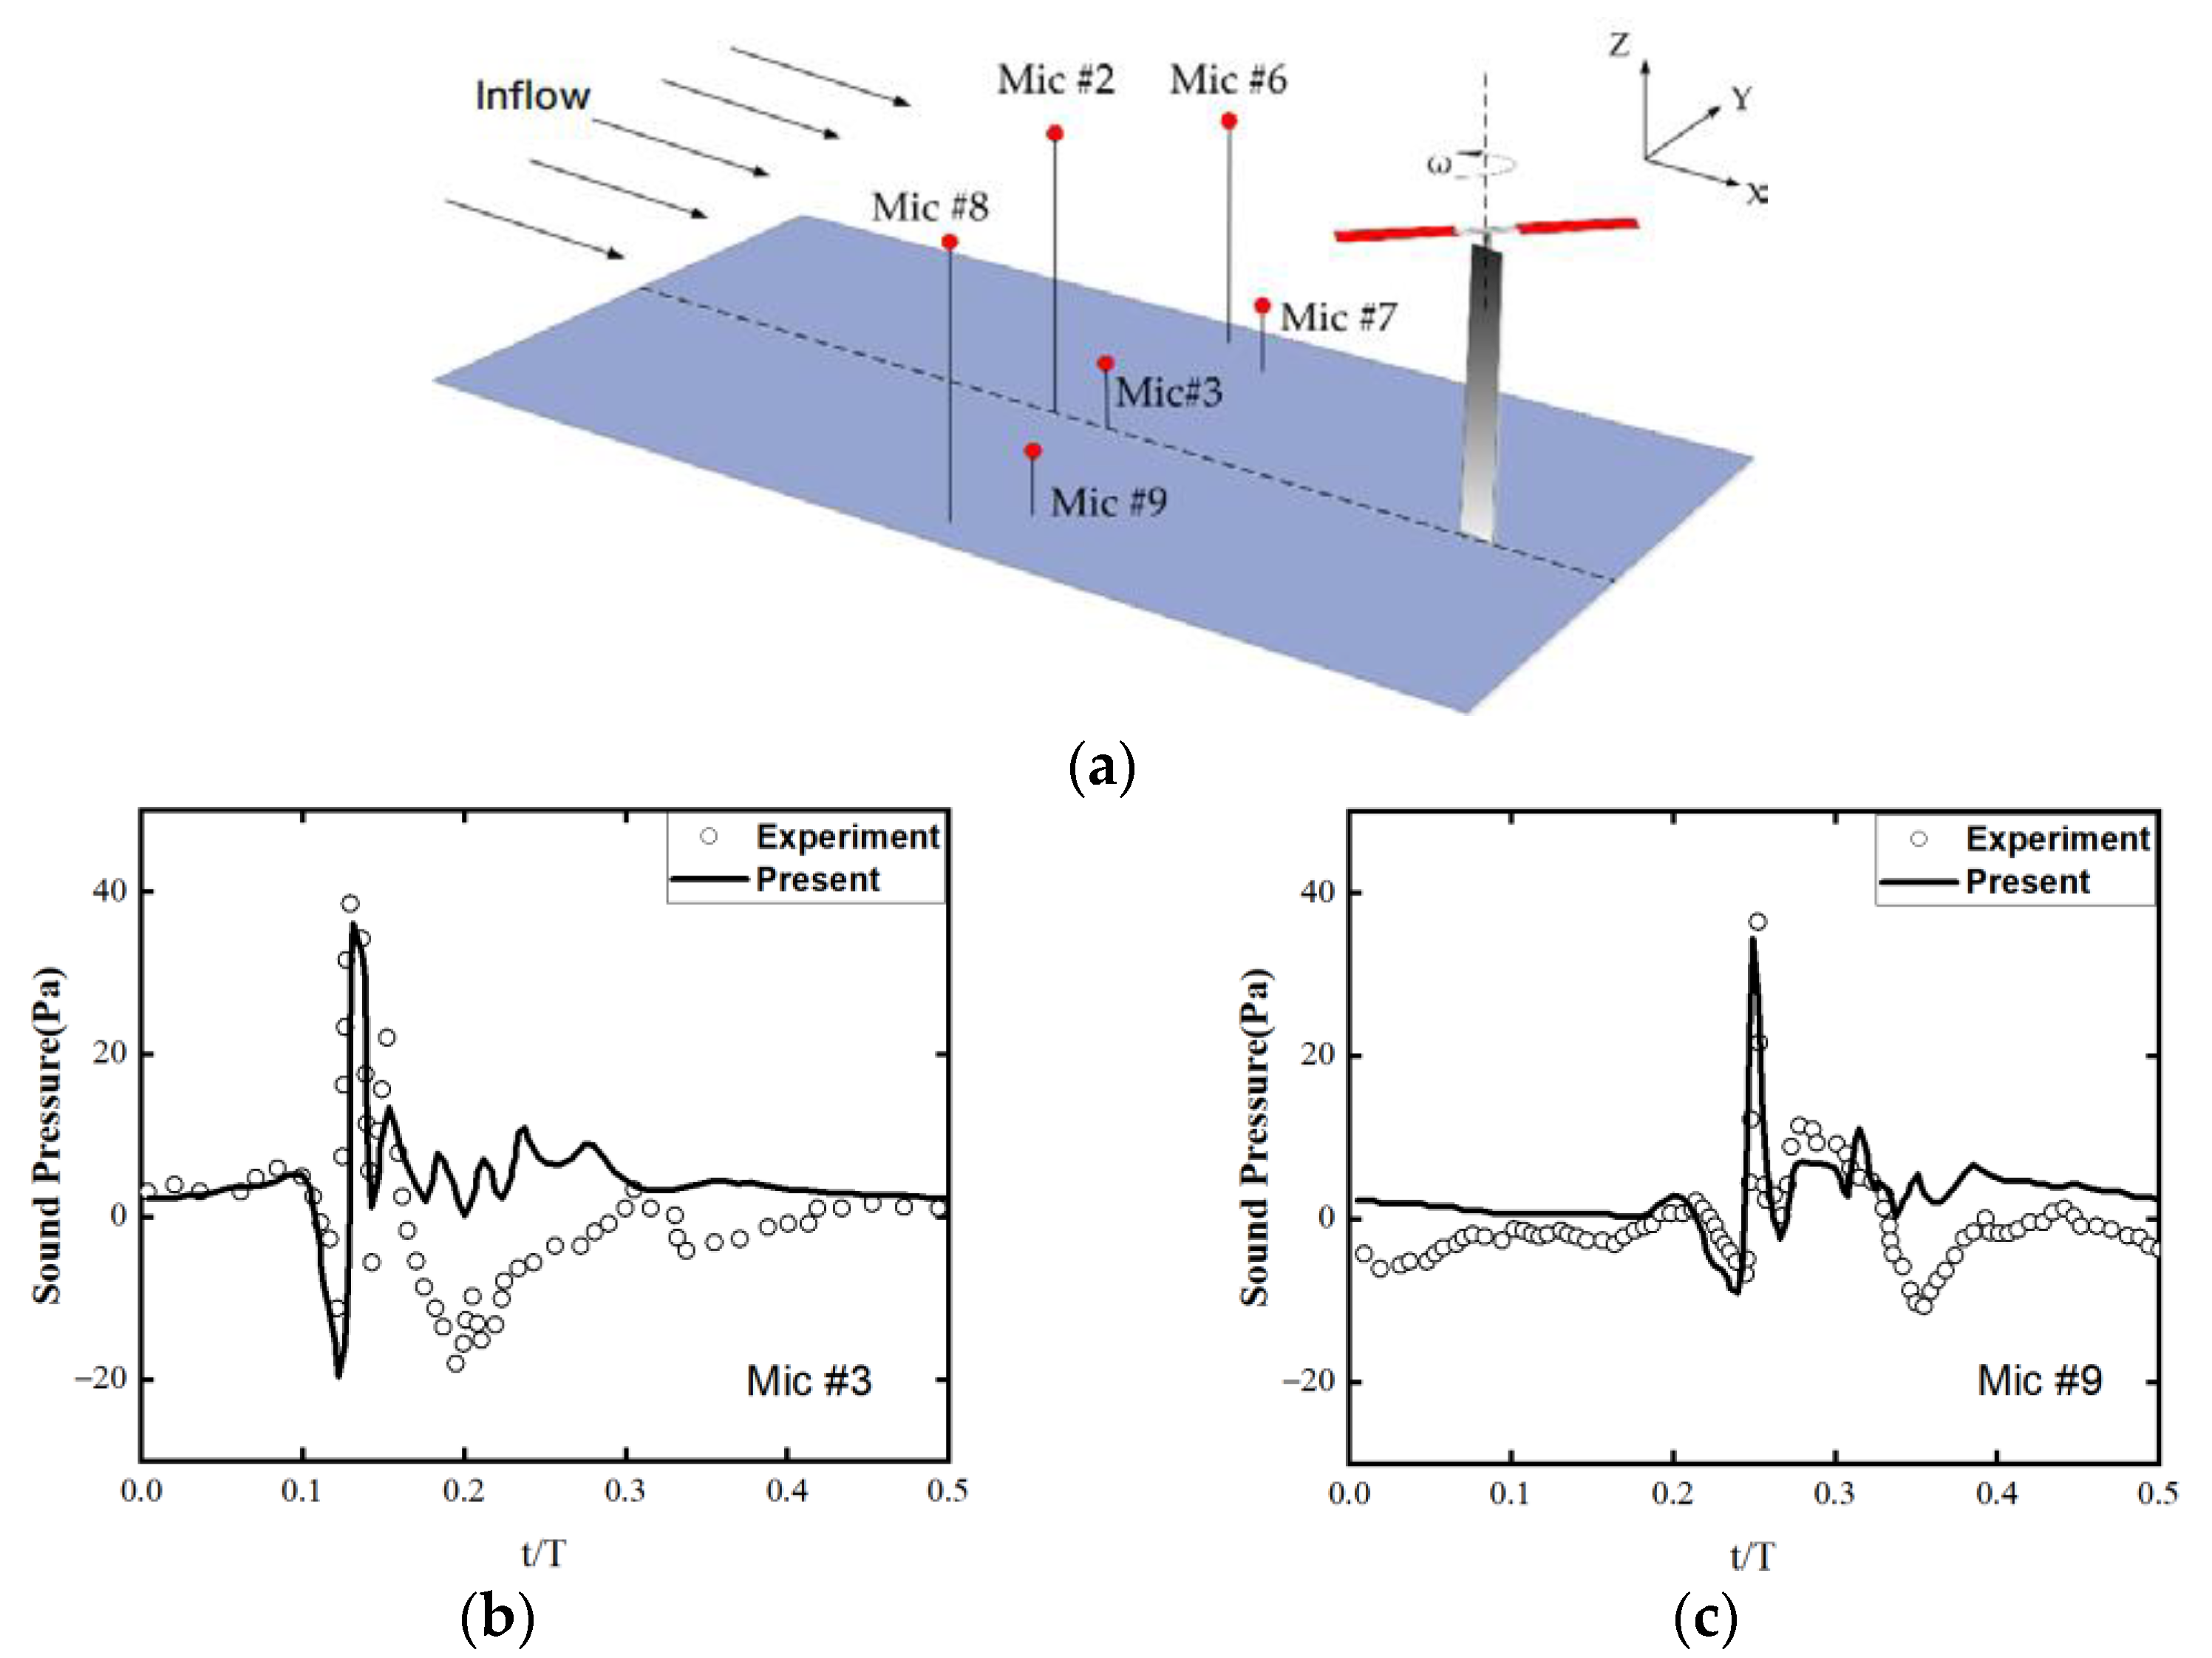
3.4. Aeroacoustic Experiment with AH-1/OLS

AH-1/OLS is a 1:7 scaled model of the AH-1 helicopter rotor, with two blades, a radius of 0.958 m, and a chord length of 0.104 m. It is widely used in aerodynamic noise verification [43], as shown in Figure 7a. The profile adopted the BHT-540 airfoil (Bell 540 airfoil, a modified NACA 0012). The blade was rectangular with a linear twist of −10° from root to tip. Case 10014 is selected to verify the proposed noise prediction method. It was a blade vortex interference (BVI) state; the blade tip Mach number was 0.664, with an advance ratio of 0.164. The thrust coefficient was 0.0054, and the rotor shaft was tilted backward at an angle of 1°. The thrust coefficient was 0.0054, and the rotor shaft was tilted backward at an angle of 1°. Select observation points #3 (−2.85 m, 0 m, −1.65 m) and #9 (−2.47 m, −1.43 m, −1.65 m) that can reflect the characteristics of the BVI phenomenon as the sound pressure time history references. Figure 7b,c shows that the predicted waveform and peak value of the sound pressure time histories of the two observers showed good agreement with the experimental values, so the proposed methods can be effectively applied in the prediction of rotor aeroacoustic noise.

4. Aerodynamic and Noise Responses of the Rotor with a Ramp Increase in Collective Pitch

The analysis of a ramp increase in collective pitch is based on the parameters of the Bell 206B-3 rotor. The rotor has two blades with a radius of 5.08 m, a chord length of 0.33 m, and a pre-cone of 2.25°. The profile adopts a modified “Droop Snoot” airfoil with a thickness of 11.3%. The blade is rectangular with a linear twist of −11.1° from root to tip [3]. In the simulations, the rotor frequency was set to 6.25 Hz, and the numerical analyses were conducted on the isolated main rotor.

4.1. Ramp Increase in Collective Pitch in Hover

The initial collective pitch in hover was set to 8.5°, with a thrust coefficient of 0.0034. The noise observers were taken on the lower hemisphere surface centered at the rotor hub, with a radius of 3 R. The ramp increase in the three analyzed cases was initiated at 0.16 s and then experienced, respectively, an increase of 4° in collective pitch at a rate of 25°/s (case 1), an overall increase of 4° in collective pitch at a rate of 50°/s (case 2), and an overall increase of 2° in collective pitch at a rate of 50°/s (case 3).
Figure 8 shows the variation of the instantaneous thrust coefficient of the rotor under the three operating conditions, and Figure 9 shows the variation of the nondimensional normal force and time derivative of the normal force at r = 0.8 R. With ramp increases in collective pitch in hover, the aerodynamic force at the rotor increased rapidly as the collective pitch increased, and the instantaneous thrust coefficient experienced an overshoot relative to the steady-state value. After the ramp increase was stopped, the thrust coefficient gradually returned to the steady-state value. The aerodynamic force showed a trend of overshoot, oscillation, and convergence. The time derivative of normal force jumped to its maximum value at the initiation of the ramp increase, then gradually decreased in amplitude before the termination of the ramp increase, after which it jumped to its minimum value at the termination of the ramp increase, and finally increased rapidly to around 0, with an amplitude three orders of magnitude smaller than that during the ramp change, resulting in a sustained change in aerodynamic load.
Figure 10 shows the variation of thickness and loading noise sound pressure level distribution for case 1. The sound pressure levels were evaluated over three successive revolutions of the rotor. The ramp increase in collective pitch brought onlya limited change to the distribution of thickness noise, and the sound pressure level remained almost the same at the same elevation angle, while the loading noise exhibited obvious directionality during and a short time after the ramp increase was applied. After a longer time (additional rotor revolutions, not shown), the loading noise distribution converged to the typical steady-state hover pattern again.
Figure 11 shows the variation of thickness noise sound pressure time history of case 1 at the in-plane observer, and Figure 12 shows the variation of loading noise sound pressure time history of cases 1 and 2 to an observer with the same elevation angle of 30° at azimuth angles of 0° and 40°, respectively. The variation in sound pressure time history of thickness noise was not significant, while the sound pressure time history of loading noise exhibited a variation of increase-decrease-convergence to a steady-state value in amplitude similar to the variation of the aerodynamic load. Considering the F1A formula in Equation (10), the conclusion is that the overshoot of sound pressure amplitude during the ramp increase in collective pitch comes mainly from the load derivative term, while the subsequent increase in sound pressure amplitude relative to the initial condition comes mainly from the increase in load amplitude caused by the increase in collective pitch. Figure 12 also shows that during and a short time after the ramp increase, while the flow field near the rotor is still unstable, the loading noise sound pressure fluctuations vary with the azimuth angle of the observers, even with the same elevation angle, which is the source of the directionality of loading noise during this time. During the time that the load derivative is greater, the loading noise generated at the source is greater, and the sound pressure received by the observer directly in the propagation path is also greater, thus resulting in a directionality in the distribution of loading noise.
Since the change in thickness noise is not significant during the ramp increase in collective pitch, only the variation of loading noise will be presented in the following reports. Figure 13 shows the variation of the loading noise sound pressure level distribution in all three cases. With the same increase in collective pitch, the larger the pitch rate, the greater the loading noise sound pressure level. This is because the overshoot amplitude and load derivative terms at the higher pitch rate are greater than those at the lower pitch rate, and the influence of the load derivative term is more significant. Also, with the same pitch rate, the longer the ramp change interval, the greater the loading noise. This is due to the effects of load amplitude and high load derivative duration. After the ramp increase is completed, there are also significant differences in the distribution of sound pressure levels due to the difference in loads caused by different increases in collective pitch.
Figure 14 shows the variation of the loading noise sound pressure time history of cases 1 and 2 at an observer with an elevation angle of 30° and an azimuth angle of 130°. After the ramp increase in collective pitch was initiated, the first peak and third peak of case 2 were higher, after which each peak of case 1 was higher. The variation of case 2 against case 1 indicates that during the ramp increase, a higher pitch rate can introduce a higher overshoot in the loading noise sound pressure by introducing a higher load derivative term. After the ramp increase terminates, the load term influenced by the net increase in collective pitch determines the variation of loading noise.
No other angular or translational velocity aside was apparent during the ramp increase in collective pitch, which means that the start and stop azimuth angle can be equivalently changed to any moment of rotor rotation, and hence the directionality of loading noise during the ramp increase in collective can be rotated equivalently. The start and stop azimuth angles of the ramp increase the directionality of the transient resultant noise in the sound field distribution.

4.2. Ramp Increase in Collective Pitch in Forward Flight

The analysis of aerodynamics and noise response with ramp increase in collective pitch in forward flight was with an advance ratio of 0.1 and a thrust coefficient of 0.0034. The rotor shaft was tilted forward at an angle of 4.3°. By conducting a wind tunnel trim, the initial blade pitch angle was set to θ = 6.91 ° + 2.41 ° cos ψ + 1.3 ° sin ψ , and the blade flap angle was set to β = 2.25 ° 3.1 ° cos ψ 0.2 ° sin ψ .
The ramp increase in three cases was initiated at 0.16 s, then experienced an overall increase of 4° in collective pitch with a rate of 25°/s (case 1), an overall increase of 4° in collective pitch with a rate of 50°/s (case 2), and an overall increase of 2° in collective pitch with a rate of 50°/s (case 3), respectively. A fourth case was initiated at 0.2 s, then experienced an overall increase of 4° in collective pitch with a rate of 50°/s (case 4).
Figure 15 shows the variation of the time-averaged thrust coefficient of all four cases in forward flight with an evaluation interval of half a periodic rotor rotation. The thrust coefficient shows an overall trend of overshoot-oscillation-convergence. After the ramp increase was terminated, the flow field converged to the new steady state faster, so that the oscillation of the time-averaged thrust coefficient shows a much smaller amplitude compared with the hover cases. Because the initiation and termination of the transient change in collective pitch in each case are not aligned with the start and end times of the sampling period, the time-averaged thrust coefficient seems to be of different slopes with the same pitch rate, or the peak of the overshoot of the thrust coefficient is flattened.
Figure 16 and Figure 17 show the variation of the nondimensional normal force of the two blades, overall and in each of the four cases, in forward flight at r = 0.85 R during t = 0.15 s–0.5 s and t = 0.5 s–1.0 s (basically, in the first half-second and the second half-second of analysis). The load disturbance caused by BVI is marked by the blue circles in the figures. In Figure 16, the area marked by the gray block indicates the interval of the ramp increase in collective pitch. The difference in variations of nondimensional normal force during the initial portion of the ramp change was not significant. As the ramp change interval increased and the start azimuth angle changed, the difference in the disturbance process of each blade load during the ramp change increased, during which the overall amplitude of the rotor load was significantly affected by the ramp change, while the amplitude of the load disturbance caused by BVI did not change significantly due to the hysteresis of the flow field. After the ramp change terminated, as the flow field developed, the overall trend of blade loads in the three cases with the same collective pitch increment converged to the same value quickly. However, during this period, the BVI exhibited significant differences in intensity due to the differences in flow field evolution caused by different pitch rates, ramp change intervals, and start azimuth angles. During and for a short time after the ramp change, the load variation and the load disturbance caused by BVI of each blade in the same case also showed significant differences at the same azimuth due to the continuous evolution of the flow field during the transition period. As shown in Figure 17, within a few periods after the termination of the ramp change, the blade loads stabilize rapidly. The load fluctuations caused by the BVI gradually stabilized as the flow field converged to new steady state within a few periods, while the overall load disturbances reached a stable state faster. The difference in load variation with azimuth between the two blades also rapidly decreased and gradually became consistent. Figure 17d also shows that, although the collective pitch increase in this case is small, the BVI intensity of the new steady state is significantly stronger than in other cases. However, due to its lower load amplitude, the distribution of loading noise will be more complex with the combined influence of both factors.
Figure 18 shows the Lambert projection expansion of the variation of loading noise sound pressure level distribution of the various cases with the same start time of 0.16 s in forward fight. When the increase in collective pitch is the same, a larger pitch rate results in a larger load amplitude and time derivative of load during and a short time after the ramp change, resulting in higher loading noise; also, due to its earlier termination of the ramp change, the development of the flow field is slightly faster than that of the lower pitch rate, which leads to a faster convergence of the loading noise distribution toward the new steady-state noise distribution. When the pitch rate is the same, smaller net increments in collective pitch usually lead to lower load amplitude and time derivative of load, and thus generate lower loading noise than that of larger collective pitch increments. However, because of the significant differences in the location and intensity of BVI between the two cases studied in the current work and the smaller increments in collective pitch caused by the larger load disturbance caused by BVI, the spatial distribution direction of the high loading noise areas generated by the two cases are different.
Figure 19 shows the variation in loading noise sound pressure time history of the various cases with the same start time at three different observers. Due to the influence of the location of BVI, there are significant differences in the characteristics of BVI noise in the time history of sound pressure at each observer. After a larger increment of collective pitch with a larger pitch rate, the loading noise sound pressure showed a significant increase in peak value in a short duration of time, followed by a rapid decrease after the ramp change terminated. During and for several rotor rotation cycles after the ramp change, the rotor flow field is in a transitional stage toward a new steady state. During this stage, the periodicity of sound pressure at each observer is much weaker. In the selected cases studied in the present work, the BVI led to a rapid instantaneous disturbance in the loading noise sound pressure; thus, loading noise showed a significant unsteady variation during 4 to 5 rotation cycles. Especially at the observer where BVI noise dominated, the amplitude of loading noise during the transition period varied sharply, indicating that the ramp increase in collective pitch has a significant impact on the distribution of BVI in forward flight.
Figure 20 shows the variation in loading noise sound pressure time history of the various cases with the same start azimuth angle at an observer with an elevation angle of 40° and an azimuth angle of 130°. In summary, when there is a ramp increase in collective pitch in forward flight, there are mainly three timescales of variation in loading noise: short-term, medium-term, and long-term. The short-term change mainly refers to the loading noise change caused by the drastic variations in load and load derivative caused by the pitch rate and collective pitch increment during the ramp change. The medium-term change mainly refers to that caused by the flow field development during the transition state to the new steady state. Since the flow field is in dynamic evolution at this stage, the loading noise during the period often shows a strong aperiodicity. If BVI occurs during the period, the position and intensity of BVI are often significantly different in each rotor period. The long-term variation refers to the variation caused by the different steady-state rotor operating conditions before and after the perturbing ramp change to the new pitch. The long-term condition will continue until the next transient control or maneuvering flight is initiated.
Figure 21 shows the variation of loading noise sound pressure level distribution in cases 2 and 4 with different start times for ramp changes in forward fights. The variation in sound pressure level showed a significant difference between the two cases, especially during the ramp change. However, this difference rapidly decreases within a few cycles after the termination of the ramp change.
Figure 22 shows the variation in loading noise sound pressure time history of the various cases with different start times at different observers. During the ramp change, the load amplitudes caused by the different start and end azimuth angles of the ramp change resulted in significant differences in the time history of loading noise and sound pressure at each observer. After the ramp change terminated, for observers where the characteristics of BVI noise were not obvious, the difference in the time history of loading noise sound pressure of the two different start times rapidly decreased. However, for observers where the characteristics of BVI noise were more obvious, there is a significant difference in the peak sound pressure caused by BVI. This also indicates that different transient control start and stop azimuth angles have a significant impact on the intensity of BVI in the transition state in forward flight.
As shown by Figure 21 and Figure 22, it can be concluded that the start and stop azimuth angles of the transient ramp change are important parameters that affect load and noise responses. Due to the asymmetry of the flow field in forward flight, the influence of the start and stop azimuth angles is more obvious in conditions with ramp increases in collective pitch, becoming an important factor affecting the short-term variations in aerodynamic load and loading noise responses. Although the influence of start and stop azimuth angles on load and loading noise is limited to half to one rotor rotation period after the moment of the initiation or termination of the ramp change, the maneuvering flight process itself involves continual changes of pitch, pitch rate, and motion state. The continual changes in pitch rate (equivalent to the initiation and termination of new transient ramp changes) expand the influence of start and stop azimuth angles throughout the entire maneuvering flight process. It is impossible to control the starting and ending angles of the ramp change through manual control; however, with the development of modern fly-by-wire control systems and the future development and application of airborne electronic devices, such as flight control computers, it may become routine for these devices and systems to control the start and stop azimuth angles of pitch changes and so optimize rotor loading disturbances, thus providing low-cost control of helicopter maneuvering flight noise. These are technologies worthy of research and development.

5. Conclusions

A TAFW method using modified 3-upwind-BDF suitable for rotor aerodynamic simulation in steady-state flight and transient maneuvers was proposed, and a set of aerodynamic noise prediction methods for rotors was established based on the source time method to solve the F1A formula of the FW–H equations. Then, multiple numerical cases were calculated, and the results closely matched independent experimental data. The verified procedure permitted the calculation of aerodynamic and noise responses to ramp increases in collective pitch in hover and forward flight and determined the influence of the collective pitch rate, the total increase in collective pitch, and the start and stop azimuth angles. The following conclusions were obtained:
(1)
The numerical cases verify that the modified TAFW scheme proposed has good numerical stability and simulation accuracy for the wake shape and induced velocity distribution of the rotor in steady hover and forward flight, and good consistency with the test for the aerodynamic load simulation of ramp increase in collective pitch. The rotor aerodynamic noise analysis method established also has good effectiveness in predicting rotor aerodynamic noise.
(2)
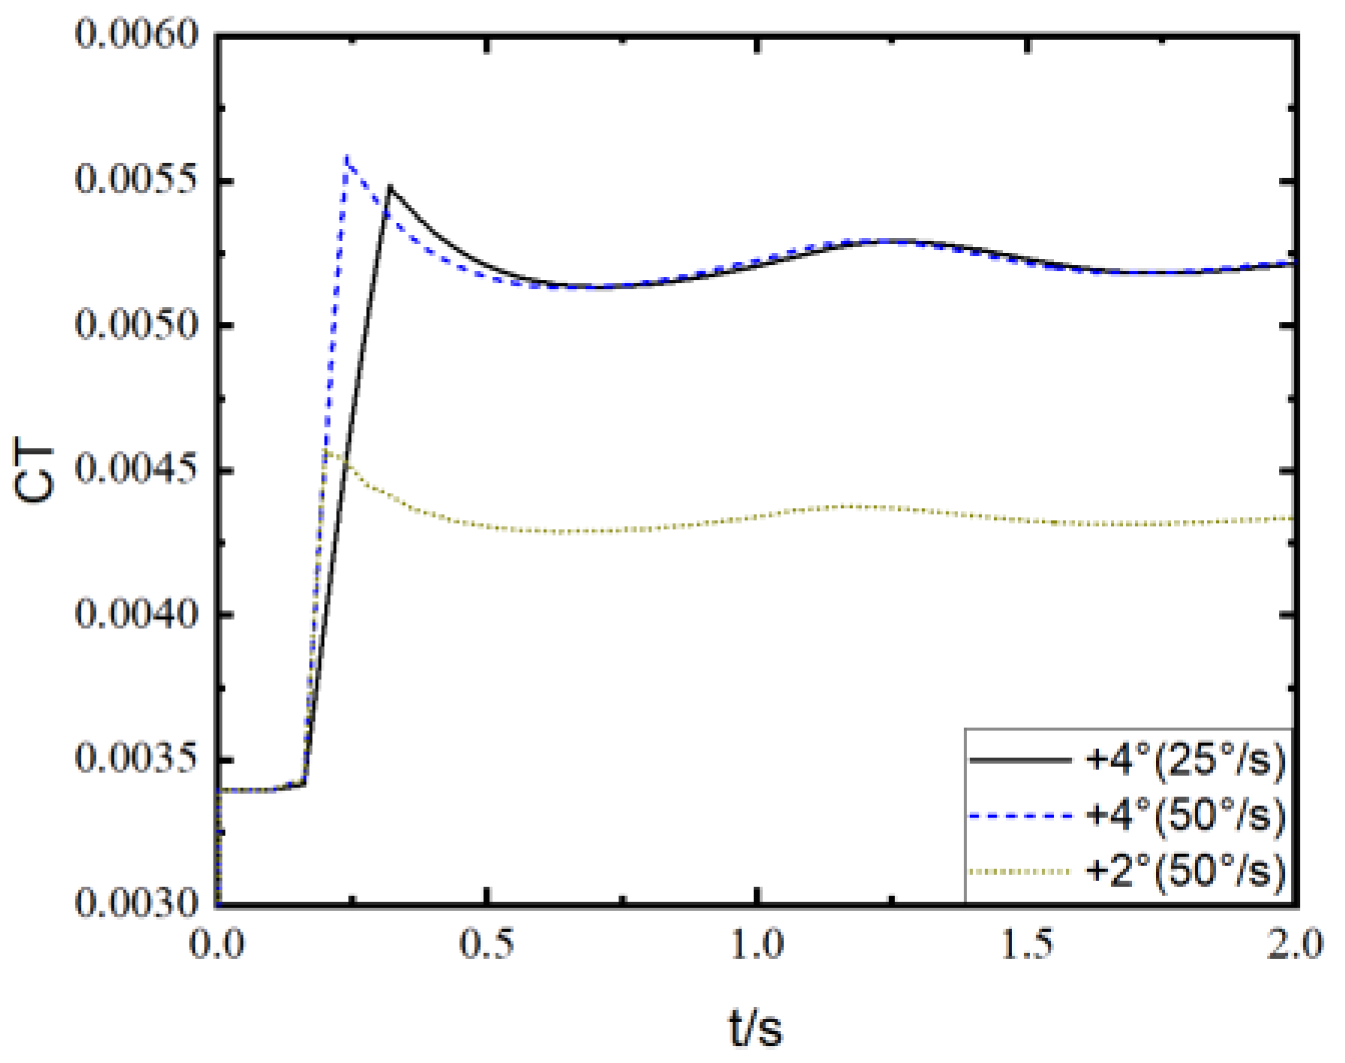
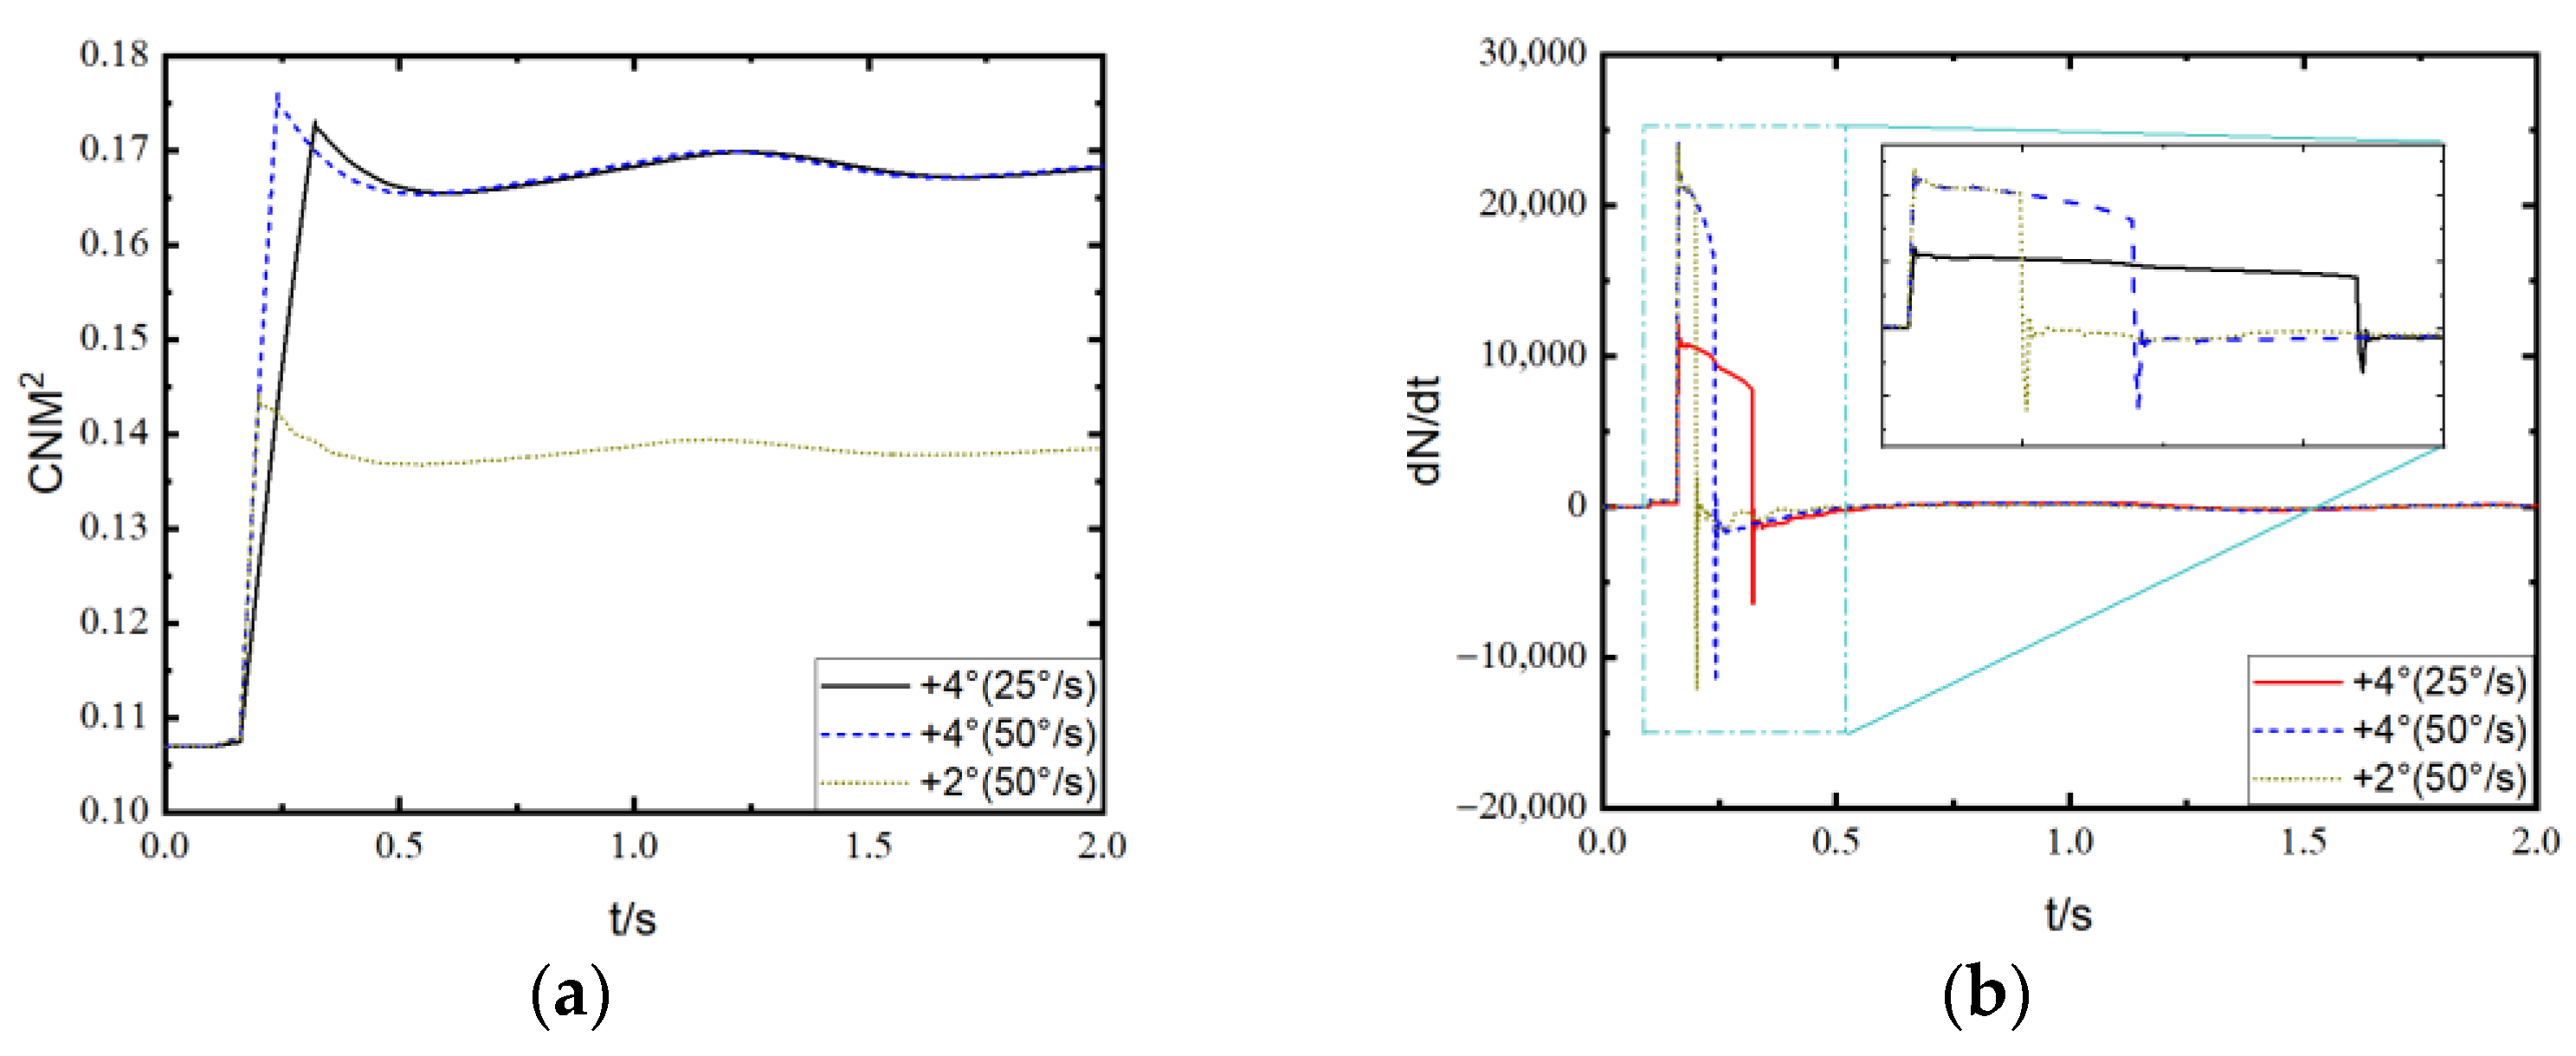
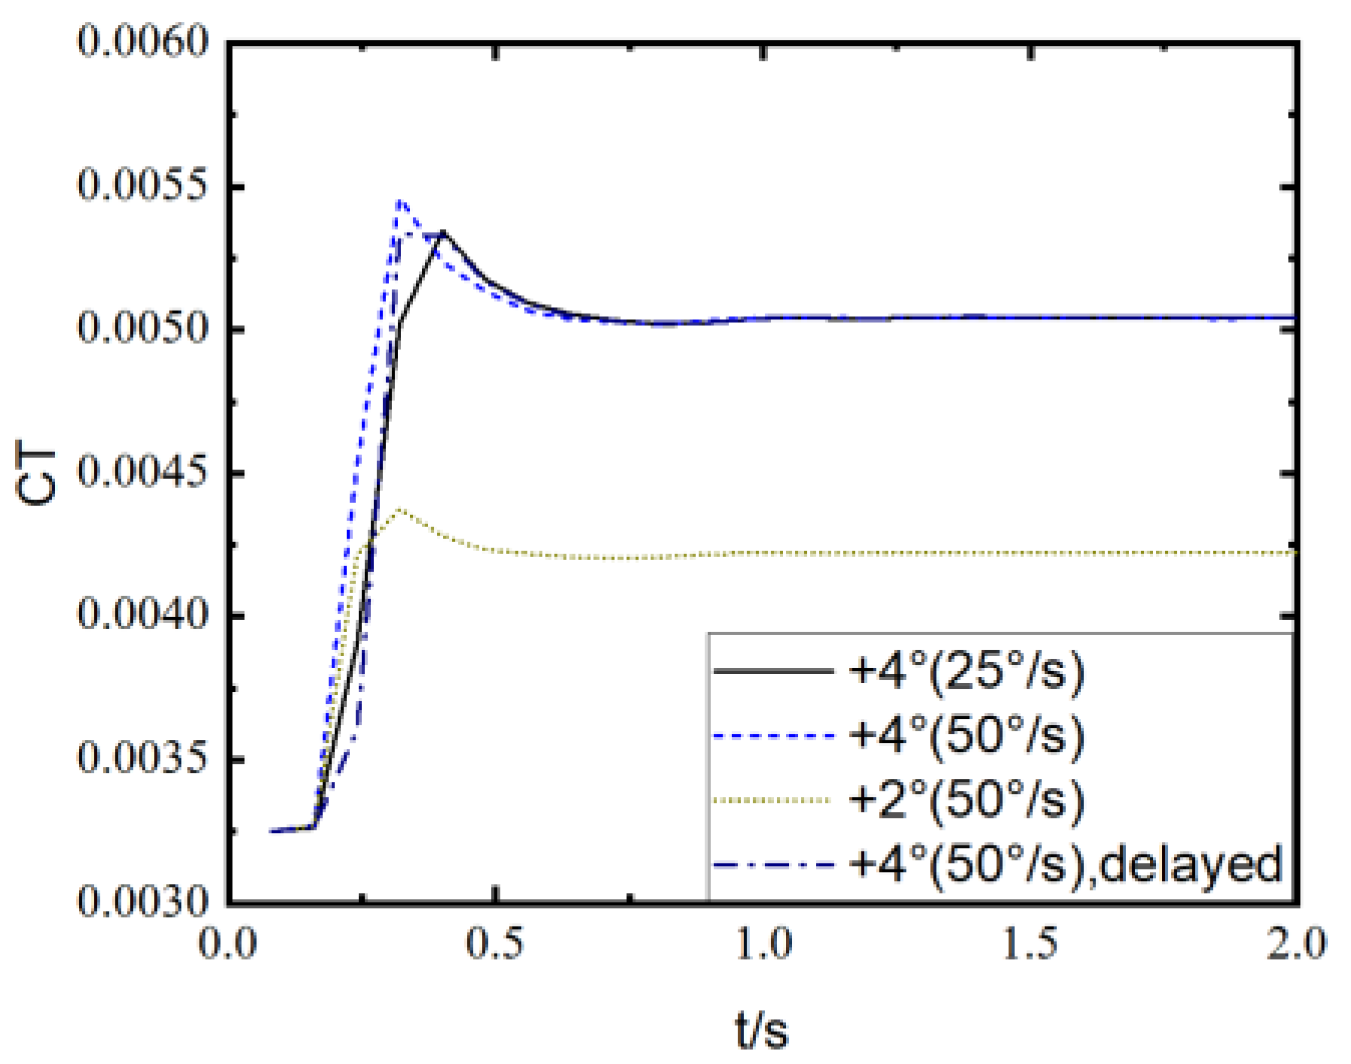
The ramp increase in collective pitch in hover leads to a rapid increase, overshoot, oscillation, and convergence variation in the aerodynamic force of the rotor. The time derivative of aerodynamic load suddenly increases at the initiation of the ramp increase in collective pitch, and the amplitude is large but gradually decreases during the ramp change until it suddenly decreases at the termination. The amplitude of the load derivative after the ramp change is much smaller than that during the ramp change.
(3)
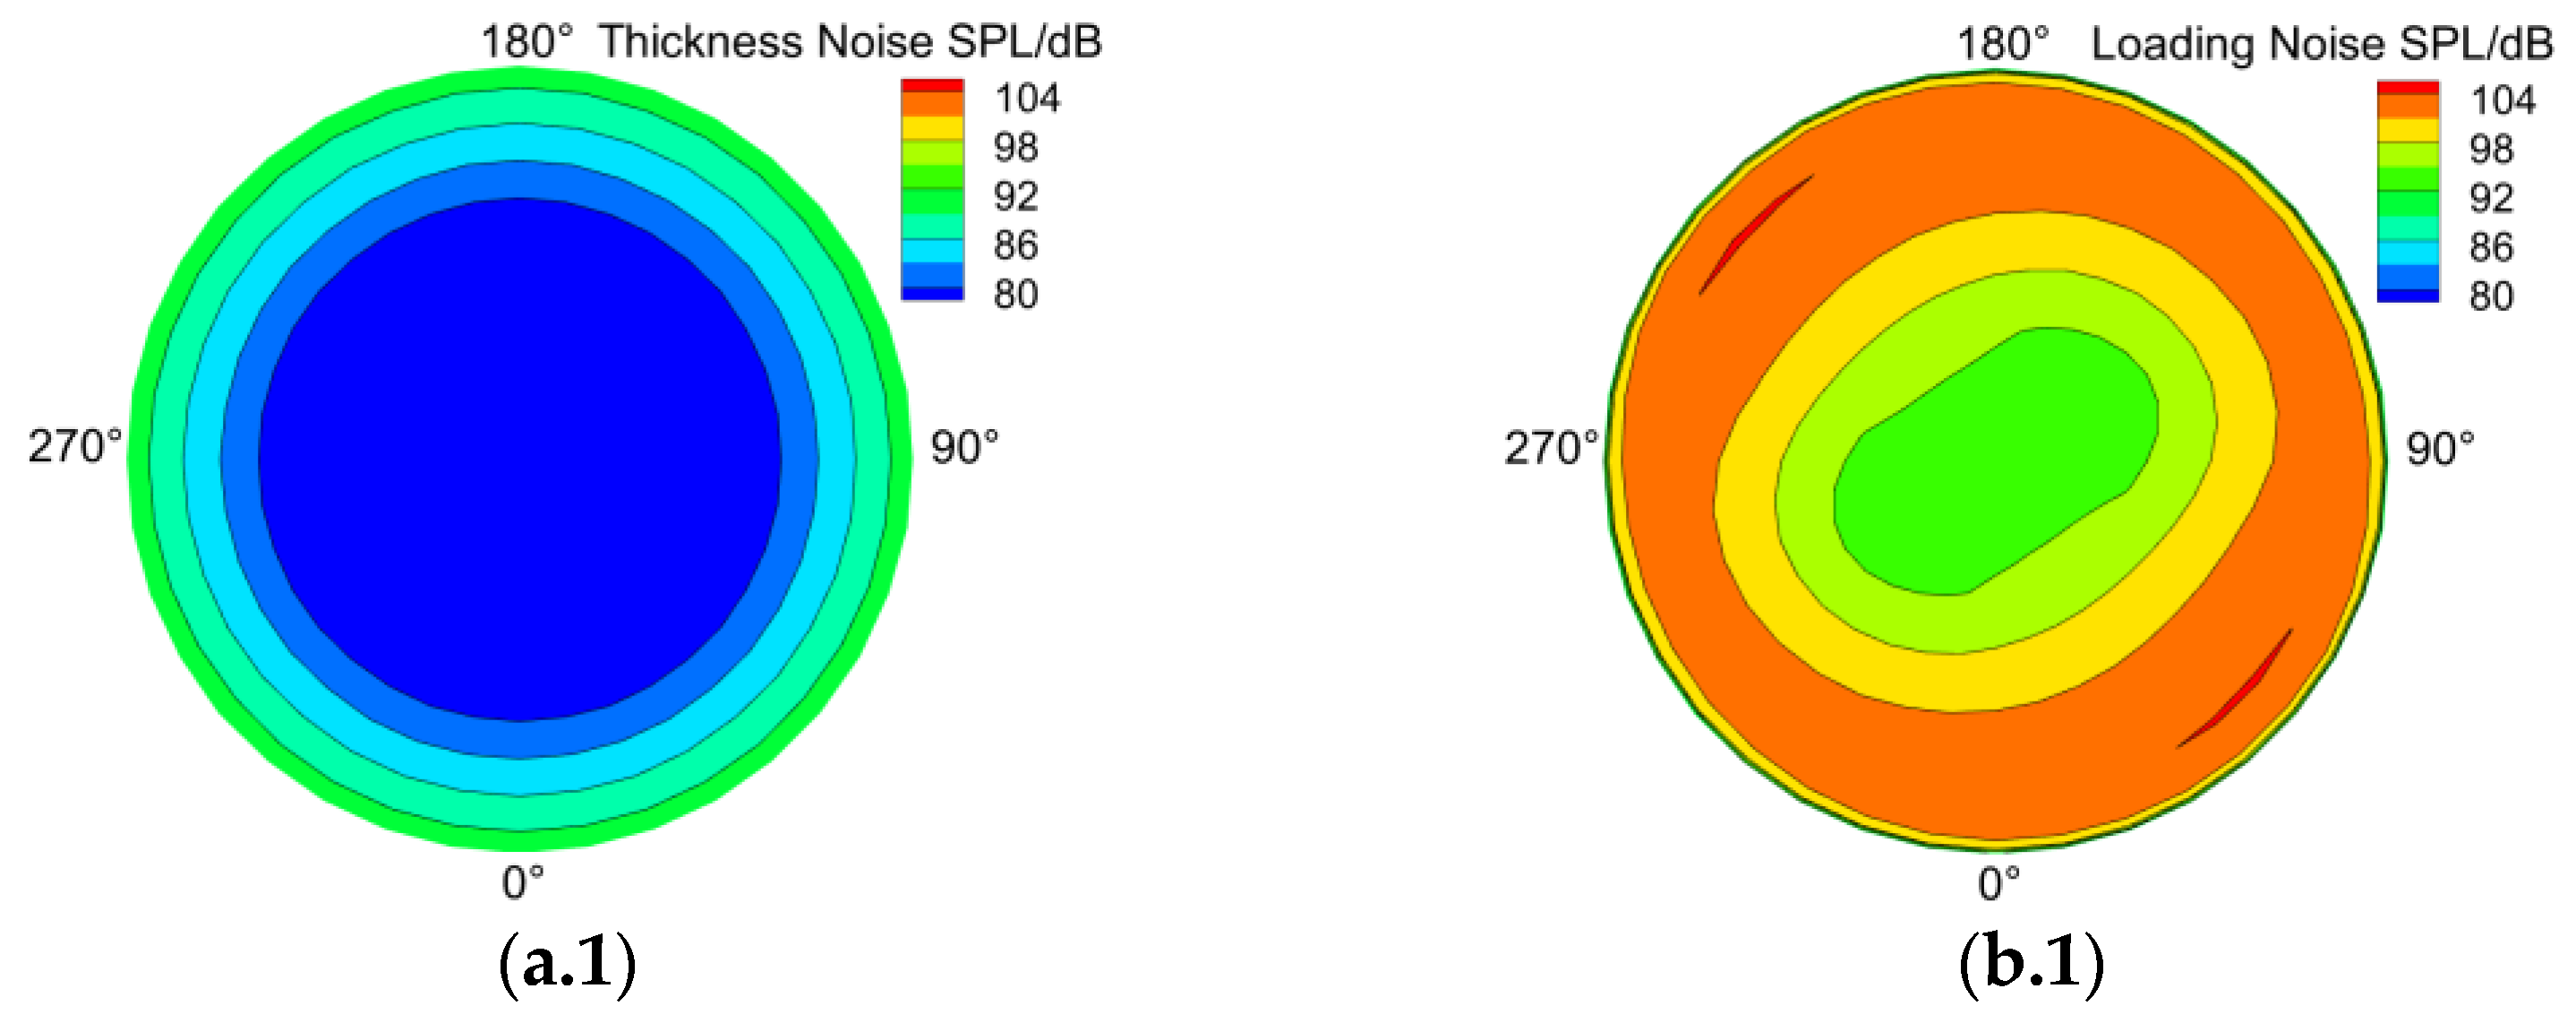
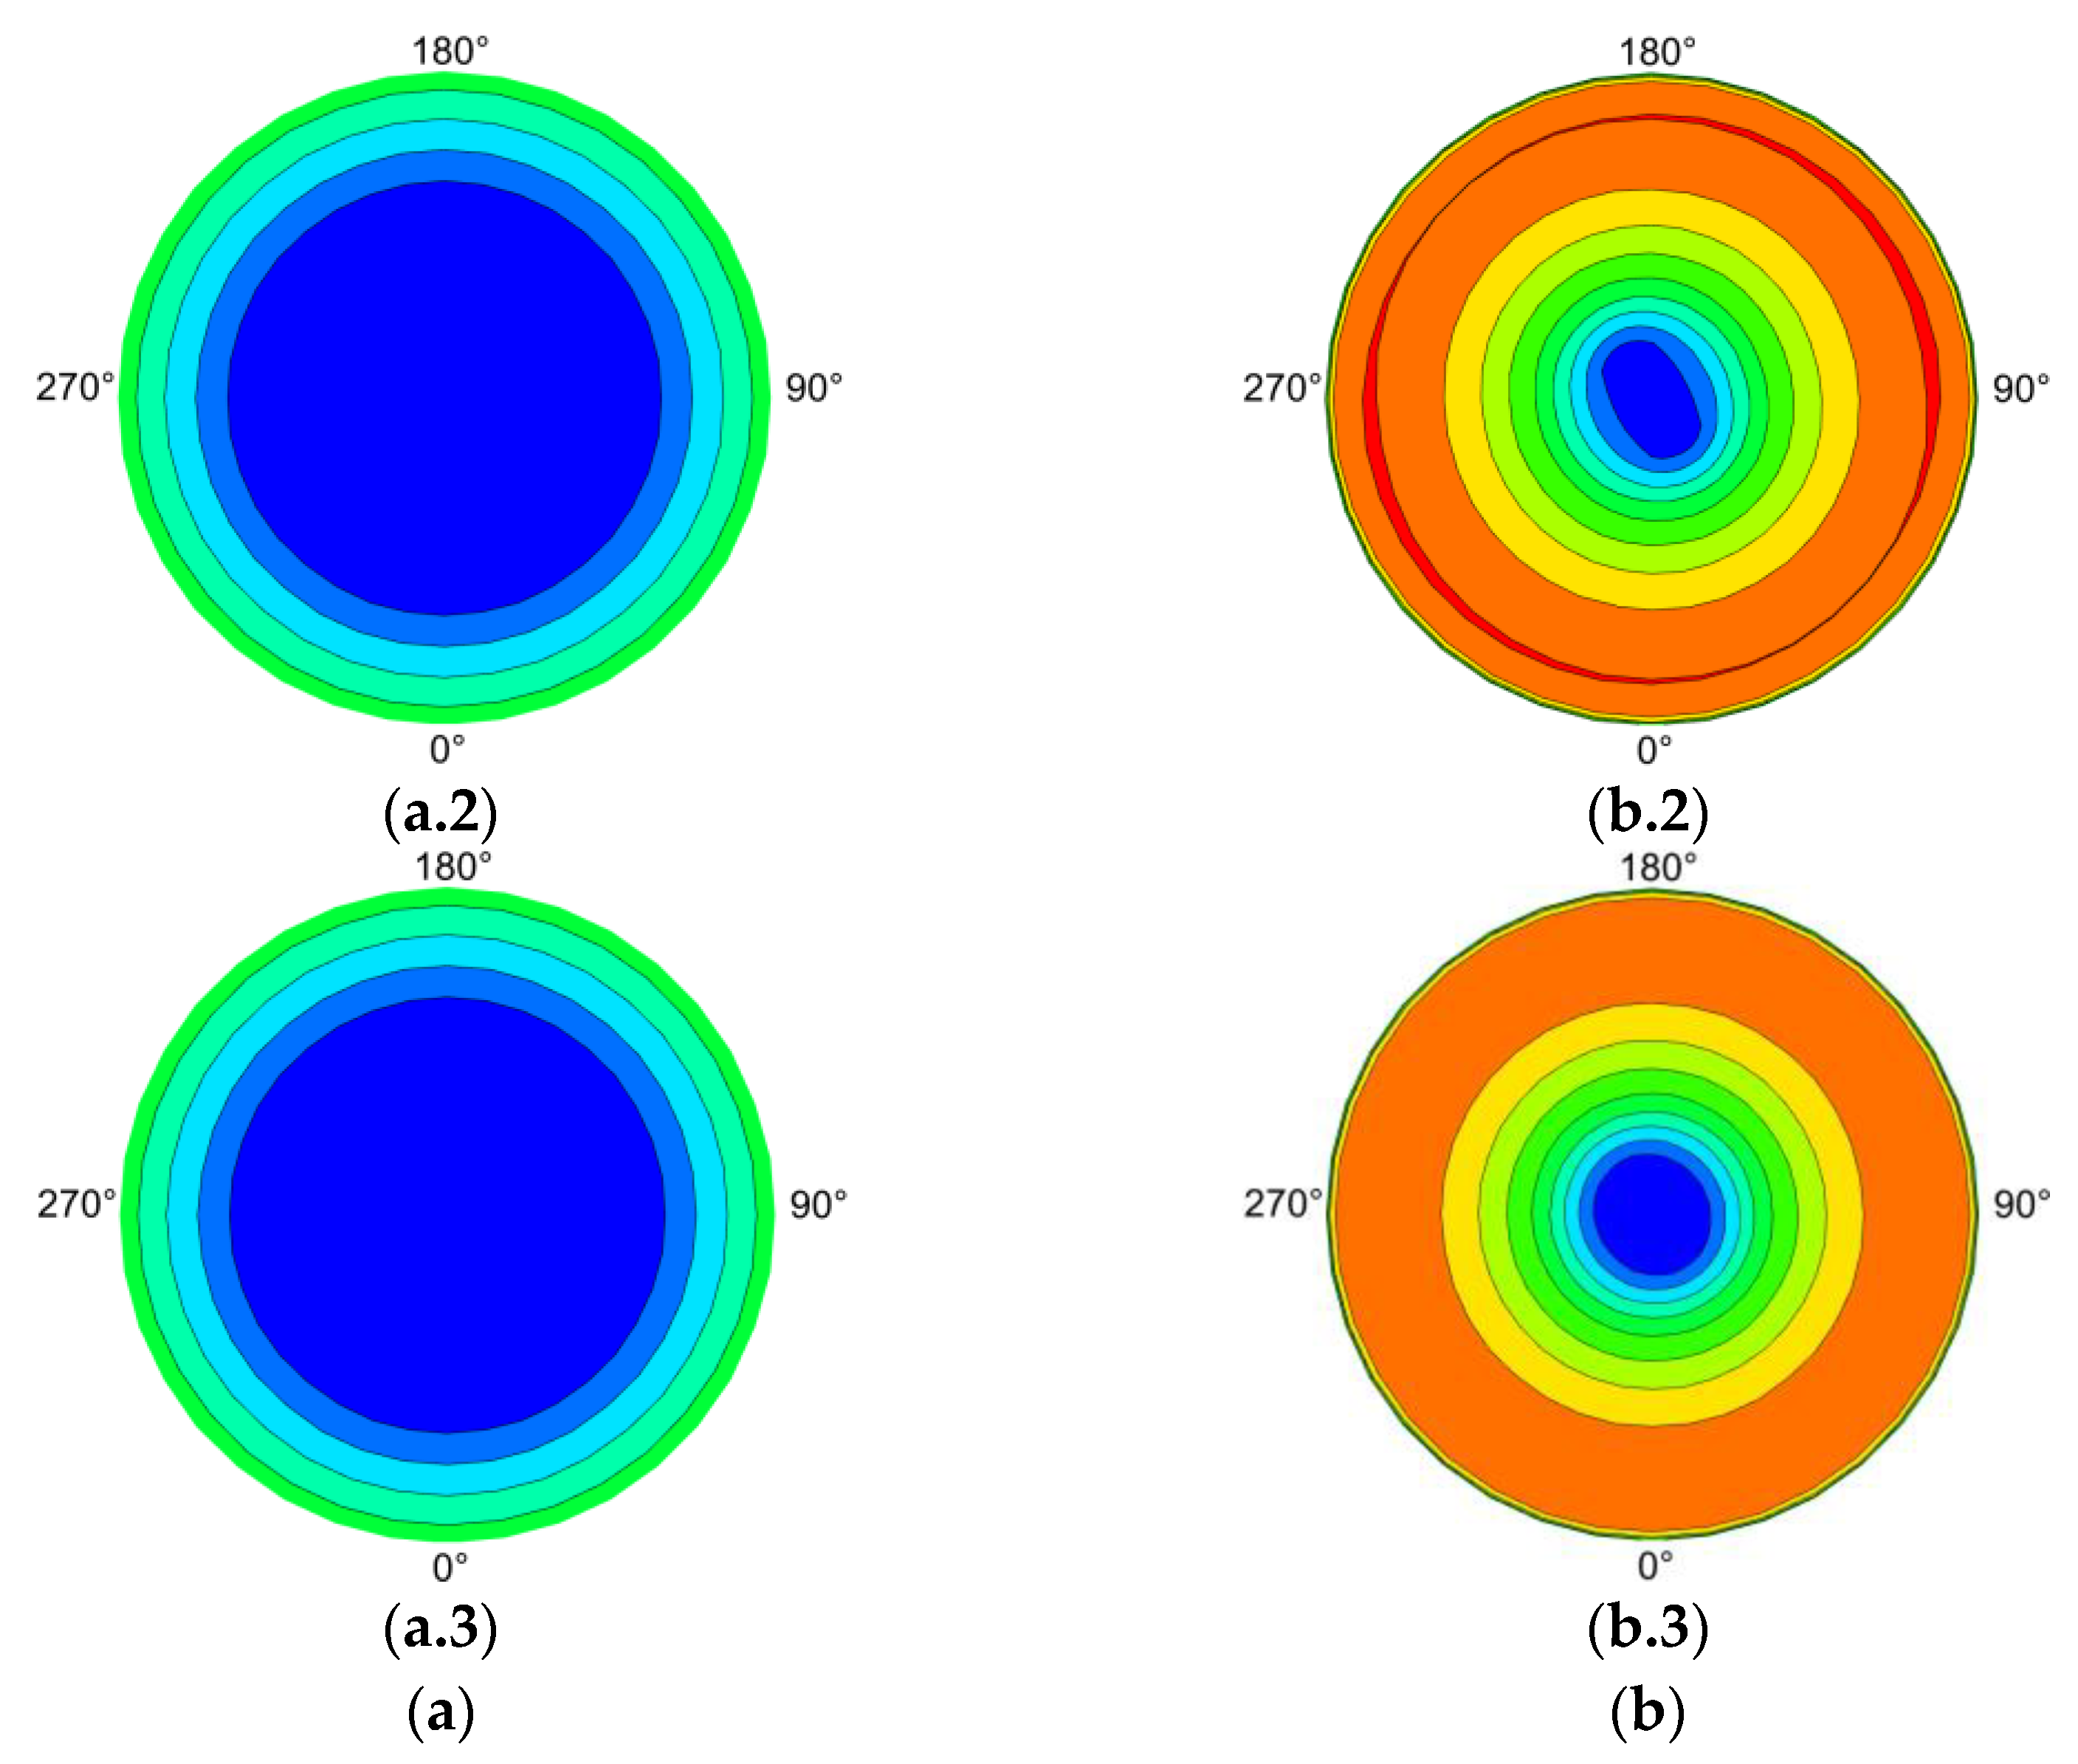
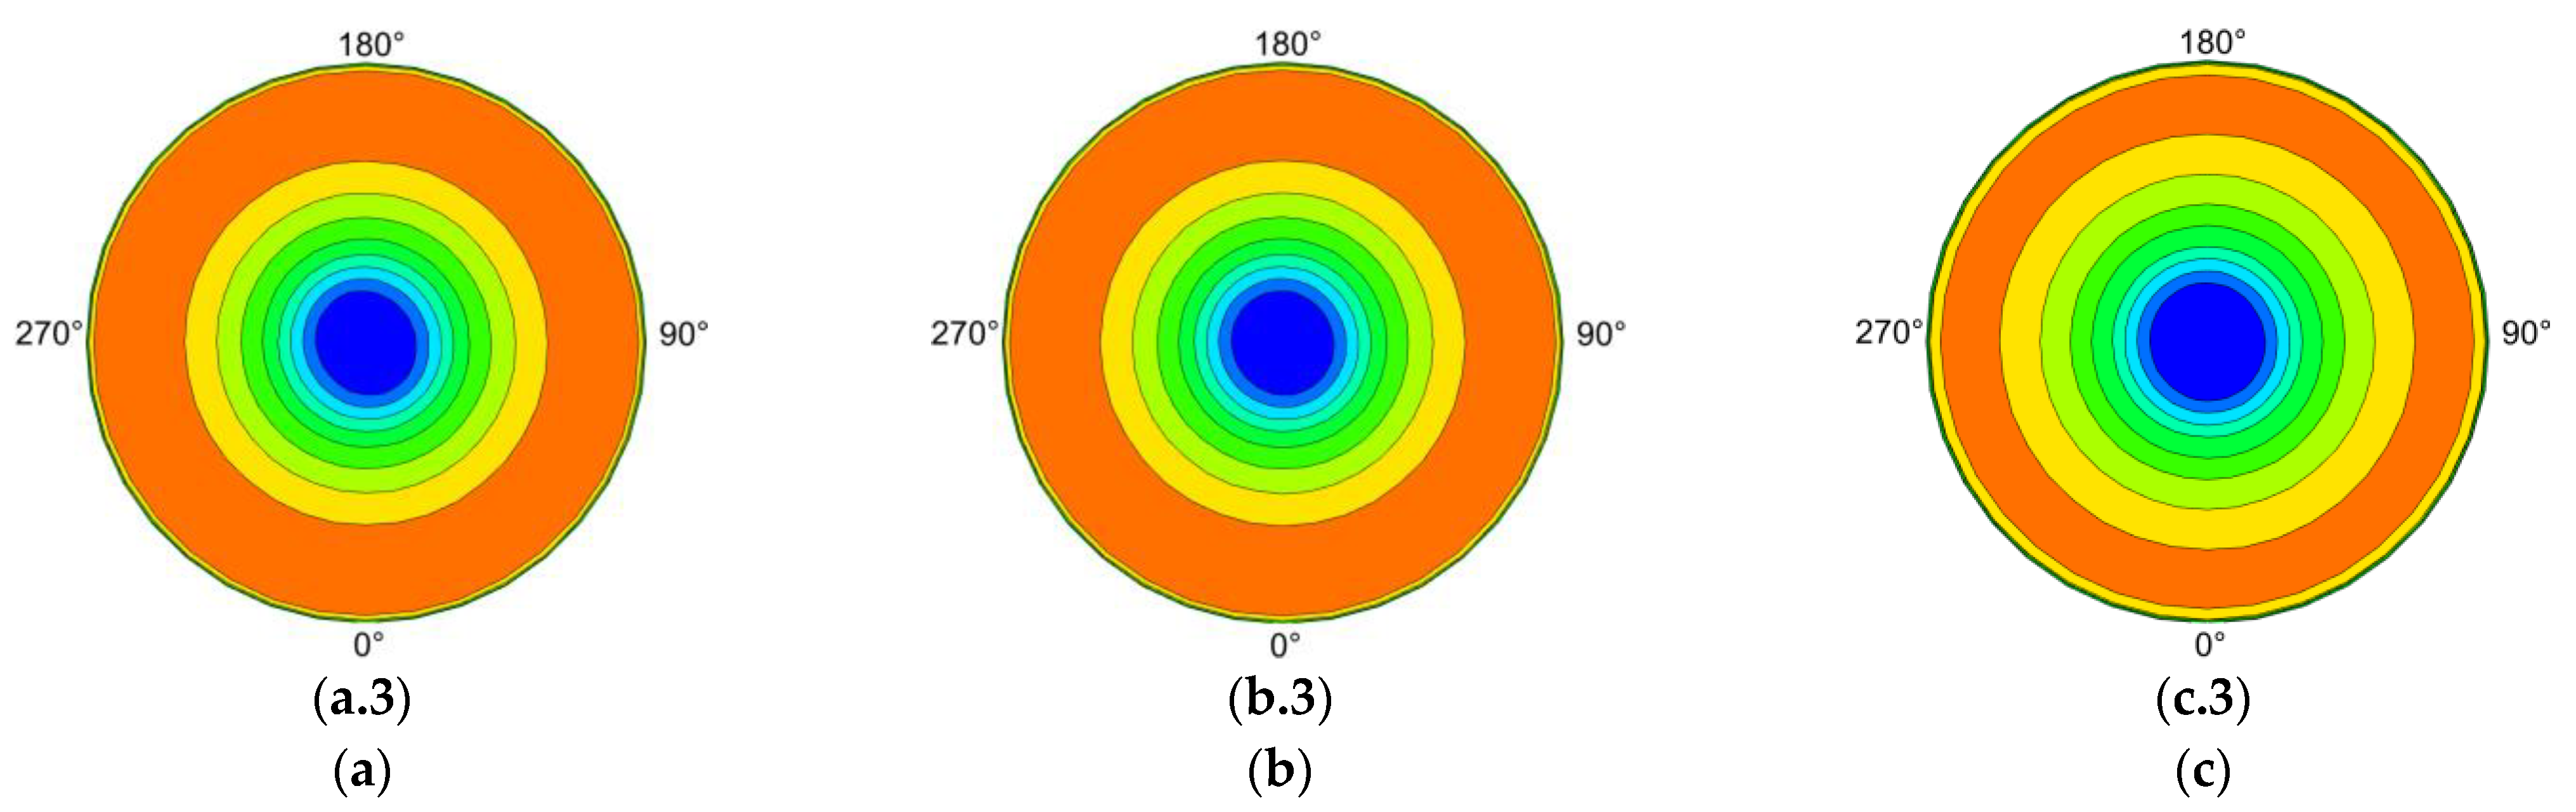
The ramp increase in collective pitch has a relatively smaller impact on thickness noise but significantly affects loading noise, resulting in a clear directionality in hover loading noise. However, this phenomenon mainly exists during the ramp change. After the ramp change stops, the loading noise quickly converges to a new steady state.
(4)
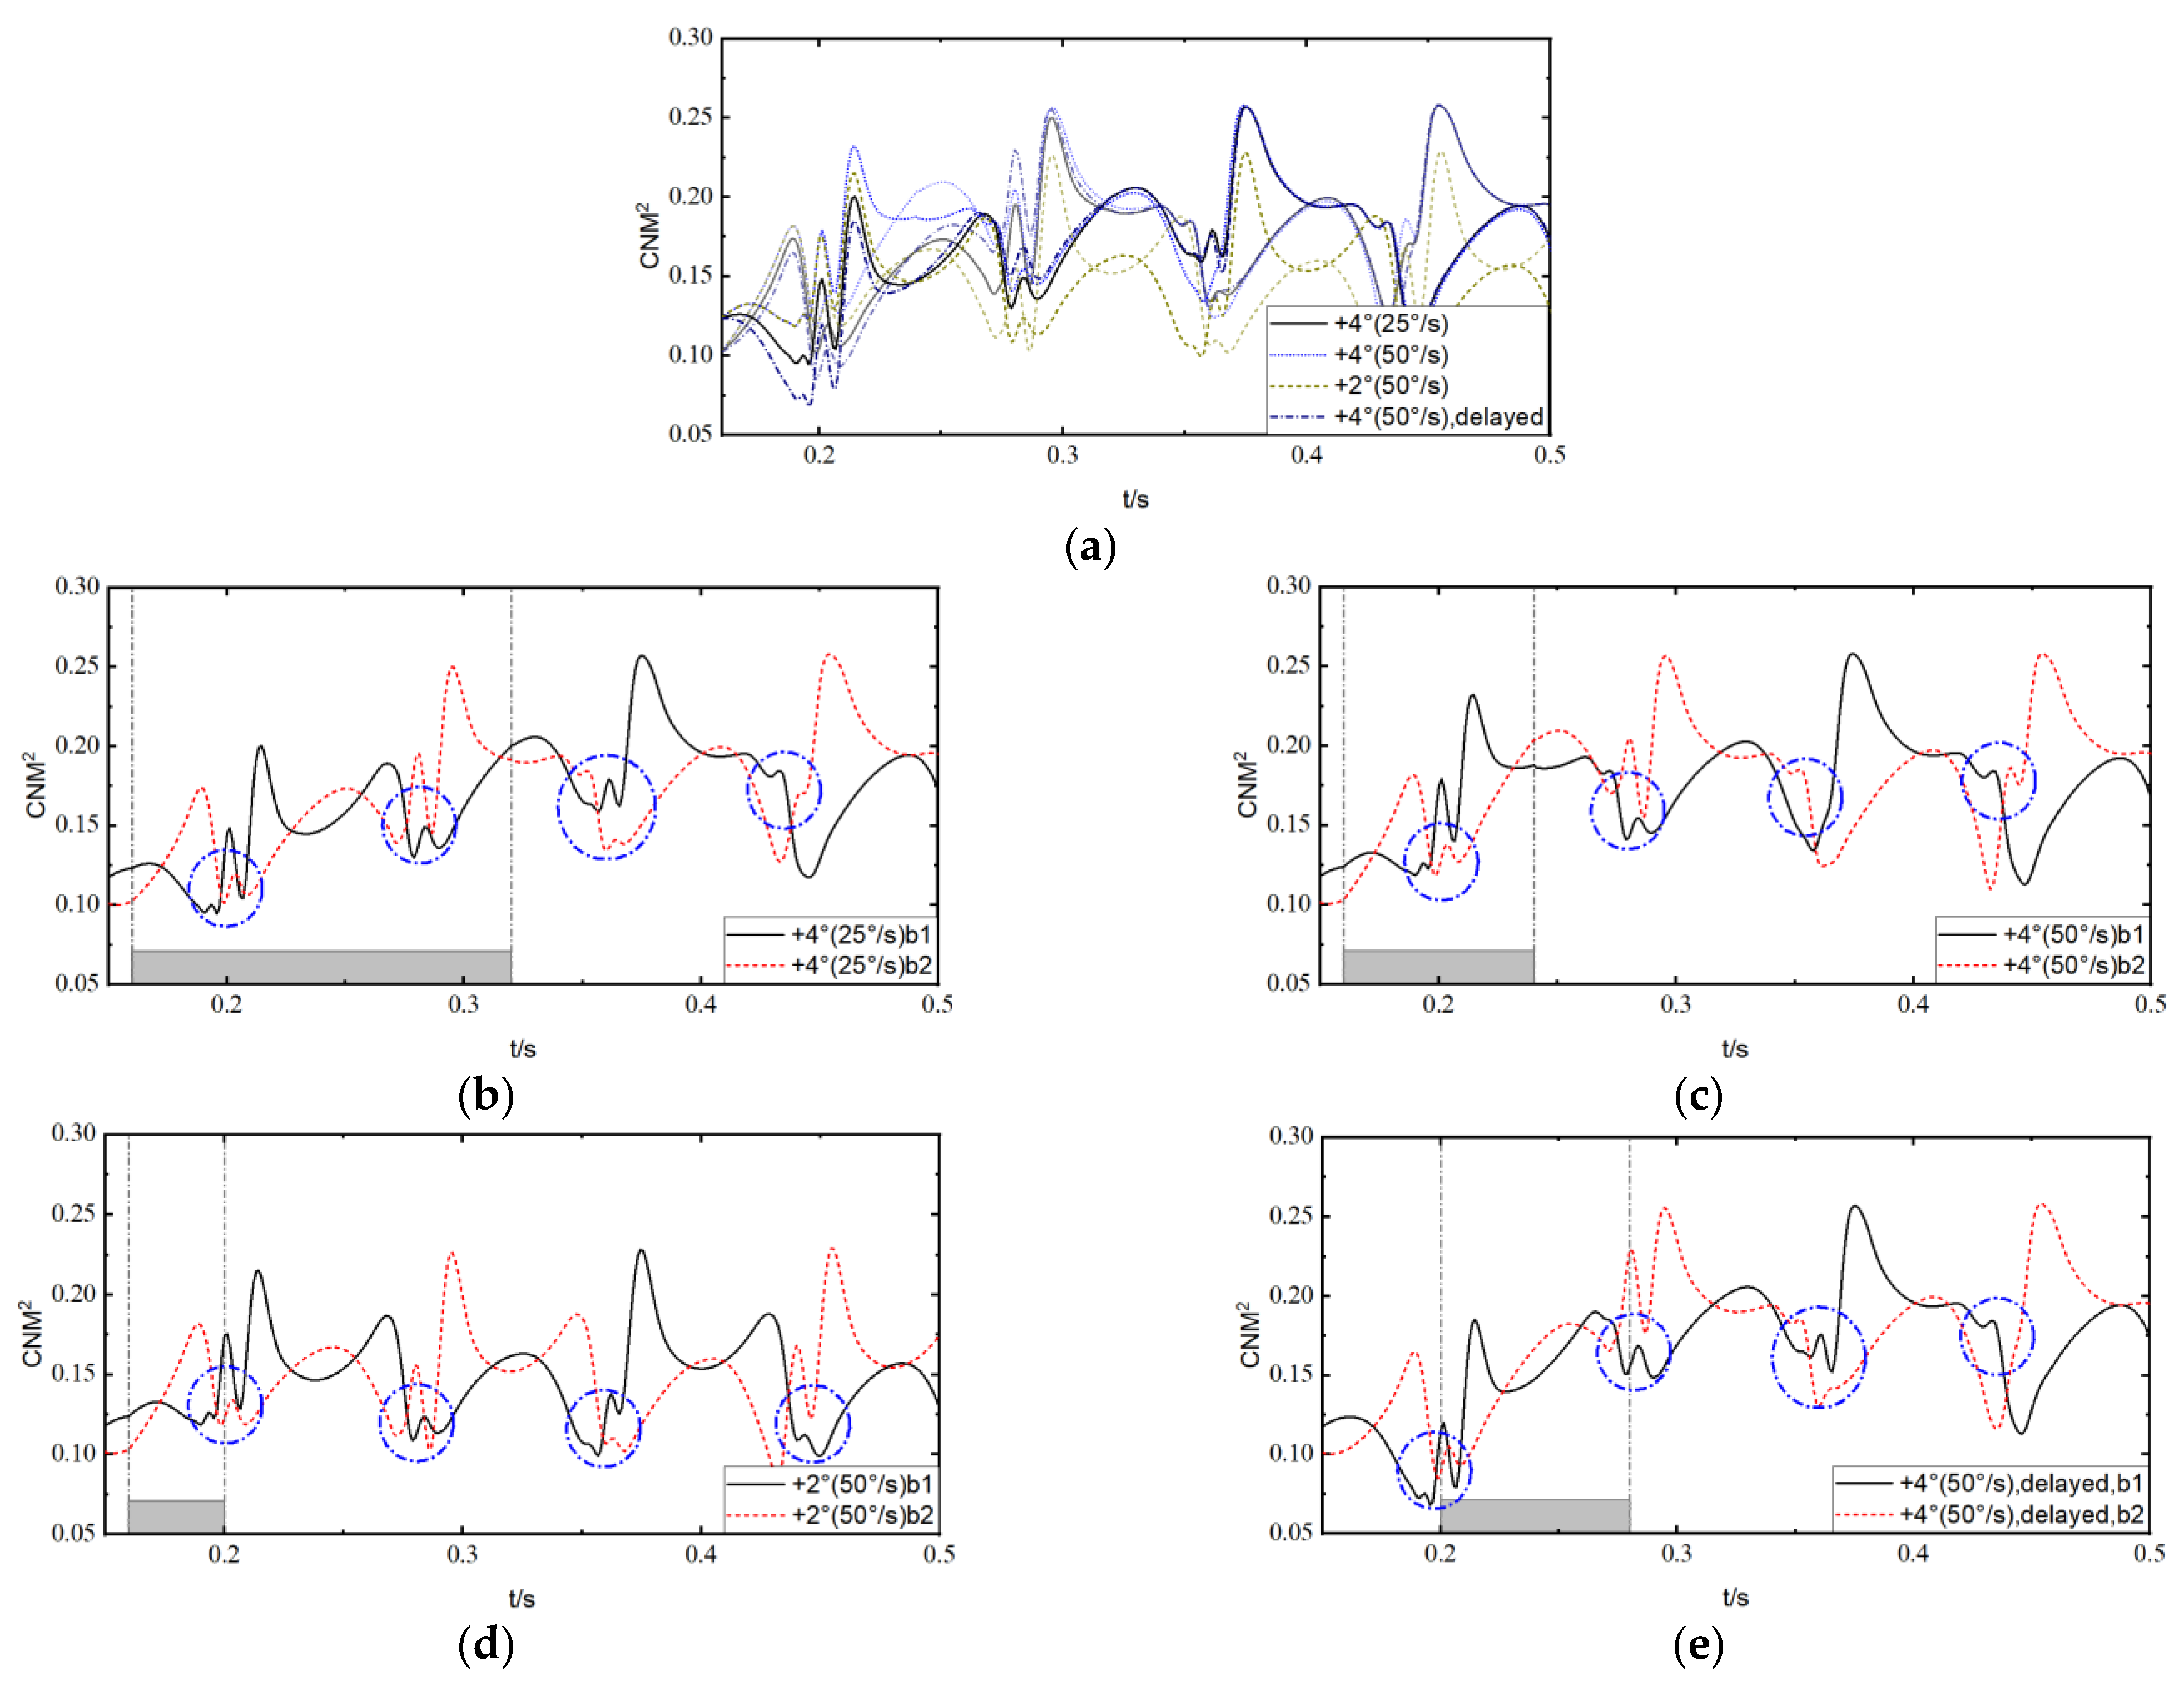
When the collective pitch experiences a ramp increase in forward flight, there are mainly three timescales of variation in rotor load and loading noise: short-term, medium-term, and long-term, among which the short-term and medium-term variations show significant aperiodicity. In cases with BVI, the BVI noise shows a non-periodic variation in the mid-term timescale.
(5)
The influences of pitch rate and the start and stop azimuth angles are mainly reflected in short-term variations, where a higher pitch rate leads to higher loading noise, while the start and end azimuth angles can significantly affect the directionality of loading noise by influencing the azimuth angle of sudden changes in load derivatives and the subsequent evolution of the flow field. A reasonable selection of various ramp change start and end azimuth angles in maneuvering flight has the prospect of becoming an active control method for maneuvering flight noise.
In the future, in-depth research can be conducted on pitch, roll, and even variable-rate transient maneuvers to obtain more comprehensive rotor noise characteristics for maneuvering flight. The findings can then be applied to practical engineering problems such as helicopter low-noise flight trajectory optimization.

Author Contributions

Conceptualization, R.X., Z.H., Y.S. and G.X.; methodology, R.X., Y.S. and G.X.; software, R.X., Z.H. and Y.S.; validation, R.X., Z.H. and Y.S.; formal analysis, R.X.; investigation, R.X.; resources, R.X., Z.H., Y.S. and G.X.; data curation, R.X. and Z.H.; writing—original draft preparation, R.X.; writing—review and editing, R.X.; visualization, R.X.; supervision, Y.S. and G.X.; project administration, Y.S. and G.X.; funding acquisition, Z.H., Y.S. and G.X. All authors have read and agreed to the published version of the manuscript.

Funding

This research was funded by the National Key Laboratory Foundation of China (ID: 6142202202), the National Natural Science Foundation of China (Grant Number: 11972190), the National Natural Science Foundation of China (Grant Number: 12032012), and the Priority Academic Program Development of Jiangsu Higher Education Institutions (PAPD).

Data Availability Statement

The data used to support the findings of this study are available from the corresponding author upon request.

Conflicts of Interest

The authors declare no conflict of interest.

Nomenclature

a 0 sound speed
M Mach number
n outer normal
p pressure
rdistance to the center of the rotor
r position vector
Rrotor radius
V velocity
Г vorticity magnitude
ζ the age angle of the wake vortex
μ advance ratio
ρ density
ψ the azimuth angle of the blade
Ω the rotation speed of the rotor
τ sound source time
t observation time
3 upwind BDFthird-order upwind backward differentiation formulas
BVIblade vortex interaction
CB2DCenter difference and backward difference second-order scheme with numerical dissipation
CFDcomputational fluid dynamics
F1AFarassat 1A
FW HFowcs Williams–Hawkings
PC2BPredictor-Corrector second-order backward difference
TAFWtime-accurate free-wake

References

  1. Chen, H.-N.; Brentner, K.; Shirey, J. An Investigation of Transient Rotor Noise in Maneuvering Flight. In Proceedings of the 11th AIAA/CEAS Aeroacoustics Conference, Monterey, CA, USA, 23–25 May 2005; pp. 1306–1319. [Google Scholar]
  2. Chen, H.-N.; Brentner, K.S.; Ananthan, S.; Leishman, J.G. A Computational Study of Helicopter Rotor Wakes and Noise Generated During Transient Maneuvers. J. Am. Helicopter Soc. 2008, 53, 37–55. [Google Scholar] [CrossRef]
  3. Sickenberger, R.D. Modeling Helicopter Near-Horizon Harmonic Noise Due to Transient Maneuvers. Ph.D. Thesis, The University of Maryland, College Park, MD, USA, 2013. [Google Scholar]
  4. Marze, H.-J.; Gervais, M.; Martin, P.; Dupont, P. Acoustic Flight Test of the EC130 B4 in the Scope of the Friendcopter Project. In Proceedings of the 33rd European Rotorcraft Forum, Kazan, Russia, 11–13 September 2007; pp. 2199–2244. [Google Scholar]
  5. Schmitz, F.H.; Greenwood, E.; Sickenberger, R.D.; Gopalan, G.; Sim, B.W.-C.; Moralez, E., III; Decker, W.A. Measurement and Characterization of Helicopter Noise in Steady-State and Maneuvering Flight. In Proceedings of the American Helicopter Society International 63rd Annual Forum—Riding the Wave of New Vertical Flight Technology, Virginia Beach, VA, USA, 1–3 May 2007; pp. 28–44. [Google Scholar]
  6. Watts, M.E.; Snider, R.; Greenwood, E.; Baden, J. Maneuver Acoustic Flight Test of the Bell 430 Helicopter. In Proceedings of the American Helicopter Society 68th Annual Forum, Fort Worth, TX, USA, 1–3 May 2012; pp. 24–40. [Google Scholar]
  7. Duc, A.L.; Spiegel, P.; Guntzer, F.; Lummer, M.; Buchholz, H.; Götz, J. Simulation of Complete Helicopter Noise in Maneuver Flight Using Aeroacoustic Flight Test Database. In Proceedings of the American Helicopter Society 64th Annual Forum, Montréal, QC, Canada, 26 April–1 May 2008; pp. 2288–2306. [Google Scholar]
  8. Greenwood, E.; Schmitz, F.H.; Sickenberger, R.D. A Semi-Empirical Noise Modeling Method for Helicopter Maneuvering Flight Operations. In Proceedings of the American Helicopter Society 68th Annual Forum, Fort Worth, TX, USA, 1–3 May 2012; pp. 55–72. [Google Scholar]
  9. Gennaretti, M.; Serafini, J.; Bernardini, G.; Castorrini, A.; Matteis, G.D.; Avanzini, G. Numerical Characterization of Helicopter Noise Hemispheres. Aerosp. Sci. Technol. 2016, 52, 18–28. [Google Scholar] [CrossRef]
  10. Greenwood, E.; Rau, R. A Maneuvering Flight Noise Model for Helicopter Mission Planning. J. Am. Helicopter Soc. 2020, 65, 1–10. [Google Scholar] [CrossRef]
  11. Brentner, K.; Jones, H. Noise Prediction for Maneuvering Rotorcraft. In Proceedings of the 6th Aeroacoustics Conference and Exhibit, Lahaina, HI, USA, 12–14 June 2000. [Google Scholar]
  12. Brès, G.A.; Brentner, K.S.; Perez, G.; Jones, H.E. Maneuvering Rotorcraft Noise Prediction. J. Sound Vib. 2004, 275, 719–738. [Google Scholar] [CrossRef]
  13. Brentner, K.S.; Lopes, L.V.; Chen, H.-N.; Horn, J.F. Near Real-Time Simulation of Rotorcraft Acoustics and Flight Dynamics. J. Aircr. 2005, 42, 347–355. [Google Scholar] [CrossRef]
  14. Rajmohan, N. Application of Hybrid Methodology to Rotors in Steady and Maneuvering Flight. Ph.D. Thesis, Georgia Institute of Technology, Atlanta, GA, USA, 2010. [Google Scholar]
  15. Chen, H.-N. Rotor Noise in Maneuvering Flight. Ph.D. Thesis, The Pennsylvania State University, University Park, PA, USA, 2006. [Google Scholar]
  16. Ananthan, S. Analysis of Rotor Wake Aerodynamics during Maneuvering Flight Using a Free-Vortex Wake Methodology. Ph.D. Thesis, The University of Maryland, College Park, MD, USA, 2006. [Google Scholar]
  17. Wang, L. Research on Blade-Vortex Interaction Simulation and Helicopter Maneuvering Flight Noise. Ph.D. Thesis, Nanjing University of Aeronautics and Astronautics, Nanjing, China, 2018. [Google Scholar]
  18. Steijl, R.; Barakos, G.; Badcock, K. A Framework for Cfd Analysis of Helicopter Rotors in Hover and Forward Flight. Int. J. Numer. Methods Fluids 2006, 51, 819–847. [Google Scholar] [CrossRef]
  19. Hu, Z. Active Noise Reduction of Rotors Based on Trailing-Edge Flap Control. Ph.D. Thesis, Nanjing University of Aeronautics and Astronautics, Nanjing, China, 2021. [Google Scholar]
  20. Woodgate, M.A.; Shi, Y.; Fitzgibbon, T.A.; Barakos, G.N.; Li, P. Simulation of Step Input in Collective Pitch for Hovering Rotor. Aerosp. Sci. Technol. 2021, 110, 106425. [Google Scholar] [CrossRef]
  21. Zhang, K.; Zhao, Q.; Zhang, X.; Xu, G. Analysis of Rotor Aerodynamic Response During Ramp Collective Pitch Increase by Cfd Method. Proc. Inst. Mech. Eng. Part G J. Aerosp. Eng. 2020, 235, 994–1007. [Google Scholar] [CrossRef]
  22. Chen, X.; Zhang, K.; Zhao, Q.; Wang, W. Numerical Analysis of Rotor Aeroacoustic Characteristics During Collective Pitch Aperiodic Variation in Hover. Aerosp. Sci. Technol. 2022, 124, 107411. [Google Scholar] [CrossRef]
  23. Weissinger, J. The Lift Distribution of Swept-Back Wings; NASA: Hampton, VA, USA, 1947. [Google Scholar]
  24. Crighton, D.G. The Kutta Condition in Unsteady Flow. Annu. Rev. Fluid Mech. 1985, 17, 411–445. [Google Scholar] [CrossRef]
  25. Bagai, A. Contributions to the Mathematical Modeling of Rotor Flow-Fields Using a Pseudo-Implicit Free-Wake Analysis. Ph.D. Thesis, The University of Maryland, College Park, MD, USA, 1995. [Google Scholar]
  26. Betz, A. Verhalten Von Wirbelsystemen. Z. Angew. Math. Mech. 1932, 12, 164–174. [Google Scholar] [CrossRef]
  27. Rossow, V.J. Extended-Betz Methods for Roll-up of Vortex Sheets. J. Aircr. 1997, 34, 592–599. [Google Scholar] [CrossRef]
  28. Leishman, J.G.; Beddoes, T.S. A Semi-Empirical Model for Dynamic Stall. J. Am. Helicopter Soc. 1989, 34, 3–17. [Google Scholar]
  29. Miranda, L.R.; Elliot, R.D.; Baker, W.M. A Generalized Vortex Lattice Method for Subsonic and Supersonic Flow Applications; NASA: Hampton, VA, USA, 1977. [Google Scholar]
  30. Leishman, G.J. Principles of Helicopter Aerodynamics; Cambridge University Press: Cambridge, UK, 2006. [Google Scholar]
  31. Bhagwat, M.J. Mathematical Modeling of the Transient Dynamics of Helicopter Rotor Wakes Using a Time-Accurate Free-Vortex Method. Ph.D. Thesis, The University of Maryland, College Park, MD, USA, 2001. [Google Scholar]
  32. Li, P. Rotor Unsteady Free-Vortex Wake Model and Investigation on High-Fidelity Modeling of Helicopter Flight Dynamics. Ph.D. Thesis, Nanjing University of Aeronautics and Astronautics, Nanjing, China, 2010. [Google Scholar]
  33. Lv, W. Research on the Stability, Numerical Method of Rotor Wake Systems and the Aerodynamic Characteristics of Abc Helicopters. Ph.D. Thesis, Nanjing University of Aeronautics and Astronautics, Nanjing, China, 2013. [Google Scholar]
  34. Beljadid, A.; Mohammadian, A.; Qiblawey, H.M. An Unstructured Finite Volume Method for Large-Scale Shallow Flows Using the Fourth-Order Adams Scheme. Comput. Fluids 2013, 88, 579–589. [Google Scholar] [CrossRef]
  35. Farassat, F. Derivation of Formulations 1 and 1a of Farassat; NASA: Hampton, VA, USA, 2007. [Google Scholar]
  36. Casalino, D. An Advanced Time Approach for Acoustic Analogy Predictions. J. Sound Vib. 2003, 261, 583–612. [Google Scholar] [CrossRef]
  37. Bhagwat, M.J.; Leishman, J.G. On the Relationship between Blade Circulation and Tip Vortex Characteristics. In Proceedings of the 54th Annual Forum of the American Helicopter Society, Washington, DC, USA, 20–22 May 1998; pp. 557–575. [Google Scholar]
  38. Bhagwat, M.J.; Leishman, J.G. Measurements of Bound and Wake Circulation on a Helicopter Rotor. J. Aircr. 2000, 37, 227–234. [Google Scholar] [CrossRef]
  39. Naca Airfoil. Available online: https://en.wikipedia.org/wiki/NACA_airfoil (accessed on 15 February 2006).
  40. Elliott, J.W.; Althoff, S.L.; Sailey, R.H. Inflow Measurements Made with a Laser Velocimeter on a Helicopter Model in Forward Flight. Volume 1 Rectangular Planform Blades at an Advance Ration of 0.15; NASA: Hampton, VA, USA, 1988. [Google Scholar]
  41. Ghee, T.A.; Elliott, J.W. The Wake of a Small-Scale Rotor in Forward Flight Using Flow Visualization. J. Am. Helicopter Soc. 1995, 40, 52–65. [Google Scholar] [CrossRef]
  42. Carpenter, P.J.; Fridovich, B. Effect of a Rapid Blade-Pitch Increase on the Thrust and Induced-Velocity Response of a Full-Scale Helicopter Rotor; NASA: Hampton, VA, USA, 1953. [Google Scholar]
  43. Yu, Y.H.; Tung, C.; Gallman, J.; Schultz, K.J.; van der Wall, B.; Spiegel, P.; Michea, B. Aerodynamics and Acoustics of Rotor Blade-Vortex Interactions. J. Aircr. 1995, 32, 970–977. [Google Scholar] [CrossRef]
Figure 1. Discrete model of rotor flow field.
Machines 11 01007 g001
Figure 2. Comparison between predicted and measured results in experimental hover tests by the University of Maryland. (a) Tip vortex geometry; (b) Time-averaged induced inflow distribution.
Machines 11 01007 g002
Figure 3. Comparison of the tip vortex geometry of Rotor 2 as predicted by the original and modified schemes. (a) Original 3-upwind BDF; (b) modified scheme in present work.
Machines 11 01007 g003
Figure 4. Comparison of tip vortex trajectories between predicted and measured results of the Langley 2MRTS rotor for the first blade. (a) μ = 0.15, ψ = 0 ° , top-view; (b) μ = 0.15, ψ = 0 ° , side-view; (c) μ = 0.25, ψ = 180 ° , top-view; (d) μ = 0.23, ψ = 180 ° , side-view.
Machines 11 01007 g004
Figure 5. Comparison of time-averaged induced inflow distribution between predicted and measured results of the Langley 2MRTS rotor for the first blade. (a) μ = 0.15, longitudinal inflow; (b) μ = 0.23, lateral inflow.
Machines 11 01007 g005
Figure 6. Comparison between predicted and measured results of NACA rotor with ramp increase in collective pitch in hover condition. (a) Instantaneous thrust coefficient; (b) the ratio of instantaneous induced velocity to steady-state induced velocity.
Machines 11 01007 g006
Figure 7. The aeroacoustics test of the AH-1/OLS rotor and sound pressure time history of Case 10014. (a) the aeroacoustics test; (b) Mic #3; (c) Mic #9.
Machines 11 01007 g007
Figure 8. Variation of the instantaneous thrust coefficient of cases in hover.
Machines 11 01007 g008
Figure 9. Variation of aerodynamic forces of cases in hover at r = 0.8 R. (a) Nondimensional normal force; (b) time derivative of normal force.
Machines 11 01007 g009
Figure 10. Variation of sound pressure level distribution in case 1. (a) Thickness noise: (a.1) 1 rev; (a.2) 2 rev; (a.3) 3 rev; (b) loading noise: (b.1) 1 rev; (b.2) 2 rev; (b.3) 3 rev.
Machines 11 01007 g010aMachines 11 01007 g010b
Figure 11. Variation of thickness noise sound pressure time history of case 1 at in-plane observer.
Machines 11 01007 g011
Figure 12. Variation of loading noise sound pressure time history of case 1 at different observers with different azimuth angles.
Machines 11 01007 g012
Figure 13. Variation of loading noise sound pressure level distribution of the various cases in hover. (a) case 1 (+4°, 25°/s): (a.1) 1 rev; (a.2) 2 rev; (a.3) 3 rev; (b) case 2 (+4°, 50°/s): (b.1) 1 rev; (b.2) 2 rev; (b.3) 3 rev; (c) case 3 (+2°, 50°/s): (c.1) 1 rev; (c.2) 2 rev; (c.3) 3 rev.
Machines 11 01007 g013aMachines 11 01007 g013b
Figure 14. Variation of loading noise sound pressure time history of cases 1 and 2 to the observer with an elevation angle of 30° and an azimuth angle of 130°.
Machines 11 01007 g014
Figure 15. Variation of the time-averaged thrust coefficient of cases in forward flight.
Machines 11 01007 g015
Figure 16. Variation of the nondimensional normal force of the two blades of cases in forward flight at r = 0.85 R during t = 0.15–0.5 s. (a) Overall; (b) case 1 (+4°, 25°/s); (c) case 2 (+4°, 50°/s); (d) case 3 (+2°, 50°/s); (e) case 4 (+4°, 50°/s, delayed).
Machines 11 01007 g016
Figure 17. Variation of the nondimensional normal force of the two blades of cases in forward flight at r = 0.85 R during t = 0.5–1.0 s. (a) Overall; (b) case 1 (+4°, 25°/s); (c) case 2 (+4°, 50°/s); (d) case 3 (+2°, 50°/s); (e) case 4 (+4°, 50°/s, delayed).
Machines 11 01007 g017aMachines 11 01007 g017b
Figure 18. Variation of loading noise sound pressure level distribution of the various cases with the same start azimuth angle in forward fight. (a) Case 1 (+4°, 25°/s): (a.1) 1 rev; (a.2) 2 rev; (a.3) 3 rev; (a.4) 4 rev; (b) case 2 (+4°, 50°/s): (b.1) 1 rev; (b.2) 2 rev; (b.3) 3 rev; (b.4) 4 rev; (c) case 3 (+2°, 50°/s): (c.1) 1 rev; (c.2) 2 rev; (c.3) 3 rev; (c.4) 4 rev.
Machines 11 01007 g018aMachines 11 01007 g018b
Figure 19. Variation of loading noise sound pressure time history of the various cases with the same start time at different observers. (a) Observer with elevation angle of 40° and azimuth angle of 40°; (b) observer with elevation angle of 40° and azimuth angle of 130°; (c) observer with elevation angle of 40° and azimuth angle of 260°.
Machines 11 01007 g019aMachines 11 01007 g019b
Figure 20. Variation of loading noise sound pressure time history of the various cases with the same start azimuth angle at the observer with an elevation angle of 40° and an azimuth angle of 130°. (a) 0.2–0.4 s; (b) 0.4–0.6 s; (c) 0.6–0.8 s; (d) 0.8–1.0 s.
Machines 11 01007 g020aMachines 11 01007 g020b
Figure 21. Variation of loading noise sound pressure level distribution of the various cases with different start times of ramp change in forward fight. (a) Case 2 (start time at t = 0.16 s): (a.1) 1 rev; (a.2) 2 rev; (b) case 4 (start time at t = 0.2 s): (b.1) 1 rev; (b.2) 2 rev.
Machines 11 01007 g021
Figure 22. Variation of loading noise sound pressure time history of the various cases with different start times at different observers. (a) observer with elevation angle of 40° and azimuth angle of 40°; (b) observer with elevation angle of 40° and azimuth angle of 130°; (c) observer with elevation angle of 40° and azimuth angle of 260°.
Machines 11 01007 g022
Disclaimer/Publisher’s Note: The statements, opinions and data contained in all publications are solely those of the individual author(s) and contributor(s) and not of MDPI and/or the editor(s). MDPI and/or the editor(s) disclaim responsibility for any injury to people or property resulting from any ideas, methods, instructions or products referred to in the content.

