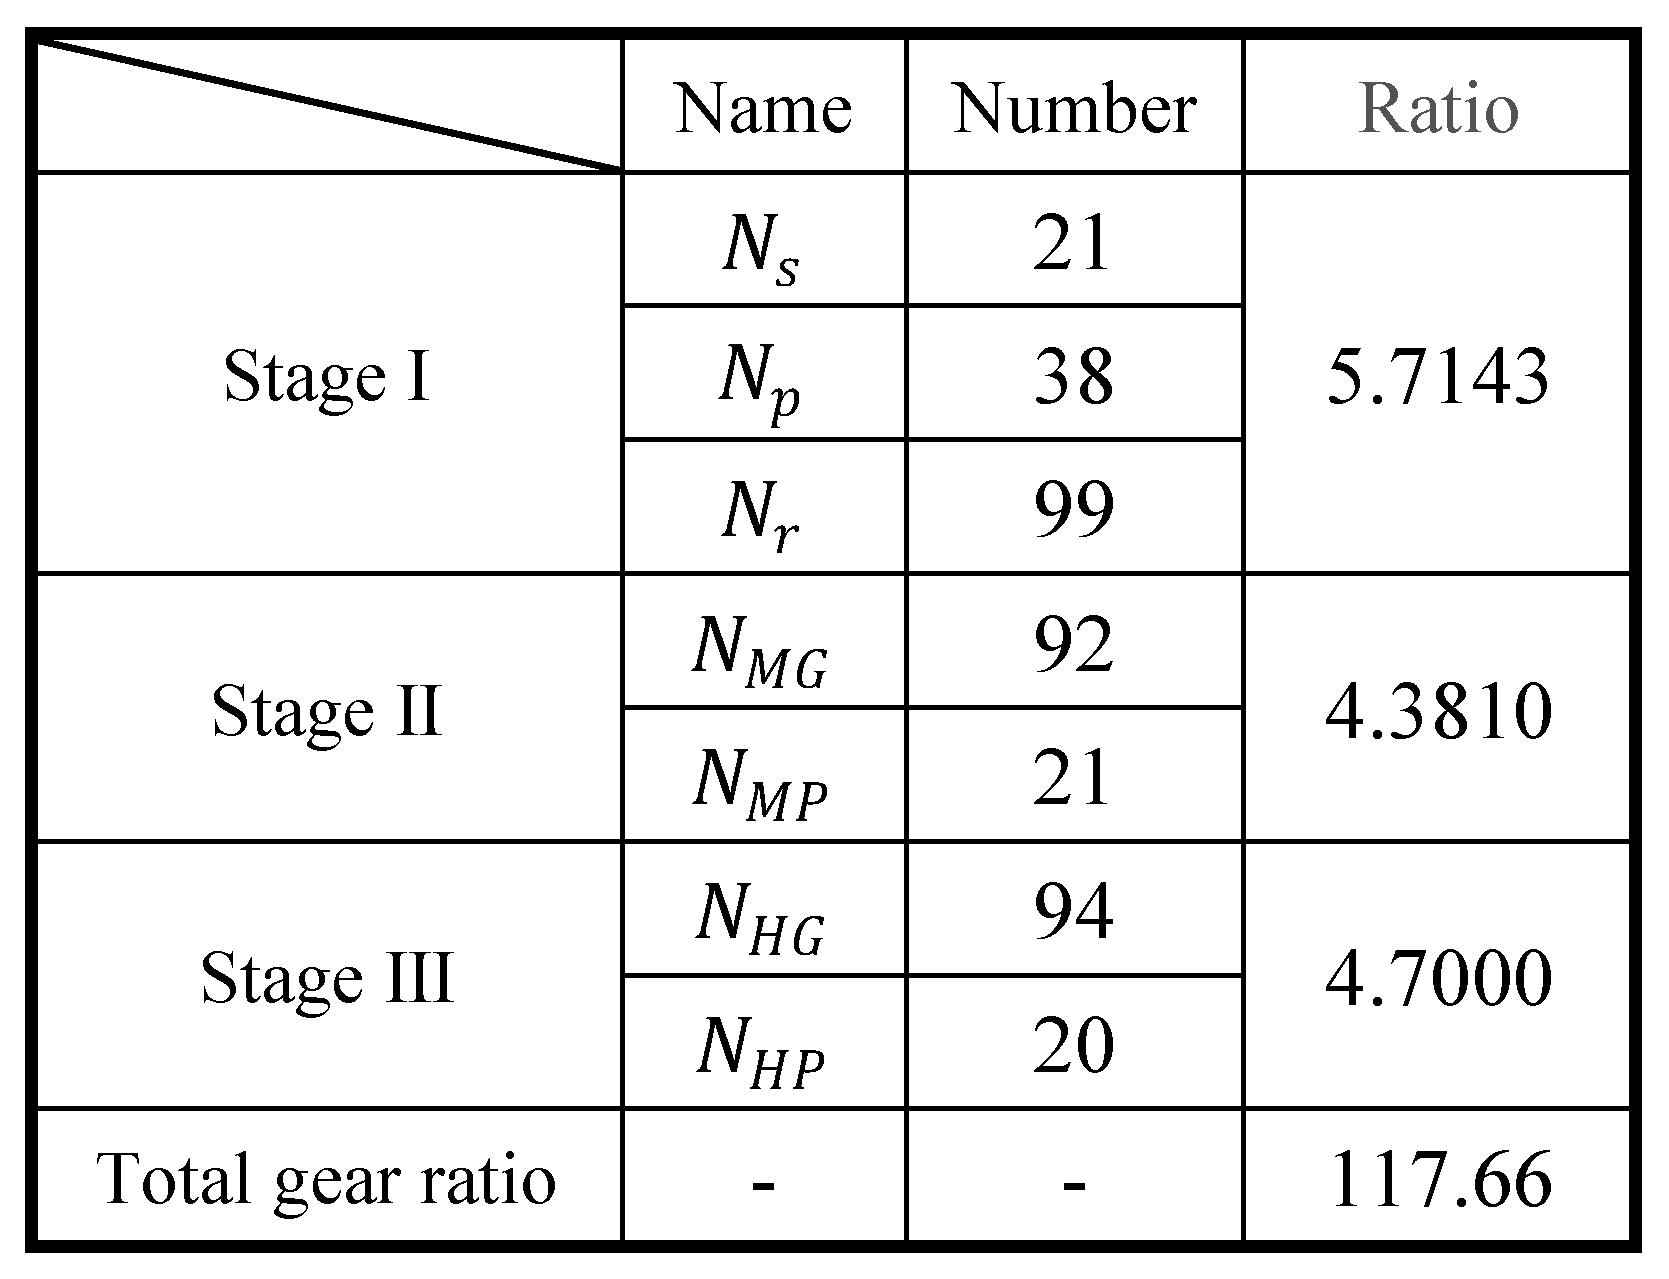
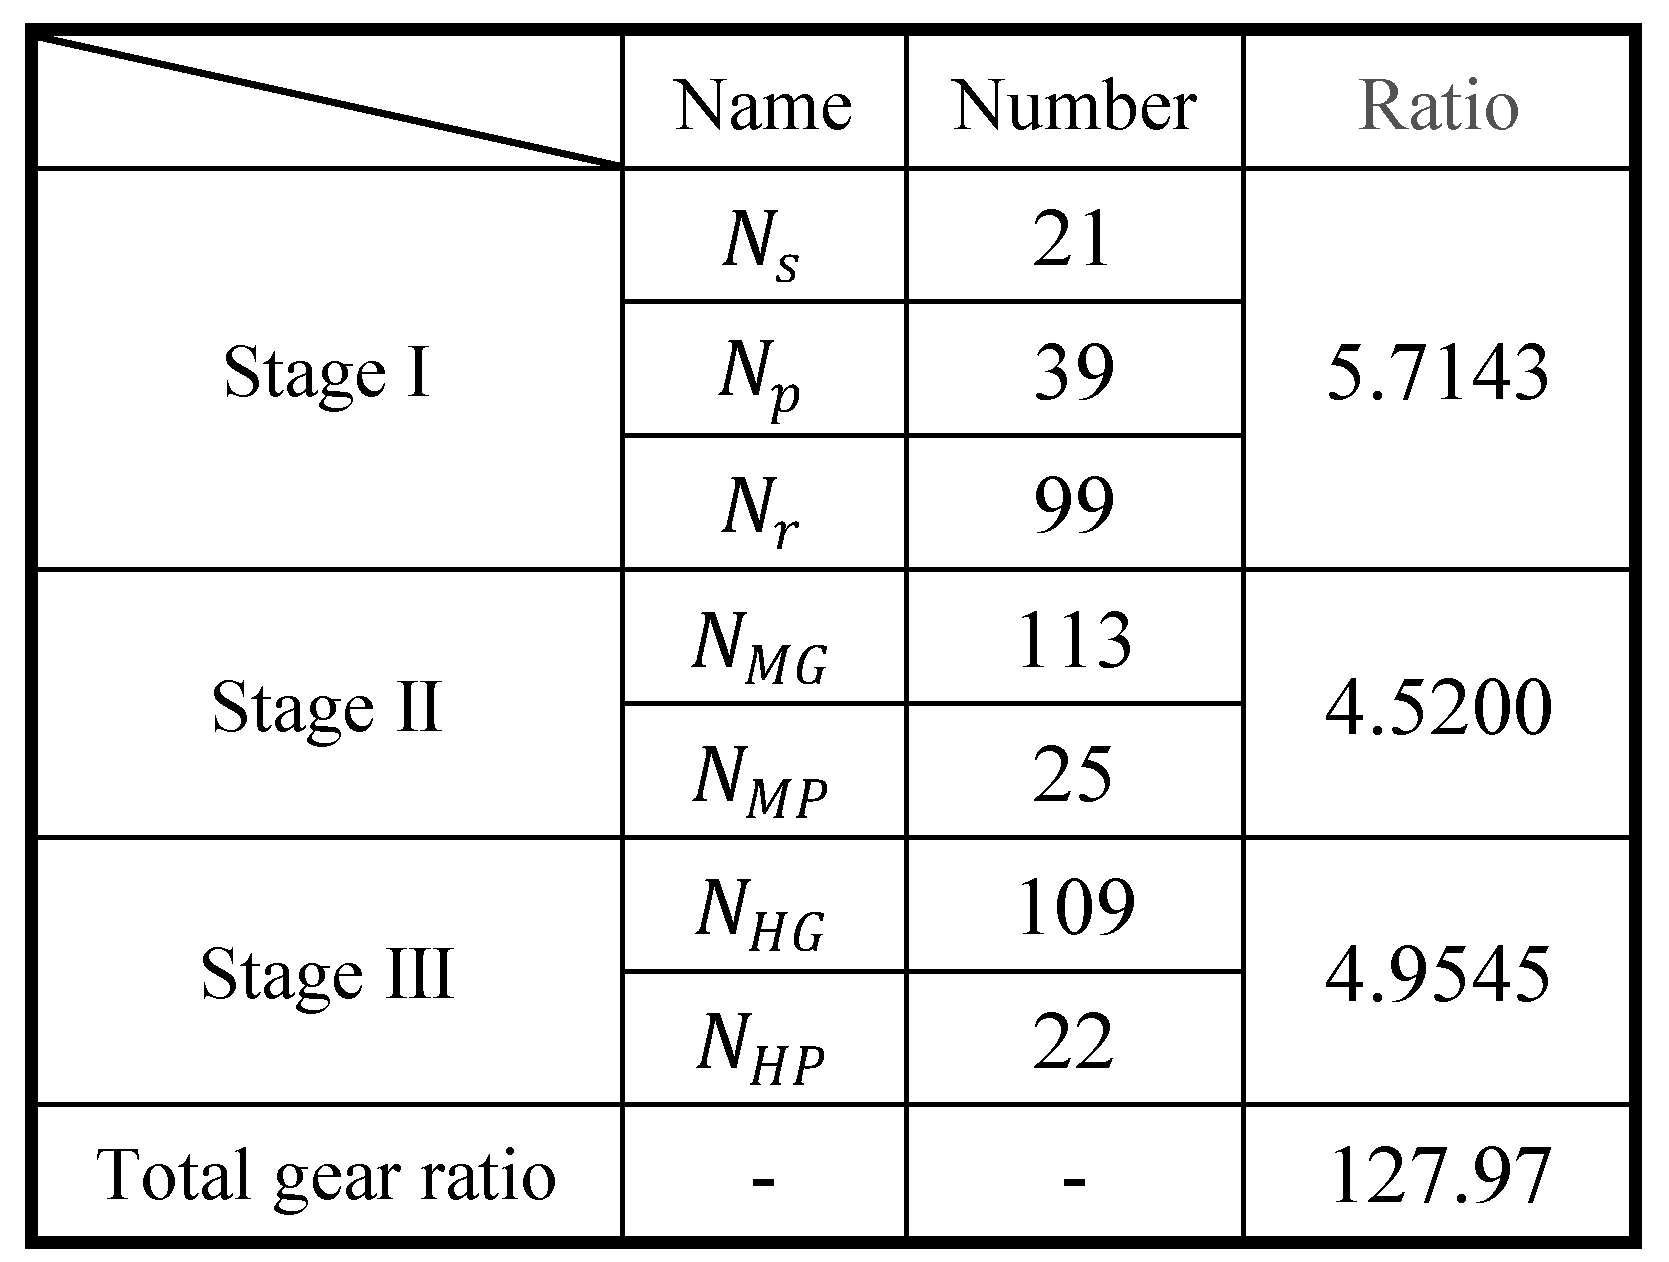
1. Introduction
The escalating global demand for clean energy, coupled with remarkable advancements in wind turbine manufacturing technology, has resulted in a consistent upward trajectory in installed wind turbine capacity. Notably, maintenance costs associated with onshore and offshore wind turbines constitute a substantial proportion of wind farm revenues, estimated to range from 10 to 15% for onshore turbines and 20–35% for offshore turbines [
1]. Among the various types of faults encountered in wind turbines, the mechanical components within the drive chain pose the most significant financial burden in terms of removal and repair [
2]. Consequently, the implementation of condition monitoring systems specifically designed to diagnose and address drive-chain-related issues has become standard practice. Recent overviews on wind turbine condition monitoring systems can be found in the open literature, such as in references [
3,
4,
5]. Within the industry, vibration-sensor-based condition monitoring has gained prominence due to its well-established maturity and cost-effectiveness [
6].
Wind turbines operate under time-varying speed conditions, leading to frequency modulation and spectrum dispersion. This poses challenges for fault diagnosis based solely on spectrum analysis. To address these issues, the synchronous technique has emerged as an effective approach. Unlike traditional equal-time sampling methods, synchronous sampling involves resampling the vibration response at constant angular intervals. This approach mitigates the impact of speed fluctuations on the order spectrum, enabling more accurate fault diagnosis. Furthermore, the synchronous technique can be combined with synchronous averaging to eliminate asynchronous periodic components as well as the noise. As a result, the synchronous technique has gained wide recognition for its utility in early fault diagnosis of wind turbines.
Traditionally, synchronous techniques for fault diagnosis in wind turbines relied on auxiliary equipment like tachometers or encoders to provide shaft speed references for signal resampling. However, this approach is limited by constraints in shaft mounting space, sensor technology, and operational conditions. These limitations result in increased costs. Consequently, engineers have been actively exploring methods to extract rotational speed directly from vibration. Bonnardot et al. [
7] proposed a band-pass-filter-based synchronous sampling method that isolates the gear mesh response or its harmonics, enabling resampling of the vibration response based on the phase of the isolated signal. Building upon this approach, Combet et al. [
8] improved the scheme by automating the selection of mesh harmonics. However, the conventional method of extracting a single component using a traditional band-pass filter is suitable only for cases with small speed variations where adjacent harmonic frequency bands can be separated in the frequency domain. In situations with significant speed fluctuations, the overlapping of harmonic bands makes it challenging to extract individual harmonics from the signal using the band-pass filtering method. This limitation restricts the application of synchronous techniques in fault diagnosis.
Time–frequency analysis (TFA) offers a promising approach to address the challenges posed by large speed fluctuations. By mapping the one-dimensional time series onto a two-dimensional time–frequency plane, it visually represents the time-varying characteristics of the frequency. Urbanek et al. [
9] proposed a shaft speed extraction scheme based on TFA. Short-Time Fourier Transform (STFT) was applied to obtain the time–frequency representation (TFR) of the vibration response. The estimated speed derived from the spectrogram was utilized for angular resampling. Subsequently, the desired components were extracted in the angular domain using a band-pass filter and resampled back to the time domain. Wang et al. [
10] employed a fast spectral kurtosis algorithm to obtain the bearing envelope signal adaptively. Subsequently, the instantaneous fault characteristic frequency was extracted for signal resampling based on the TFR of STFT. Zhu et al. [
11] estimated the instantaneous speed using STFT and resampled the vibration in the angular domain. The Teager–Kaiser energy operator was then applied to enhance the fault components in the signal, followed by processing the enhanced signal using fast spectral correlation. Envelope analysis was performed to extract the fault characteristics of rolling bearings. Nonetheless, because of inherent limitations in time–frequency resolution, this conventional TFA method results in a substantial error in identifying the shaft speed.
In order to achieve high-resolution representations, numerous advanced TFA methods have been developed in the past decade. Among these methods, the basis transform approach has garnered significant interest from researchers. Linear chirp basis is a prominent example, and it is commonly used in Chirplet Transform (CT) [
12] for analyzing chirp-like signals with linear frequency conversions. Zhao et al. [
13] employed the CT to obtain the TFR and extract a specific harmonic of the rotational frequency. The identification results were then utilized in Vold–Kalman filters to extract the harmonics for synchronous resampling of the original signal based on its instantaneous phase. Polynomial Chirplet Transform (PCT) [
14] replaces the linear basis with a polynomial basis to analyze single-component signals with nonlinear frequency trajectories. Wang et al. [
15] utilized the PCT to estimate the instantaneous rotational frequency of rolling bearings. On this basis, a maximum correlated kurtosis deconvolution-based envelope order spectrum was employed to detect the bearing fault characteristic order. While the abovementioned algorithms provide good TFR for single-component signals, they do not yield satisfactory results for multi-component signals since the chirp basis cannot simultaneously match the instantaneous frequency (IF) trajectories of multiple components. To tackle the analysis of practical multicomponent signals, which are commonly encountered, General Linear Chirplet Transform (GLCT) [
16] was developed. This method obtains a set of TFRs using various chirp parameters and selects the TFR with the highest amplitude at each point to form the final TFR. GLCT has demonstrated favorable results for both single-component and multicomponent signals. Liu et al. [
17] applied GLCT to estimate the instantaneous rotation frequency. The angular domain signal was then purified using an adaptive cross-validation threshold denoising algorithm, aiming to enhance the fault feature extraction performance of the envelope order spectrum method. However, these TFA methods are less effective in dealing with multicomponent signals with small intervals between adjacent frequency components.
During wind turbine operation, the complex structure of the gearbox introduces intricate amplitude and frequency modulation, especially when gear damage occurs. These modulation components manifest as time–frequency ridges close to the meshing frequency and its harmonics in TFR [
18]. However, identifying the meshing frequencies that are associated with shaft speeds using TFA faces significant challenges. At low wind speeds, neighboring frequency ridges are closely spaced, while variable speed conditions lead to the blurring of time–frequency ridges. These factors pose difficulties for conventional TFA methods.
Li et al. introduced the Scaling-Basis Chirplet Transform (SBCT) [
19], which employs a second-order polynomial to construct the chirplet basis function. This time–frequency basis can adaptively scale within a specified window and utilizes the kurtosis criterion to determine optimal parameters for matching the desired frequency trajectory. Consequently, it generates a time and frequency varying linear chirp basis. Compared to other TFA methods, SBCT exhibits notable advantages in effectively handling synchronous signals characterized by dense frequency content and nonlinear variations, including harmonic components of vibration signals, modulated signals with complex sidebands, and signals with strong noise backgrounds.
Therefore, a simple and yet effective approach is proposed in this paper. The SBCT is employed to perform time–frequency transformation of wind turbine vibration data first. The instantaneous shaft speed is identified from the time–frequency spectrogram by the maxima tracking. The phase information of the target shaft speed is derived by numerical integration. The original signal is then resampled synchronously using an inverse function interpolation method. Order analysis without tachometer assistance is finally achieved and the damage feature is extracted from the order spectrum.
The rest of this paper is structured as follows:
Section 2 illustrates the principle of SBCT algorithm.
Section 3 describes the process of the SBCT-based instantaneous shaft speed identification method.
Section 4 details the process of this methodology through numerical simulation signals.
Section 5 verifies the proposed methodology with two practical cases of wind turbines. Finally,
Section 6 provides the conclusion.
2. SBCT Algorithm
Time–frequency analysis expands the signal from a one-dimensional time series to a two-dimensional time–frequency plane in order to observe the IF of the signal.
CT is the inner product between the signal and the chirp basis, and the
CT of the signal
can be expressed as follows:
where
is the analytic signal of
generated by the Hilbert transform;
denotes a real, nonnegative, symmetric and normalized window function, usually denoted as a Gaussian function;
denotes the standard deviation;
is the phase function;
and
represent the frequency center and time center, respectively; and
represents the chirp rate, which is a constant.
The first- and second-order derivatives of
are expressed as:
where
denotes the IF and
is the rotation angle of the IF trajectory, which varies from
to
.
The CT is essentially a windowed transformation. The ultimate TFR is constructed by processing each segment of the windowed signal. The degree of energy concentration in the TFR increases with improved alignment between the TF bases and the IF trajectory. The TFR demonstrates maximum energy concentration when the TF bases entirely coincide with the IF trajectories [
20]. This happens when the tangent value of the rotation angle matches the slope of the target IF trajectory.
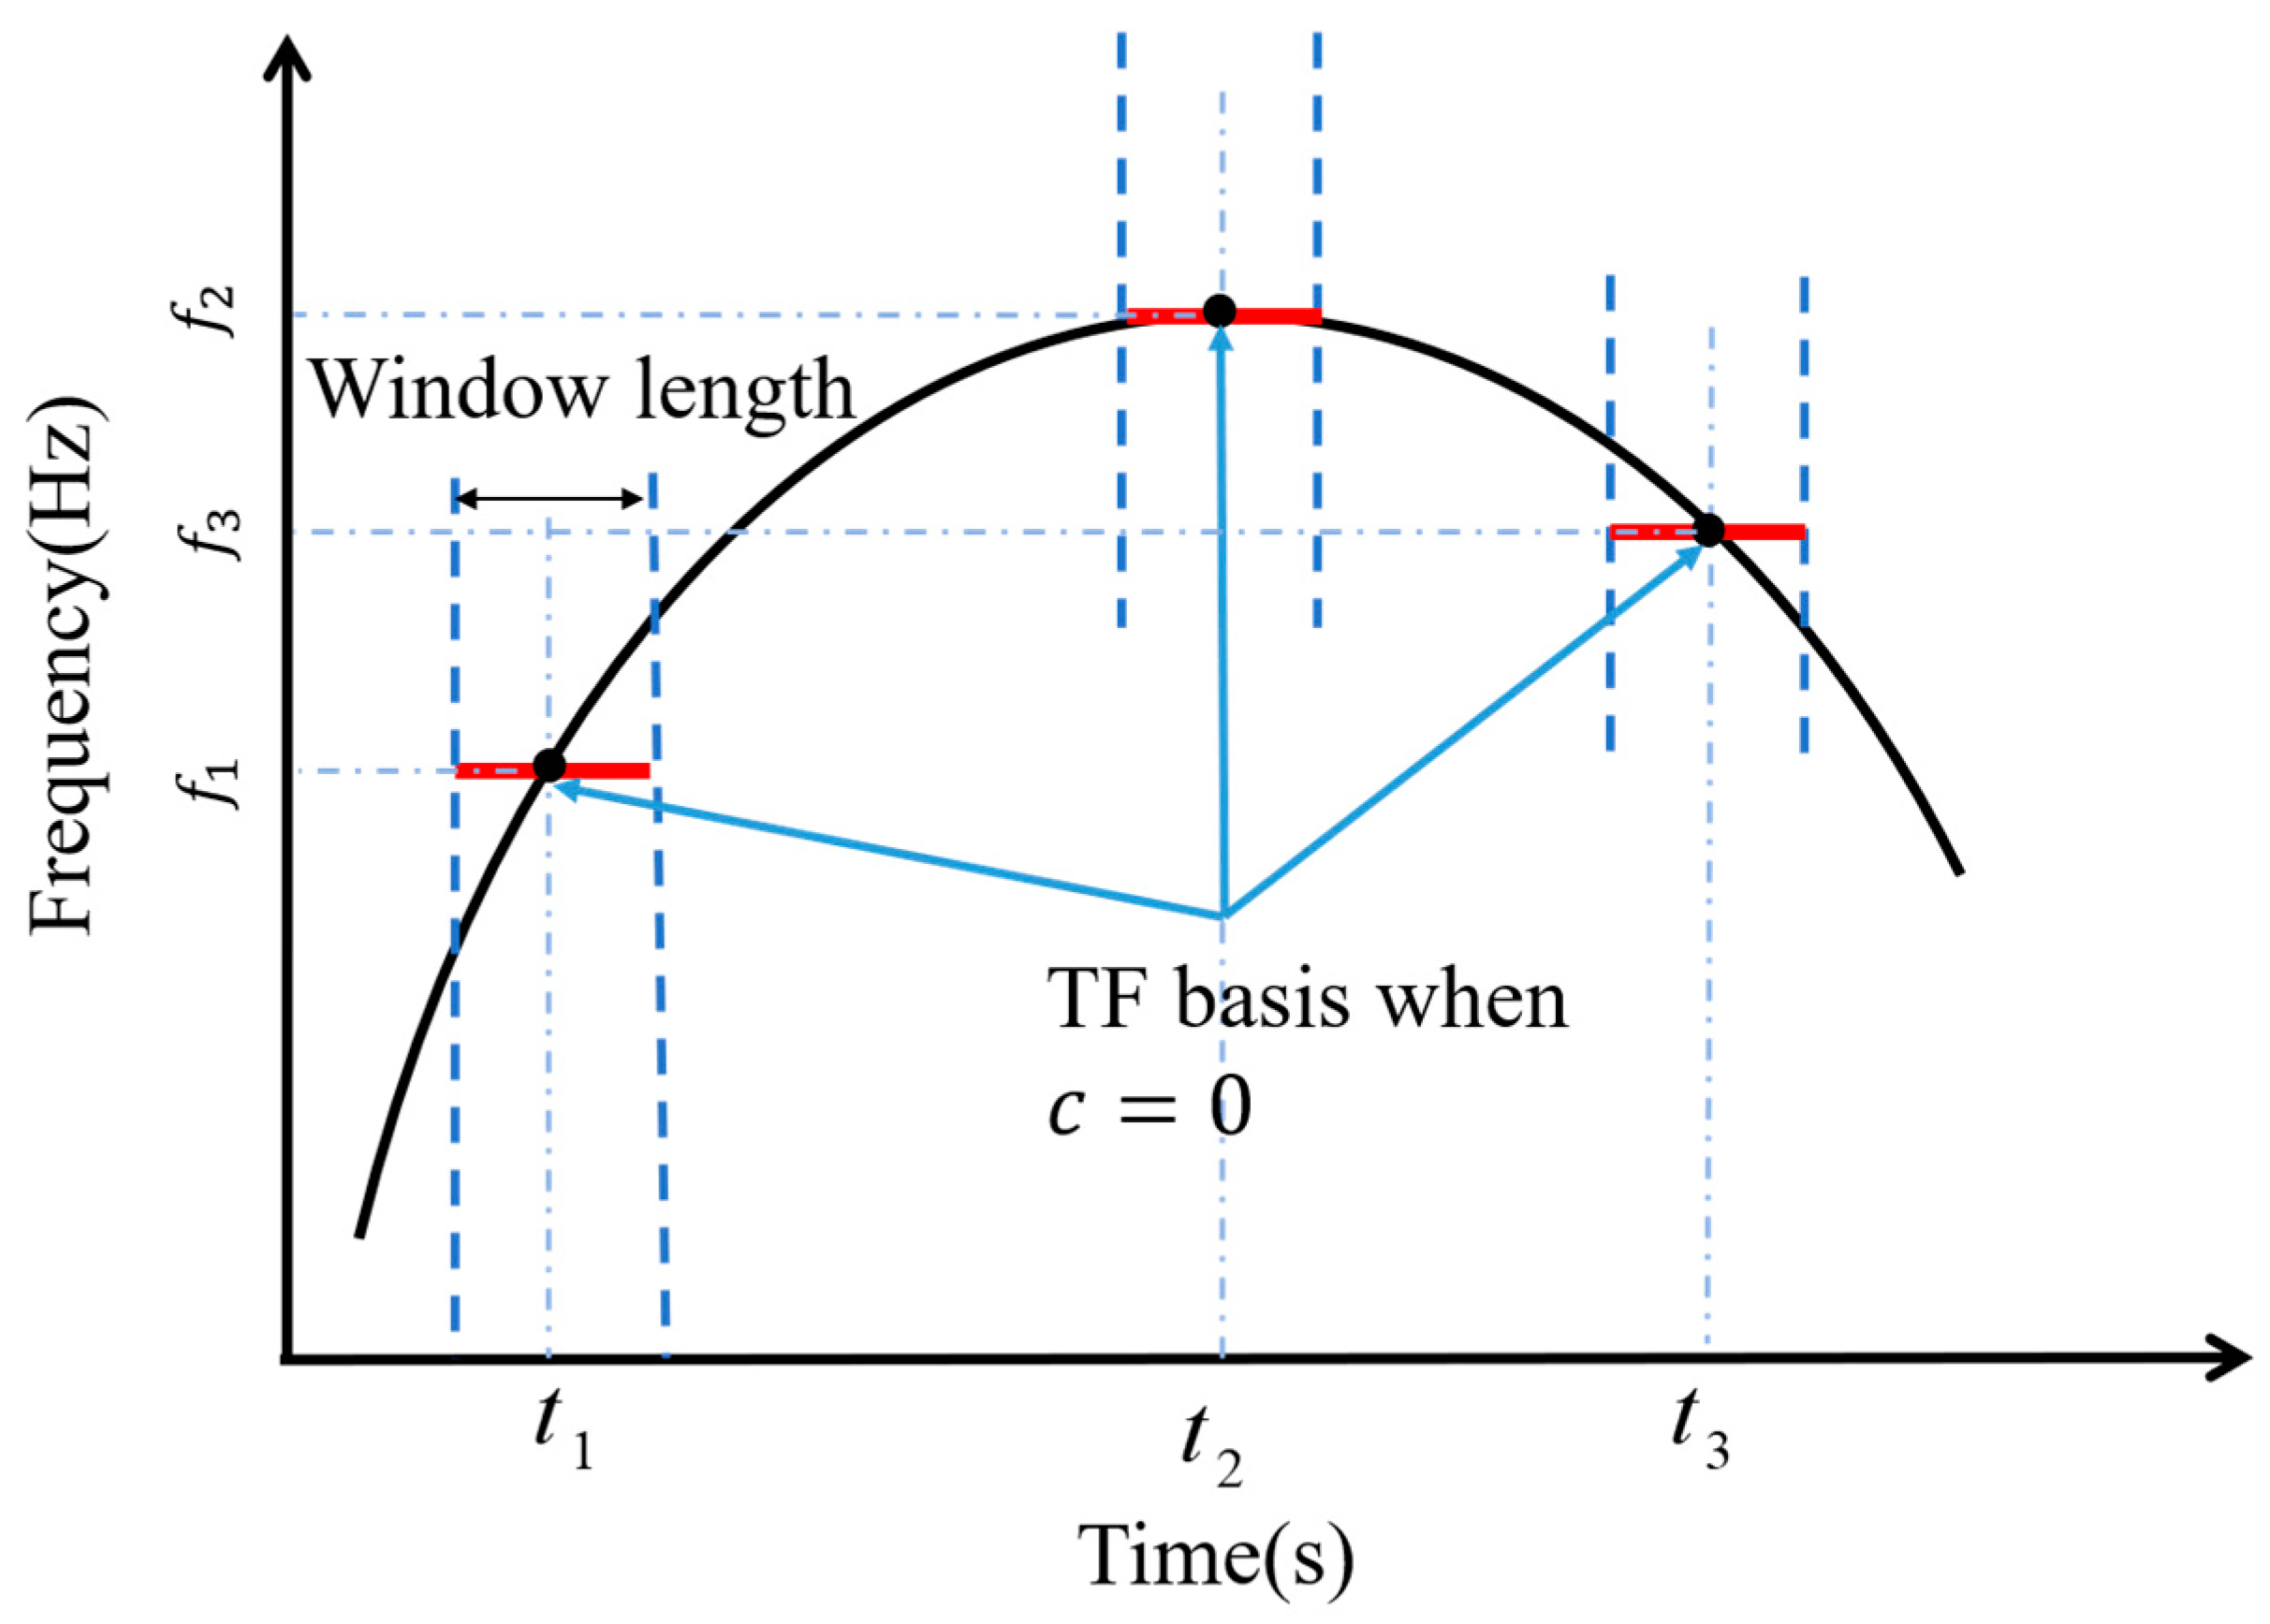
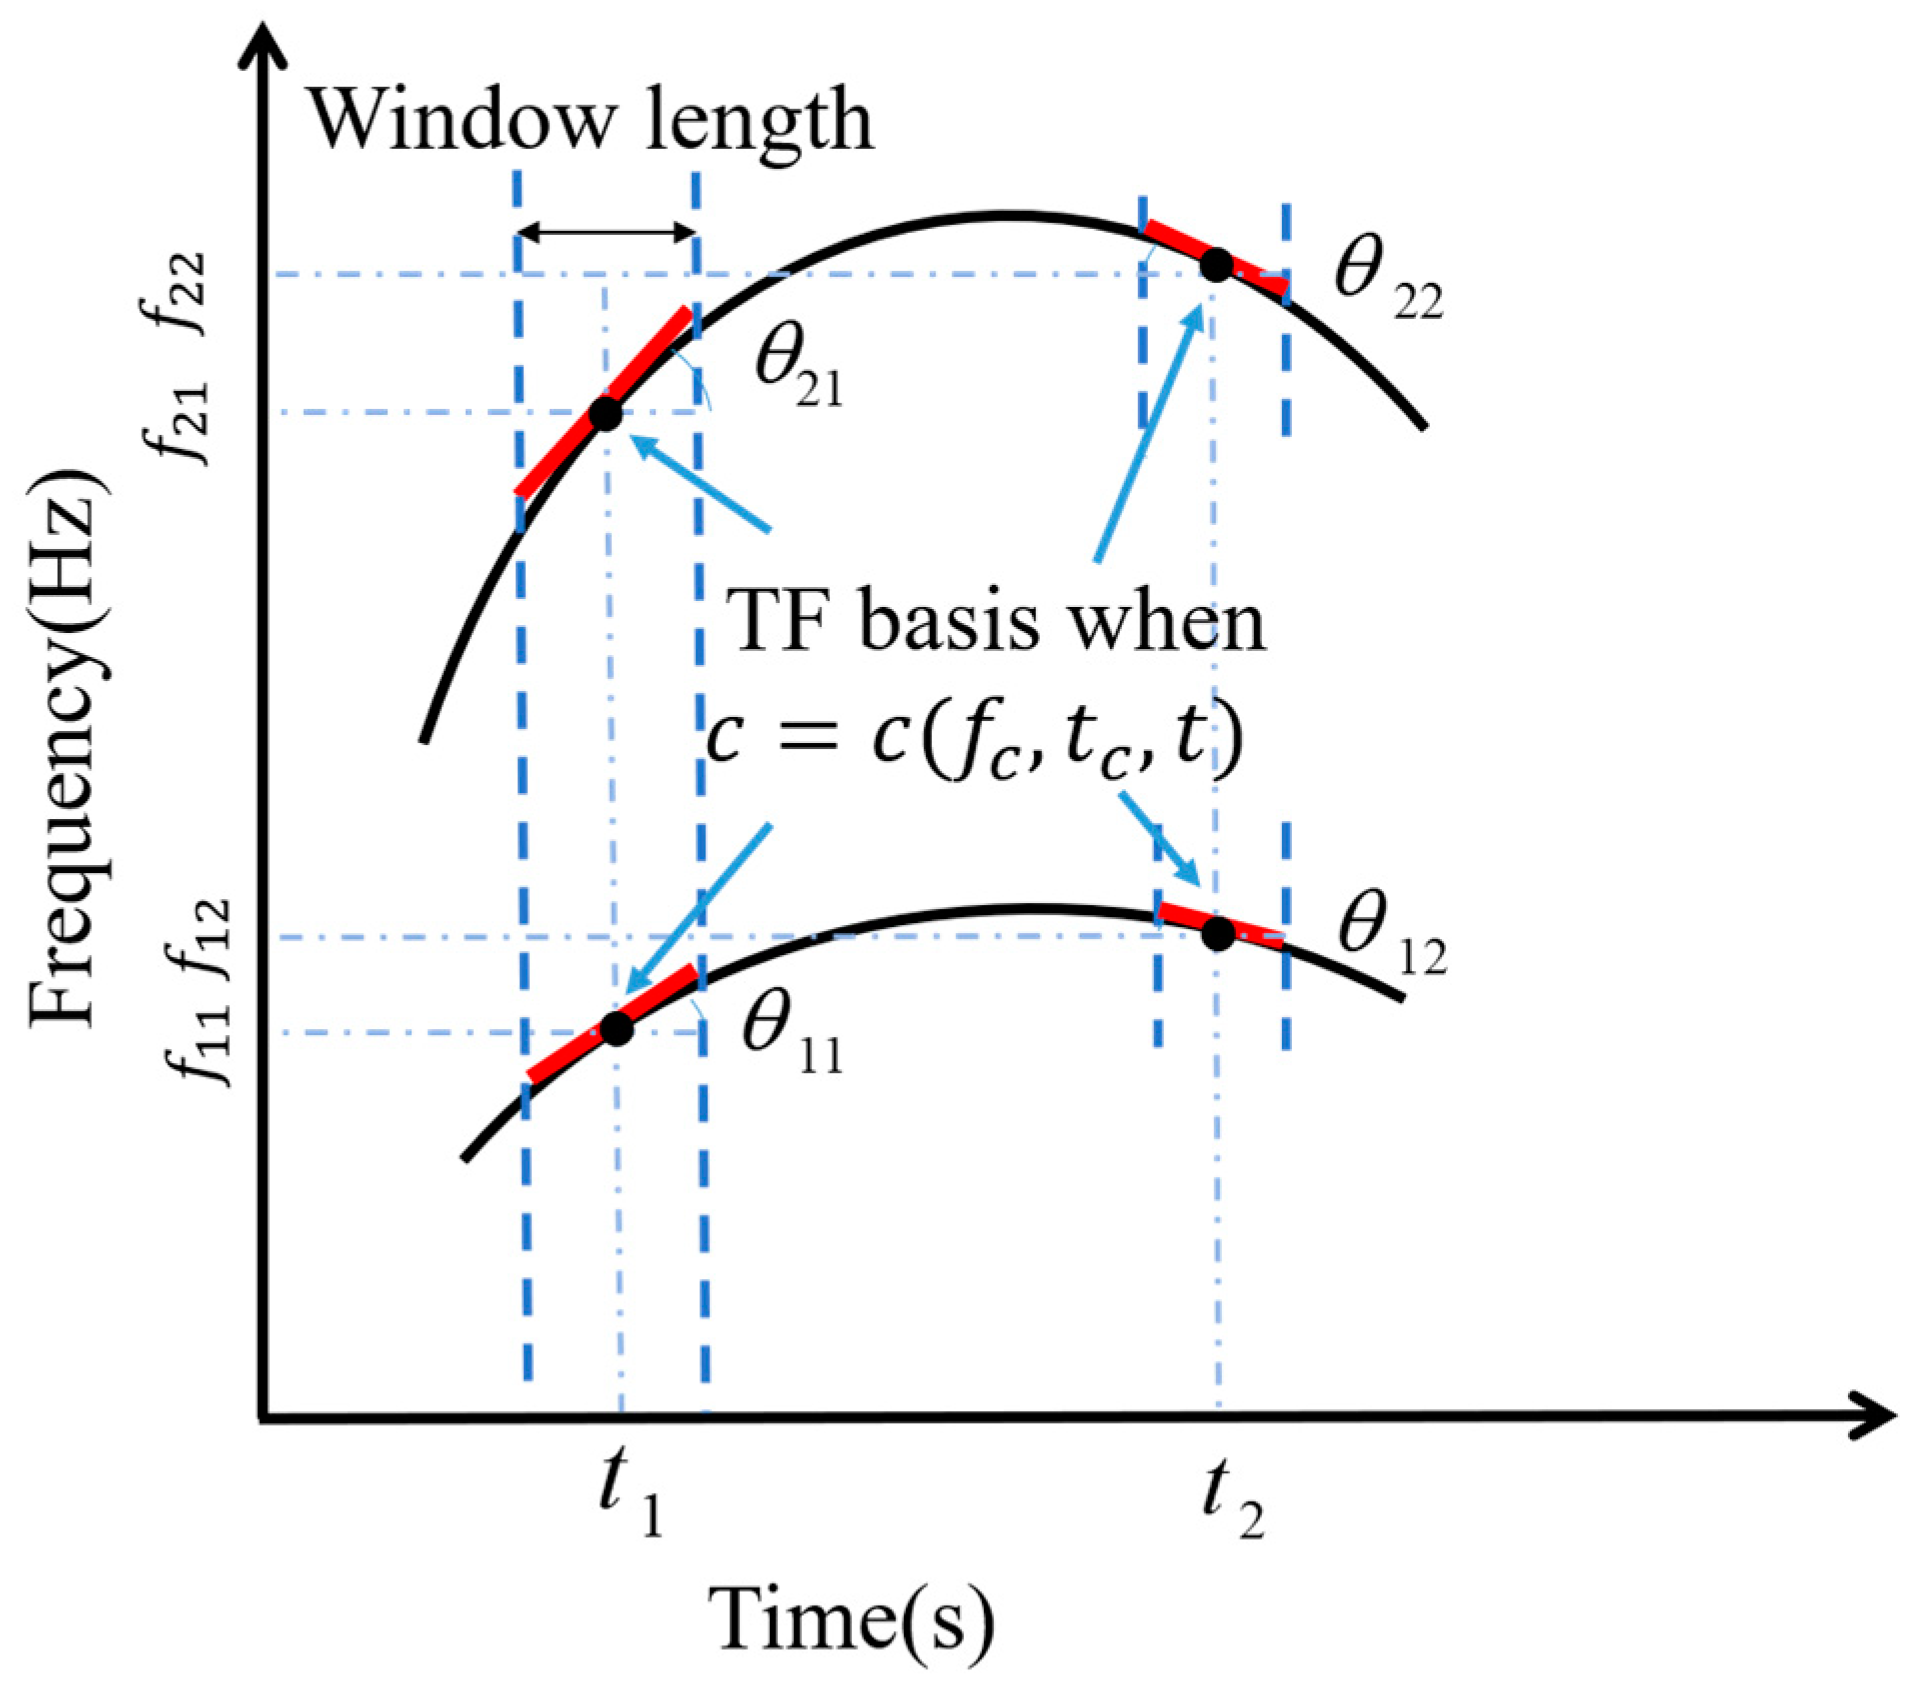
The matching principle between the TF bases and target IF trajectories within a specific window length is elucidated in the following three figures. The black line is the true IF, the red line denotes the TF base, and the blue dashed line denotes the analysis window.
A point on the IF is represented by a black dot, and its time and frequency values are marked with a light blue dashed line.
As per Equation (6), when
is set to zero, the CT becomes equivalent to the STFT, as illustrated in
Figure 1. In essence, the STFT can be seen as a simplified variant of the CT when
equals zero. In such instances, the TF bases run parallel to the time axis, aligning exclusively at the time center
. Mismatches occurring elsewhere lead to notably diminished energy concentration.
If C represents a nonzero constant, the TF bases undergo rotation by an angle
around the points (
,
) (
, as depicted in
Figure 2. When the chirp rate closely matches the slope of the time–frequency ridge or, in simpler terms, the rotation angle of the bases closely matches the inclination angle of the IF trajectory, this results in higher energy concentration within the TFR. Consequently, CT exhibits superior performance in processing linear frequency modulation (FM) signals when compared to STFT.
However, the CT’s constant chirp parameters impose limitations when analyzing highly nonlinear FM signals. When handling nonlinear FM signals, both STFT and CT struggle to achieve significant energy concentration at specific time points. For instance, the STFT results at and the CT results at .
SBCT constructs the chirp basis by means of a second-order polynomial. Its second-order derivative, i.e., the chirp parameter, varies adaptively with frequency and time, and matches the time–frequency trajectories of different frequency components and time centers. The new phase function is constructed in the following form:
The corresponding first-order and second-order derivatives are expressed as follows:
Equation (9) can be rewritten when
is equal to the time center
as follows:
where
is the rotation angle of the time–frequency basis at the time center
. From Equation (10), it can be seen that the value of
varies with the frequency center, that is, the chirp rate varies with the range of the frequency trajectory. For a multicomponent signal with
frequency components at the time center
, the chirp rate can be calculated as follows:
Considering
, Equation (11) can be rewritten as follows:
In summary, the
SBCT of the signal
is expressed as follows:
where
are parameters that need to be determined before performing
SBCT. Considering the balance between accuracy and cost of the calculation, the value
is usually taken as 2.
According to the theory proposed by Ville, the analytic signal can be written as follows:
where
denotes the instantaneous amplitude and
denotes the IF.
Based on the Taylor expansion, the IF within the window length can be written as follows:
where
is the value of the IF at the moment
;
and
are the first and second order derivatives of the IF. Higher-order terms are neglected in Equation (15).
Substituting Equations (14) and (15) into Equation (13), the following expressions are obtained:
When the two following equations are satisfied, the equation in Equation (16) holds and
takes the maximum value, i.e., the highest energy concentration level.
Equations (17) and (18) can be rewritten as follows:
Usually, the IF of an arbitrary signal is not known a priori, but the trajectory inclination
of the IF must vary from
to
. Therefore,
can be discretized in the following form:
where
and
denote the number of discretization points in the angle range from
to
.
Therefore, there exist
and
approximating the following equation:
The finer the discretization of , the more accurate the values of and . This facilitates the coincidence of the basis with the IF trajectory. Hence, and are usually taken as large values to satisfy and in Equations (23) and (24).
In order to further reduce the computational burden, a common practice is to introduce factors
and
and redefine as follows:
where
and
are parameters generally larger than 1 that produce moderate variations in
when
and
are set to low values. If the target IF trajectory changes drastically, the values of
and
will be set to lower values, e.g., 1.
When the rotation angle of the basis is approximately equivalent to the inclination angle of the IF trajectory, the amplitude of the frequency component reaches the maximum. The kurtosis reaches the maximum as well under this condition. Therefore,
and
can be determined in accordance with the following kurtosis theory:
where the frequency range in TFR is
.
Hence,
SBCT can be expressed as:
The schematic diagram of SBCT is shown in
Figure 3. The chirp rate varies with both frequency and time, achieved by searching for the best parameters around the respective time centers
by kurtosis theory. By assigning reasonable values to
, the TF base is “scaled” within a certain window length. This scaling enables the bases to effectively match the nonlinear IF trajectory of a multicomponent signal and thus improves the TFR energy concentration.
3. Synchronous Sampling with SBCT
During the operation of rotating machinery, the failure characteristic frequency of a mechanical component, such as shaft unbalance response or damage characteristics of bearings and gears, are directly related to the speed of the shaft to which the component is connected. When the shaft speed changes, discretizing the vibration response signal in an equal-delta-time manner can lead to the dispersion of frequency components in the spectrum, making it difficult to identify fault features (as shown in
Figure 4A). By resampling the vibration data with equal shaft circumferential angles, the response signal is converted into a cyclostationary waveform over the shaft period, which makes it achieve minimal or no energy leakage on the order spectrum, and therefore, a higher-precision fault feature can be extracted (as shown in
Figure 4B).
The key to performing synchronous sampling is to acquire an accurate shaft rotational speed. There are many ways to extract the instantaneous speed from the vibration response. Time–frequency spectrogram-based maximum tracking is a technique that is easy to understand and implement.
Figure 5 shows the flow chart of this methodology, where the SBCT is employed in TFA due to its IF energy concentration and closely spaced frequency component separation capabilities.
The main steps of the procedure are as follows:
For a discrete vibration time series, perform
SBCT to form a TFR:
where
is the window size.
- 2.
Track the maxima value to extract the instantaneous speed. The maximal tracking algorithm tracks the maximum magnitude point in the frequency direction at each time point. Assume that in the acceleration-based time–frequency spectrogram the rotational frequency is . The most significant component of the vibration response is not necessarily the shaft response itself, but some other frequency response, such as the gear mesh response or its harmonics, that may have a better overall signal-to-noise ratio (SNR). To improve the detection accuracy, the maximum value can be tracked at the frequency component of , where is a constant determined by the kinematics of the mechanical system. From the identified frequency, the shaft speed can be established.
- 3.
Identify the instantaneous phase . From the identified IF , assuming , the instantaneous phase is obtained by integration of :
- 4.
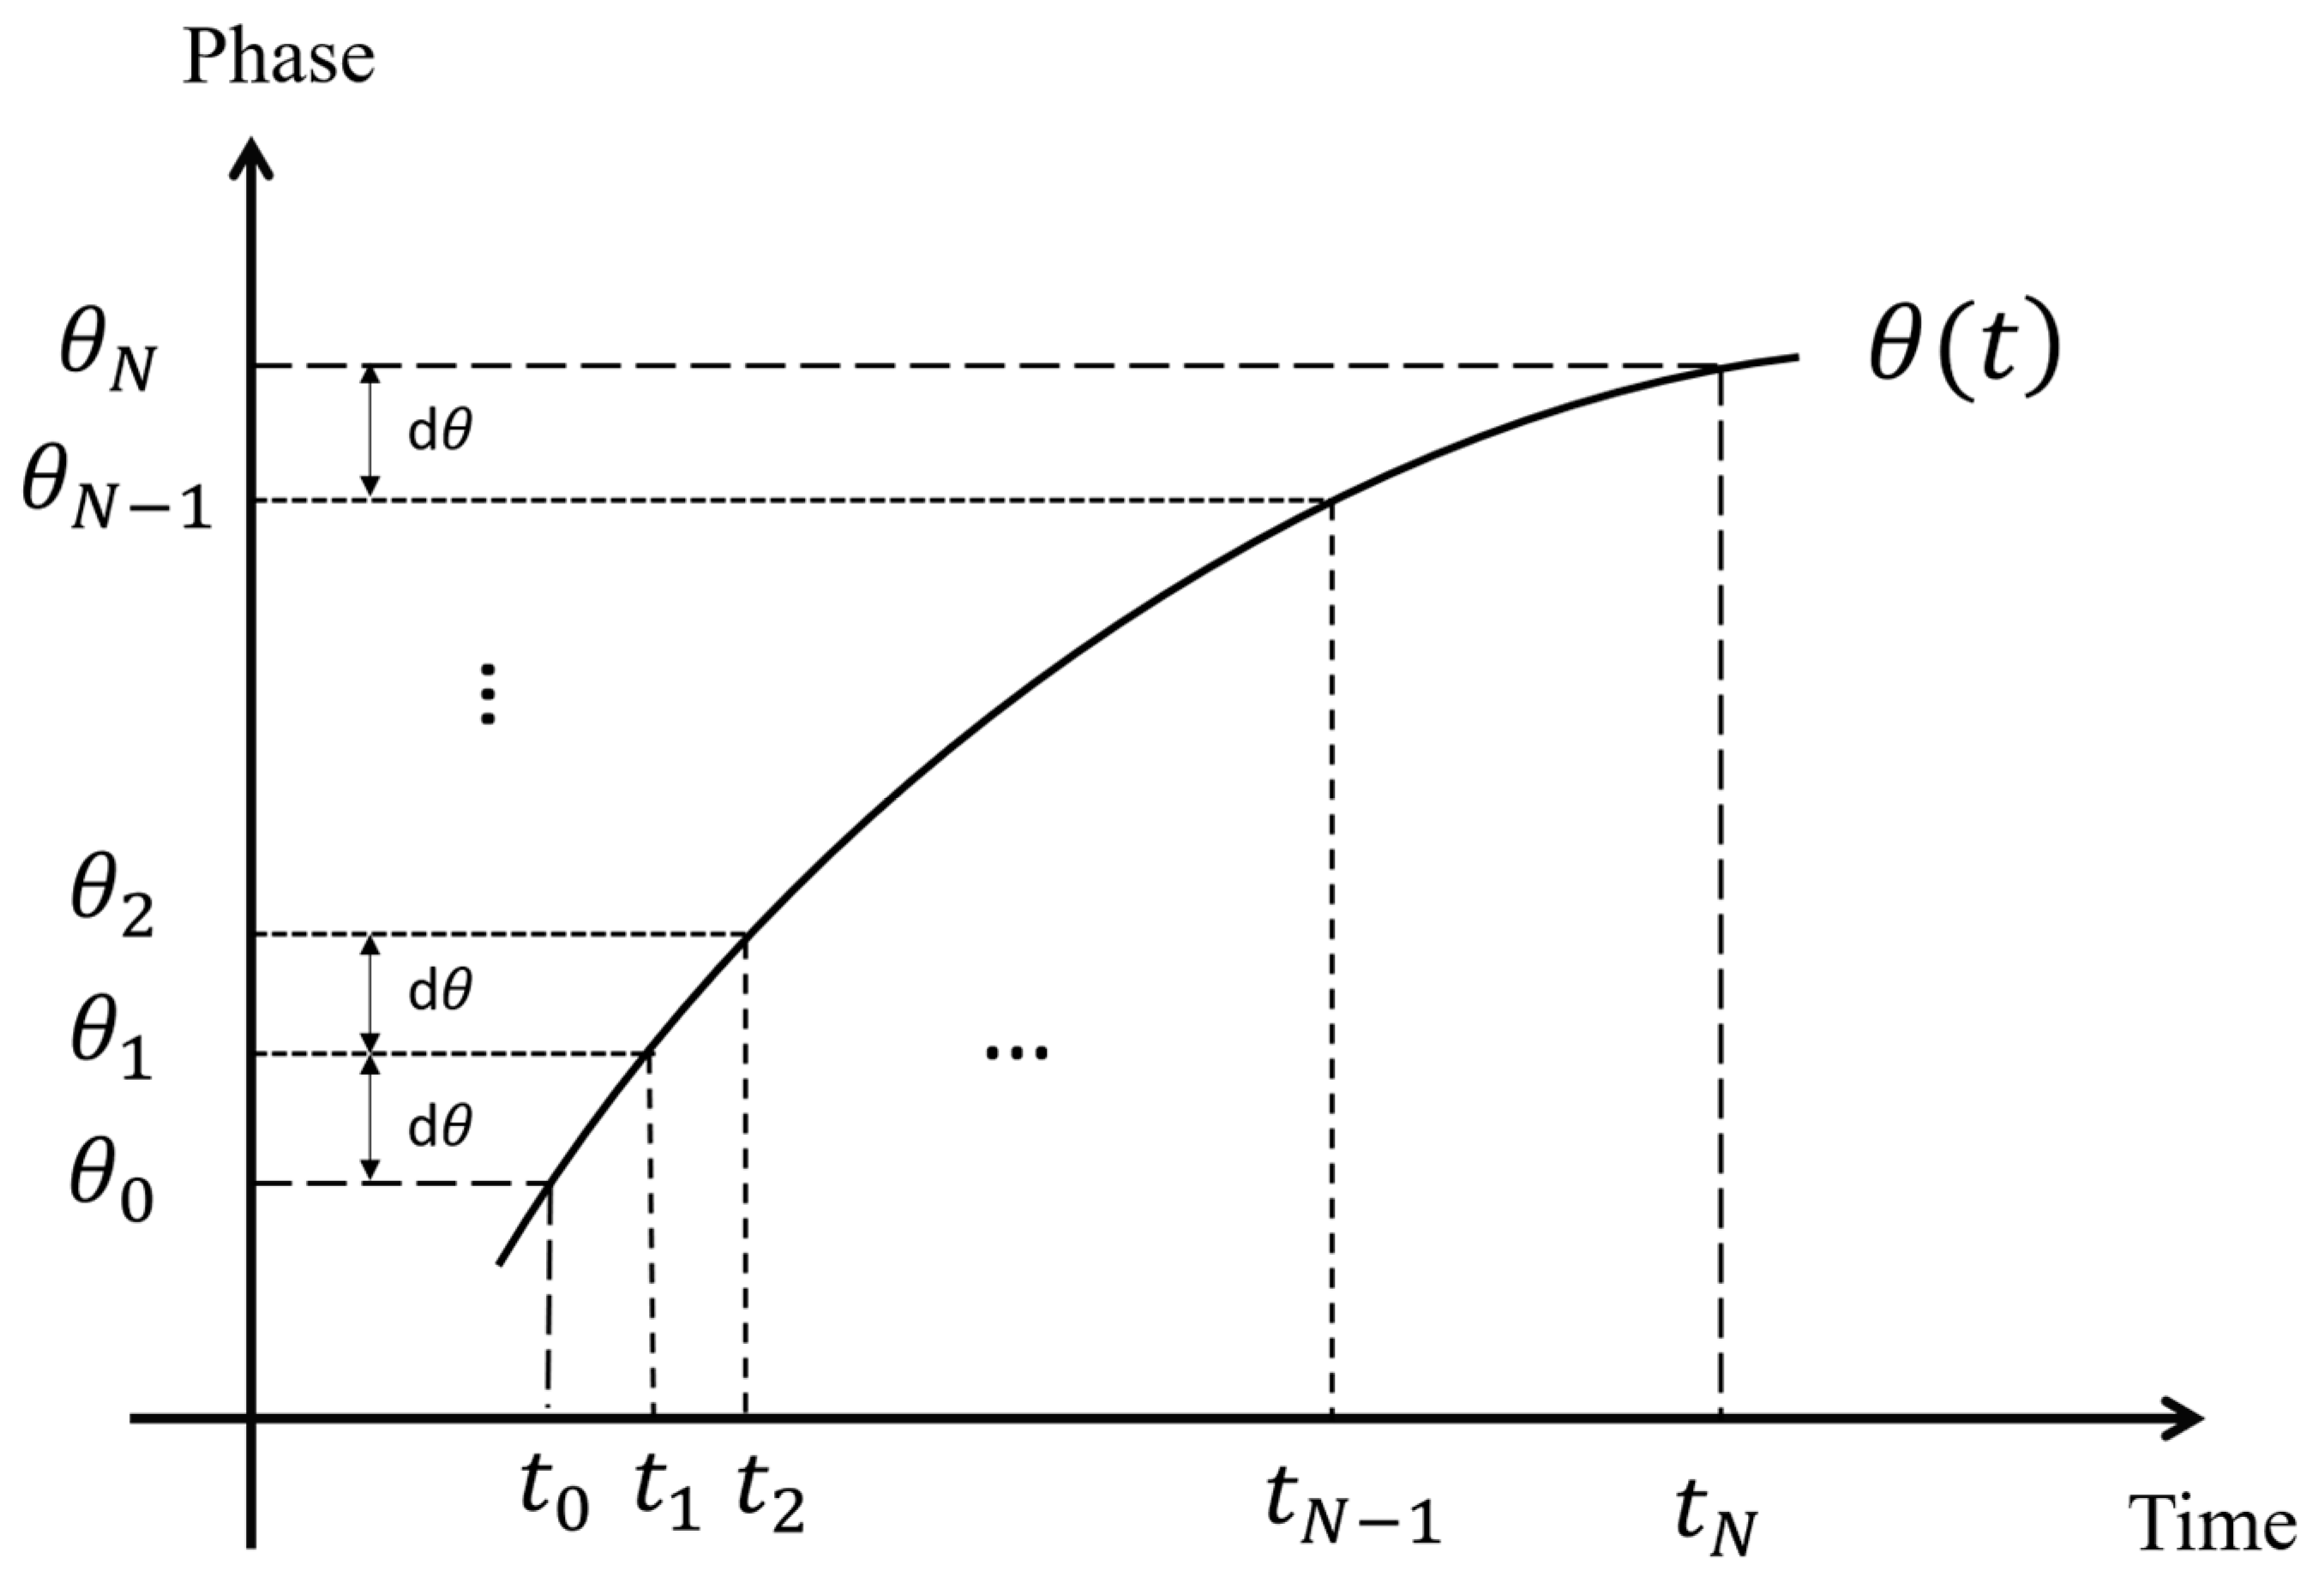
Determine the synchronous sampling time locations based on inverse function interpolation. As shown in
Figure 6, suppose the shaft rotates one circle from
to
, and the number of points sampled synchronously is
. Then, the time point of each equal rotation angle,
, can be resolved by the following equation in turn:
where
(
y-axis direction) stays equalized. However, solving Equation (31) by conventional methods requires numerical iterations, and is thus time consuming. If only the unidirectional shaft rotation is considered, the instantaneous phase function
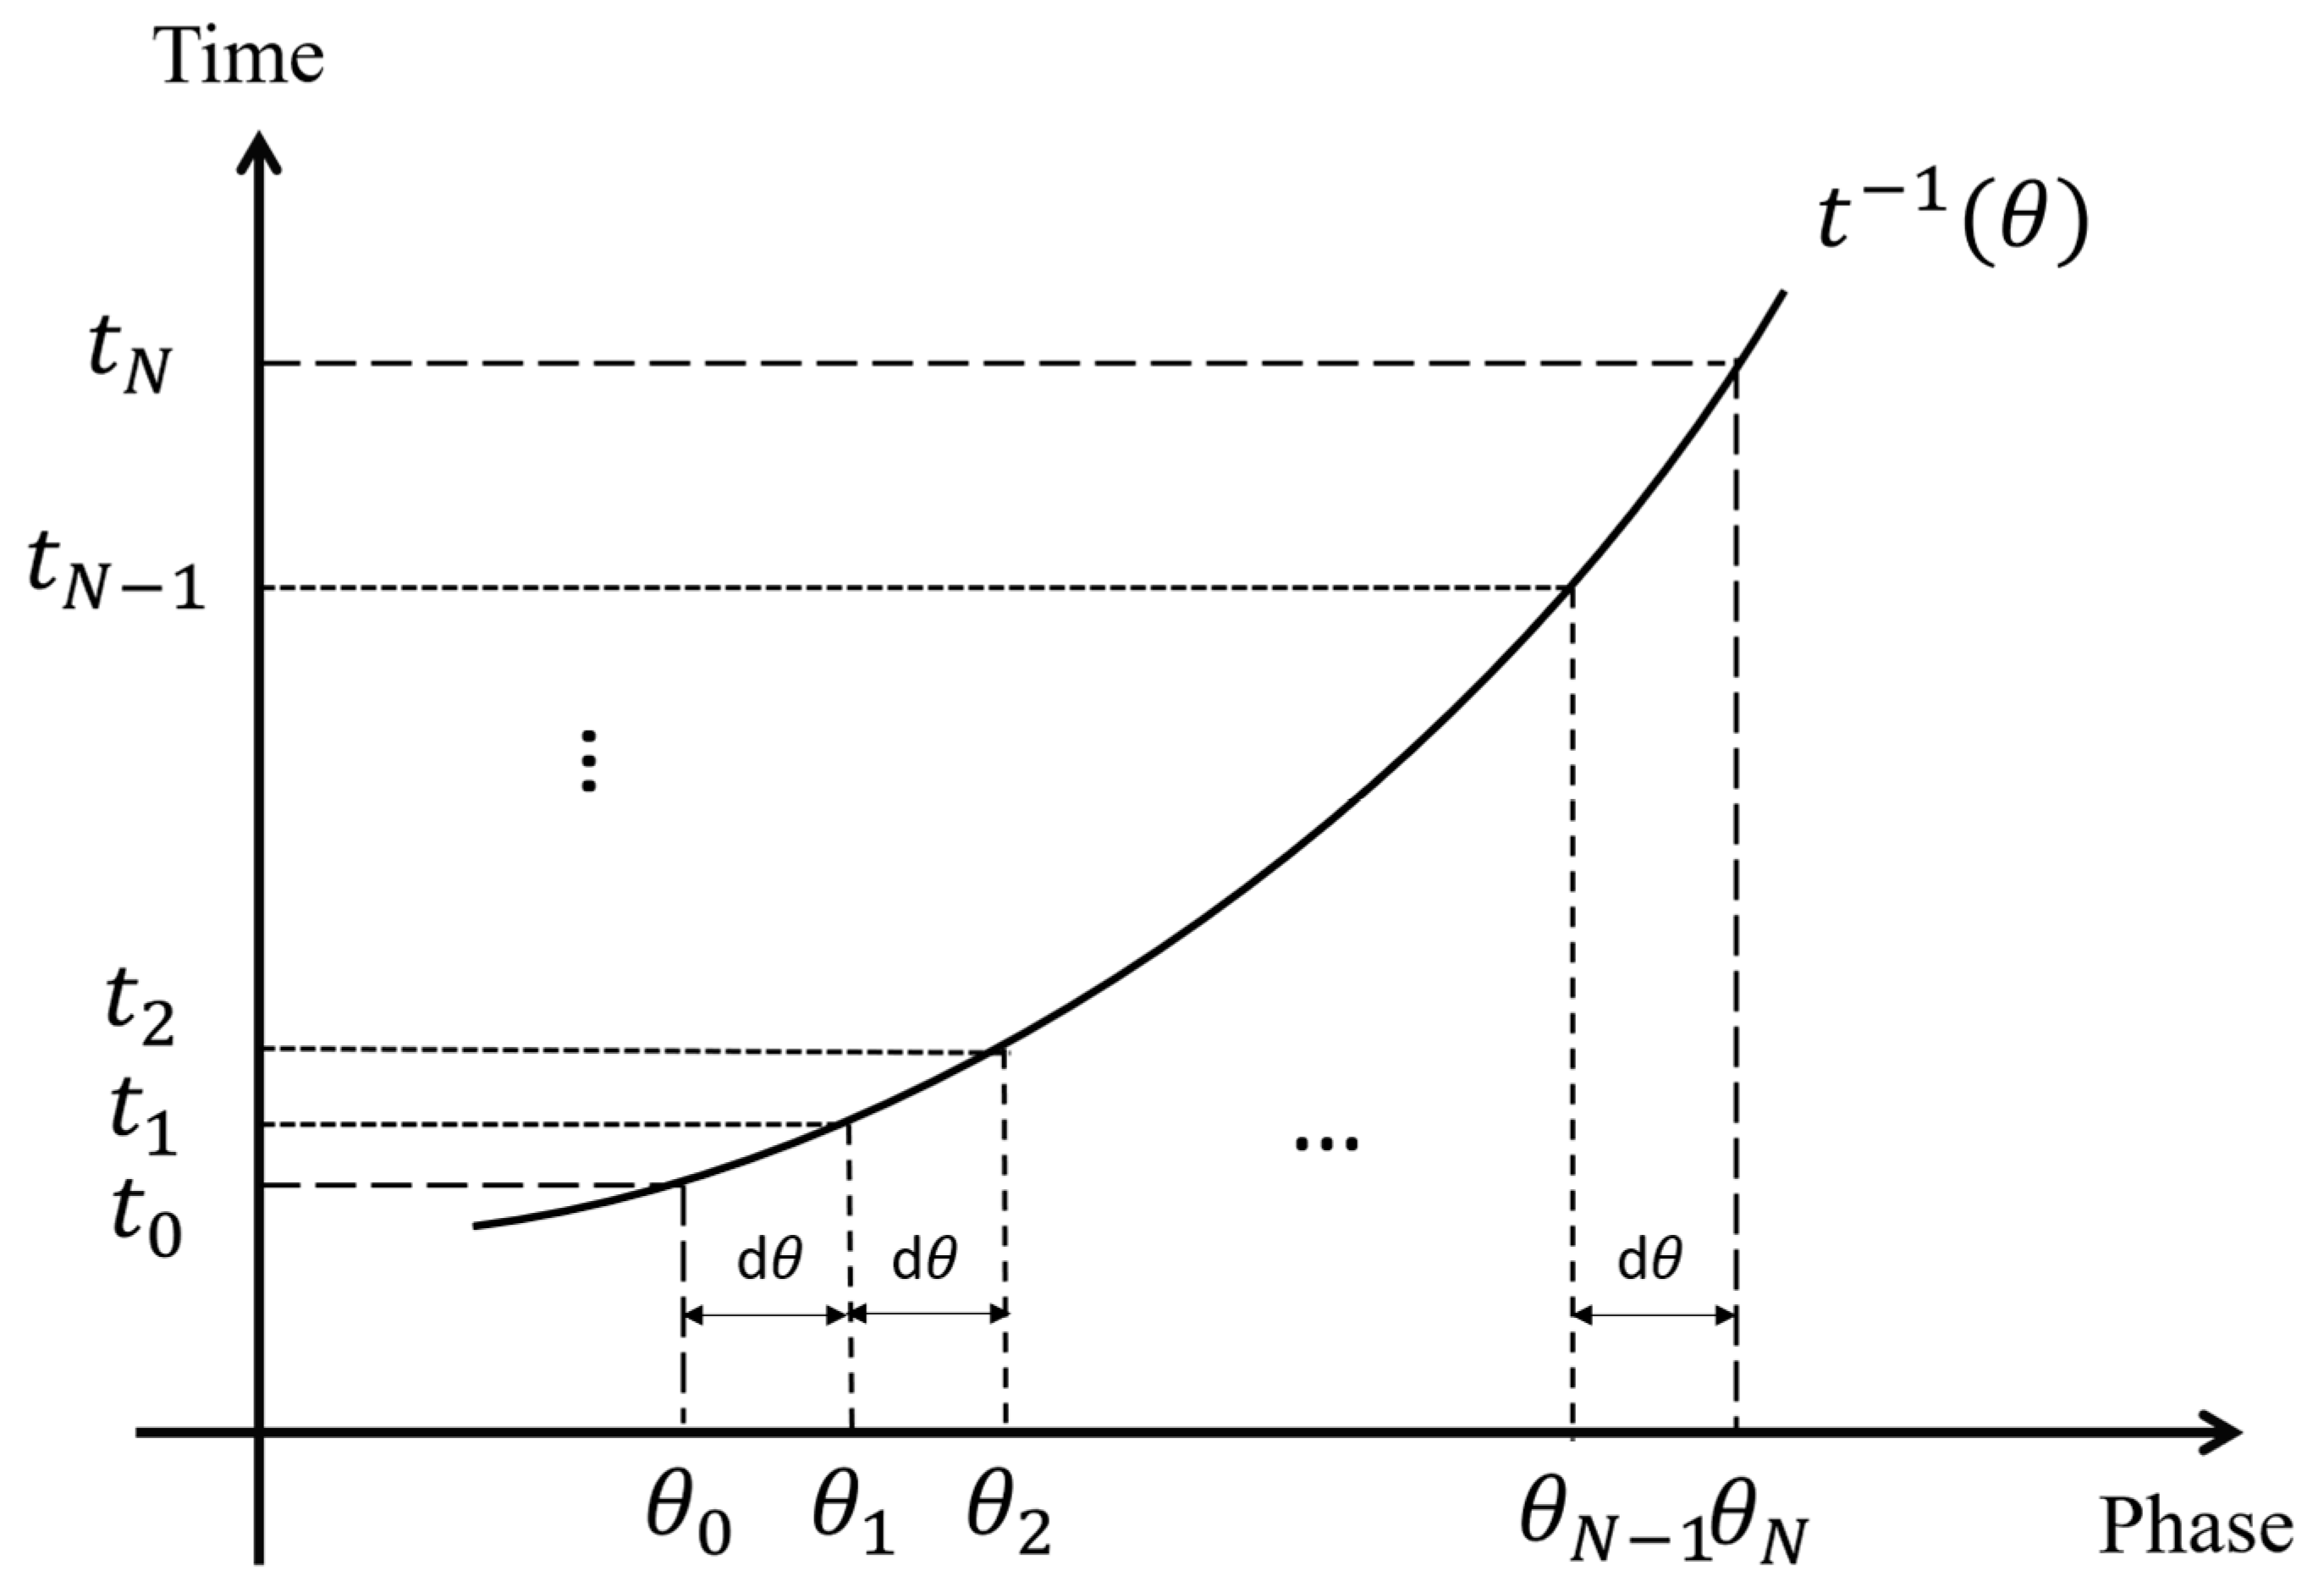
is a time-monotonic function. Its inverse function
exists and is an equally monotonic property. As shown in
Figure 7, assuming that the discrete points
, it follows that
where
(
x-axis direction) stays equalized. The discrete sampling time points,
, can be obtained by interpolating (evaluating) the inverse function
, i.e.,
By employing this approach, the computation of time stamps corresponding to shaft equal rotation angles is accomplished through a dependent variable evaluation process, rather than an iterative process. As a result, the computational time cost is significantly reduced. Furthermore, since there is no approximation involved in the evaluation of the inverse function, the synchronous resampling based on the inverse function of the instantaneous phase is expected to yield higher accuracy.
4. Numerical Simulation
To demonstrate the advantages of the proposed methodology, a faulty parallel gear meshing signal
is simulated with speed fluctuation. Without loss of generality, the gear mesh signal is assumed to be sinusoidal with three higher-order harmonics as described in Equations (35) and (36). The amplitude rises with increasing order.
where
is the shaft speed frequency;
is the modulation coefficient. The gear tooth number
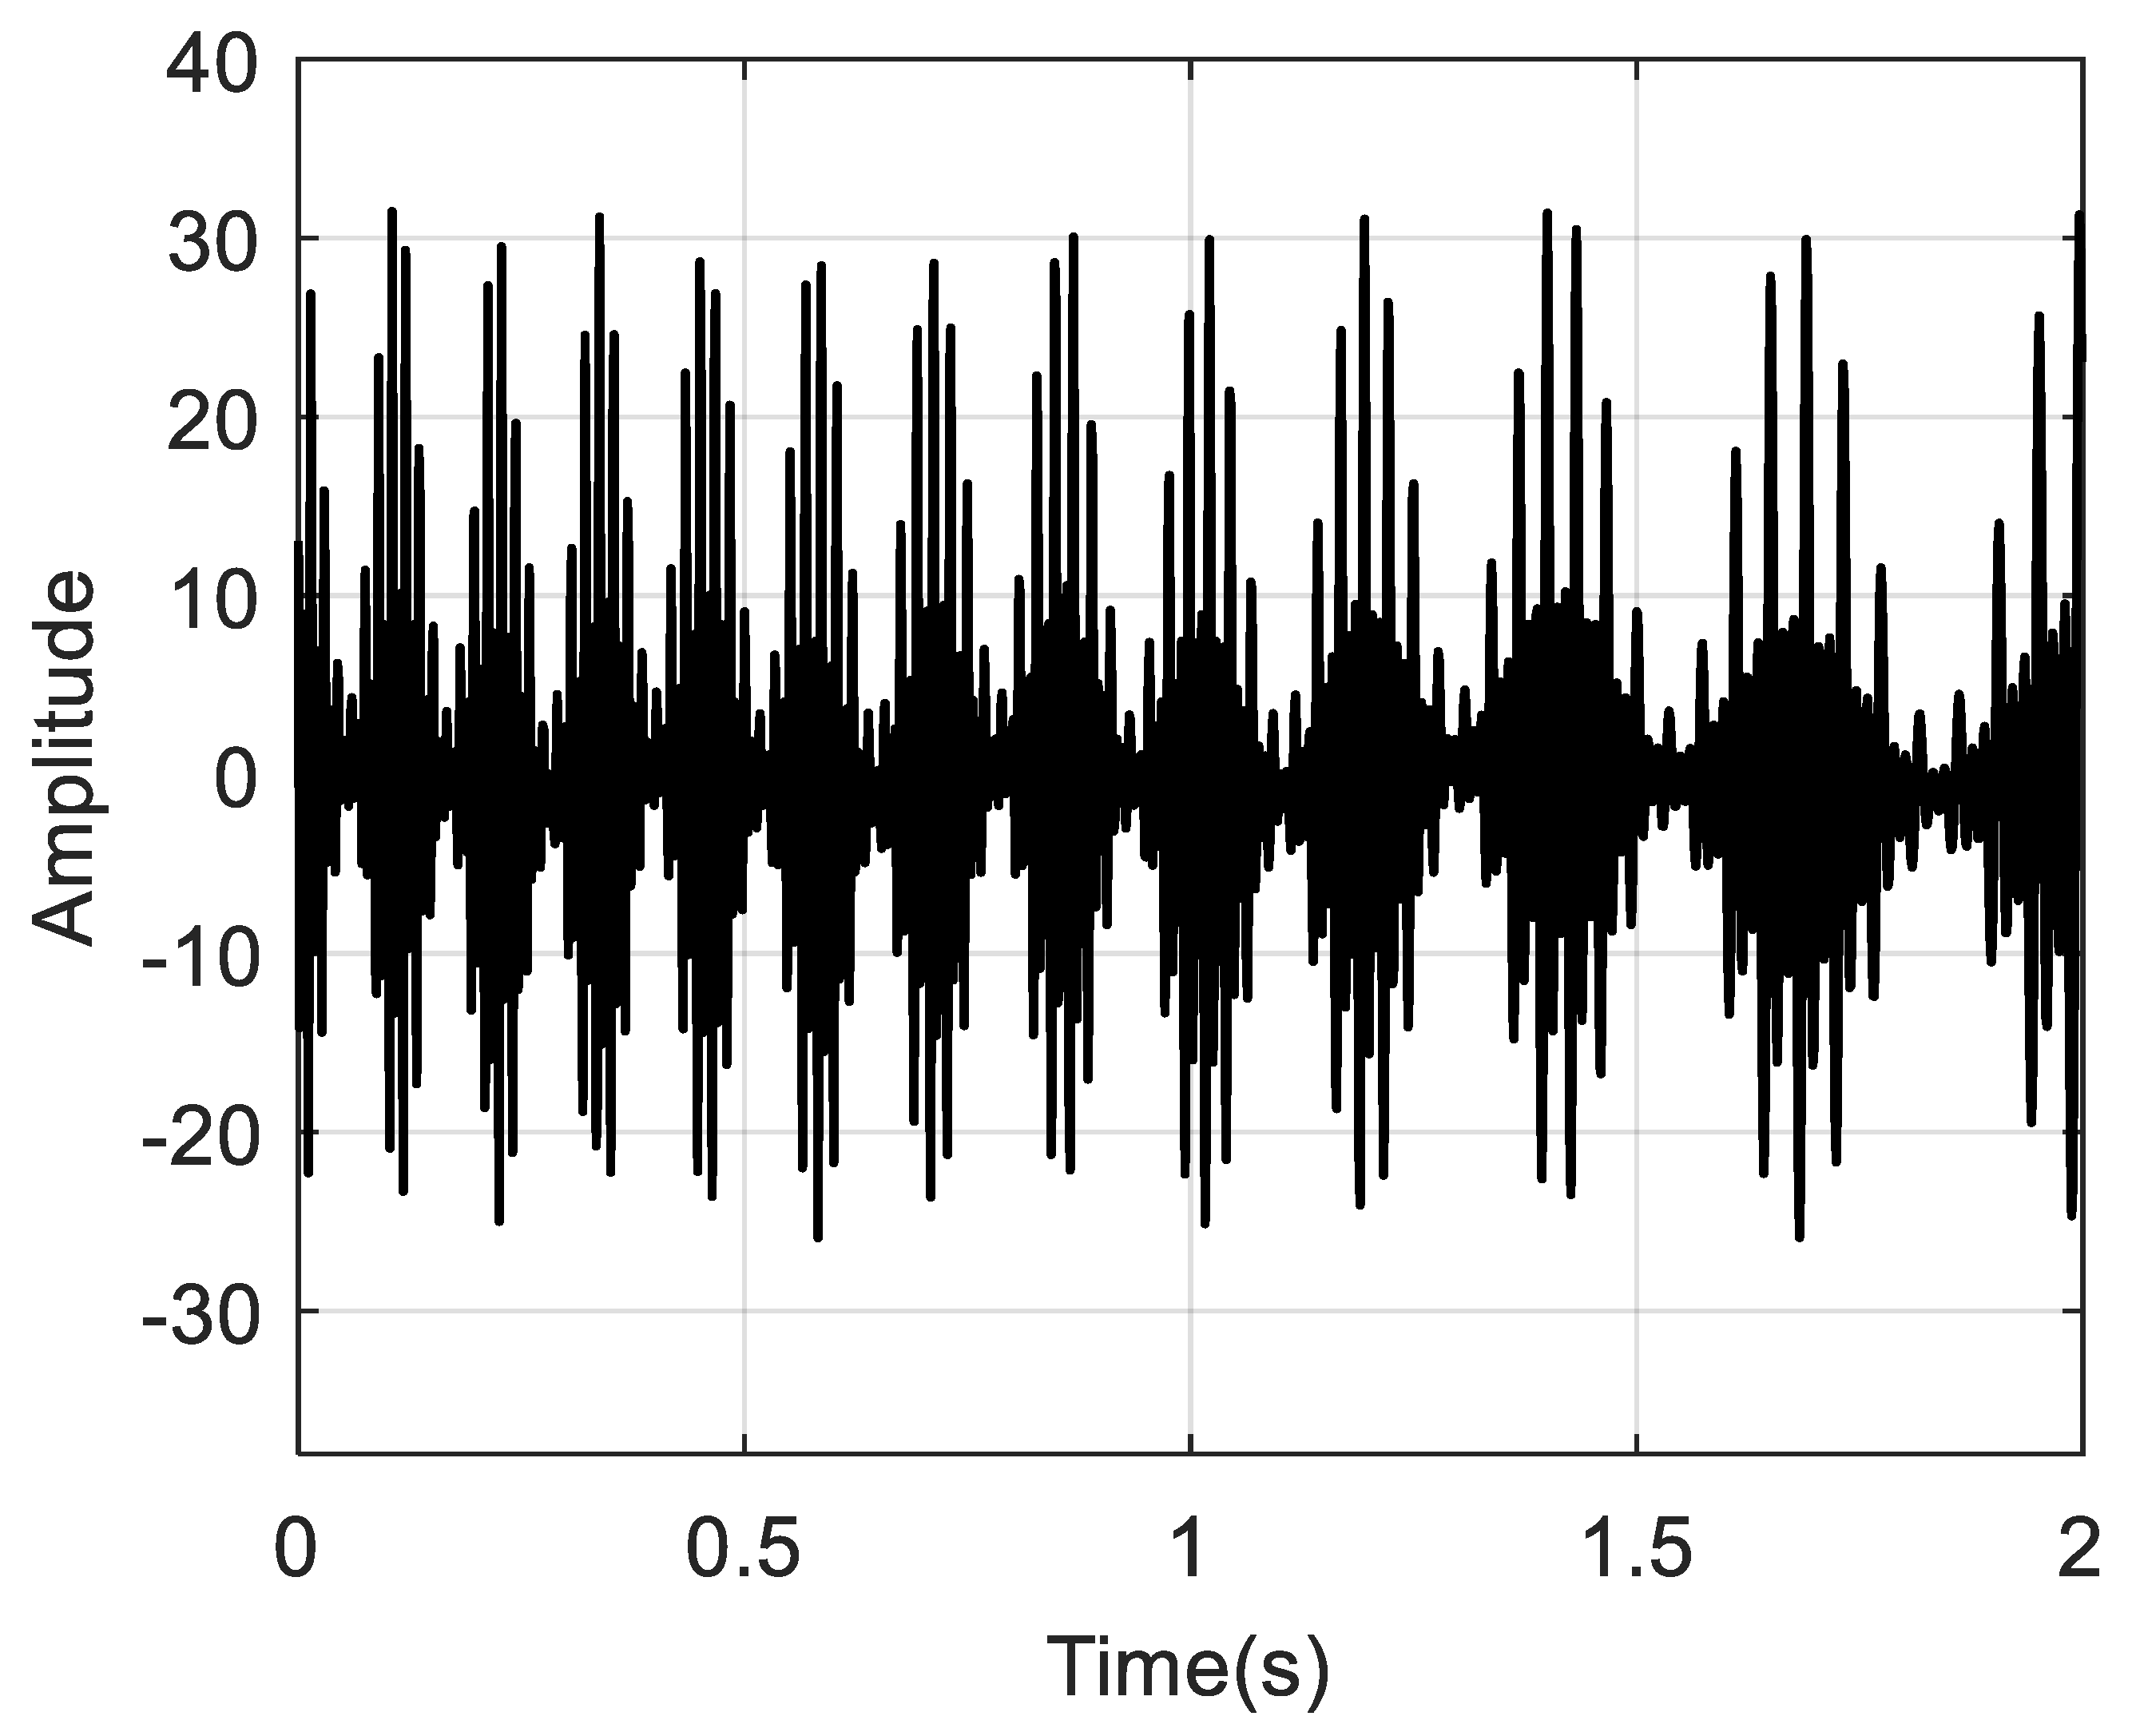
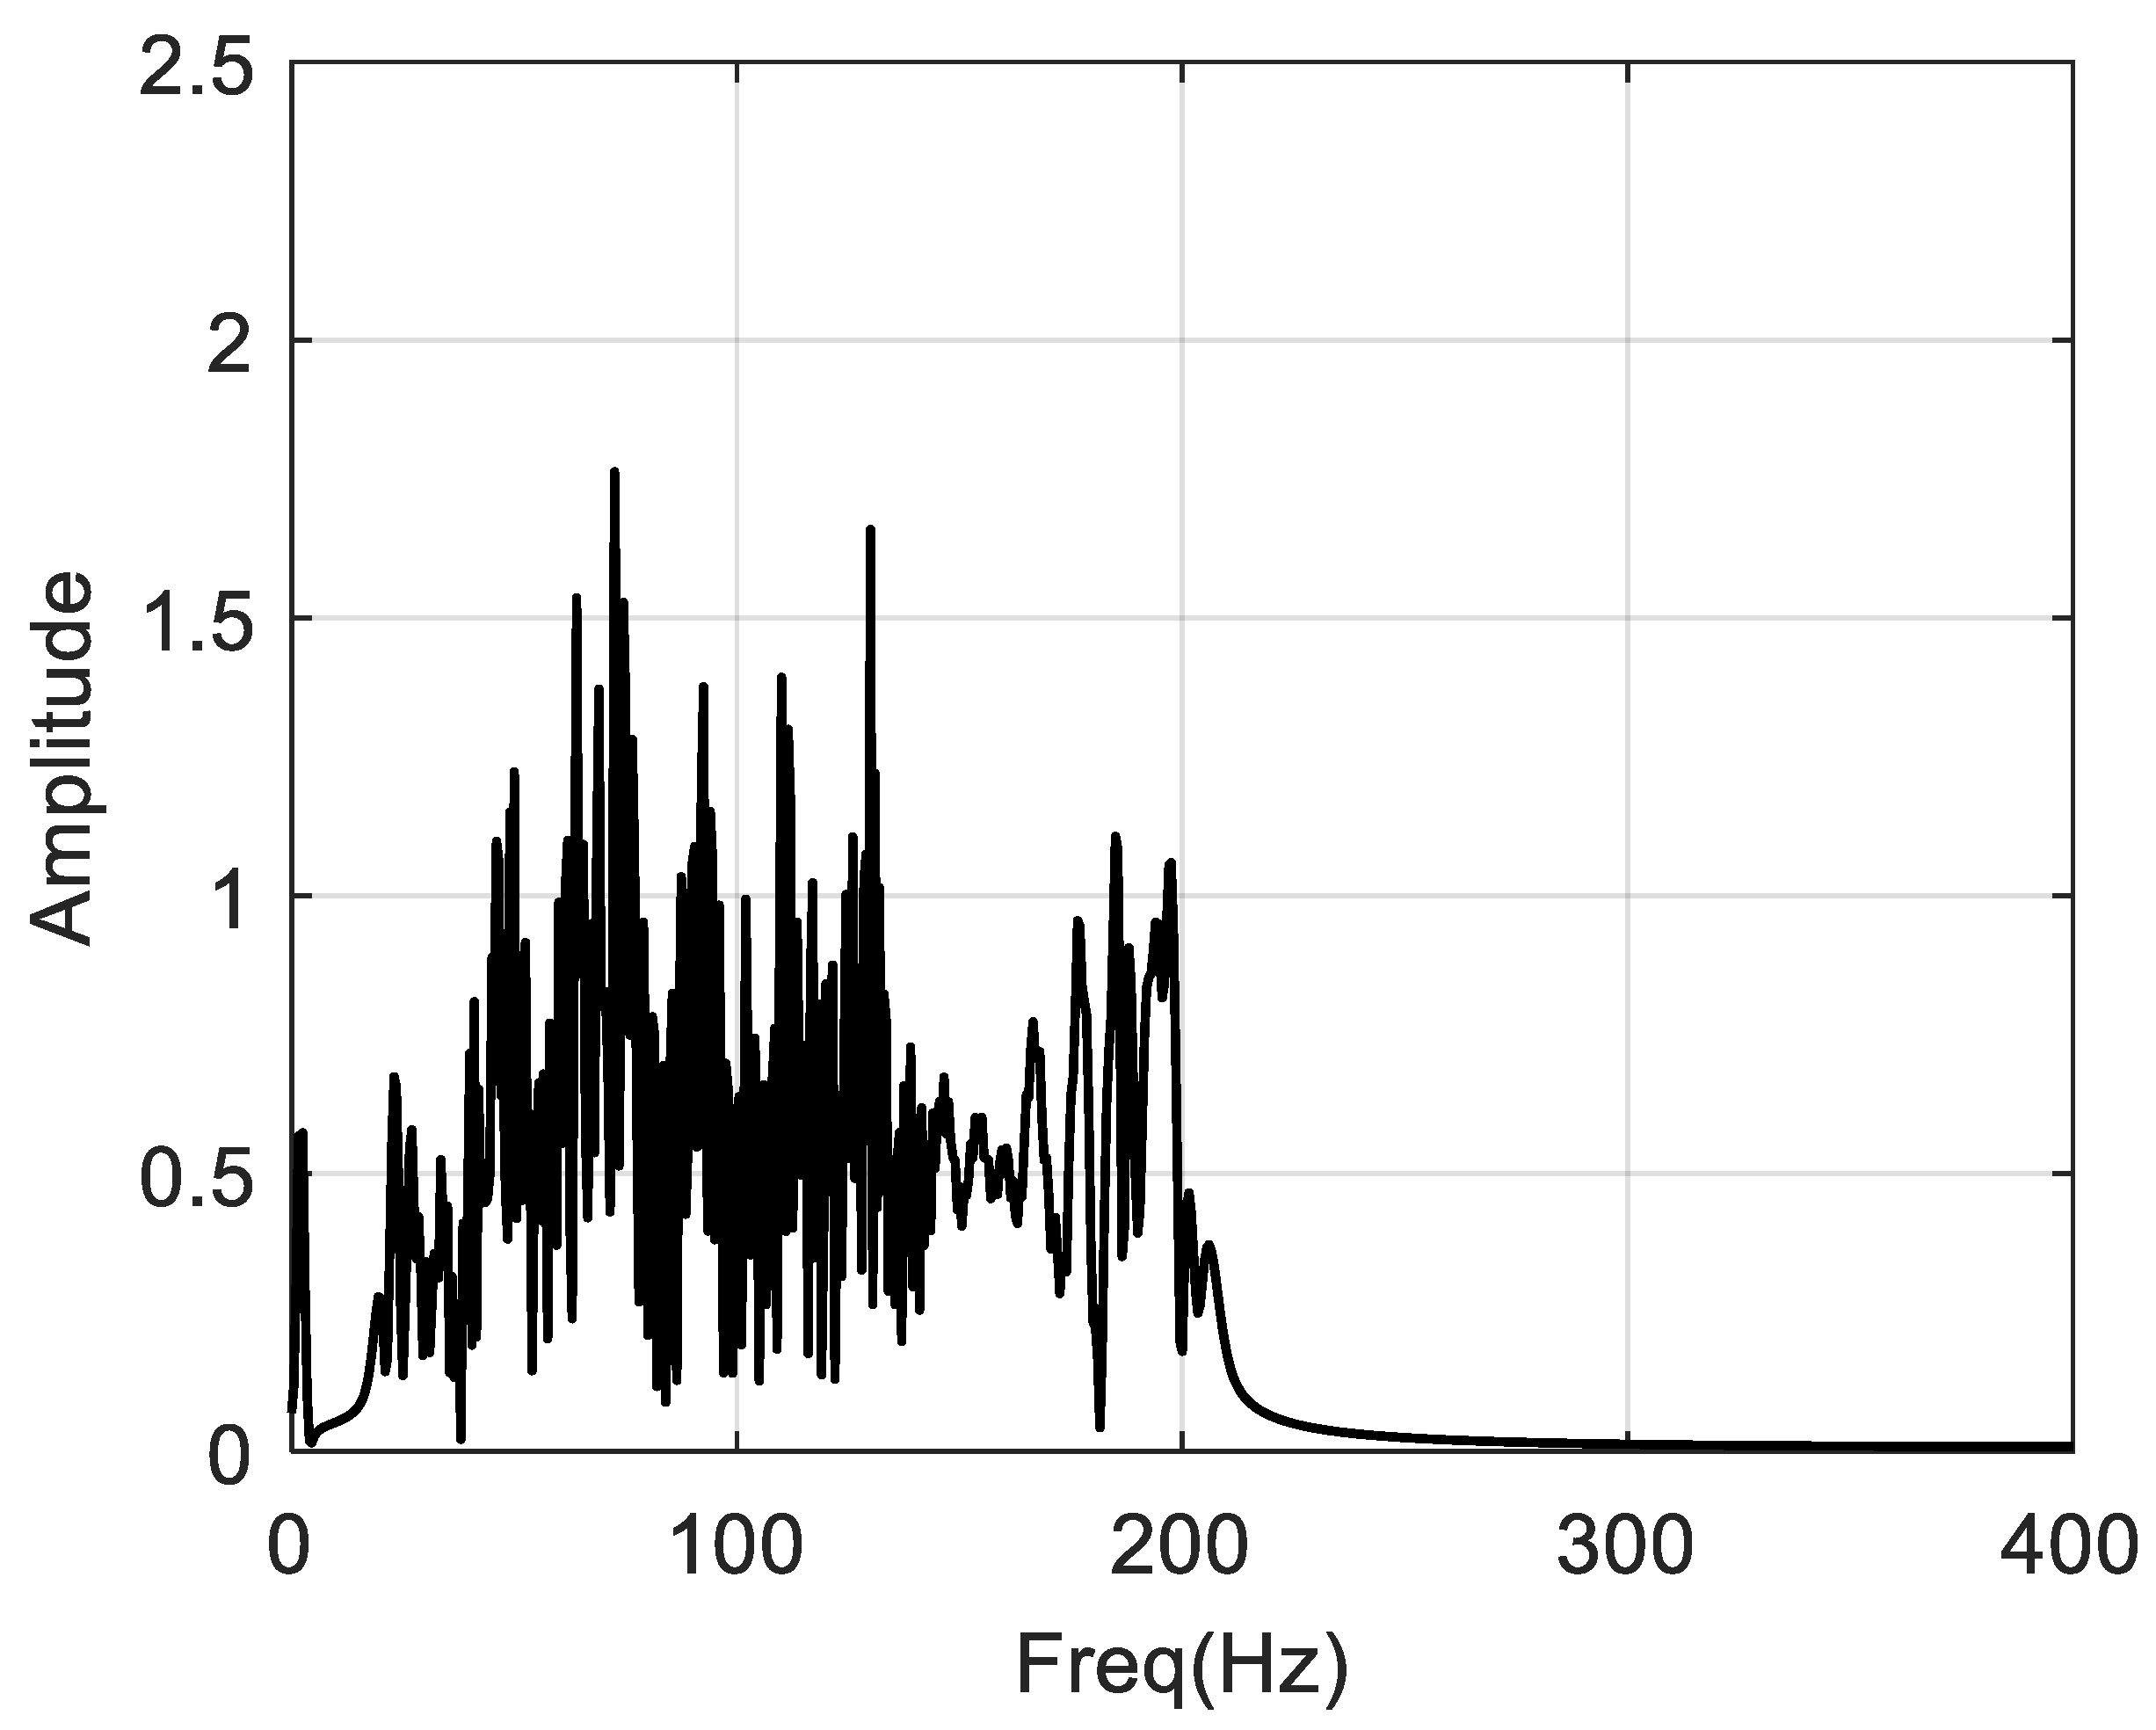
is 22. The sampling frequency is 800 Hz, and the sampling duration is 2 s. The simulated time history, the reference speed, and the corresponding spectrum are shown in
Figure 8,
Figure 9 and
Figure 10, respectively. Under such speed fluctuations, a significant energy dispersion in the spectrum is observed.
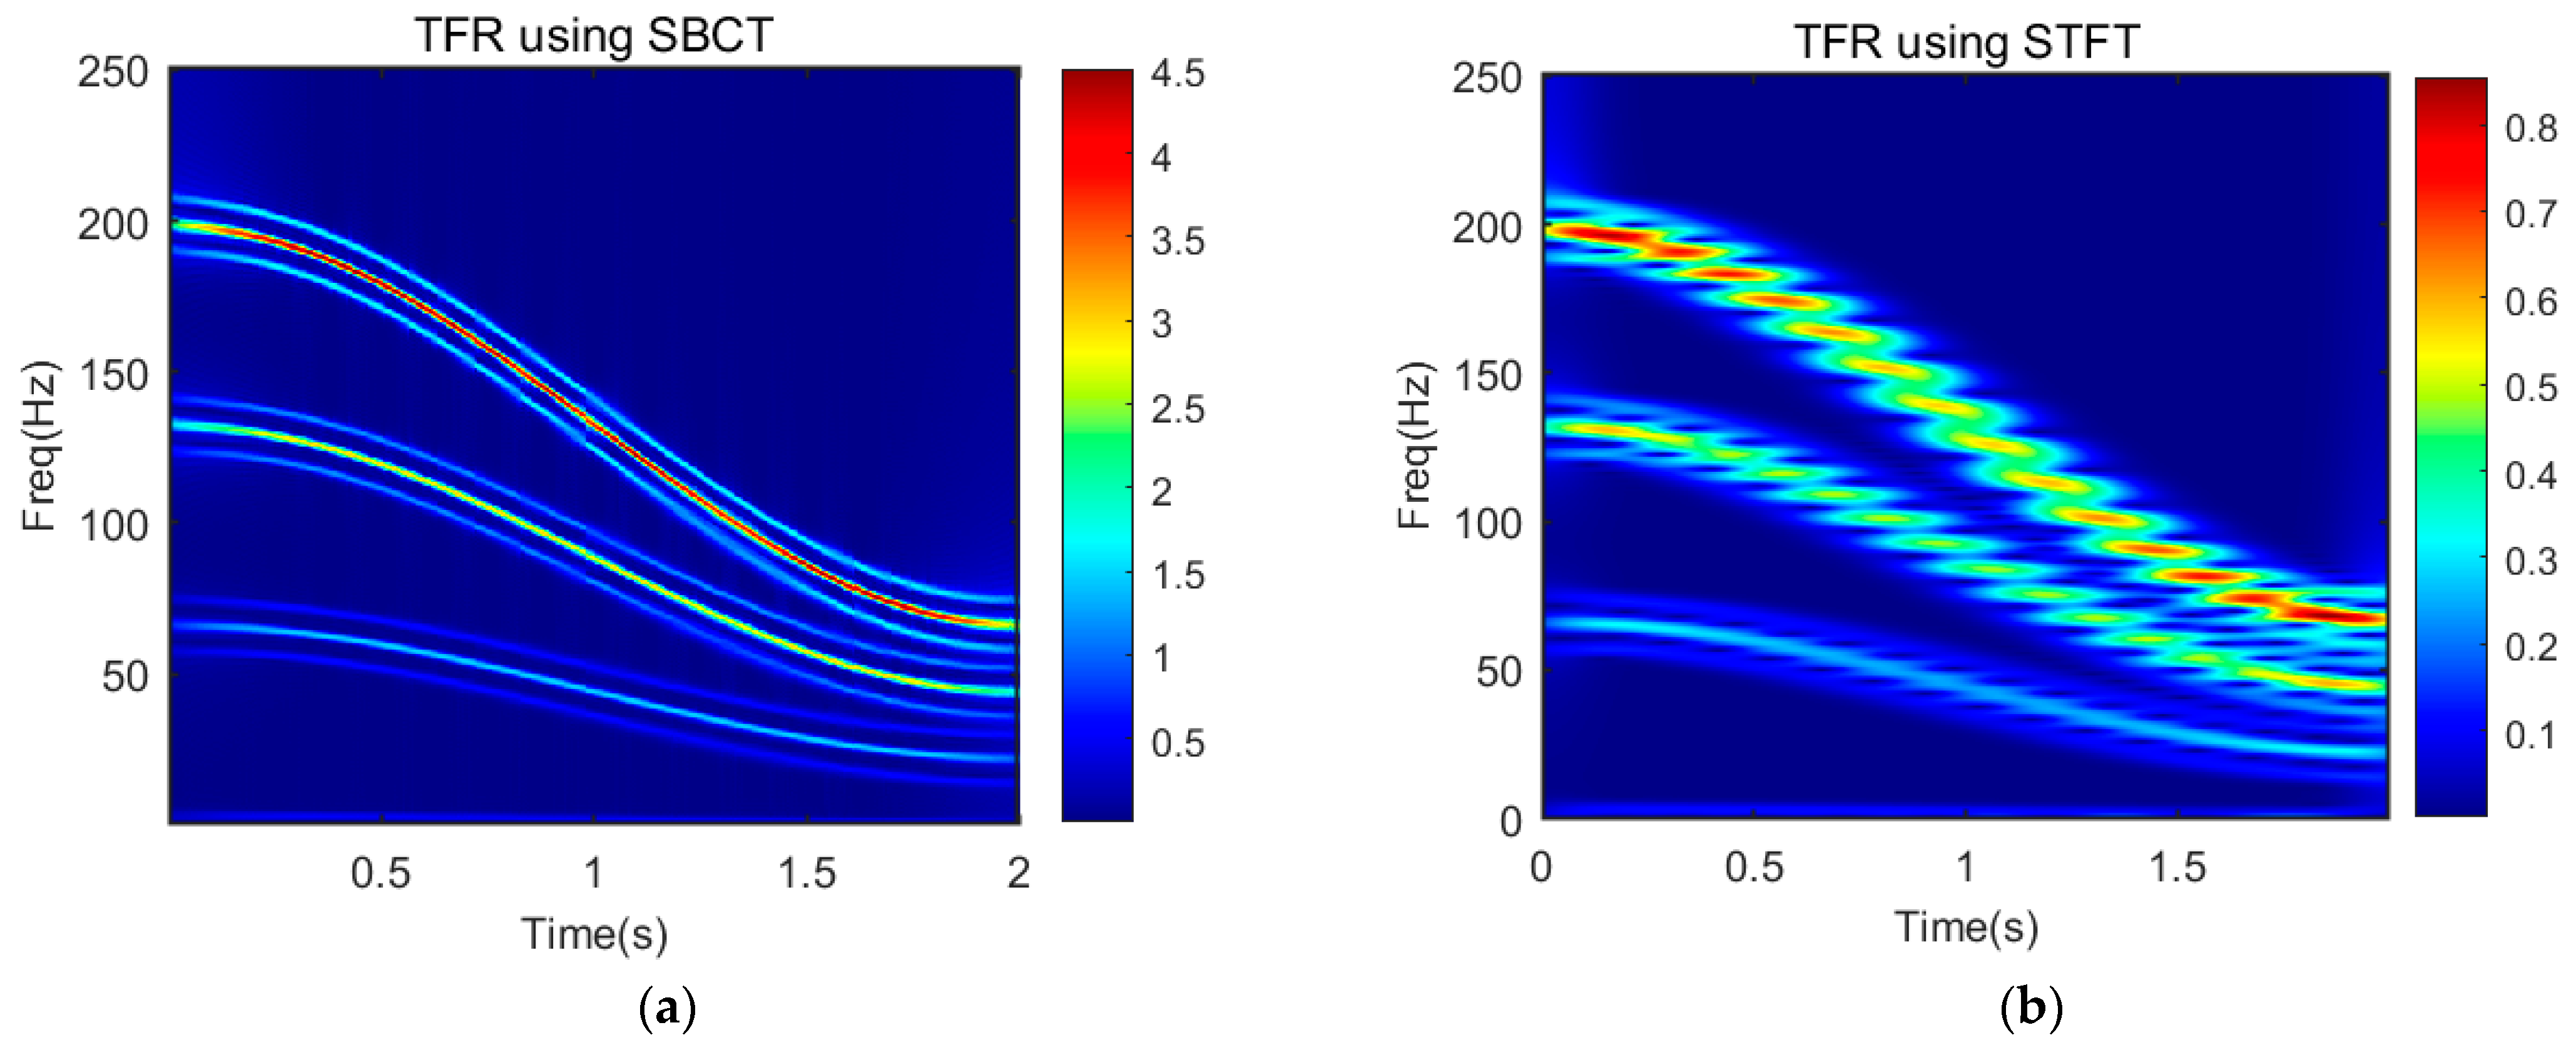
Figure 11 illustrates the TFR obtained using SBCT and STFT. The SBCT analysis yields a continuous and clear time–frequency representation, allowing for precise differentiation between gear meshing frequencies and closely-spaced modulation components. Conversely, the STFT analysis results in energy dispersion due to the speed variation, leading to overlapping among the meshing frequencies and modulation components.
The maximum tracking technique is employed to extract the 3rd harmonic of the meshing frequency, which exhibits the highest energy concentration, and consequently, a better SNR. The shaft speed is determined by dividing three times the tooth count (
).
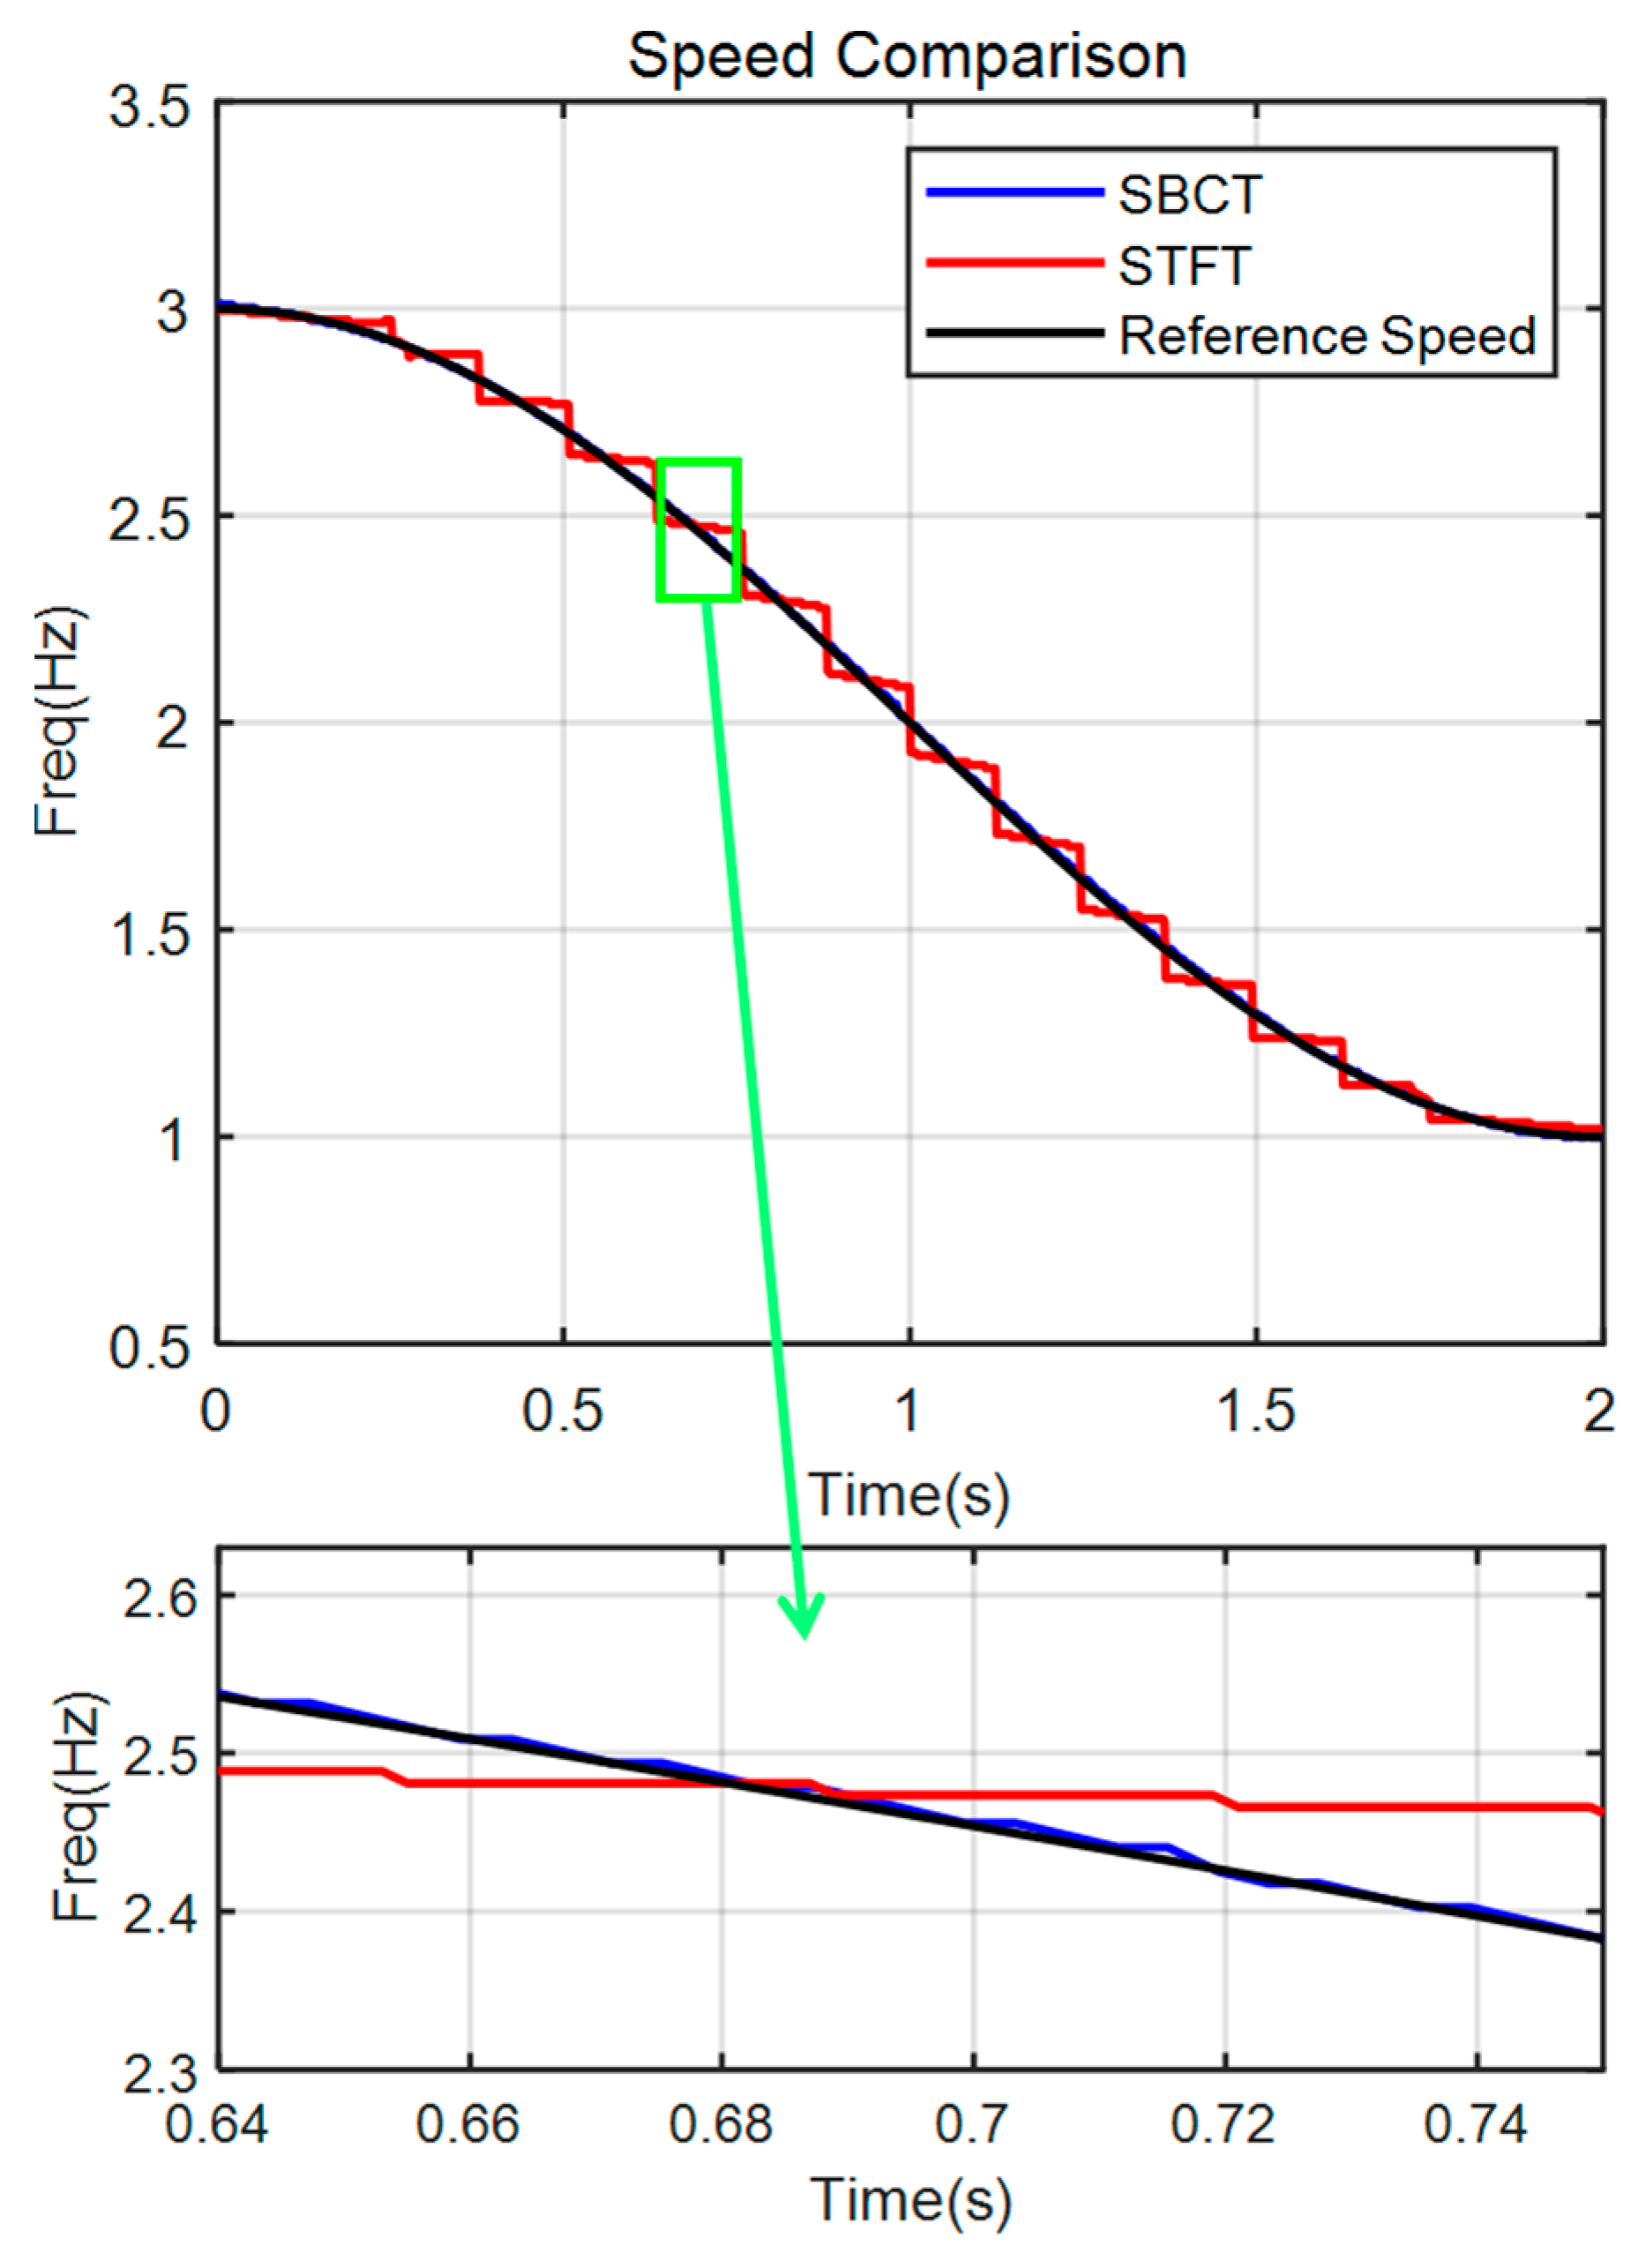
Figure 12 compares the speed extracted from the SBCT’s TFR with that obtained from STFT and zoomed 0.64 s to 0.75 s in detail. The results clearly demonstrate that the SBCT-based speed estimation closely aligns with the simulated speed.
To quantify the accuracy, an error measure is defined as follows:
where
is the detected result and
is the simulated speed.
According to the Equation (37), the two errors are as follows:
Evidently, the speed extracted using SBCT exhibits better accuracy compared to that obtained through the conventional STFT method.
Synchronous resampling to the vibration data is conducted based on the detected speeds and order analysis is carried out accordingly.
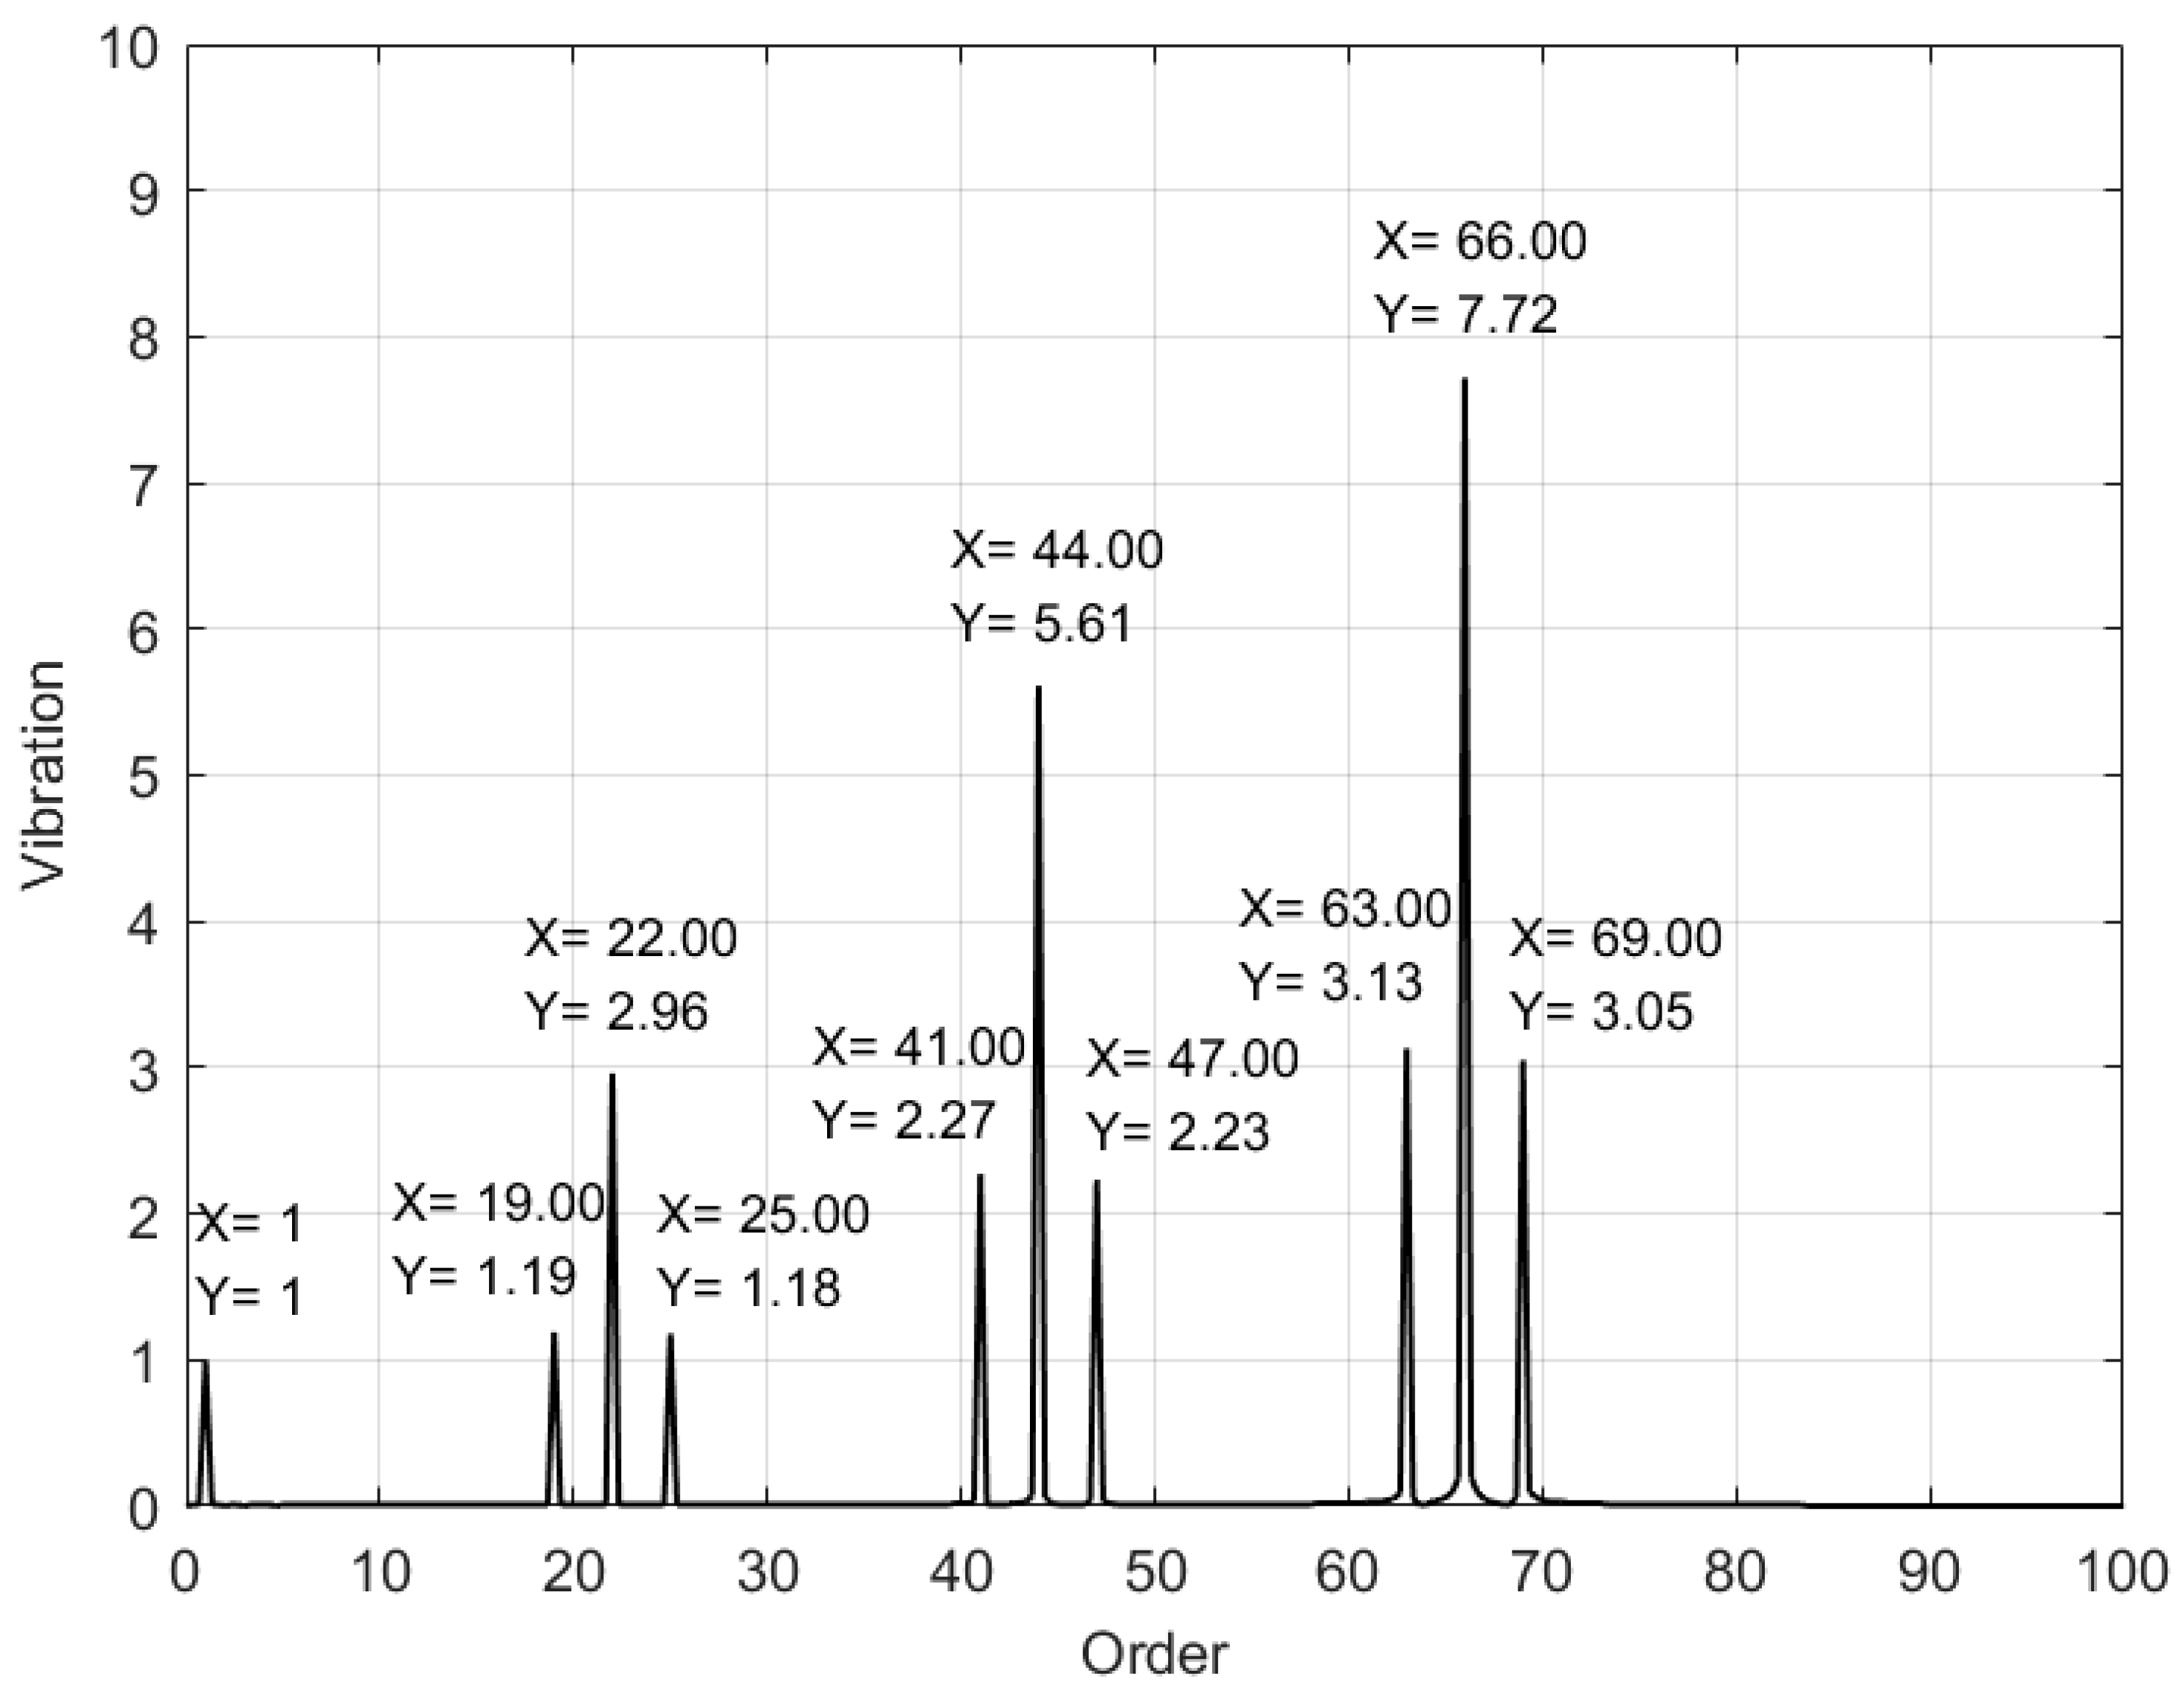
Figure 13 displays the order spectrum based on the simulated reference speed. In
Figure 14 and
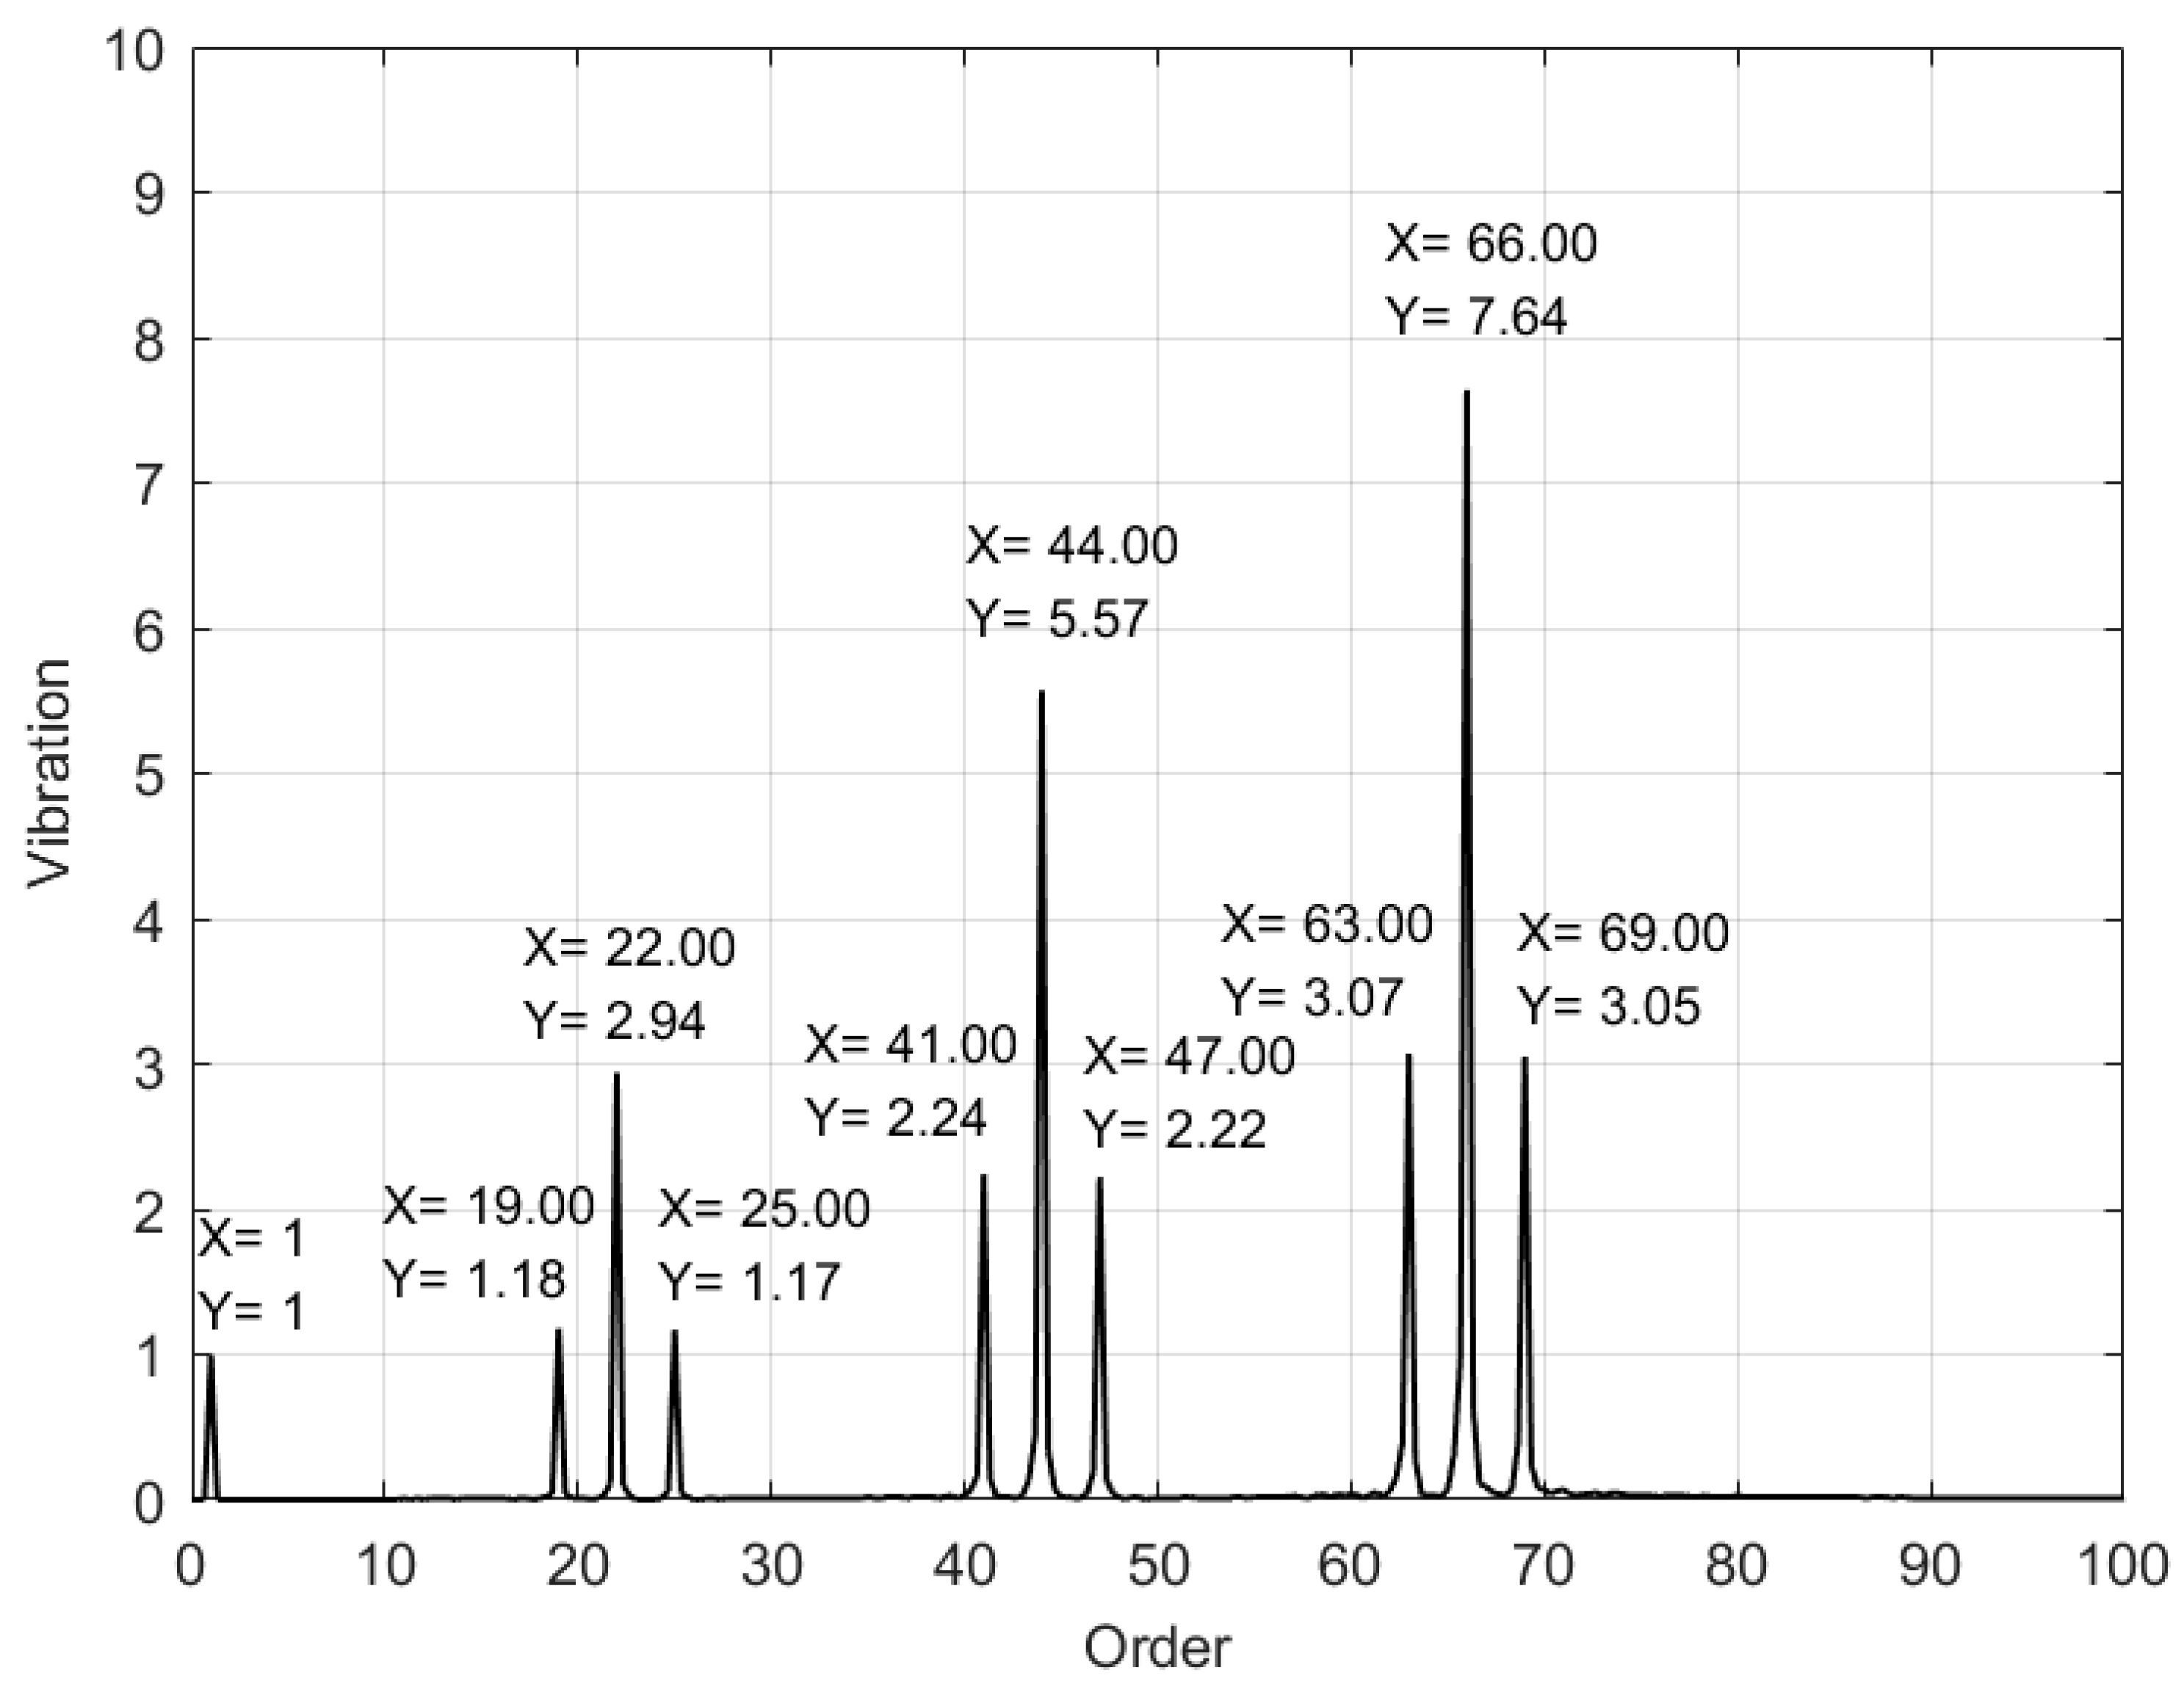
Figure 15, the order spectra using the identified speeds with the SBCT and the STFT are shown, respectively.
By comparing the waveform in
Figure 14 and
Figure 15 to that in the
Figure 13, it is evident that the order spectrum obtained from synchronous sampling using the speed identified by SBCT better aligns with the theoretical values.
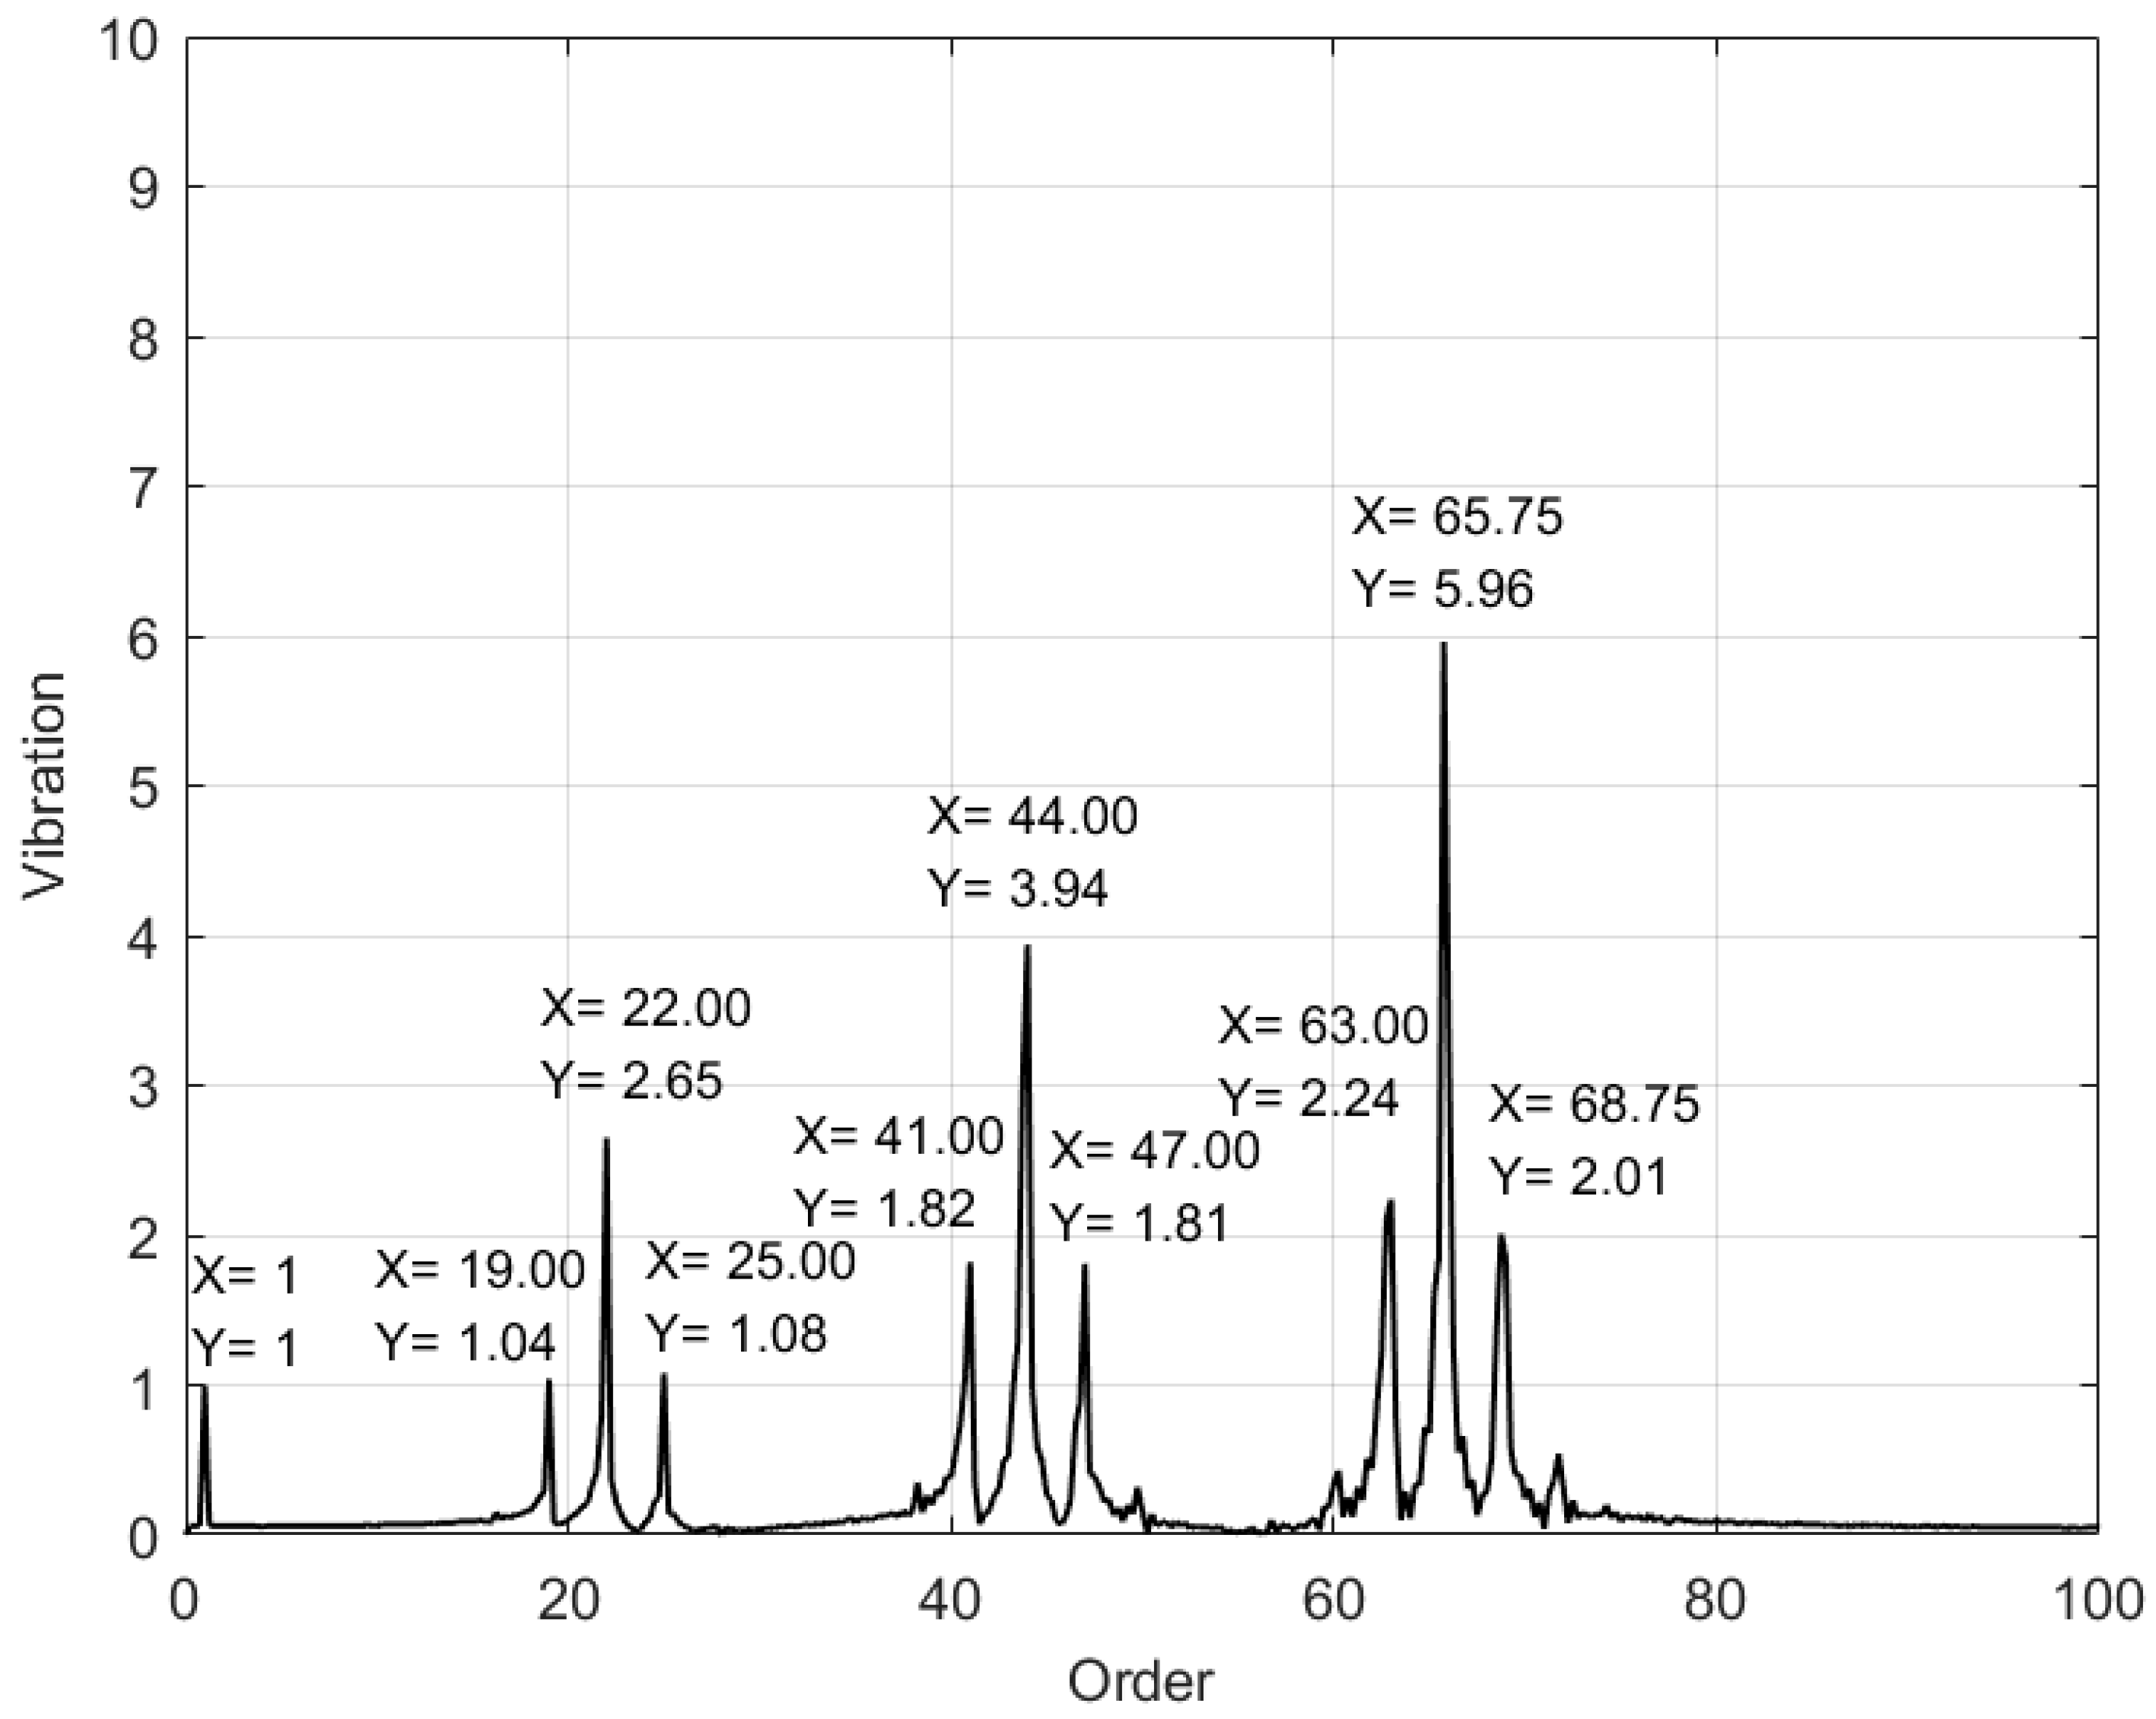
In addition, the speed identification error may also cause the deviation of the characteristic orders. For example, as shown in
Figure 15, the error in the STFT speed identification caused 0.25 order deviation in the 3rd harmonics of the gear meshing characteristic order (65.75 and 68.75).
To quantitatively evaluate the difference in amplitudes, the error measure similar to the one described in the Equation (37) was employed as an indicator.
Table 1 displays the errors in the amplitudes of the gear meshing order and its sidebands with respect to the theoretical values. The maximum error in the SBCT speed identification is 1.92%. By contrast, the maximum error from STFT speed identification reaches up to 34.1%. This indicates that the SBCT-based speed has a higher level of energy concentration than that obtained by the STFT-based speed.
