Abstract
False data injection attacks change the control effect of automatic generation control systems, which may cause a destructive impact on power systems. In this paper, the data from the regular operation of a system and the data from false data injection attacks in the historical data are studied and classified. The normal operating parameters and abnormal operation parameters under various attack scenarios are collected as samples for training the detection model based on time series. The random forest algorithm model is selected for detection through the comparison of detection effects, and various data training models are accumulated during the operation process to improve the model’s accuracy. Finally, Simulink simulation experiments verify the consistency of the detection results of the simulated attack algorithm. This detection method can realize real-time attack detection and synchronize the detection results to the database with high timeliness. It can be used in systems with rich data samples and has broad applicability.
1. Introduction
The operation of a power system requires the ability to issue control instructions to the system according to real-time changes in load and system power to maintain the frequency stability and active power balance of the system. However, since the change period of the load is generally at the second level, the period of state estimation and even manual control cannot be precisely controlled, so an automatic generation control system (AGC) is required to regulate the system.
An AGC system is a modern interconnected power grid system that maintains the power balance and frequency stability of the power system by regulating the output of frequency-modulated generators in the control area to preserve the real-time balance of power generation and load and the planned power exchange between areas. The operation of the AGC system depends on the network communication facilities to monitor the status and issue control instructions, and there is less human intervention, so it is more vulnerable to network attacks. The operation of the AGC system is highly dependent on communication technology and telemetry data, which further increases the threat of network attacks against the AGC system on the power system. In this case, the AGC system has become one of the essential targets of hacker attacks. Therefore, network intrusion detection is critical for innovative grid development and industrial automation level improvement.
At present, the primary purpose of attacking an AGC system is to cause an active power imbalance in the regional power system, further driving the system frequency to decline or the power to overload the regional tie-line [1,2,3,4,5,6]. In an attack against an AGC system, a false data injection attack is the principal means. By tampering with telemetry frequency, tie line power, or directly tampering with other state variable data, such as regional control error, the attacker makes the AGC system incorrectly estimate the unbalanced regional power, causing the AGC system to make wrong decisions and leading to power incidents such as the grid frequency being out of bounds and regional tie-line overload. The power grid frequency measurement device itself has high redundancy. According to this feature, the literature [7,8,9,10] has proposed an attack scheme for system power measurement. One study [11] proposed a method to directly attack the regional error control signal, bypassing the telemetry data detection link. In the research of attack modeling, the literature [12,13,14] has proposed a jump attack, slope attack, noise injection attack, overcompensation attack, and other models based on the basic attack model. Another study [15] suggested a sonar attack. The attacker tampered with the load demand data in the regional power system, resulting in an imbalance in system power, and launched attacks on the power of tie lines according to the frequency change speed to cause instability in the frequency oscillation.
Currently, the attack detection schemes against false data injection attacks on AGC systems mainly include three types of methods. The first category is based primarily on regional error signal detection methods. This method uses historical data to count and monitor regional control errors. It uses historical data to predict regional control error values through some methods to identify abnormal regional error control values. One study [16] proposed a typical detection scheme that belongs to the first category of methods. Based on the research on anomaly detection of the regional error control signals, relevant literature [17] considers the continuity detection of regional error control signals and its derivative by jump and pull-off attacks as preliminary detection. A study [18] selected a method based on a multi-layer perceptron classifier to extract the difference between the regional control error signals under attack and regular operation and to distinguish whether an attack occurred. In addition to the research methods of area control error (ACE) signal anomaly detection, there are also research methods of attack detection based on ACE signal prediction. One article [19] used real-time load forecasting to forecast ACE and proposed detection indicators based on ACE time series characteristics and ACE statistical characteristics. After detecting the existence of the attack, this method used the predicted ACE signal instead of the attacked ACE signal to mitigate the attack. Other researchers [20] combined load forecasting information, considered the range of variation of various loads, gave the prediction range of ACE signals, and used ACE data identification to mitigate attacks. There is also literature [21,22] that predicted ACE signals through long-term and short-term memory network learning, directly using the expected ACE values and the comparison of ACE measurement values for attack detection.
The second kind of method is mainly model-based detection methods. This method primarily builds a state estimator on the AGC system model structure and uses the technique to process the attack variables subject to false data injection. Finally, by comparing the estimated value and the observed value of the attacked variable, the attack variable is also set as an estimated variable to achieve the attack detection effect. One study [23] proposed a detection method based on the Kalman filter for AGC, which uses estimated residuals to realize false data injection attack (FDIAs) detection. References [24,25] proposed an unknown input estimator, which can detect FDIAs by detecting the estimator residual when it is out of bounds. This method requires the high accuracy of the AGC system’s equivalent model.
The third type of method is mainly based on data-driven detection methods, which analyze the attack scenario and use it for attack detection. Reference [26] proposed a semi-supervised hierarchical density space clustering method considering noise by using data in different attack scenarios and realizing the identification of various attack types through training. Another study [27] proposed an online monitoring method based on spatio-temporal data, which uses the consistency information from remote sensing data to learn and apply the consistency information of different modes online through semi-supervised K-means clustering and realizes attack detection. Among these methods, semi-supervised detection methods rely heavily on training samples from other original scenes, so sample acquisition is the key to such practices.
False data injection attacks are one of the most threatening data integrity attacks to modern power system operations in recent years. Concealed means of injecting inaccurate measurement data can bypass existing attack detection technologies. The transition process of state variables in the power grid is relatively fast. Still, the change speed of state variables in the AGC system is slow, and the control effect has a delayed response, which allows network attackers to change the dynamic process of control signals more covertly, making the traditional detection methods unable to detect exceptions. Therefore, this paper proposes a random forest algorithm of time series, which has a good detection effect against hidden false data injection attacks.
Due to the imbalance of the experimental samples, the synthetic minority oversampling technique (SMOTE) oversampling algorithm is used to preprocess the experimental samples. The training data are divided into a training set and a test set, and the training set is used to train the detection model. The test set is used to detect the superiority of the model, such as accuracy, recall, F1 score, and confusion matrix. In this paper, the performance indexes of machine learning algorithm models classified by support-vector machines (SVM), decision trees, K-nearest neighbors (KNN), etc., are compared and analyzed with the same dataset samples, and the advantages of the random forest algorithm model are verified. By comparing the experimental results of various integrated learning methods, it is proved that the random forest algorithm based on time series can achieve significant advantages in feature analysis. The detection results also maintain a high degree of consistency with the simulated attack scenarios.
Compared with the existing detection and research methods, the method based on random forest data mining proposed in this paper is less complex, does not require additional measurement redundancy or substantial cost investment of state observers, and has the characteristics of wide applicability. At the same time, the occurrence of a false data injection attack is not achieved overnight. However, through a certain time dimension to gradually induce the accumulation of system error decision-making, this research method can observe the dynamic process of voting of each decision tree and then improve the stability of system operation.
2. AGC System Model
2.1. Composition and Physical Structure of the AGC System
The AGC system mainly comprises two modules: the load frequency control (LFC) and the economic dispatch control (EDC). The LFC system is used to ensure that the frequency of the regional power system is maintained within the normal fluctuation range, to ensure the balance between the active power and the load sent by the system, and to support adjacent power systems to solve the problem of power shortages. The EDC system is used to ensure that the output of each unit participating in AGC system frequency modulation in the regional power grid is in an excellent economic operation state. The EDC system uses the active power distribution method of equal consumption micro increment rate to distribute ACE signals to each team participating in AGC frequency modulation, to ensure that the minimum amount of primary energy is used to generate as much electricity as possible, and to improve the energy utilization efficiency.
Physically, the AGC system is mainly composed of three systems: the power dispatching master station control, information transmission, and the power plant control. The signal sent by the control system of the power dispatching master station is sent to the power plant control system through the information transmission system to control the output of the generator unit. The power plant control system returns the operation status of each unit to the power dispatching master station control system through the information transmission system, in which the automatic generation control system master station control system is included in the energy management system.
2.2. AGC Control Mode
An AGC system mainly has three control modes. The first control mode is constant frequency control (CFC). In this control mode, the AGC system maintains the regional system frequency at a constant value and takes this condition as the target of controlling the unit output. At this time, the ACE signal only contains the power deviation generated by frequency offset. The second control mode is the fixed tie line net exchange power control (CNIC). Under this control mode, the AGC system makes the net exchange power of the tie line between the adjacent system and the system constant to the planned value. At this time, the ACE signal only contains the deviation of the net exchange power of the tie line. The third control mode is the tie line net exchange power and frequency offset control mode (TBC). Under this control mode, the AGC system makes the system frequency and tie line net exchange power at the planned value, and the ACE signal includes the deviation jointly generated by the frequency offset and tie line net exchange power.
TBC control is one of the most widely used and effective AGC system control methods. The TBC control mode has two crucial advantages. First, the power system can realize the decentralized and independent control of regional systems without communicating between various interconnected systems. Second, the power deviation and frequency deviation of tie lines can be controlled within the allowable range at the same time. The TBC mode has sound effects on power transmission, the economical operation of large-capacity generator units, accident support, and the improvement of frequency quality. The main research scope of this paper is false data injection attack detection based on the TBC control mode.
When the AGC control mode is TBC, the regional control error signal is jointly affected by the power deviation of the tie line ΔPtie and the frequency deviation Δf of the tie line. The calculation formula is as follows:
where B is the frequency deviation coefficient, which is usually a fixed constant.
2.3. State Variables of the AGC System
The AGC system is one of the essential core functions of the energy management system (EMS) system. The operation data of the power system is collected by a remote terminal unit (RTU) and sent to the EMS system through the communication system. The EMS system analyzes and calculates the collected information to obtain the system’s ACE signal and configures the dynamic power adjustment of each generator unit according to the ACE signal’s value and the primary constraints of the power system operation. This process is called the decision-making process of the EMS system.
The signals collected by the AGC system include the frequency signal, the net exchange power signal of tie line, the governor power signal, and the prime mover output power signal.
The regional AGC system mainly includes five state variables, namely the frequency deviation, Δf; the power deviation of the tie line, ΔPtie; the governor power deviation, ΔPg; the turbine power deviation, ΔPt; and the control error, ACE.
Let f be the system frequency (instantaneous value), and let f0 be the rated frequency of the system, 50 Hz.
The definition formula of Δf is as follows:
The measurement redundancy of Δf is relatively high, and there are many measuring points, all of which are located in the regional power system.
Ptie is the sum of the power (instantaneous value) of tie lines in the area, and P0 is the preplanned exchange power of tie lines. The definition of ΔPtie is as follows:
The data acquisition point of ΔPtie is located on the regional exchange power tie line.
ΔPg is the difference between the expected power of the governor and the actual power, and ΔPt is the difference between the planned power of the turbine and the real power of the turbine.
2.4. False Data Injection Attack
False data in a power system refers to the inconsistency between the operation data of the power system obtained in the process of data acquisition and the operation state data of the existing power system. False data injection attacks are among the most threatening data integrity attacks to modern power system operations in recent years. This means of injecting inaccurate measured data can bypass the existing attack detection technology. Currently, the false data injection attack models for AGC systems mainly include scaling attacks, slope attacks, pulse attacks and random attacks.
2.4.1. Scaling Attack
The scaling attack involves amplifying or reducing the real signal value. The amplified or reduced signal will be transmitted to the following link of the system as the real signal, which will have an attack effect on the system. The effect of this attack depends on the characteristics of the signal. This kind of attack also has a good latency effect. The attack function of the scaling attack can be expressed by the following Formula (4):
In this formula, y(t) represents the AGC state variable data collected when there is no attack, y*(t) represents the value when the collected AGC system state data is attacked by false data injection, and λs is a constant.
2.4.2. Slope Attack
The principle of a slope attack is to add a time-related false data injection attack to the real signal. The effect of this type of attack will gradually increase with the increase in time and has a specific latency, as shown in Formula (5):
In this formula, y(t) represents the AGC state variable data collected when there is no attack, y*(t) represents the value when the collected AGC system state data is attacked by false data injection, and λr is a constant.
2.4.3. Pulse Attack
A pulse attack is a real signal with discontinuous and intermittent amplification or reduction. The attack is intermittent, so this type of attack has a strong concealment, a prolonged attack cycle, and a specific latency. Compared with a scaling attack, a scaling attack amplifies or narrows the measured value during the attack, while a pulse attack modifies the measured value through short interval pulses with attack parameters.
where y*(t) is a piecewise periodic function, and the period is T. When t ∈ [kT, (k + 1)T], k ∈ Z is in the interval [kT, t], and the value of y*(t) is 0, and y*(t) is y*(t) = (1 + λp) × y(t) on the interval [t, (k + 1)T].
2.4.4. Random Attack
A random attack is a process in which a random attack amount is superimposed on a real measured signal to generate a false data injection attack effect. The expression is as follows:
Among them, y(t) represents the AGC state variable data collected when there is no attack, y*(t) represents the value when the AGC system state data collected is attacked by a false data injection, and rand(a,b) represents the random value in the (a,b) interval.
False data injection attacks usually go through two stages. In the first stage, hackers must use gateway vulnerabilities to invade information systems. In the second stage, hackers need to tamper with information, injecting false information. In order to not alert the system, attackers often do not directly launch a large number of false data attacks because such actions can easily expose the location of the attack node and can be detected by simple measuring instruments. Therefore, an attack usually first enters the attack latency period, and only after a certain period of time will it have a pronounced attack effect on the system.
LFC in the AGC system is a closed-loop control with a fixed structure. The change in the load under regular operations is the main factor that causes the change in the state variables in the AGC system. The change characteristics of five-dimensional state variables (frequency deviation, governor power deviation, steam turbine power deviation, tie line power deviation, and regional control deviation of the regional power system) are traceable only under the influence of load. When a false data injection attack is added to the intermediate link, this is equivalent to the original transfer function of the LFC system being tampered with. At this time, the movement track of the five-dimensional state variable changes, and at this attack time, the entropy value of the state variable will be affected, which is different from the change in the entropy value that occurs when the regional power grid system carries the average load. On this basis, the machine learning idea is used to classify the running track of the system state under attack and the running track of the five-dimensional variable under a normal state to judge whether the system is attacked by false data injection, the state variable under attack, and the time when the attack occurs.
3. Detection of False Data Injection Attack Based on Random Forest
Based on the discussion of various machine learning detection models, this paper adopts a random forest algorithm based on time series to output the results by voting by integrating many decision trees to realize the detection of false data injection attacks.
A random forest can be understood as a set of decision trees, which is used to aggregate many decisions into one result and operates by building a large number of decision trees at training time. It is, therefore, a tree-based machine learning algorithm that uses the power of multiple decision trees to make decisions. A decision tree is an efficient and straightforward supervised learning algorithm. The tree structure classifier obtained after training can classify data according to the tree, so it is called a decision tree. It starts from the root node of the tree, selects the optimal splitting attribute, and then keeps splitting to form tree-building nodes one by one until it can no longer continue to separate out of the new node. The decision tree created by training can be used for prediction or classification detection. When testing, the detection data are selected from the root node using the decision tree model, and the last leaf node is the test result label.
3.1. Detection Principle of Random Forest Algorithm
The random forest algorithm is the typical and most representative algorithm in the bagging integration algorithm. It combines the bagging method and the random subspace partition method to achieve the “double randomness” of data selection and feature selection.
On the one hand, bagging first uses random sampling with placement to process the training set into multiple training subsets. Then, the classifier will generate a weak classifier set after using these training subsets for separate training. Finally, the weak classifier will be integrated according to some classification results to obtain a robust classifier with robust classification performance. The classification performance of a strong classifier composed of a set of weak classifiers has apparent advantages over a single robust classifier [28].
On the other hand, the random subspace partition method first selects the data attributes of the dataset many times to form several datasets with different characteristics, then uses these different attribute datasets to generate a decision tree, and finally integrates the classification results of the decision tree. The random subspace method has obvious advantages over the data classification method of the single decision tree [29].
Combining the benefits of the two, the random forest algorithm uses bootstrap sampling to construct a set of multiple decision trees from a single decision tree based on the classification and regression tree (CART) node splitting algorithm. Finally, it uses a voting algorithm to process the classification results of numerous decision trees to achieve data classification.
In this paper, the random forest algorithm based on time series is used to integrate and process different types of time series original data. Then, the random forest algorithm is used to train and model the data. By tuning the model, the model can be used to detect and judge new data in real time.
The dataset used in this paper can be divided into two parts: average data and attacked data. After preprocessing and splicing, dataset Dn*t can be obtained, where n is the number of datasets, t is the dimension of the time series, and the training dataset contains the category Label. An example of the data is shown in Dataset D in the block diagram on the left side of Figure 1. This paper uses the random forest algorithm based on time series. The basic model of the random forest algorithm is the decision tree. Its principle is shown in Figure 1, and the data example is shown in Dataset D in the exemplary block diagram. The decision tree model calculates the information gain based on the input data and can obtain the best segmentation dimension and segmentation point.
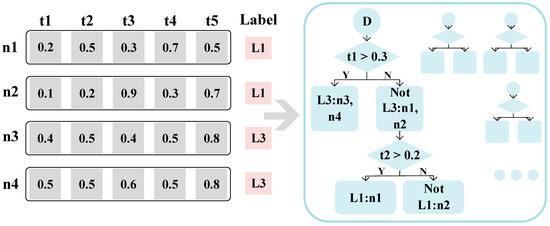
Figure 1.
Decision Tree Generation Process.
The algorithm for obtaining the best segmentation dimension and segmentation point from the decision tree model is shown in Equation (8). E is a method to measure the degree of dataset confusion and is generally calculated by entropy. The decision tree traverses all data n and all values in the data t. The selections are used as temporary segmentation dimensions and segmentation points to obtain the segmented data and calculate the degree of confusion E(D,n,t). Finally, the partition dimension and partition point that make G the smallest are selected, and the data are divided to obtain the left and correct sub-node data.
As shown in Figure 1 above, the best-dividing dimension is t1, and the best-dividing point is t1 = 0.3. According to this condition, Dataset D can be divided into two sub-datasets, D1 and D2, respectively. For data with a t1 dimension value greater than 0.3, we proceed to the left sub-node. For data with a t1 dimension value less than or equal to 0.3, it is divided into the right sub-node. Further, the information gain of the two sub-node datasets is calculated, and they are divided into subsets D3 and D4 until all the data in the D3 dataset have the same label. Then, this node cannot be divided again; that is, it becomes a leaf node. Similarly, D4 is also a leaf node. Through the above splitting process, a decision tree model is built, and multiple decision trees are obtained through the same training process. All the trees form a complete random forest model.
The detection process uses the trained random forest model to vote on the real-time AGC system state data. The real-time detected D dataset is voted on by the random forest decision tree, where the number of votes obtained is K, the total number of votes obtained is K, which contains labels of different types of states, the number of decision trees with the largest proportion of the same label is output is K1, and the output detection probability P is:
Because the false data injection attack does not happen overnight, through the accumulation of false data injection of continuous time segment state variable deviation signals, the frequency of the system gradually drops to the point of collapse. The random forest algorithm based on time series can find the deviation changes in the state variables caused by the injection of false data. Therefore, compared with the ordinary random forest, the random forest algorithm based on time series is more suitable for the process of entropy change in the time segment of the system. It is helpful to reflect on the dynamic process of voting of each decision tree to achieve a better attack detection effect.
3.2. Processing of Test Results
Because the result of the random forest algorithm used in this paper is the probability of the AGC system being attacked, it is difficult to judge whether the AGC system is attacked directly according to the detection results. Based on this, this paper needs to deal with it after obtaining the probability of being attacked.
First, because the change in the adjacent time probability can directly reflect whether the system is attacked, this paper first calculates the first difference in the detection results.
where x is the change of detection result (probability).
Then, it needs to be centralized and standardized. The purpose of this is to process the test results through centralization and standardization to obtain the data subject to standard normal distribution that are conducive to subsequent classification tests. Therefore, Z-core standardization is adopted in this paper to realize data processing, as shown in Formula (11):
where x’ is the first difference of standardized probability.
Z-score standardization is a standard score, also known as the Z-score. It describes the relative distance of a specific value in the dataset. This method can effectively judge the close standard distance of the average length of a detection value.
Finally, the absolute value of the test result after Z-score standardization is calculated.
where x0 is the initial value of system operation, and the initial default value of system operation is the standard state operation data; yn is the standardized value of the primary difference corresponding to each state variable.
When the system is not attacked, the value detected by the attack detection model is equal to the average value of the detection value. When the detection model detects that the attack signal is generated, the detection value measured at that time will deviate from the average value. As the amount of data collected by the AGC online monitoring system is too large, once there is an abnormal value, the distance between the value detected at this time and the value detected at other times will be instantly extended. The original parameters detected in real time by the Z-score standardization sequence can judge the existence of attacks and detect the relative distance between the detected value and the normal value. At the same time, this distance can also be used as the size of false data injection attacks.
4. Modeling and Attack Simulation of AGC System
4.1. State Simulation of AGC System under Attack
In the two-area interconnected power grid, the mathematical equations of each component of the system are linearized with reasonable assumptions and approximations, and the transfer functions of the prime mover, generator, load, governor, and other components are obtained. Then, the mathematical model of the two-area interconnected power grid is constructed according to the transfer functions of each element. The red letter a in the figure represents the possible location of the attack. To analyze the attack detection of the AGC system, one generator is used in the model to be equivalent all generators in the region. The LFC equivalent model is established according to the state equation, taking the two-area power system as an example, as shown in Figure 2.
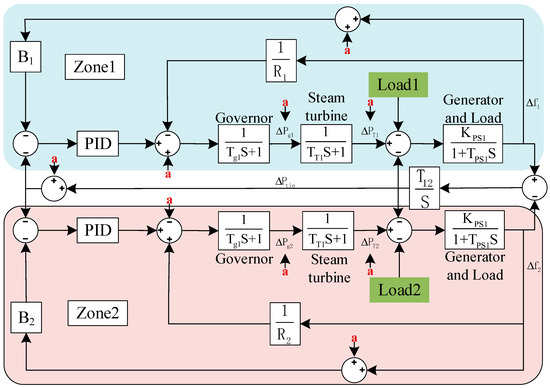
Figure 2.
Mathematical Model of Two-area Power System.
The false data injection attack of the regional control deviation signal is theoretically analyzed, assuming x is the state of the AGC system and A is the scaling attack matrix:
In the case of only an ACE signal false data injection attack, only λ1 is not equal to 1, and all other scaling multiples are equal to 1. The injection of false data actually causes the measured value m of a certain state to deviate from the actual value r, which can be expressed as:
Therefore, the amount of signal adjustment changes from Δr to Δm in one cycle, and an unbalanced amount accumulates in this cycle:
As shown in Table 1, the signal imbalance at the nth period is:
where n ≥ 1 (n ∈ Z), apparently when λ < 0, causes eunb(n) to diverge, a process called a negative compensation attack. If the attacked signal is a frequency deviation signal or other state variable signal, the frequency signal can cause the system to crash. When λ is constant, the attack type is a scale-in attack. When λ is a function λ(t) that changes with time t, it can be discussed in two cases:

Table 1.
Fake data injection attacks accumulate an imbalance.
- (1)
- When λ(t) is a primary function, the attack type changes to a ramp attack.
- (2)
- When λ(t) is a random value, the attack type is equivalent to a random attack. When λ is a piecewise constant function, it can be equivalent to an impulse attack. It is not difficult to find that if analyzed from the perspective of the attack’s effect, a slope attack, pulse attack, and random attack are all derivative attack schemes of a scaling attack.
In order to study the detection effect of the area under attack, Matlab(2020b)/Simulink simulation software is used to simulate the false data injection attack of the area control deviation signal. The parameters of the two-area power system model with the same parameters are shown in Table 2 below. The clock signal launches the false data injection attack at the 20th s. The total operation time of the system is 50 s.
Table 2.
Two-zone power system model parameters.
The over-compensation attack makes the frequency oscillate, while the positive compensation attack makes the AGC system work asymptotically. The positive compensation attack will only reduce the adjustment speed of the AGC system, making the fluctuation period of various state variables longer, not leading to the collapse of a state variable but also making the ACE signal fluctuate frequently and become easier to detect. The ACE value that the AGC system increases by each time has a maximum limit, and the rate of change between the adjusted values of the ACE signal every two times has a maximum threshold. Therefore, as long as the misleading range of each ACE signal attack meets these two conditions, the frequency deviation can be increased after multiple inducements, leading to the collapse of the system frequency.
Since negative compensation attacks cause each adjustment of the AGC system to be reversed, the fluctuation of load will have a more significant impact on the effect of attacks after the attacks. For example, in the case of significant load fluctuation and slight load fluctuation, the concealment or efficiency of false data injection attacks will be significantly reduced. If the load is stable, the deviation signal that AGC participates in the adjustment is tiny and minimal, so the scaling attack is not meaningful, and the attack efficiency is low. When the load fluctuates wildly, the effect of the scaling attack is good, which may cause the maximum rate of change of the ACE signal to exceed the limit and attract the attention of dispatchers.
In the high-intensity damaging compensation attack, the attack value of the ACE signal’s false data injection was set λ equal to −0.4, as shown in Figure 3. It can be seen that in this case, the cumulative imbalance of the false data injection attack changes too quickly, which only makes the change rate of the ACE signal exceed the AGC system verification standard and can easily be detected.
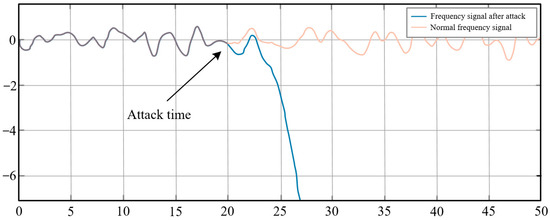
Figure 3.
Change of system frequency deviation signal after being attacked by high-intensity negative compensation ACE signal in the 20th s.
In the medium-strength damaging compensation attack, the false data injection attack value λ of the ACE signal was set to −0.12, as shown in Figure 4. Under a medium-intensity hostile compensation attack, the false data injection attack has a certain degree of concealment in the process of 20 s to 32 s, and it is difficult to detect the decline in the AGC system’s control effect at this stage.
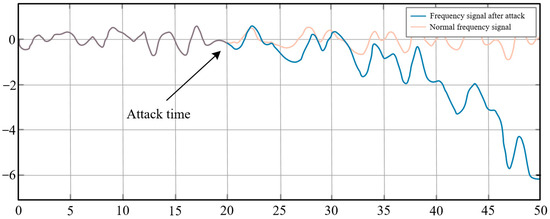
Figure 4.
Change in system frequency deviation signal after being attacked by medium-strength negative compensation ACE signal in the 20th s.
The concealment of a false data injection attack lies in that it can induce the system frequency to drop for a long time, which is not easily detected by traditional detection methods. This kind of covert false data injection attack causes serious harm to the frequency control performance and economic scheduling performance of an AGC system.
In the low-intensity damaging compensation attack, the ACE signal false data injection attack value was set to λ equal to −0.08, and the result is shown in Figure 5. Under the medium-intensity damaging compensation attack, the frequency gradually decreases with the fluctuation of the load during the whole operation. Traditional detection methods cannot identify that the control effect of the AGC system is affected by false data injection attacks, so this type of attack has good concealment.
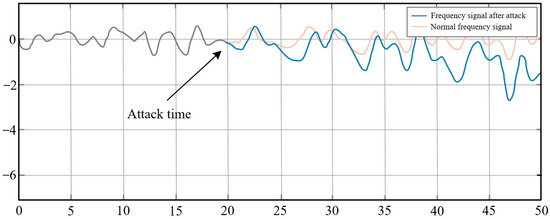
Figure 5.
Change of system frequency deviation signal after being attacked by low-intensity negative compensation ACE signal in the 20th s.
Figure 3, Figure 4 and Figure 5 show the frequency changes in the attack time corresponding to different intensities of false data injection. Obviously, in the attack scenario with high attack intensity, due to the significant fluctuation in frequency, the change rate of the ACE signal will exceed the limit. The enormous change in the ACE signal will not match the real-time predicted load well; at this time, the dispatcher will directly determine that the control effect of AGC system is affected. Under the low-intensity negative compensation attack mode, it is difficult for dispatchers to detect the decline of the AGC system’s control effect, which can lead to the accumulation of a regional power system power deficit and the gradual reduction in frequency induced by the attack.
4.2. Simulation Attack Detection Results
Through the comparative study of machine learning methods, it can be seen that the F1-score index (Appendix A) of the training set model obtained by the random forest algorithm is the best. The running AGC system parameters are synchronously sent into the random forest detection model based on time series, and the detection results are synchronously analyzed using standardized series. Once the attack exceeds the limit, it can be determined that there is an attack in the system. In the AGC system, the frequency of the ACE signal attack and the tie line power attack is much higher than the other three attacks. Therefore, this paper mainly discusses these two attacks.
4.2.1. Single-State Variable Attack Detection
We actively applied an ACE signal attack to the system at the 20th s, and the process of detecting false data injection attacks with each parameter within 50 s of the AGC system running is shown in Figure 6. In the figure, the abscissa is the time series, of which 20 time series units correspond to one second.
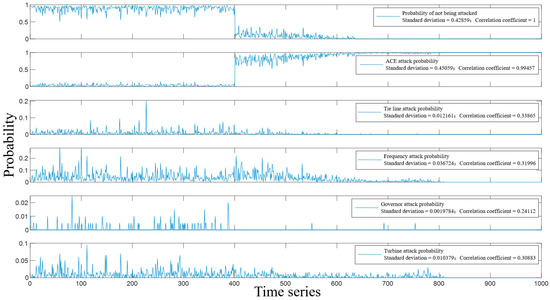
Figure 6.
ACE Single-State Variable Attack Probability Detection Value.
We imported the state data attacked when ACE signals are detected in the 400th time series for real-time data samples (i.e., the 20 s in Figure 3, Figure 4 and Figure 5) into the detection model and obtained the detection results of the model for various attacks, as shown in Figure 6. Among them, the first block diagram represents the likelihood that the AGC system will not be attacked based on all the detected models. The second block diagram shows the likelihood of the system being struck by an ACE signal. The third block diagram shows the likelihood of the system being attacked by tie line power. The fourth block diagram shows the likelihood of the system being attacked by frequency. The fourth block diagram shows the likelihood of the system being attacked by the governor power. The last block diagram shows the likelihood of the system being attacked by turbine power.
It can be clearly seen from Figure 6 that in the 20th s, the probability of the AGC system not being attacked drops sharply, which proves that the system is under attack at this time. According to the results in the rest of the block diagrams, it can be roughly determined that the attack on the system is an ACE attack because the probability of ACE attacks increases to more than 85% in 20 s, while other types of attacks are less than 30%.
To more clearly determine the type of attack on the system, this paper processes the obtained probability results according to the method described in Section 3.2. The result is shown in Figure 7, which indicates that the attack on the AGC system at this time is an ACE attack.
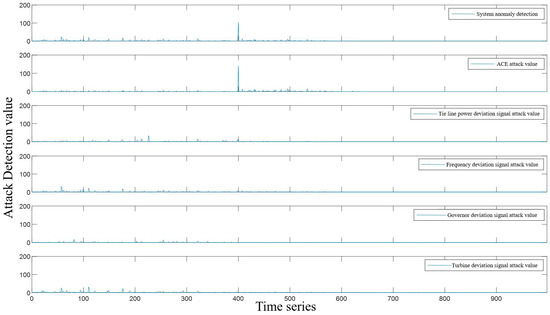
Figure 7.
Quantitative Detection of Single State Variable False Data Injection Attack.
4.2.2. Double-State Variable Attack
At the 20th s, we actively applied ACE and tie-line mixed attacks to the system, then imported the attacked state data into the detection model and obtained the detection results of the model against various attacks, as shown in Figure 8. From the figure, it can be seen that the probability that the system is not attacked at the 20th s drops to 20%, proving that the system is also attacked at this time. However, it is difficult to determine the specific attack type of the system from the results of other block diagrams. By standardizing the primary difference of the initial detection result, the detection result in Figure 9 is obtained. From the figure, it can be found that the ACE signal and tie line power deviation signal are attacked at the same time.
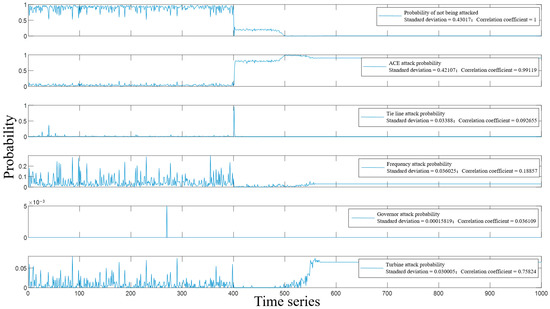
Figure 8.
Detection Value of Mixed Attack Probability of ACE and Tie-Line.
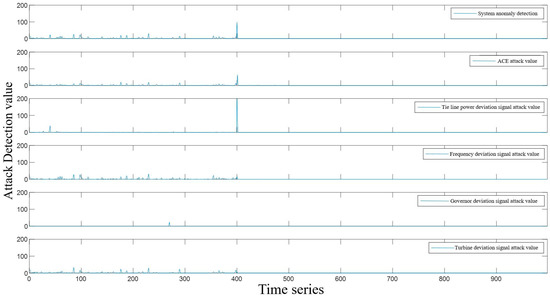
Figure 9.
Quantitative Detection of Double-State Variable False Data Injection Attack.
The non-simultaneous attacks at two or more points can be divided into the range of single-point attack detection because non-simultaneous attacks can be detected in chronological order. This paper will not discuss simultaneous attacks at three or more points because the probability of simultaneous attacks at three or more points is low, and the attack cost is high. In turn, this paper mainly discusses the methods that can be used to detect single-point and two-point attacks. However, the probability of all parameters being attacked is very low, and the cost of such attacks is very high. By observing Figure 7 and Figure 9 after standard serialization, the detection result is entirely consistent with the attack’s analog signal.
The simulation results show that when the power system is running, the real-time operation parameters are detected by the time-series random forest algorithm database training model, which can analyze whether the current state variables of the automatic power generation control system are attacked and detect the location and intensity of the attack, so as to judge the attack time more accurately and intuitively. The detection method based on machine learning overcomes the shortcomings of the poor real-time detection effect of traditional models. It has broad applicability combined with the operating data characteristics of each system.
5. Conclusions
The influence of false data injection attacks on power system operation stability has been experimentally verified in this paper. The random forest algorithm used in this paper has achieved good detection results in false data attack detection and quickly and accurately detected the existence of attacks. From the simulation results, it can be seen that both the mixed attack and the single attack can achieve a high-precision detection effect. Secondly, the detection method of machine learning is an adaptive detection method. When new attack feature data are detected, they can be used to study the new attack model of hackers. Therefore, the false data injection attack detection method based on a random forest algorithm can become a detection strategy that adapts to the change in the attacker’s attack scheme. The main weakness is that the defense work after the completion of the detection work has not yet provided a practical solution, and this work will be further improved.
This paper verifies the good detection effect of two simultaneous attacks in a single-point attack and a multi-point attack. If all parameters of the AGC system are attacked at the same time, the performance of this detection method will become worse. The attack cost of all parameters being assaulted simultaneously is extremely high, and the probability is relatively low. The above are the shortcomings of this detection method. However, as long as false data injection attacks do not occur simultaneously, this method can effectively detect them one by one according to the time series.
Author Contributions
Conceptualization, Z.Q. and C.P.; methodology, X.Z. and Y.G.; validation, Y.W.; formal analysis, Z.Q. and Y.G.; investigation, P.M.G.; data curation, Z.Q.; writing—original draft preparation, X.Z.; writing—review and editing, X.Z., Y.G. and C.P.; supervision, P.M.G. All authors have read and agreed to the published version of the manuscript.
Funding
This research received no external funding.
Data Availability Statement
Not applicable.
Conflicts of Interest
The authors declare no conflict of interest.
Appendix A
In order to study the advantages and disadvantages of various machine learning methods, the datasets under various attack scenarios were first trained to obtain a K-proximity (KNN) detection model, various SVM models, Adaboost models, Bayesian models, linear discriminant reduction algorithms (LDA), and random forest detection models.
We used training set samples in various machine learning algorithms to train their respective detection models. The test set sample is used as an important basis for model evaluation. The test set samples were sent to the detection model for testing, and the confusion matrix data generated by the detection are shown in Figure A1, Figure A2, Figure A3, Figure A4, Figure A5, Figure A6, Figure A7 and Figure A8. In these figures, the abscissa axis is the real label, the vertical axis is the detection label, and the darker the color, the larger the value in the box.
Coordinate Label 0 represents no attack, Label 1 represents a contact line power deviation signal attack, Label 2 represents sampling a frequency deviation signal, Label 3 represents an ACE signal attack, Label 4 represents a governor power deviation signal attack, and Label 5 represents a turbine power deviation signal attack. The value on the confusion matrix diagonal is the number of decision trees that are consistent with the true attack type and the detection attack type.

Figure A1.
KNN confusion matrix.
Figure A1.
KNN confusion matrix.


Figure A2.
Linear SVM confusion matrix.
Figure A2.
Linear SVM confusion matrix.


Figure A3.
RBFSVM confusion matrix.
Figure A3.
RBFSVM confusion matrix.


Figure A4.
Decision tree SVM confusion matrix.
Figure A4.
Decision tree SVM confusion matrix.


Figure A5.
Adaboost confusion matrix.
Figure A5.
Adaboost confusion matrix.


Figure A6.
Bayesian confusion matrix.
Figure A6.
Bayesian confusion matrix.

According to the test set confusion matrix of various machine learning models shown in Figure A1, Figure A2, Figure A3, Figure A4, Figure A5, Figure A6, Figure A7 and Figure A8, it is not difficult to find that the number of false detections in the random forest detection model is 7, the total number of test set samples is 1793, and the false detection rate is 0.39%. The value on the diagonal is the sample size of the predicted and true values that are the same. Therefore, the detection value of the random forest algorithm has a higher similarity with the real value in the data detection of the AGC system.

Figure A7.
LDA Confusion matrix.
Figure A7.
LDA Confusion matrix.


Figure A8.
Random forest confusion matrix.
Figure A8.
Random forest confusion matrix.

More specific model detection results, that is, the evaluation indicators of various machine learning algorithm models and the values of their confusion matrix-derived evaluation indicators, are shown in Table A1, Table A2, Table A3, Table A4, Table A5, Table A6, Table A7 and Table A8.
Table A1.
The algorithm trained on the model metric data.
Table A1.
The algorithm trained on the model metric data.
| Random Forest | Precision | Recall | F1 Score | Test Samples |
|---|---|---|---|---|
| Not attacked | 0.99661 | 1.00000 | 0.99830 | 294 |
| Frequency skew attacks | 1.00000 | 1.00000 | 1.00000 | 300 |
| Tie line power attack | 1.00000 | 1.00000 | 1.00000 | 300 |
| ACE attacks | 0.98680 | 1.00000 | 0.99666 | 299 |
| Governor power attack | 1.00000 | 0.99333 | 0.99666 | 300 |
| Turbine power attack | 0.99327 | 0.98333 | 0.98827 | 300 |
| Precision | 0.99610 | 1793 | ||
| Macro averaging | 0.99611 | 0.99611 | 0.99610 | 1793 |
| Weighted macro average | 0.99327 | 0.99610 | 0.99609 | 1793 |
Table A2.
The KNN algorithm trained on the model indicator data.
Table A2.
The KNN algorithm trained on the model indicator data.
| KNN | Precision | Recall | F1 Score | Test Samples |
|---|---|---|---|---|
| Not attacked | 0.67347 | 0.56122 | 0.61224 | 294 |
| Frequency skew attacks | 0.52844 | 0.96000 | 0.68166 | 300 |
| Tie line power attack | 0.84951 | 0.58333 | 0.69170 | 300 |
| ACE attacks | 0.98326 | 0.78595 | 0.87361 | 299 |
| Governor power attack | 1.00000 | 0.99000 | 0.99497 | 300 |
| Turbine power attack | 1.00000 | 0.87000 | 0.93048 | 300 |
| Precision | 0.78253 | 1793 | ||
| Macro averaging | 0.83911 | 0.79175 | 0.79744 | 1793 |
| Weighted macro average | 0.83959 | 0.79253 | 0.79802 | 1793 |
Table A3.
The linear SVM algorithm trained on model indicator data.
Table A3.
The linear SVM algorithm trained on model indicator data.
| Linear SVM | Precision | Recall | F1 Score | Test Samples |
|---|---|---|---|---|
| Not attacked | 0.39627 | 0.57823 | 0.47026 | 294 |
| Frequency skew attacks | 0.72697 | 0.73667 | 0.73179 | 300 |
| Tie line power attack | 0.86667 | 0.69333 | 0.77037 | 300 |
| ACE attacks | 0.38174 | 0.30769 | 0.34074 | 299 |
| Governor power attack | 1.00000 | 0.99333 | 0.99666 | 300 |
| Turbine power attack | 1.00000 | 0.93667 | 0.96730 | 300 |
| Precision | 0.70831 | 1793 | ||
| Macro averaging | 0.72861 | 0.70765 | 0.71285 | 1793 |
| Weighted macro average | 0.72991 | 0.70831 | 0.71387 | 1793 |
Table A4.
The RBFSVM algorithm trained on model indicator data.
Table A4.
The RBFSVM algorithm trained on model indicator data.
| RBFSVM | Precision | Recall | F1 Score | Test Samples |
|---|---|---|---|---|
| Not attacked | 0.74000 | 0.75510 | 0.74747 | 294 |
| Frequency skew attacks | 0.95862 | 0.92667 | 0.94237 | 300 |
| Tie line power attack | 0.59218 | 0.35333 | 0.44259 | 300 |
| ACE attacks | 0.99324 | 0.98328 | 0.98824 | 299 |
| Governor power attack | 0.49175 | 0.99333 | 0.65784 | 300 |
| Turbine power attack | 0.98361 | 0.40000 | 0.56872 | 300 |
| Precision | 0.73508 | 1793 | ||
| Macro averaging | 0.79323 | 0.73529 | 0.72454 | 1793 |
| Weighted macro average | 0.79330 | 0.73508 | 0.72431 | 1793 |
Table A5.
The decision tree SVM algorithm trained on model indicator data.
Table A5.
The decision tree SVM algorithm trained on model indicator data.
| Decision Tree SVM | Precision | Recall | F1 Score | Test Samples |
|---|---|---|---|---|
| Not attacked | 0.94853 | 0.87755 | 0.91166 | 294 |
| Frequency skew attacks | 0.96129 | 0.99333 | 0.97705 | 300 |
| Tie line power attack | 0.96700 | 0.97667 | 0.97181 | 300 |
| ACE attacks | 0.93289 | 0.92977 | 0.93132 | 299 |
| Governor power attack | 0.99666 | 0.99333 | 0.99499 | 300 |
| Turbine power attack | 0.94212 | 0.97667 | 0.95908 | 300 |
| Precision | 0.95817 | 1793 | ||
| Macro averaging | 0.95808 | 0.95789 | 0.95765 | 1793 |
| Weighted macro average | 0.95813 | 0.95817 | 0.95782 | 1793 |
Table A6.
The Adaboost algorithm trained on model metric data.
Table A6.
The Adaboost algorithm trained on model metric data.
| Adaboost | Precision | Recall | F1 Score | Test Samples |
|---|---|---|---|---|
| Not attacked | 0.93333 | 0.85714 | 0.89362 | 294 |
| Frequency skew attacks | 0.94888 | 0.99000 | 0.96900 | 300 |
| Tie line power attack | 0.95114 | 0.97333 | 0.96211 | 300 |
| ACE attacks | 0.91667 | 0.91973 | 0.91820 | 299 |
| Governor power attack | 1.00000 | 0.99333 | 0.99666 | 300 |
| Turbine power attack | 0.96066 | 0.97667 | 0.96860 | 300 |
| Precision | 0.95204 | 1793 | ||
| Macro averaging | 0.95178 | 0.95170 | 0.95136 | 1793 |
| Weighted macro average | 0.95186 | 0.95204 | 0.95157 | 1793 |
Table A7.
The naive Bayes algorithm trained on model metric data.
Table A7.
The naive Bayes algorithm trained on model metric data.
| Naive Bayes | Precision | Recall | F1 Score | Test Samples |
|---|---|---|---|---|
| Not attacked | 0.38655 | 0.46939 | 0.42396 | 294 |
| Frequency skew attacks | 0.80000 | 0.69333 | 0.74286 | 300 |
| Tie line power attack | 0.91561 | 0.72333 | 0.80819 | 300 |
| ACE attacks | 0.35309 | 0.45819 | 0.39884 | 299 |
| Governor power attack | 1.00000 | 0.93333 | 0.96552 | 300 |
| Turbine power attack | 0.99262 | 0.89667 | 0.94221 | 300 |
| Precision | 0.69660 | 1793 | ||
| Macro averaging | 0.74131 | 0.69571 | 0.71360 | 1793 |
| Weighted macro average | 0.74272 | 0.69660 | 0.71474 | 1793 |
Table A8.
The LDA algorithm trained on model indicator data.
Table A8.
The LDA algorithm trained on model indicator data.
| LDA | Precision | Recall | F1 Score | Test Samples |
|---|---|---|---|---|
| Not attacked | 0.16263 | 0.47959 | 0.24289 | 294 |
| Frequency skew attacks | 1.00000 | 0.37000 | 0.54015 | 300 |
| Tie line power attack | 1.00000 | 0.13667 | 0.24047 | 300 |
| ACE attacks | 0.21418 | 0.47492 | 0.29522 | 299 |
| Governor power attack | 1.00000 | 0.19000 | 0.31933 | 300 |
| Turbine power attack | 1.00000 | 0.18000 | 0.30508 | 300 |
| Precision | 0.30452 | 1793 | ||
| Macro averaging | 0.72947 | 0.30520 | 0.32386 | 1793 |
| Weighted macro average | 0.73165 | 0.30452 | 0.32414 | 1793 |
On this basis, for an AGC system, a system with high dimensional variables and time delay, the confusion matrix in Table A1, Table A2, Table A3, Table A4, Table A5, Table A6, Table A7 and Table A8 and their derived parameters can be compared with the detection performance of various detection models to achieve the proposed false data injection attack detection based on the machine learning classification method. As shown in Figure A9, the ordinate is the F1-score, and the abscissa is the learning type. It can be seen from the figure that the random forest method based on time series is more suitable for the model evaluation obtained after the classification training of the dataset.

Figure A9.
F1-score machine learning algorithm model balance score comparison.
Figure A9.
F1-score machine learning algorithm model balance score comparison.

References
- Chen, T.M.; Abu-Nimeh, S. Lessons from stuxnet. IEEE Comput. Soc. 2011, 44, 91–93. [Google Scholar] [CrossRef]
- Chen, C.Y.; Zhang, K.F.; Yuan, K. Novel detection scheme design considering cyber attacks on load frequency control. IEEE Trans. Ind. Inform. 2018, 14, 1932–1941. [Google Scholar] [CrossRef]
- Khalaf, M.; Youssef, A.; El-Saadany, E. Joint detection and mitigation of false data injection attacks in AGC systems. IEEE Trans. Smart Grid 2019, 10, 4985–4995. [Google Scholar] [CrossRef]
- Alireza, A.; Arman, S. Resilient control design for load frequency control system under false data injection attacks. IEEE Trans. Ind. Electron. 2020, 67, 7951–7961. [Google Scholar]
- Athira, M.; Nader, M.; Hasan, M.A. Comprehensive review of the cyber-attacks and cyber-security on load frequency control of power systems. Energies 2020, 13, 3860. [Google Scholar]
- Xu, F.Y.; Xue, A.C.; Chang, N.C. Research status and prospect of automatic generation control network attack and defense in power system. Power Syst. Autom. 2021, 45, 3–14. [Google Scholar]
- Tan, R.; Nguyen, H.H.; Eddyy, F. Modeling and mitigating impact of false data injection attacks on automatic generation control. IEEE Trans. Inf. Forensics Secur. 2017, 12, 1609–1624. [Google Scholar] [CrossRef]
- Tan, R.; Nguyen, H.H.; Fooey, S. Optimal False Data Injection Attack Against Automatic Generation Control in Power Grids. In Proceedings of the ACM-IEEE International Conference on Cyber-Physical Systems (ICCPS), Vienna, Austria, 11–14 April 2016. [Google Scholar]
- BI, W.J.; Zhang, K.F.; Li, Y.P. Detection scheme against cyber-physical attacks on load frequency control based on dynamic characteristics analysis. IEEE Syst. J. 2019, 13, 2859–2868. [Google Scholar] [CrossRef]
- BI, W.J.; Chen, C.Y.; Zhang, K.F. Optimal strategy of attack-defense interaction over load frequency control considering incomplete information. IEEE Access 2019, 7, 75342–75349. [Google Scholar] [CrossRef]
- Khalaf, M.; Yousse, A.; El-Saadany, E.F. Detection of False Data Injection in Automatic Generation Control Systems Using Kalman Filter. In Proceedings of the IEEE Electrical Power and Energy Conference (EPEC), Saskatoon, SK, Canada, 22–25 October 2017. [Google Scholar]
- Ashok, A.; Wang, P.; Brown, M. Experimental Evaluation of Cyber Attacks on Automatic Generation Control Using a CPS Security Testbed. In Proceedings of the IEEE Power & Energy Society General Meeting, Denver, CO, USA, 26–30 July 2015. [Google Scholar]
- Ali, M.Q.; Reza, Y.; Al-Shaer, E. Two-tier Data Driven Intrusion Detection for Automatic Generation Control in Smart Grid. In Proceedings of the IEEE Conference on Communications and Network Security (CNS), San Francisco, CA, USA, 29–31 October 2014. [Google Scholar]
- Ashok, A.; Sridhar, S.; Mckinnon, A.D. Testbed-based Performance Evaluation of Attack Resilient Control for AGC. In Proceedings of the IEEE 2016 Resilience Week, Chicago, IL, USA, 16–18 August 2016. [Google Scholar]
- Ye, H.; Liu, K.H.; Mou, Q.Y. Modeling and formulation of delayed cyber-physical power system for smallsignal stability analysis and control. IEEE Trans. Power Syst. 2019, 34, 2419–2432. [Google Scholar] [CrossRef]
- Huang, T.; Satchidanandan, B.; Kumar, P.R. An online detection framework for cyber attacks on automatic generation control. IEEE Trans. Power Syst. 2018, 33, 6816–6827. [Google Scholar] [CrossRef]
- Sridhar, S.; Govindarasu, M. Model-based attack detection and mitigation for automatic Generation control. IEEE Trans. Smart Grid 2014, 5, 580–591. [Google Scholar] [CrossRef]
- Wu, Y.D.; Wei, Z.; Weng, J. Resonance attacks on load frequency control of smart grids. IEEE Trans. Smart Grid 2018, 9, 4490–4502. [Google Scholar] [CrossRef]
- Ekomwenrenren, E.; Alharbi, H.; Elgorashi, T. Stabilising control strategy for cyber-physical power systems. IET Cyber-Phys. Syst. Theory Appl. 2019, 4, 265–275. [Google Scholar] [CrossRef]
- Amini, S.; Pasqualetti, F.; Mohsenian-rad, H. Dynamic load altering attacks against power system stability: Attack models and protection schemes. IEEE Trans. Smart Grid 2018, 9, 2862–2872. [Google Scholar] [CrossRef]
- Roy, S.D.; Debbarma, S. Detection and mitigation of cyberattacks on AGC systems of low inertia power grid. IEEE Syst. J. 2020, 14, 2023–2031. [Google Scholar] [CrossRef]
- Tian, E.; Peng, C. Memory-based event-triggering H∞ load frequency control for power systems under deception attacks. IEEE Trans. Cybern. 2020, 50, 4610–4618. [Google Scholar] [CrossRef]
- Jevtic, A.; Zhang, F.L.; Li, Q.H. Physics- and learning-based detection and localization of false data injections in automatic generation control. IFAC Pap. Line 2018, 51, 702–707. [Google Scholar] [CrossRef]
- Ameli, A.; Hooshyar, A.; Yazdavar, A.H. Attack detection for load frequency control systems using stochastic unknown input estimators. IEEE Trans. Inf. Forensics Secur. 2018, 13, 2575–2590. [Google Scholar] [CrossRef]
- Ameli, A.; Hooshyar, A.; El-Saadany, E.F. Attack detection and identification for automatic generation control systems. IEEE Trans. Power Syst. 2018, 33, 4760–4774. [Google Scholar] [CrossRef]
- Wang, P.; Govindarasu, M. Anomaly Detection for Power System Generation Control Based on Hierarchical DBSCAN. In Proceedings of the North American Power Symposium (NAPS), Fargo, ND, USA, 9–11 September 2018. [Google Scholar]
- Wang, P.; Govindarasu, M.; Ashok, A. Datadriven Anomaly Detection for Power System Generation Control. In Proceedings of the IEEE International Conference on Data Mining Workshops (ICDMW), New Orleans, LA, USA, 18–21 November 2017. [Google Scholar]
- Maya, H.L.L.; Bayu, A.T. Dual-IDS: A bagging-based gradient boosting decision tree model for network anomaly intrusion detection system. Expert Syst. Appl. 2023, 213, 119030. [Google Scholar]
- Yan, C. Steady-State Analysis of Power Systems; China Electric Power Press: Beijing, China, 1995. [Google Scholar]


Disclaimer/Publisher’s Note: The statements, opinions and data contained in all publications are solely those of the individual author(s) and contributor(s) and not of MDPI and/or the editor(s). MDPI and/or the editor(s) disclaim responsibility for any injury to people or property resulting from any ideas, methods, instructions or products referred to in the content. |
© 2023 by the authors. Licensee MDPI, Basel, Switzerland. This article is an open access article distributed under the terms and conditions of the Creative Commons Attribution (CC BY) license (https://creativecommons.org/licenses/by/4.0/).