Abstract
There is an increasing need for securing development technology for suitable materials to obtain more productive and lightweight automobile parts, including hydrogen fuel cell stack enclosures. Due to the poor moldability of Poly-Phenylene Oxide (PPO), which excels in terms of mechanical, thermal, and electrical properties, studies are being actively conducted to commercialize modified-PPO (mPPO). However, there is a lack of studies regarding injection molding analysis for pre-verification of the suitability of injection molding in the process of developing engineering plastic resins. Thus, this study utilized the following procedure: (1) it measured the physical properties of mPPO, (2) it selected sample candidates, (3) it applied the Design Of Experiments (DOE) to conduct an injection molding analysis, and finally, (4) it proposed an enclosure-dedicated mPPO due to its suitability for injection molding. The results of this study demonstrated the excellent moldability of mPPO with a mixing ratio of PPO 50%/Poly-Amide66(PA66) 50% among 16 samples by investigating the fill time, deflection, time to reach ejection temperature, void phenomenon and cycle time. Therefore, mPPO with a mixing ratio of PPO 50%/PA66 50% will exhibit the best moldability and increased productivity in manufacturing enclosures.
1. Introduction
Among environmentally friendly vehicle technologies, hydroelectric vehicles become 4–6% more fuel efficient and demonstrate increased durability upon 10% lightweighting. Thus, there is an increasing need to secure related material development technologies that are suitable for more productive and lightweight automobile parts, such as hydrogen fuel cell stack enclosures utilizing conventional metal materials, in addition to developing appropriate engineering plastics for advanced light-weighting of metal materials for replacing their conventional stability, and proper productivity. PPO, a type of engineering plastic, has excellent physical properties, such as mechanical properties, heat resistance, electrical properties, and dimensional stability.
For its mechanical properties, (1) its molding shrinkage is small, and its dimensional accuracy is excellent, (2) its high specific heat results in a small change in its mechanical properties due to temperature change, (3) and it experiences creep at a remarkably low rate, and (4) it has superior tensile strength. For its thermal properties, (1) its thermal deformation temperatures under high loads range from 90 to 170 ℃, which gives it heat-resisting applications, and (2) its Coefficient of Linear Thermal Expansion (CLTE) is close to the level of metal materials among engineering plastics, making it suitable as a structural material for precision functional parts. For its electrical properties, (1) its permittivity and dissipation factors are extremely small, and it remains strong under different frequencies, temperatures, and humidity levels, and (2) its volume resistivity and dielectric strength are excellent. Additionally, PPOs are not affected by most acids, alkalis, or organic solvents. Despite these excellent properties, PPOs have disadvantages in that they are not suitable for processing due to their high molding temperatures and poor fluidity when being molded into products [1].
To resolve these problems of PPOs, research has been conducted on mPPO mixed with engineering plastic, and it has been shown to have excellent processability and moldability at a predetermined ratio. For example, in 1967, “GE” in the United States marketed the first mPPO product under the name “Noryl” by mixing PPO and PolyStyrene (PS) at a predetermined ratio, and in 1979, Japan’s company produced “Zairon” by combining PPO and styrene [2]. Furthermore, there have been active studies on mixtures with other engineering plastics, such as PS, Poly-Propylene (PP), and PA, at a predetermined ratio in various industrial fields.
Regarding the development of mPPO, Won et al. manufactured a short carbon fiber–reinforced PPO/PA6 composite to investigate its impact strength and thermal expansion behavior depending on fiber orientation [3], and Chandra et al. fabricated a PPO/Poly-Ethylene Terephthalate (PET) composite to examine its observable physical properties [4]. Lee et al. measured the electrical and mechanical properties of a PA66/PPO mixture according to the content of Multi-Walled CarboN Tubes (MWCNTs) to verify its potential as a composite material [5]. Lee et al. investigated the phase structure and rheological properties according to the kneading conditions in a Nylon/PPO composite using Graphene Oxide (GO) [6], and Habaue et al. achieved improved physical properties by synthesizing PPO through oxidative coupling polymerization utilizing a copper chloride (CuCl)/pyridine catalyst system [7]. Moreover, Ahn et al. explored the fabrication of composite materials by adding Glass Fiber (GF) to mPPO mixed with PS and PA [8], and Choi et al. presented the characteristics and uses of mPPO, as well as its current domestic and international status [9]. Liu et al. added an MgTiO3-Ca0.7La0.2TiO3 (MTCLT) ceramic to mPPO, which is a mixture of PPO and High-Impact Poly-Styrene (HIPS), thereby showcasing a material that can be resistant to dielectric loss and applicable to the microwave communication field due to its improved thermal and mechanical properties [10]. Li et al. proposed a resin that meets the requirements of prepreg, an intermediate stage of composite materials, regarding thermal stability, fluidity, mechanical properties, and shape by mixing epoxy with PPOs [11]. Xie et al. improved the rigidity and interfacial adhesion of a composite material that was a mixture between PPO and PS using co-polymerization at the site through surface modification [12].
Studies have been continuously conducted regarding the improvement of composite materials through injection molding analysis by applying plastic resins. Lee et al. performed an injection molding analysis and presented methods for process improvement in the development of an engine mount bracket, which is a connecting part that is fixed onto the chassis to support the engine and is made up of composite materials [13]. Jeong et al. presented an injection molding process for top-mount housing by performing an injection flow analysis for manufacturing nano-carbon reinforced composite materials based on nylon resin and pre-verifying injection moldability [14]. Choi et al. developed metallic plastic materials whose plastic surface was partially covered with a metal film and determined their flow patterns through injection molding analysis to present a plan for improving the defective appearance of the outside mirror housing of automobiles [15]. Idayu et al. derived major parameters through a flow analysis of four-cavity injection molds of a plate product family by utilizing a pin-point gate, presenting optimized process conditions based on the DOE and an ANalysis Of VAriance (ANOVA) [16].
Pre-verification of the suitability of injection molding according to injection molding analysis based on Computer-Aided Engineering (CAE) is advantageous in that it can facilitate swift and efficient selection of the optimal resin from various sample candidates when developing resins. Nevertheless, there is a lack of studies on injection molding analysis for pre-verification of the suitability of injection molding in the process of developing engineering plastic resins used in engineering plastic injection molding to substitute metal materials in automobiles.
Therefore, this study utilized the following procedure: (1) it measured and estimated the physical properties of mPPO as a mixture with a predetermined ratio of PPO to PA66, (2) it selected sample candidates with the potential to substitute metal materials, (3) it applied the DOE to conduct an injection molding analysis, and finally, (4) it proposes an enclosure-dedicated mPPO, which is a piece of protective equipment for a stack that connects fuel cells of hydrogen fuel cell vehicles, after determining the suitability for injection molding.
2. Selection of an mPPO Capable of Substituting Metal Materials
2.1. Observation of Characteristics According to PA66/PPO Content Ratio
Table 1 provides the content weight ratios of mPPO to PA66, one of the engineering plastics with excellent moldability, to enhance the moldability of PPO.

Table 1.
Content ratio of PA66/PPO.
The major characteristics of engineering plastics that distinguish them from general-purpose plastics are their mechanical strength, chemical resistance, weather resistance, heat resistance, environmental resistance, electrical characteristics, and flame retardancy [17].
Thus, an analysis of the capability of mPPO, presented in Table 1, to substitute metal materials should be conducted first. As such, this study selected tensile and impact strengths, which are the crucial mechanical strengths in substituting metal materials, as the criteria for judgment, as well as the Melt Flow Index (MFI) to infer injection moldability and pyrolysis temperature to determine heat resistance.
2.1.1. Test Results of Tensile Strength
Tensile strength was tested according to the ISO 527/1A/50 test standard [18,19], and an Instron Universal Testing Machine (UTM) was utilized as the test device. The equipment and specifications are shown in Figure 1 and Table 2, respectively, and the test specimen (type 1A) is presented in Figure 2.
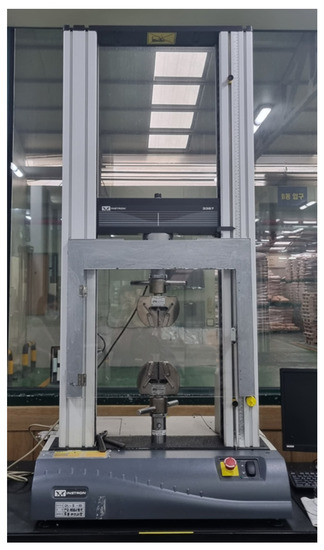
Figure 1.
The universal testing machine.

Table 2.
UTM specification.

Figure 2.
Tensile strength specimen (ISO 527/1A).
For each sample, tensile tests were performed five times. Figure 3 and Table 3 indicate the test results of tensile strength. The experimental results show that the tensile strength increased as the PA66 content increased. In particular, drastic increases in tensile strength occurred when the PA66 content was up 50%, after which the increment decreased.
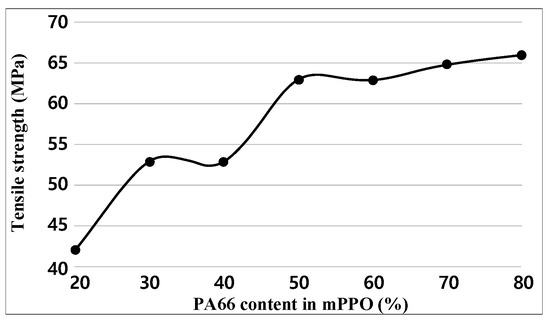
Figure 3.
Tensile strength graph obtained.

Table 3.
Tensile strength results.
2.1.2. Test Results of Impact Strength
Impact strength was tested according to the ISO 179 standard [20], and the Izod impact testing machine (Tinius Olsen) was utilized as the test device. The equipment and specifications are shown in Figure 4 and Table 4, respectively, and the test specimen is presented in Figure 5 and Table 5.
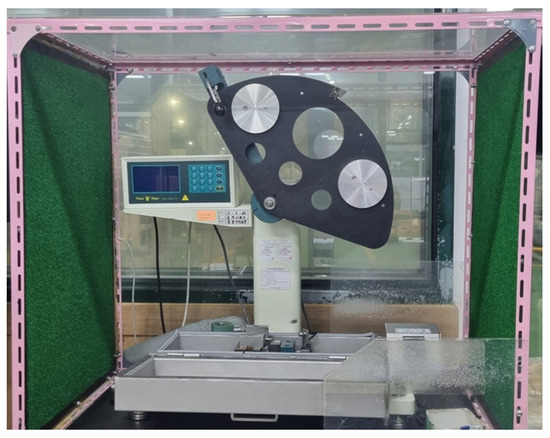
Figure 4.
Izod impact testing machine.

Table 4.
Izod impact testing machine specification.

Figure 5.
Izod impact test specimen (ISO 179).

Table 5.
Izod impact test specimen spec.
For each sample, impact tests were performed five times. Figure 6 and Table 6 show the test results of impact strength. The experimental results indicate that the impact strength decreased as the content of PA66 increased and then drastically increased after the PA66 content reached 50% or more. However, the impact strength decreased when the PA66 content was 80%, showing a relatively higher strength than when the PA66 content made up 20–40%. In general materials, tensile and impact strength have an inverse relationship. However, in the case of composite materials, the material characteristics vary depending on the contents of materials that are to be blended for each alloy, the difference in miscibility, or the interfacial force between molecules. Therefore, the inverse relationship between tensile and impact strength does not always hold. A related reference has been added [21]. Accordingly, it is predicted that the above tensile strength results and the tendency of impact strength results do not match.
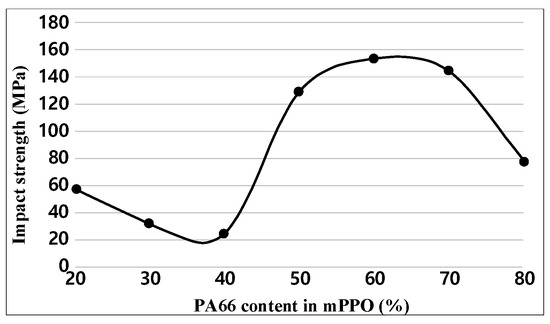
Figure 6.
Impact strength graph obtained.

Table 6.
Impact strength results.
2.1.3. Test Results of the MFI
The MFI was tested according to the ISO 1133 standard [22], and the melt flow indexer (Tinius Olsen) was utilized as the test equipment. The equipment and specifications are presented in Figure 7 and Table 7, respectively. The operation temperature for the experiment is 275 °C.
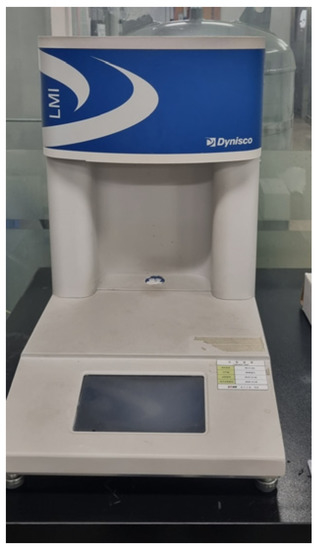
Figure 7.
Melt flow indexer.

Table 7.
Melt flow indexer specification.
For each sample, MFI tests were performed three times. Figure 8 and Table 8 indicate the test results of the MFI. Experimental results demonstrated that the MFI increased with the increase in PA66 content in terms of the overall trend, with a drastic increase occurring when the PA66 content reached 60%. A decrease is observed at 50% of the PA66 content, and 70% of the PA66 content showed almost no difference with an MFI of 60%. Since PA66 has great flowability, it is reasonable to increase the MFI results of MFI as the with the increase in content. However, in the case of composite materials, material characteristics vary depending on miscibility and phase separation morphology; there are cases where it does not uniformly increase compared to the content [23,24].
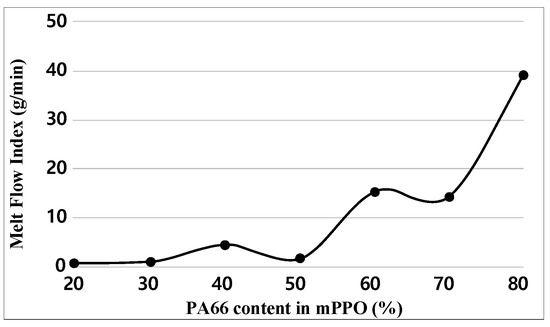
Figure 8.
Melt Flow Index graph obtained.

Table 8.
MFI results.
2.1.4. Test Results of Pyrolysis Temperature
The pyrolysis temperature, which indicates heat resistance, was tested according to the ISO 11,358 standard [25], and the equipment and specifications of Thermo Gravimetric Analysis (TGA, Tinus Oslen) for the test are presented in Figure 9 and Table 9, respectively.
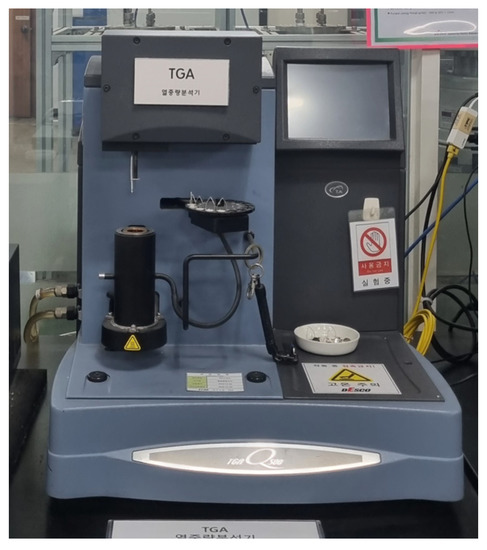
Figure 9.
TGA machine.

Table 9.
TGA machine specification.
Figure 10 and Table 10 show the test results of pyrolysis temperature. The experimental results indicate that the pyrolysis temperature decreased as the content of PA66 increased, but the difference between the maximum and minimum values was insignificant at 10 °C.
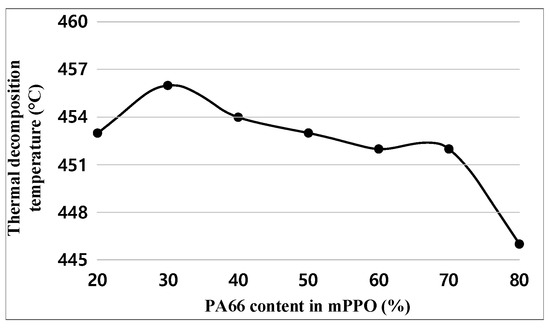
Figure 10.
Thermal decomposition temperature graph obtained.

Table 10.
Thermal decomposition temperature results.
2.2. Determination of Samples Capable of Substituting Metal Materials
The physical property data selected to determine the capability of substituting metal materials were analyzed through experiments on tensile strength, impact strength, the MFI, and pyrolysis temperature. Both the mechanical characteristic of tensile and impact strengths and the flow characteristics of MFI showed a tendency to increase as the content increased. In particular, the tensile and impact strengths exhibited a drastic improvement when the PA66 content reached 50%, while significant improvement in the MFI was observed when the PA66 content reached 60%, and pyrolysis temperature showed a decreasing tendency as the PA66 content increased, with the difference between the maximum and minimum values being insignificant at 10 °C.
In this respect, samples 5–7, which had a PA66 content of 60%, 70%, and 80%, respectively, were selected, as their mechanical and flow characteristics were determined to be excellent. Furthermore, due to the importance of excellent mechanical strength, which indicates the capability of substituting metal materials, this study analyzed the suitability of injection molding for samples 4–7, in which sample 4 had a PA66 content of 50% and excellent mechanical properties despite its relatively inferior flow characteristics.
3. Injection Molding Analysis
3.1. Specimen Modeling and Injection Molding Conditions
As shown in Figure 11, (1) the shape of the test specimens is a simplified form of the hydrogen fuel cell stack enclosure, and the dimensions are shown in Table 11. Moreover, (2) modeling was selected, including orthogonal ribs affecting warpage and shrinkage in injection molding [26,27].
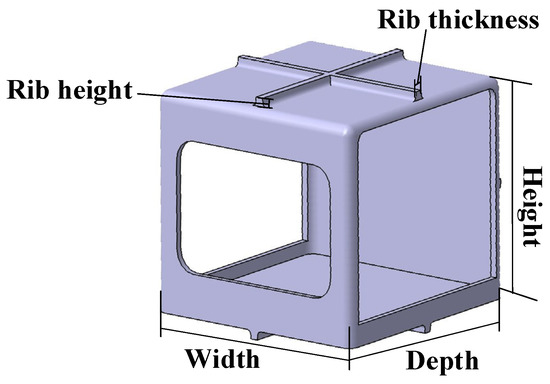
Figure 11.
The specimen for analysis.

Table 11.
Specimen size.
3.2. Physical Property Data Required for Injection Molding Analysis
Injection molding analysis of samples 4–7 was conducted using Moldflow [28], a commercial software. Table 12 presents the physical property data that required input for injection molding analysis under the categories of mechanical properties, fluid properties, and thermal properties, which were the criteria for sample selection.

Table 12.
Material property needed for simulation.
3.2.1. Physical Property Data Calculation and Experiments on Mechanical Properties
As shown in Table 12, the mechanical properties included elastic modulus, shear modulus, Poisson’s rate, and Coefficient of Linear Thermal Expansion (CLTE).
In the aforementioned tensile strength test, both elastic modulus and Poisson’s rate were measured, and the shear modulus can be obtained using Equation (1). Table 13 shows the results of experiments on tensile strength, elastic modulus, and shear modulus for each sample.

Table 13.
Mechanical property results.
Here, , , and refer to shear modulus, elastic modulus, and Poisson’s rate, respectively.
The CLTE is closely related to the tensile and impact strengths because it is related to the strength of the atomic bonding in each direction, as shown in Equations (2)–(4). However, due to the planar anisotropy of semi-crystalline resins, the test was performed in horizontal (H) and vertical (V) directions alone.
Here, , , , z, and refer to CLTE, direction length, direction length, direction length, and temperature difference, respectively.
The measurements of the CLTE were obtained in the temperature range of 23–170 °C by utilizing the Thermal Melting Analyzer (TMA, Sinco, Conway, AR, USA), as shown in Figure 12 and Table 14, and the results are presented in Table 15. As the PA66 content increased, the CLTE tended to increase. In particular, sample 7, which had the highest PA66 content at 80%, exhibited the greatest physical deformation due to heat.
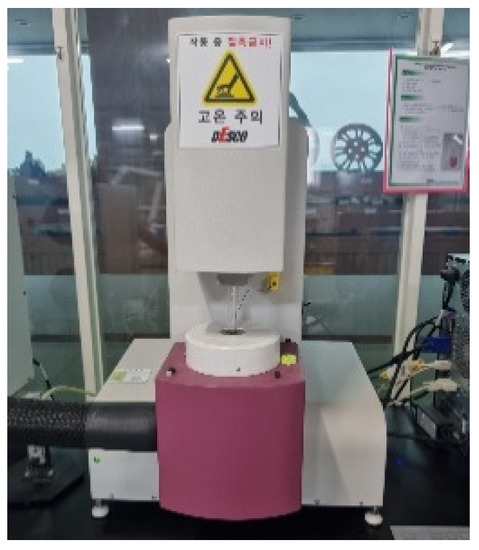
Figure 12.
Thermal melting analyzer.

Table 14.
TMA specification.

Table 15.
CLTE results.
3.2.2. Experiment and Calculation of Physical Property Data Regarding Flow Characteristics
Viscosity according to each temperature section of the selected sample was measured using a capillary rheometer with a piston diameter of 15 mm. Viscosity was measured at 290, 300, and 310 °C with a tolerance of 0.5 °C or less. Figure 13 indicates the viscosity data for each sample. The x-axis and y-axis represent log10 (shear rate) and log10 (viscosity), respectively.
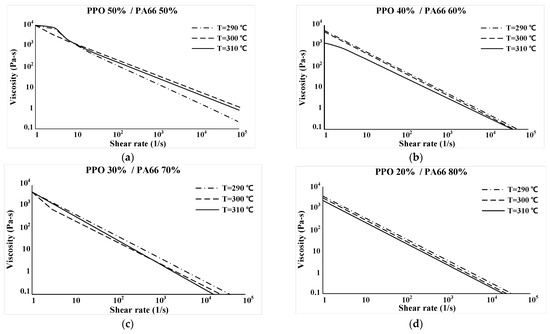
Figure 13.
Viscosity results. (a) PPO 50%/PA66 50% (b) PPO 40%/PA66 60% (c) PPO 30%/PA66 70% (d) PPO 20%/PA66 80%.
The melting temperature, which is shown in Figure 14 and Table 16, was measured using Differential Scanning Calorimetry (DSC, TA Instruments). The measured results are presented in Figure 15, and the melting temperature of each sample is shown in Table 17.
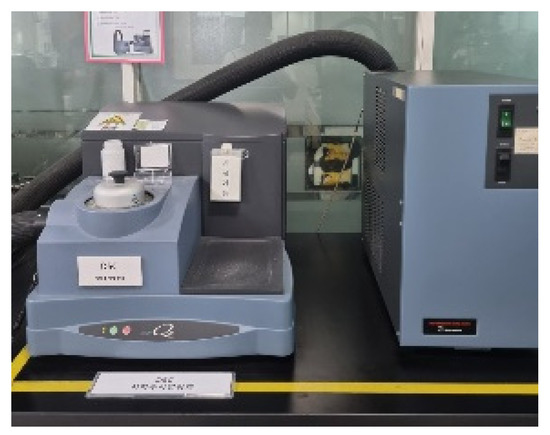
Figure 14.
Differential scanning calorimetry.

Table 16.
DSC specification.
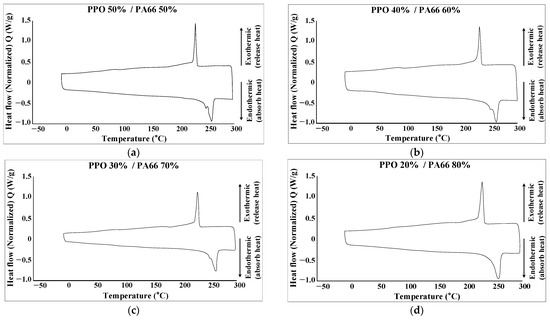
Figure 15.
DSC results. (a) PPO 50%/PA66 50% (b) PPO 40%/PA66 60% (c) PPO 30%/PA66 70% (d) PPO 20%/PA66 80%.

Table 17.
Melt temperature results.
The experimental results according to the melting temperature show that the difference across samples was insignificant and that they have a melting temperature range similar to that of PA66, which is an aspect of mPPO that has a melting temperature of 251.78 °C.
The pvT chart, which represents temperature versus specific volume for each pressure section, was estimated by theoretical calculations because of the lack of a proper measuring device. This study utilized the pvT data that are published in Moldflow of Xyron 600H PPO (Asahi) and Technyl A 218 Natural PA66 (Solvany), which have a similar solid density to that of PPO and PA66, respectively, to estimate the pvT data of mPPO. The two-domain modified Tait pvT model coefficients, which are utilized in Moldflow, were obtained using Equations (5)–(13) to represent the pvT model coefficients for samples 4–7, as shown in Table 18, Table 19, Table 20 and Table 21, respectively.

Table 18.
No.4: two-domain modified Tait pvT model coefficients.

Table 19.
No.5: two-domain modified Tait pvT model coefficients.

Table 20.
No.6: two-domain modified Tait pvT model coefficients.

Table 21.
No.7: two-domain modified Tait pvT model coefficients.
Here, refers to the specific volume at 0 pressure, and , , , are the dependent variables and sensitivity with respect to the pressure and temperature of molten/solid resins. , , and refer to the coefficient representing the change in according to pressure, the coefficient describing the transition form, and the Eigen constant, respectively.
3.2.3. Calculation of and Experiments on Thermal Properties
Physical property data related to thermal properties included the data on specific heat and thermal conductivity.
Because pyrolysis temperature is inversely proportional to the thermal diffusion coefficient, and the thermal diffusivity can be represented as in Equation (14), it is closely related to specific heat and thermal conductivity.
Here, , , , and refer to the thermal diffusion coefficient, thermal conductivity, density, and specific heat, respectively.
The measurements for specific heat and thermal conductivity tests were obtained by utilizing the Thermal Conductivity Analyzer (TCA), which is a thermal conductivity measuring instrument and is shown in Figure 16 and Table 22. The conditions of the specimens in the experiment are displayed in Table 23.
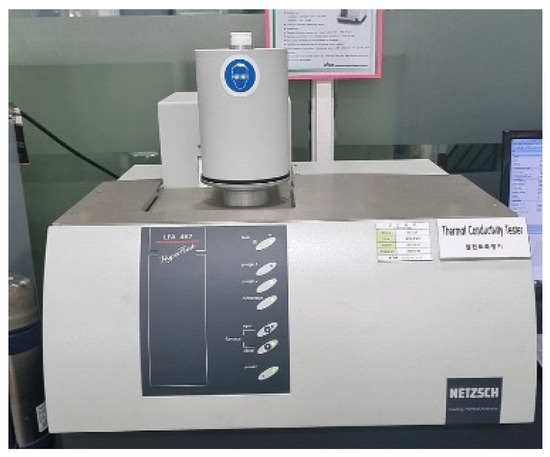
Figure 16.
Thermal conductivity analyzer.

Table 22.
TCA specification.

Table 23.
Specimen for TCA test.
Figure 17 shows the plot for the measured values of specific heat and thermal conductivity for the temperature of each sample. The temperature point on the graph where the value changes greatly can be predicted as the point where the state change begins to occur.
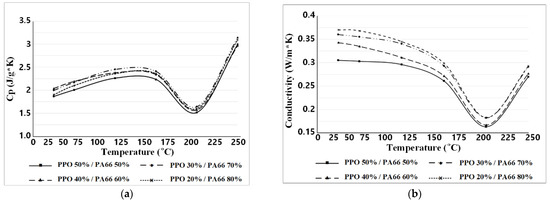
Figure 17.
TCA results. (a) Temperature–specific heat; (b) temperature–conductivity.
Figure 17 shows the plot for the measured values of specific heat and thermal conductivity for the temperature of each sample. The temperature point on the graph where the value changes greatly can be predicted as the point where the transition begins to occur.
3.3. Orthogonal Array in the DOE
The DOE is a technique in which one selects various factors affecting the characteristics of a target product, conducts experiments, and discovers the optimal conditions for that product in an efficient manner. In the DOE using the Taguchi method, an orthogonal array is utilized under the assumption of no interaction to design experimental conditions, thereby significantly reducing the number of experiments compared to other DOE methods. Furthermore, the Signal to Noise (SN) ratio analysis renders accessible quality measurement according to characteristics. This study applied the Taguchi method to determine the suitability of injection molding.
Mechanical, fluid, and thermal properties, which were the criteria for selecting samples, were selected as control factors, and the physical property data were set as detailed control factors representing each control factor according to Table 12. Therefore, Factor A indicates mechanical properties and means that the modulus of elasticity, shear modulus, and CLTE, which are classified as mechanical properties, are set as one control factor. Factor B indicates fluidity and means that viscosity, pvT, melting temperature, solid density, and melt density, which are classified as fluidity properties, are set as one control factor. Factor C indicates thermal characteristics and means that specific heat and thermal conductivity, which are classified as thermal characteristics, are set as one control factor. For each control factor, Levels 1–4 were assigned to the physical property data corresponding to samples 4–7, respectively. Table 24 displays the control factors and their level values, and Table 25 shows the experimental plan table prepared accordingly.

Table 24.
Design variables and levels.

Table 25.
orthogonal array.
The characteristics of a material suitable for injection molding analysis are as follows: excellent flowability and low retention during injection molding, excellent dimensional accuracy due to low deflection, and short cycle time, which boosts productivity. Thus, fill time, deflection, and time to reach ejection temperature were selected as objective functions to determine the suitability of injection molding. The fill time may be utilized to predict the flowability during injection molding, and both fill time and time to reach ejection temperature may be used to predict cycle time. In addition, deflection may be utilized to predict defect phenomena due to shrinkage.
4. Injection Molding Analysis
4.1. Process Conditions
Table 26 presents the process conditions for injection molding analysis. Because the melting temperatures of samples 4–7 ranged from 249.38 to 253.68 °C, the melt temperature was set to 280 °C. Here, the melt temperature is the term used in the Moldflow, which implies the start-point temperature during injection, that is, the molding temperature. Since heat loss occurs while passing through the runner system when applied in the actual field, the molding temperature is generally set to be about 20 to 40 °C higher than the resin’s melting temperature. Considering this, the melt temperature, which means molding temperature, was selected at 280 degrees under the process conditions. The maximum injection pressure was set to 180 MPa based on the basic injection machine The average thickness of the analysis model was 4 mm, while its width, length, and height were 120, 100, and 120 mm, respectively. As such, the packing pressures were set stepwise to reduce the effect of thickness on fluidity with respect to flow distance. Packing starts with 80 MPa at the initial packing pressure, giving 80 MPa of packing pressure for 5 s, and giving 60 MPa of packing pressure for 10 s.

Table 26.
Process conditions.
Moreover, because this study intended to determine the injection moldability for physical properties rather than that for structural and process conditions, cooling analysis was skipped under the assumption that cooling was uniform.
4.2. DOE Results
For the injection analysis results utilizing Moldflow for each level combination, Figure 18, Figure 19 and Figure 20 show the fill time, deflection, and the time to reach ejection temperature, respectively. Table 27 presents the values of each analysis result.
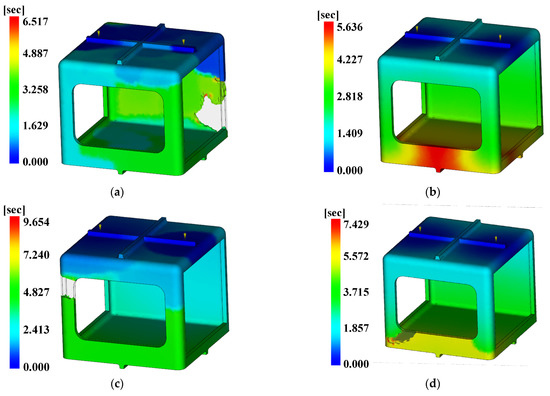
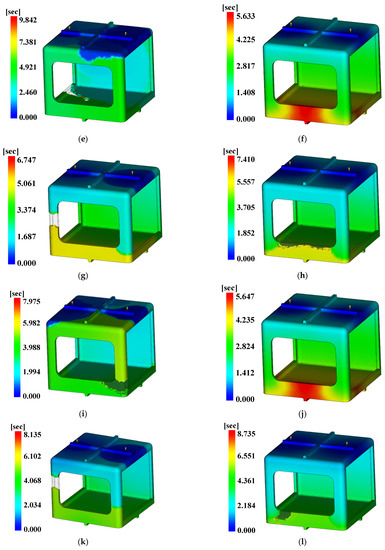
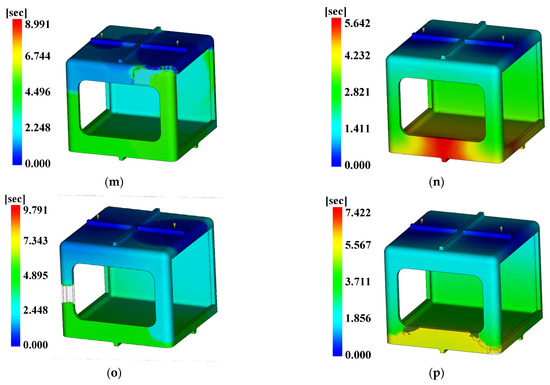
Figure 18.
Fill time. (a) Case 1, (b) Case 2, (c) Case 3, (d) Case 4, (e) Case 5, (f) Case 6, (g) Case 7, (h) Case 8, (i) Case 9, (j) Case 10, (k) Case 11, (l) Case 12, (m) Case 13, (n) Case 14, (o) Case 15, (p) Case 16.
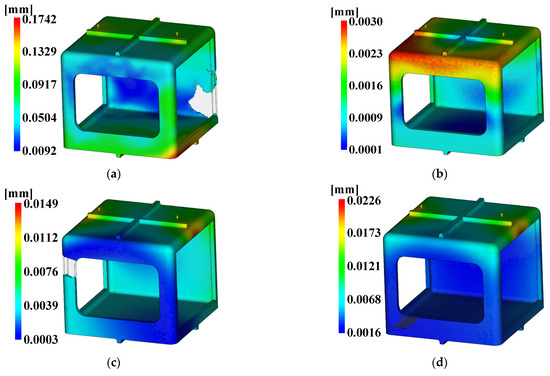
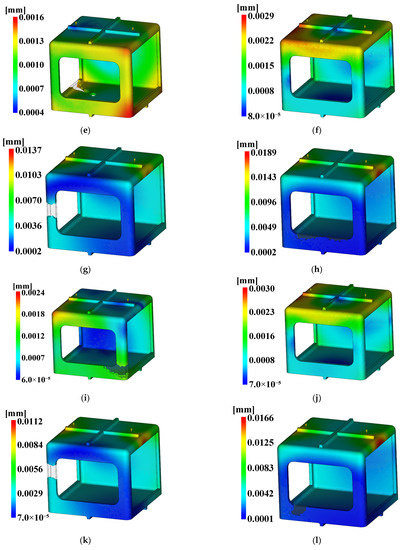
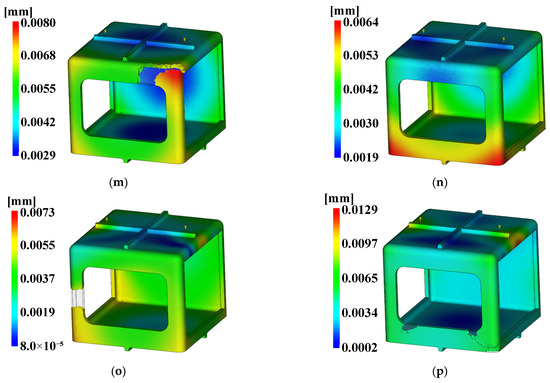
Figure 19.
Deflection. (a) Case 1, (b) Case 2, (c) Case 3, (d) Case 4, (e) Case 5, (f) Case 6, (g) Case 7, (h) Case 8, (i) Case 9, (j) Case 10, (k) Case 11, (l) Case 12, (m) Case 13, (n) Case 14, (o) Case 15, (p) Case 16.
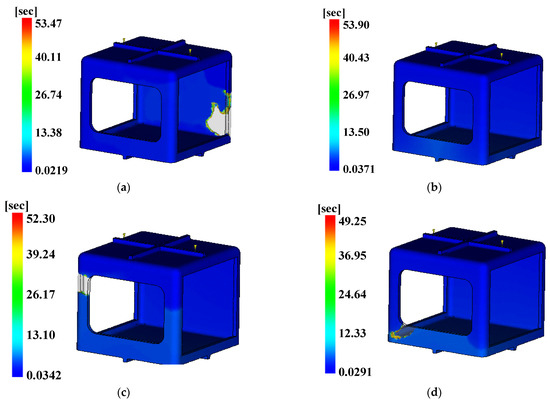
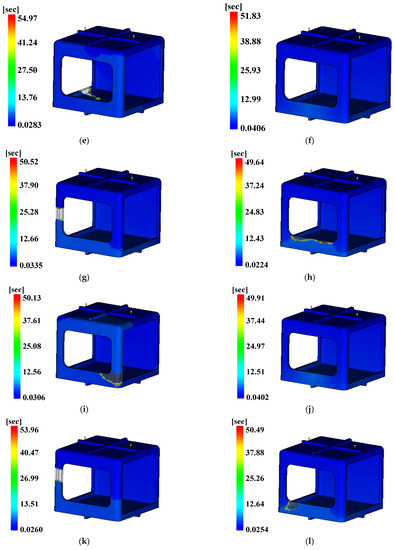
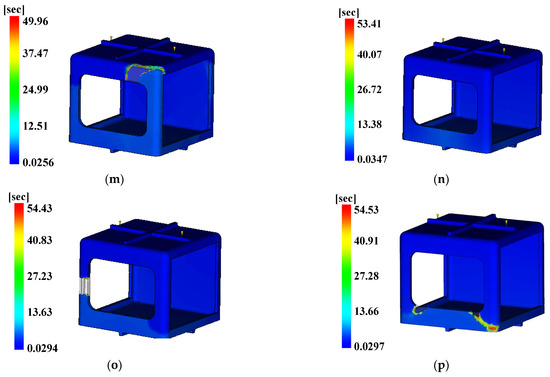
Figure 20.
Time to ejection temperature. (a) Case 1, (b) Case 2, (c) Case 3, (d) Case 4, (e) Case 5, (f) Case 6, (g) Case 7, (h) Case 8, (i) Case 9, (j) Case 10, (k) Case 11, (l) Case 12, (m) Case 13, (n) Case 14, (o) Case 15, (p) Case 16.

Table 27.
Injection molding analysis results of orthogonal array.
4.3. Results Applying the SN Ratio
Because the fill time, deflection, and the time to reach ejection temperature, as the objective functions, would be more desirable as each value decreases, a quality loss function shown in Equation (15), representing the relationship that smaller equals better quality in the Taguchi method, was applied to estimate the most suitable level of samples by comparing the SN ratio of each sample:
where and refer to the analysis result value and the number of analyses, respectively.
Table 28, Table 29 and Table 30 show the fill time, maximum degree of deflection, and resulting SN ratios for the time to reach ejection temperature, respectively.

Table 28.
SN ratio of fill time.

Table 29.
SN ratio of deflection.

Table 30.
SN ratio of time to ejection temperature.
The three conditions with the maximum SN ratio were analysis conditions No. 6, 9, and 4 for the fill time, the maximum degree of deflection, and the time to reach ejection temperature, respectively. However, as shown in Figure 20, voids were observed in the analysis results, except in analysis conditions No. 2, 6, 10, and 14, and notably, the fluidity of all of the control factors was Level 2. Because products that have defects due to voids during injection molding are not distributable, the evaluation was performed after excluding the analysis conditions in which void areas were present. Table 31 and Table 32 present the results for each objective function and the calculation results on the SN ratio, respectively.

Table 31.
Results of full injection.

Table 32.
SN ratio of fully injected results.
Analysis condition No. 6 consistently showed the highest S/N ratio for the fill time and the highest degree of deflection, while analysis condition No. 10 indicated the highest S/N ratio for the time to reach ejection temperature. In this case, because the initial assumption was that the cooling was uniform across the products during the injection molding analysis, the sum of the fill time and the time to reach ejection temperature was proportional to the cycle time of the injection molding process. Thus, the Cycle Time (CT) of analysis conditions No. 6 and 10 were 55.593 and 55.557 s, and the analysis condition according to the level combination of No. 6 was determined to be relatively good in relation to the suitability of injection molding.
4.4. Suggestion of Suitable mPPO
The analysis condition No. 6 corresponded to sample 5 in terms of the physical property data of its mechanical properties and flow properties. The physical property data of this condition’s thermal properties corresponded to sample 6. However, considering the level combination based on the analysis results without voids, all conditions for fluidity corresponded to Level 2. Therefore, we recommend sample 5, which is the combination of PPO 40%/PA66 60%, as an mPPO that meets the physical property data that are suitable for injection molding.
5. Conclusions
This study utilized the following procedure: (1) it measured and estimated the physical properties of mPPO as a mixture with a predetermined ratio of PPO to PA66, (2) it selected sample candidates with the potential to substitute metal materials, (3) it applied the DOE to conduct an injection molding analysis, and (4) it performed an injection molding analysis to propose an mPPO, which is utilized for hydrogen fuel-cell stack enclosure in vehicles, which is suitable for injection molding. The conclusions are as follows.
(1) The criteria for determining the capability of mPPO to substitute metal materials in terms of tensile and impact strengths were selected, after which the pyrolysis temperature, which can indicate heat resistance, and the MFI of the fluidity that facilitates inference of injection moldability were also selected.
(2) Based on the experimental results, samples 5, 6, 7 were selected due to their excellent mechanical and flow properties, and they corresponded to the PA66 content of 60%, 70%, and 80%, respectively. However, due to the importance of excellent mechanical strength for substituting metal materials, sample 4, which had relatively inferior flow properties and excellent mechanical properties and corresponded to the PA66 content of 50%, was additionally selected.
(3) A simplified form of the hydrogen fuel cell stack enclosure was modeled so that an injection molding analysis could be conducted with the selected samples. In addition, the physical property data necessary for analysis were tested and calculated for samples 4–7, including elastic modulus, shear modulus, CLTE, viscosity, pvT chart, solid density, melting temperature, specific heat, and thermal conductivity.
(4) The DOE using the Taguchi method was utilized to optimize the injection molding analysis, and mechanical, flow, and thermal properties were set as control factors. For each control factor, each sample was arranged in Levels 1 to 4 and constructed according to the orthogonal array .
(5) The analysis conditions No. 6, 9, and 5 were determined to be those with the highest S/N ratio from the injection molding analysis results based on the DOE method, corresponding to the fill time (SN ratio of −15.0148), the maximum degree of deflection (SN ratio of 55.9176), and the time to reach ejection temperature (SN ratio of −33.8481), respectively.
(6) However, voids occurred, except in analysis conditions No. 2, 6, 10, and 14. Thus, the analysis proceeded for the analysis conditions in which the void area was not present, with analysis condition No. 6 being consistently determined as the condition with the highest S/N ratio for the fill time and the maximum degree of deflection (SN ratio of −15.0148 and 50.7520, respectively), while analysis condition No. 10 had the highest SN ratio for the time to reach ejection temperature (SN ratio of −33.9638).
(7) Due to the initial assumption that the cooling was uniform across the products during the injection molding analysis, the sum of the fill time and the time to reach ejection temperature was proportional to the CT of the injection molding process. Thus, the CT for analysis conditions No. 6 and 10 was 55.593 and 55.557 s, respectively, and the analysis condition according to the level combination of No. 6 was determined to be relatively good in relation to the suitability of injection.
(8) Therefore, sample Nos. 5 and 6 were determined to have suitable conditions for injection molding. However, because all cases other than those in which the flow characteristics corresponded to Level 2 exhibited the void phenomenon, we recommend sample No. 5 with the combination of 50% PPO/50% PA66 as an mPPO that satisfies the physical property data suitable for injection molding.
An injection flow analysis will be conducted regarding the actual stack enclosure product of a hydrogen fuel cell vehicle to which the proposed mPPO will be applied to derive an optimized process for the defect phenomenon, and further studies will be conducted on the characteristics according to the application of GF. Moreover, there is a need for research based on the derived process to determine whether mass production is possible.
Author Contributions
Conceptualization, S.-B.L.; investigation, S.-L.L. and B.-J.K.; methodology, S.-B.L.; theoretical background, B.-J.K. and S.-B.L.; data analysis, S.-L.L. and S.-B.L.; formal analysis, B.-J.K. and S.-B.L.; software S.-L.L.; supervision, S.-B.L.; writing—original draft preparation, S.-L.L. and B.-J.K.; writing—review and editing, S.-B.L. All authors have read and agreed to the published version of the manuscript.
Funding
‘Material parts technology development’ project (20011012) supported by the Korea Evaluation Institute of Industrial Technology (KEIT) grant funded by the Korea Government (MOTIE).
Institutional Review Board Statement
Not applicable.
Informed Consent Statement
Not applicable.
Data Availability Statement
Not applicable.
Acknowledgments
This research was conducted as a service to DESCO, CO., Ltd., which is conducting ‘Development of thermoplastic composite material and part molding process technology for lightweight hydrogen electric vehicle electrical parts (20011012)’ of the ‘Material parts technology development’ project supported by the Korea Evaluation Institute of Industrial Technology (KEIT) grant funded by the Korea Government (MOTIE).
Conflicts of Interest
The authors declare no conflict of interest.
References
- Park, J.H.; Kim, N.C.; Kim, Y.T.; Nam, S.W.; Kim, Y.J.; Kim, J.H. Preparation and characteristics of poly (phenylene ether)s in various reaction conditions. Polymer 2011, 35, 244–248. [Google Scholar]
- Son, Y.G. The Prediction of Phase Morphology of Injection Molded Polymer Blends. Elastomers Compos. 2004, 39, 193–208. [Google Scholar]
- Won, H.J.; Seong, D.G.; Lee, J.W.; Um, M.K. A study on the effect of fiber orientation on impact strength and thermal expansion behavior of carbon fiber reinforced PA6/PPO composites. Compos. Res. 2014, 27, 52–58. [Google Scholar] [CrossRef][Green Version]
- Chandra, R.; Mishra, S.; Kumar, P.; Rajabi, L. Photo-oxidative degradation of PPO/PET blends. Die Angew. Makromol. Chem. Appl. Macromol. Chem. Phys. 1994, 214, 1–9. [Google Scholar] [CrossRef]
- Lee, Y.S.; Lee, S.K.; Kim, J.H.; Yoon, K.H. Electrical and mechanical properties of PA66/ppe blend containing MWCNT. Polymer-Korea 2019, 43, 331–336. [Google Scholar] [CrossRef]
- Lee, J.; Kim, H. Effect of Mixing Protocol on the Phase Structure of Nylon/PPE/Graphene Oxide Composites. Polymer-Korea 2017, 41, 804–810. [Google Scholar] [CrossRef]
- Habaue, S.; Ito, R.; Okumura, K.; Takamushi, Y. Oxidative Coupling Copolymerization of 2, 6-Dimethylphenol and Dihydroxynaphthalene Affording Poly (phenylene oxide) Derivatives. J. Polym. 2015, 2015, 478729. [Google Scholar] [CrossRef]
- Ahn, S.; Lee, J.C.; Kim, K.Y. Preparation and Characterization of Glass-Fiber-Reinforced Modified Polyphenylene Oxide by a Direct Fiber Feeding Extrusion Process. Appl. Sci. 2021, 11, 10266. [Google Scholar] [CrossRef]
- Choi, K.Y.; Yi, M.H.; Shim, S.Y. The Status and Prospect of MPPO. Polym. Sci. Technol. 1990, 1, 153–161. [Google Scholar]
- Liu, Y.; Peng, H.; Yao, X.; Mao, M.; Song, K.; Lin, H. Study on properties of ultra-low dielectric loss mPPO/MTCLT composites prepared by injection molding. J. Adv. Dielectr. 2022, 12, 2250004. [Google Scholar] [CrossRef]
- Li, H.; Liu, Z.; Gu, J.; Wang, D.; Qu, C. Preparation of high performance adhesives matrix based on epoxy resin modified by bis-hydroxy terminated polyphenylene oxide. J. Adhes. Sci. Technol. 2018, 32, 1224–1238. [Google Scholar] [CrossRef]
- Xie, X.L.; Tang, C.Y.; Zhou, X.P.; Li, R.K.Y.; Yu, Z.Z.; Zhang, Q.X.; Mai, Y.W. Enhanced interfacial adhesion between PPO and glass beads in composites by surface modification of glass beads via in situ polymerization and copolymerization. Chem. Mater. 2004, 16, 133–138. [Google Scholar] [CrossRef]
- Lee, S.C.; Kim, J.W.; Yoon, S.I. Injection Molding Analysis for Development of Torque Roll Engine Mount Module using Composite Materials. In Proceedings of the KAIS Spring Conference, Jeongseon, Korea, 22–23 May 2015. [Google Scholar]
- Jeong, H.J.; Kim, S.H.; Cho, S.W.; Jeong, S.W.; Kwon, I.J. A Study on the Optimization of Injection Molding Process for Automotive Parts Using Nanocarbon Reinforced Composite Materials. In Proceedings of the KSME Conference, Jeju, Korea, 28–30 April 2021. [Google Scholar]
- Choi, M.J.; Cho, J.M.; Choi, Y.H.; Choi, M.H.; Lee, C.S.; Sung, H.K.; Lee, K.S.; Park, K.H.; Hwang, S.J. Development of Paint-free Metallic Plastic Material for Automotive Parts. Korean Chem. Eng. Res. 2022, 60, 295–299. [Google Scholar]
- Idayu, N.; Md Ali, M.A.; Kasim, M.S.; Abdul Aziz, M.S.; Raja Abdullah, R.I.; Sulaiman, M.A. Flow analysis of three plate family injection mould using moldflow software analysis. In Proceedings of the 2nd Symposium on Intelligent Manufacturing and Mechatronics, Melaka, Malaysia, 8 July 2019. [Google Scholar]
- Choi, G. Engineering Plastic. Polym. Sci. Technol. 2009, 20, 3–7. [Google Scholar]
- ISO 527-1:2019; Plastics—Determination of Tensile Properties—Part 1: General Principles. ISO: Geneva, Switzerland, 2019. Available online: https://www.iso.org/standard/75824.html (accessed on 20 June 2019).
- ISO 527-2:2012; Plastics—Determination of Tensile Properties—Part 2: Test Conditions for Molding and Extrusion Plastics. ISO: Geneva, Switzerland, 2012. Available online: https://www.iso.org/standard/56046.html (accessed on 20 June 2022).
- ISO 179-2:2020; Plastics—Determination of Charpy Impact Properties—Part 2: Instrumented Impact Test. ISO: Geneva, Switzerland, 2020. Available online: https://www.iso.org/standard/75825.html (accessed on 20 June 2022).
- Shangguan, Y.; Chen, F.; Yang, J.; Jia, E.; Zheng, Q. A new approach to fabricate polypropylene alloy with excellent low-temperature toughness and balanced toughness-rigidity through unmatched thermal expansion coefficients between components. Polymer 2017, 112, 318–324. [Google Scholar] [CrossRef]
- ISO 1133-1:2011; Plastics—Determination of the Melt Mass-Flow Rate (MFR) and Melt Volume-Flow Rate (MVR) of Thermoplastics—Part 1: Standard Method. ISO: Geneva, Switzerland, 2011. Available online: https://www.iso.org/standard/44273.html (accessed on 20 June 2022).
- Alexy, P.; Košıková, B.; Podstránska, G. The effect of blending lignin with polyethylene and polypropylene on physical properties. Polymer 2020, 41, 4901–4908. [Google Scholar] [CrossRef]
- Pivsa-Art, W.; Pavasupree, S.; Narongchai, O.; Insuan, U.; Jailak, P.; Pivsa-Art, S. Preparation of Polymer Blends between Poly (L-lactic acid), Poly (butylene succinate-co-adipate) and Poly (butylene adipate-co-terephthalate) for Blow Film Industrial Application. Energy Procedia 2011, 9, 581–588. [Google Scholar] [CrossRef]
- ISO 11358-1:2014; Plastics—Thermogravimetry (TG) of Polymers—Part 1: General Principles. ISO: Geneva, Switzerland, 2019. Available online: https://www.iso.org/standard/59710.html (accessed on 20 July 2022).
- Lee, S.H.; Kim, M.Y. The Effects of Orthogonal Ribs on Warpage and CAE Analysis. In Proceedings of the KSME Conference, Pyeongchang, Korea, 25–27 May 2005. [Google Scholar]
- Lee, M.; Kim, H.; Lyu, M.Y. A study on the warpage of glass fiber reinforced plastics for part design and operation condition: Part 1. Amorphous plastics. Polymer 2012, 36, 555–563. [Google Scholar]
- AUTODESK Moldflow-Plastic Injection and Compression Mold Simulation for Design and Manufacturing. Available online: https://www.autodesk.com/products/moldflow/overview (accessed on 23 July 2022).
Publisher’s Note: MDPI stays neutral with regard to jurisdictional claims in published maps and institutional affiliations. |
© 2022 by the authors. Licensee MDPI, Basel, Switzerland. This article is an open access article distributed under the terms and conditions of the Creative Commons Attribution (CC BY) license (https://creativecommons.org/licenses/by/4.0/).