Abstract
Applications of 3D printing in the fashion industry have continued to attract interest from academia and industry in order to improve and add functionalities to products. Among these applications, an interesting one is 3D printing on textile fabric. Composite structures created by 3D printing and textile fabric change a drape by improving or worsening its appearance. The scope of this work is to evaluate the effect of various 3D printed geometries on textile fabric regarding fabric drapes. The drape coefficient of the created composite structure is evaluated using a drape tester built according to EN ISO 9073-9. The results taken are compared with an algorithm developed for determining drape parameters and 3D form representation using color digital images and their image histograms. The measured values of the drape coefficient are close, with a minimal difference, up to 4%. The 3D printed patterns show a significant effect on the drape coefficient of textile fabrics by depicting another way to modify fabric drapes and create complex shapes by using less material. This can be seen as an advantage in the fashion industry where complex geometries can be added to textile fabrics, while changing fabric drape and product personalization and adding functionalities for garments and technical textiles.
1. Introduction
Continuing development of technology has shown its impact in different areas of production. The fashion industry has adapted these technologies to revolutionize it brands. However, one of the main requests is fulfilling or meeting consumers’ preferences, especially the preferences regarding product personalization. Digitalization in the fashion industry speeds up product customization through different technologies, as part of the fourth industrial revolution. Industry 4.0, even known as smart manufacturing because of its main pillars such as 3D modeling, simulation, additive manufacturing, and digital data processing, has optimized the development of a wide range of products. Moreover, I4.0 is a synonym for sustainable production. As a sensitive topic, it has gained the attention of various researchers who highlight that there is a link between Industry 4.0 and sustainability, where I4.0 is a key factor in speeding up sustainable development [1].
The fashion industry is more exposed to the issue of sustainability due to its negative contribution through fast fashion, overconsumption, technological process, etc. Due to this fact, there are initiatives from companies that try to make an impact or give their contribution to sustainable ways of production. Improvements are seen in developed countries which are more likely to adopt Industry 4.0, but its implementation is still in its infancy [2]. In addition, researchers have found that retail companies are the first to use pillars of Industry 4.0 compared to textile companies. However, findings reveal a wide spread in fashion management [3]. Among the pillars of I4.0, 3D printing is a well-known technology for various applications in developing fashion products. Having a wide range of applications is driven by improvements in technology and a wide range of materials available. Of increasing interest are the applications for fashion products in order to improve or add functionalities. Objects are created by laying down on the printing support successive layers of materials extruded from the heated nozzle. Combinations of printing materials with textile fabric can be a great solution to add functionalities to garments or technical textiles. The composite structure created by these combinations may present adhesion problems that are linked with textile properties and 3D printing parameters. Various researchers have studied the influence of these parameters in order to find the optimum value or parameters that result in good adhesion [4,5].
According to Denker et al. [6], 3D printers are widely used devices because they make prototyping easy, but they come with limitations such as the type of material used and the relatively long printing time. The authors point out that the use of fabric as the main material on which to print overcomes some of the limitations of 3D printers. This expands the application of 3D printers in general.
The technology for 3D printing on fabrics was developed by Peng et al. [7]. The authors propose a technology in which the textile fabric is cut with a laser and applied layer by layer until a three-dimensional object is obtained. The method is suitable for the development of touch-sensitive sensing devices applied directly to the textile fabric. The disadvantage of this technology is that it requires complex equipment and long preparation of the 3D CAD model before its physical production.
Effective results with 3D printing on fabrics were reported by Pei et al. [8]. The authors managed to combine polymer with textile fabrics. According to the authors, the advantage of combining the two materials is that the textile fabric is a breathable and deformable material, and the polymer can strengthen its structure. As a result of this study, PLA exhibited the best properties compared to other polymer threads. Tested on eight types of fabrics, the material has good adhesion, low distortion, satisfactory bending strength, and high print quality. Grimmelsmann et al. [4] explored the possibilities of the presented 3D printing technologies as a tool for adding sensors and actuators to textile fabrics and creating smart products. The authors point out that it is necessary for the electronic devices attached by 3D printing to retain the characteristics for the entire planned service life of the textile fabrics. In addition, more research is needed on the combination of textile fabrics and polymeric materials that will ensure the efficient use of electronic devices for smart textiles.
Another interesting application is embroideries created by 3D printing on textile fabric. Three-dimensional printing in the form of embroidery on textile fabrics is proposed by Goudswaard et al. [5]. The authors apply their development as non-retaining buttons for smart textiles. The authors point out that more research is needed to find methods for maintaining flexibility and a design approach to making smart textiles using 3D printing techniques.
One of the important characteristics of fabrics is their drape. A number of methods have been developed to determine it. Methods for obtaining, processing, and analyzing images are suitable for such purposes as obtaining fabric drapes. They are affordable, and they do not require complex equipment and complex computational procedures. They are suitable for application directly on the production line when assessing the condition and quality of textile fabrics with 3D prints on them.
Modifications of the existing method for automated evaluation of drapery characteristics are proposed by Sanad et al. [9]. The authors found that image processing techniques were more effective for weaving drapes in nonwovens than in woolen fabrics.
Capdevila et al. [10], determine the drape characteristics of woolen fabrics with an accuracy of 76%. Using classifiers, the authors reported errors of up to 4% when using data from color digital images to determine the drape of woolen textile fabrics.
A modified method for determining the drape characteristics of digital images is proposed by Ragab et al. [11] by achieving a maximum accuracy of 90% compared with the standard method for determining the drape characteristics.
It has been found that the direct use of data on textile fibers embedded in textile fabrics is not a sufficient source of informative data when predicting the characteristics of draperies. In another work proposed by Pan et al. [12], the accuracy achieved is only 55–84% when using data on the characteristics of textile fibers to predict the drape of textile fabrics on their color digital images.
The characteristics of textile fabrics were used as input data to predict the drape characteristics. Using digital image data, Hussain et al. [13] achieved an accuracy of 76–82% through a modified draping coefficient and degree of bending of the textile fabric.
From the review of the available literature sources, it can be summarized that it is necessary to look for more effective methods for the analysis of images of draperies. The aim is to make them suitable for use in practice. One such method is image histogram analysis [14]. The advantage of histogram analysis is that it is an affordable image analysis method that does not require complex computational procedures and does not require a long time to process the data obtained. In this method, a digital image is divided into multiple segments, sets of pixels, also known as regions of interest in the image. This type of analysis is not sufficiently applied in the analysis of fabric drapes, on their color digital images.
An important practical application of the drape images, which has become necessary in recent years, is their use for three-dimensional visualization and simulation in the analysis of textile fabrics. According to Petrak et al. [15], an important parameter for adjustment in the 3D simulation of garments is the density of the used grid of the polygonal model. By optimally choosing this density, the resulting three-dimensional model will be simple enough and will carry enough information about the condition of the drapery.
Comparative analysis of actually measured drape characteristics and results of three-dimensional simulation was performed by Rudolf et al. [16]. The authors point out that there is no complete correspondence between the obtained 3D model and the real drape. According to them, it is necessary to look for more methods that will lead to sufficient accuracy in the three-dimensional drape simulation. One such solution is the precise determination and importation of characteristics of the fabrics in the simulation software, as indicated by Han et al. [17].
Suitable for determining the fabric drape are methods developed using 3D scanning and stereo video cameras. The disadvantage of these methods is that they are time-consuming and require the use of complex equipment for operation and maintenance, at high cost.
Methods for a more accurate 3D drape suitable for use with CAD systems have been proposed. Efendioglu et al. [18] indicate that 3D scanning, laser scanning, and stereo video cameras are applicable for this purpose. Common disadvantages of these methods are that they require the use of complex technical equipment, require a long time to obtain the three-dimensional shape of the scanned fabric drape, and involve a high cost of technical means used for this purpose.
Ju et al. [19] offer options, using different methods of draping the fabric and three-dimensional scanning. Such draping methods are hanging drape, Cusick’s drapemeter, and modified Cusick’s drapemeter.
Improving the 3D simulations of drapery requires prior knowledge of the composition and properties of the fabric, as well as accurate determination of the drape characteristics of their digital images. When looking for a connection between the type of fibers used in the textile fabric and the drape characteristics, it is necessary to look for appropriate calculation procedures because the direct use of data on the types of fibers in the fabric does not provide sufficient accuracy.
From the review of the available literature sources related to obtaining a three-dimensional shape of the fabric drape, it can be concluded that the existing approaches cannot provide sufficient accuracy of the obtained results. There are also insufficiently defined criteria for an objective assessment of the resulting drape from different types of fabrics.
The Cusick’s drape method is suitable for creating three-dimensional shapes of fabric drapes on their two-dimensional visual images. Creating an algorithm through which it is possible to reproduce 3D drapery is suitable. The main research on the automation of this method aims to determine the drape parameters on 2D images. Insufficient research has been found in the available literature related to the reproduction of a three-dimensional shape from two-dimensional images obtained by this method. Reproduction of 3D shapes of fabric drapes obtained from 2D images is possible because the conditions under which the images were obtained, the location of the object in space, and the physical dimensions of the object are known in advance.
The aim of the present work is to review the possibilities, limitations, and evaluation of fabric drape with 3D printed geometries through comparative analyses and application of methods for image processing and analysis.
The main contributions that can be defined are as follows:
- A comparative analysis was performed on the use of histograms of images as a criterion for assessing changes in textile fabrics with and without printed 3D elements on them.
- An algorithm is proposed that realizes the basic principles for obtaining a 3D shape of fabric drape based on its 2D images. The algorithm is supplemented with basic functions to estimate the changes in the fabric drape after 3D printing geometries.
- A comparative analysis is performed between the results obtained with the proposed algorithm and a standard drape tester. It was found that the proposed algorithm can be used to determine the characteristics of a fabric drape with printed 3D geometries with sufficient accuracy.
The article is organized in the following order: After the literature review and definition of the main problems and limitations related to the analysis of fabric drapes with 3D printed geometries, color digital images describe the materials and methods used to solve some of these problems. Textile fabrics, 3D printing materials, and methodology for image analysis of histograms are described. The main criteria for evaluating the changes on fabric drapes after printing 3D geometries are presented. The results of comparative analyses related to the determination of the drape coefficient by a standard method and by image analysis of histograms are reported. Finally, a discussion is presented in which the results obtained are compared with those of the available literature, and the content of the present work is summarized as conclusions.
2. Materials and Methods
2.1. Preparation of 3D Printing on Textile Fabric
Three-dimensional printing on textile fabric is realized using an Orcabot XXL (Prodim International B. V., Helmond, The Netherlands) fused deposition modeling (FDM) printer, which is equipped with the slicing software Orcabot Repetier Host V1.0.6 (Prodim International B. V., Helmond, The Netherlands).
Table 1 presents the main 3D printing parameters used for 3D printing for poly (lactic acid) (PLA).

Table 1.
The 3D printing parameters.
The textile fabric chosen for 3D printing was 100% linen. Linen is a flax-based textile and is naturally hydrophilic like other textiles produced from natural fibers. The main fabric parameters presented are presented in Table 2. This property applied as a hydrophilic finish acts as a penetration and adhesion promoter [20]. Moreover, tests conducted on various textile fabrics confirm that adhesion is higher even in pure 100% linen textile [21].
Table 2.
Fabric parameters.
Various geometries such as triangles, pyramids, hexagons, and circles were 3D printed on textile fabrics and arranged in different ways on the circular sample. The selection of 3D printed geometries is arbitrary. This is necessary to give a broad overview of different possibilities of how fabric drapes are influenced by 3D printed patterns. It is well known that the use of plastic materials as 3D printed geometries in our case will increase the mass of these composite structures by influencing the drape coefficient. However, through these tests, we want to present a way to change a fabric drape with a low value of fabric masses due to 3D printed structures with very low heights. Of course, to make a comparison of the effects of printed geometries on fabric drape with almost unchanged masses of textiles, fabric drape is first measured without printing on it and then measured with 3D printed geometries. Tests are conducted with diverse 3D printed patterns, using a drape tester built according to EN ISO 9073-9 [22]. Tinker CAD from Autodesk (Autodesk, Inc., San Francisco, CA, USA) was used for modeling, and 3D models were exported as *.stl files by following their preparation for the 3D printing process using the “OrcabotRepetier-Host V1.0.6” slicing software.
2.2. Image Histogram Analysis
The sample image was transferred to the PC through a mobile phone. Photographs of the partly shaded areas were taken and processed using Matlab 2017b software (The Mathworks Inc., Natick, MA, USA). A sample graph is shown in Figure 1. The image histogram might be used for comparing two histograms from images that have different numbers of pixels. In addition, the range of change of these pixels is important too. The process of obtaining the image histogram of Sample 5 (hexagonal geometry arranged as “Y”) is presented.
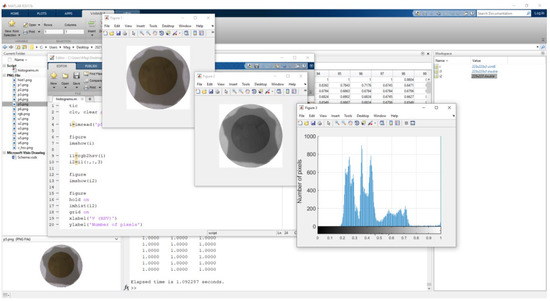
Figure 1.
Image processing in Matlab environment.
Figure 2 shows the principle of obtaining a fabric drape histogram. The original RGB image is converted to HSV. The data of the converted image are in “double” format. Of the three components of HSV, the V-component represents the regions of interest in the image. These regions are: support disk, drape and paper ring. These regions are indicated on the histogram of the V-component, which changes in the interval [0, 1]. The thresholds for the separation of the three object areas in the histogram, denoted as T1 and T2, respectively, are also shown.
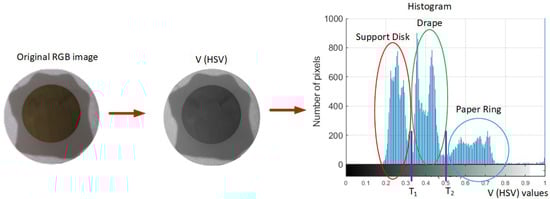
Figure 2.
Obtaining histogram of drape image.
One of the main tasks in histogram analysis is to determine the threshold at which object areas differ on the histogram. Figure 3 shows the basic principle corresponding to the histograms used in this work with three object areas.
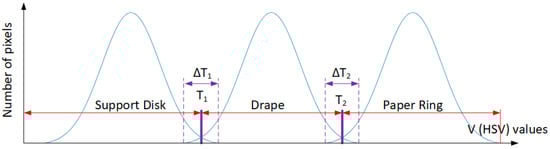
Figure 3.
Determination of threshold values.
The main error ΔT, which occurs when determining the threshold between the object areas in the histogram, is due to their overlap.
A basic algorithm for determining the global threshold was used to determine the value of “T” [23]. Implemented in Matlab environment, the algorithm has the following form:
count = 0;
T = mean2(f); %Mean of matrix elements
ready = false;
while (-ready)
end
The presented text is colored is according to the formatting in the Matlab environment. Since the values of the V (HSV) component change in the interval [0, 1], it is not necessary to normalize the calculated value of the threshold T. The conditions for obtaining drape images are relatively the same. The lighting of the shot scene is homogeneous. As a result of the calculations with this algorithm, the error ΔT is less than 10%, as there is a relatively good separability of object areas. This makes the analysis acceptable for practical purposes. The histogram analysis is also used to determine the drape coefficient dependences.
2.3. Main Calculations for Development of an Algorithm for Determining Drape Parameters and 3D Form Simulation
Part of this work was the comparison of data generated by the use of an algorithm for determining drape parameters and 3D form representation by color digital images. In the last stage of algorithm implementation, the mathematical formulas presented by Sanad et al. [9] and Alikhanov et al. [14] are used. Using these equations, the drape coefficient and the coefficients of form, eccentricity, and minimum rectangle are calculated.
The drape coefficient (DC) is a coefficient for determining the drape ability of the fabric.
Where Asd is the area of the supporting disk (fs—fabric shadow), Ao is the area of the circle around the drape, and Afs is the drape area.
The coefficient of the form (K) represents the relationship between the drape contours and dimensions.
where Afs is the drape area and Pfs is the perimeter of the drape.
The eccentricity (E) shows how the drape contour differs from an ideal circle.
where dfs is the small diameter of the drape and Dfs is the large diameter of the drape.
The coefficient of the minimum rectangle (AR) shows how close the drape contour is to the minimum rectangle that describes it.
where Amr is the area of the minimum rectangle described around the drape and Afs is the drape area.
The ANOVA method was applied to assess the statistical difference between groups of samples, using the Statistica 12 software (TIBCO Software Inc., Palo Alto, CA, USA).
The proposed algorithm was compared with the standard drape test method. For this purpose, the correlation method was used. Using this method, the strength of the relationship (connection) between two measurement methods is checked. The distribution of the data was checked using the following methods: Shapiro–Wilks test, Kolmogorov–Smirnov test, and Lilliefors test. As a criterion for evaluation, a correlation coefficient R was used. At R < 0.3, there is very weak connection between the data; at 0.3 < R < 0.5, the connection is weak; at 0.5 < R < 0.7, the connection is moderate; and for R > 0.7, the connection is strong.
All data were processed at a level of significance α = 0.05.
The next part of the algorithm was used to visualize the 3D shape of the fabric drape based on data obtained from the digital image, according to the standard ISO 9073-9; Figure 4 shows how to determine the drape parameters in order to restore its 3D shape. The method corresponds to that presented in Efendioglu et al. [18]. The most important drape parameters that participate in determining its three-dimensional contour are as follows: radius of the work-piece (ε); support disk radius (ξ); the distance from each point of the outer contour of the drape to the support disk (λ); the height of the draped fabric at each reading point of the drape (d). Hence, the inclined distance (ε-ξ) for each point of the drape contour is determined.
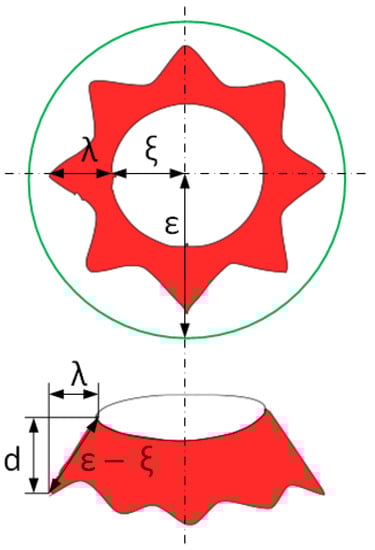
Figure 4.
Determining the 3D shape of the drape.
3. Results
3.1. Obtaining Drapes with 3D Prints
One of the samples with 3D printed objects, still placed on the printing bed, is depicted in Figure 5. Due to the sufficiently large printing bed, it was possible to print the whole pattern in one printing session.
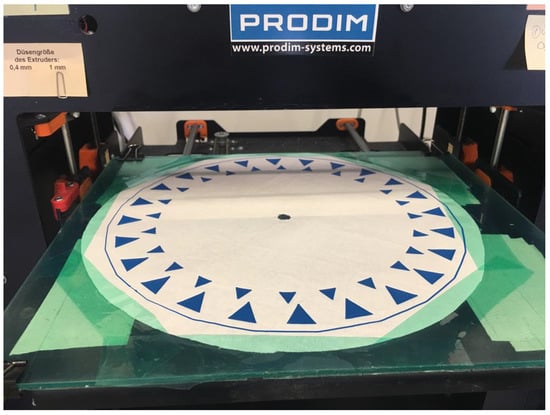
Figure 5.
The 3D printing geometry on textile fabric—general view.
Drape tests of pure textile fabric and fabric with 3D printed geometries show differences in textile fabric given by the shaded areas. The types of single object geometry, their numbers, and their positions on the sample modify the drape of the textile fabric. Figure 6 presents textile samples with 3D printed geometries and the drape profiles of textile samples before and after 3D printing different geometries on them.
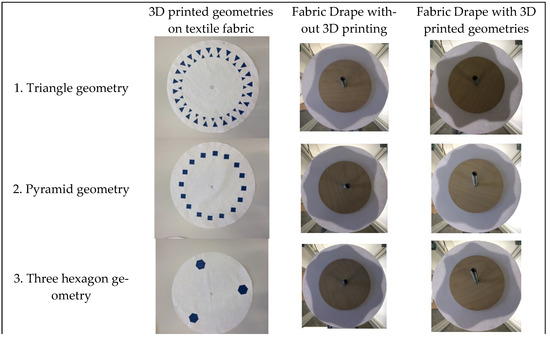
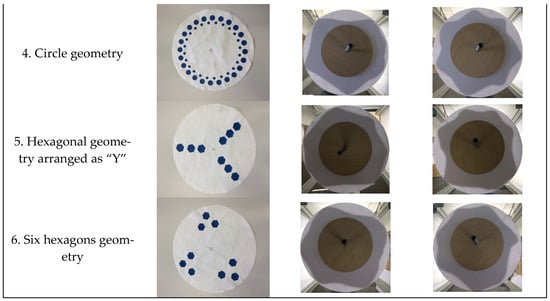
Figure 6.
Drape of textile fabrics before (left images) and after 3D printing different geometries on them (right images).
3.2. Results from Histogram Analysis
The histograms taken for each sample before and after 3D printing geometries are presented in a graph. Figure 7 shows an example of histograms of the same fabrics, one without prints and the other with 3D prints. This figure is only an example to show what the histogram of one drape looks like. In this case, drapes with the number 5 hexagonal geometry are arranged as a “Y”. It can be seen that in the pure fabric, the histogram becomes more compact and the areas of interest are closer to each other. After the implementation of 3D prints, the regions of interest are wider, but the threshold between different regions in the histogram can be defined with lower error rates, because there is less overlap, between different regions on the histogram. The same tendency was found for other fabrics with and without 3D printing.
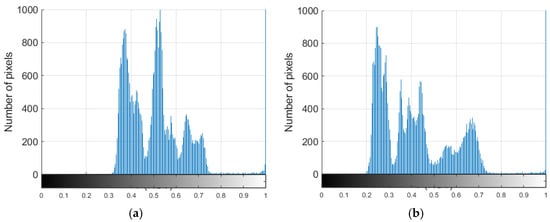
Figure 7.
An example of image histograms of drapes. (a) Fabric drape without 3D printing; (b) fabric drape with 3D printed geometries.
Figure 8 shows the results of determining the maximum number of pixels of the region in the histogram in which the drapery is. This figure represents summarized data for all of the analyzed fabrics: with and without 3D printed geometries with their mean and standard deviation of the number of pixels and range of V (HSV) component for every region of interest in the drape images. It can be seen that the maximum number of pixels is higher for textiles without printing than for those with 3D prints. Conversely, in non-printed textile fabrics, the range of the V-component on which the histograms are made is wider than that in the draperies of 3D printed textile fabrics. In both types of textile fabrics, the highest number of pixels in the histogram of the drapery is observed in hexagonal geometries arranged as “Y” and six-hexagon geometries, and the lowest is observed in those with three-hexagon geometries and circle geometries. The widest ranges of the V-component with a drapery region are observed in the last two mentioned variants, both in the printed and in the unprinted textile fabrics.
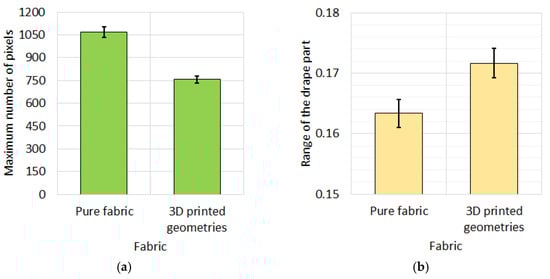
Figure 8.
Amendment of the 3D prints on the image histograms of drapes. (a) Maximum number of pixels of the drape region in the histogram; (b) dimension of the range of V (HSV) component of drape region in the histogram. The values are significantly different at p < 0.05.
The presented results from the analysis of image histograms correspond to the changes in the values measured with a standard drape meter. Drape coefficients tested for pure textile fabric and fabric with 3D printed geometries are depicted in Table 3 below. The results show that there is a slight reduction of up to 4% in the drape coefficient after 3D printing is applied to the fabric. The biggest differences are in fabrics with circles and three-hexagon geometries. Pyramidal elements have the least influence on the draping of textile fabrics.
Table 3.
The 3D printing drape parameters (DC, %).
Figure 9 shows the histograms of drape coefficients. The drape coefficient of the textile with 3D printed geometries is lower compared with the pure textile fabric, thus showing a positive effect of 3D printing on the drape coefficient. However, when analyzing the shape and number of nodes, it can be seen that the last one is less influenced by the imprinted 3D patterns [24]. All the 3D printed patterns show a significant effect on the fabric drape. This effect is explained by the number of 3D printed patterns, their positioning on the specimen, and their shape and size, as their height is the same for all geometries.
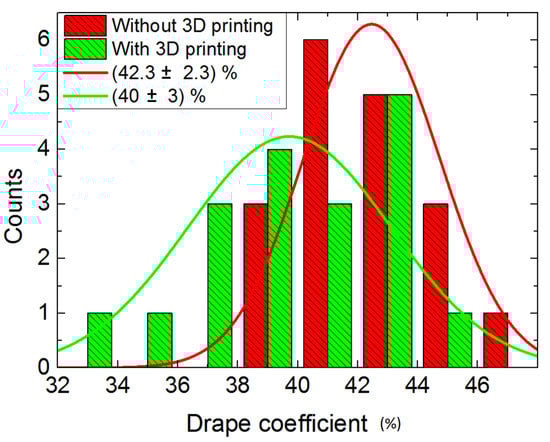
Figure 9.
Drape coefficients without and with 3D printed geometries. The values are significantly different at p < 0.05.
3.3. An Algorithm for Determining Drape Parameters and 3D Form Representation by Color Digital Images
The proposed algorithm for determining drape parameters and 3D form representation by color digital images has steps that include not only the 3D representation of the drape, but also some calculations that describe the changes in the fabric when the drape is formed.
Each RGB image of fabric drape without or with 3D printed geometries is converted to HSV, and only the V-component is used. Contour noise is filtered out, and the contour area is compacted. The contour of the object areas is determined and drawn, including the supporting disk, drape contour, and the paper ring. The histogram of the image determines the object areas of the support disc, the drape contour, and the background. Moreover, the fold number is determined, which is an indicator of the flexibility of the textile fabric. For this purpose, a radius-vector function is used. In the last stage of algorithm implementation, mathematical formulas are used to calculate the drape parameters.
Figure 10 shows the results of the work from the proposed algorithms for determining the drape characteristics and simulating their 3D appearance through visualization. It can be seen that the obtained three-dimensional models are visually similar to those of digital images.
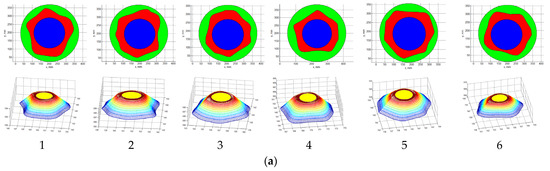
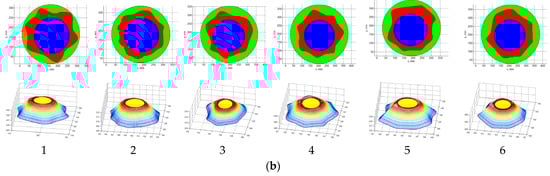
Figure 10.
The 3D representation of the drape. (a) Without printing; (b) with 3D printed geometries. Description: Red, Drape; Green, Paper disk; Blue, Supporting disk. The color changes of 3D variants are according to the height of the drape.
Table 4 shows the results from the drape analysis with the proposed algorithm. For textiles with 3D prints, the number of folds (N) increases. There is an increase in the draping coefficient (DC) in the samples with 3D printed elements. For samples with 3D elements, the distance coefficient (RD) increases, while for fabrics without prints, it remains close to constant values. The same tendency is shown by the roundness factor (C) and the minimum rectangle factor (AR). The form factor (K) decreases for fabrics with 3D printing, while for those without print, it remains close and constant. Printing 3D elements does not affect the eccentricity (E). It has the same values for both types of textiles.
Table 4.
Characteristics of draperies determined by the proposed algorithm.
Figure 11 shows the results for the number of peaks. The highest number of peaks is observed in Sample 2 with 3D prints. The lowest number is in samples with circle geometry and six-hexagon geometry. When observing the average values of the number of peaks, it is clear that those with 3D prints have a higher number of peaks compared to the pure fabric.
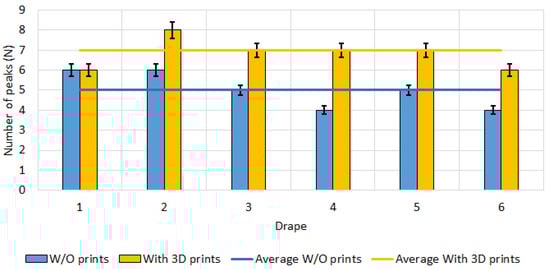
Figure 11.
Comparison between obtained number of peaks for drapes with and without 3D printing (N). The values are significantly different at p < 0.05.
Figure 12 shows changes in RD, according to the type of fabric with and without 3D prints. It can be seen that the application of 3D prints reduces the flexibility of the fabric. It is lowest in samples with tightly spaced prints. The fabric with hexagonal geometry arranged as “Y” has higher values of RD, and the fabrics with triangle geometry prints have lower values of RD.
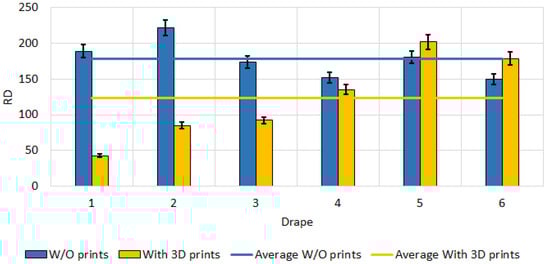
Figure 12.
Changes in RD. The values are significantly different at p < 0.05.
Figure 13 shows changes in the coefficient of form (K), according to the type of textile with and without 3D prints. Adding 3D printed elements increases the values of the aspect ratio. The highest values of this coefficient are observed in samples with triangle geometry and circle geometry, which have more closely spaced elements compared to the other samples. The lowest values are exhibited by the sample with three-hexagon geometry. That geometry does not affect the coefficient of form, in comparison with other geometries.
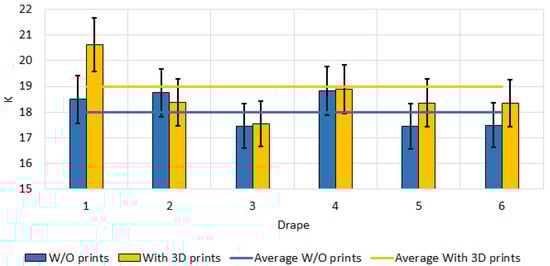
Figure 13.
Changes in coefficient of form K. The values are significantly different at p < 0.05.
Table 5 shows the results of a comparative analysis of the drape coefficient determined with a laboratory drape meter and the algorithm proposed here. It can be seen that the measured values are close, with minimal difference. This can be proved by the obtained strong correlation coefficient (R = 0.7).
Table 5.
Comparative analysis of drape coefficient (DC, %) measurement methods.
4. Discussion
In the present work, the results indicated in the available literature are supplemented, updated, and partially improved. Three-dimensional printing technologies have been proven to be an effective method for improving the appearance and properties of textile fabrics. This complements the summaries of Denker et al. [6], according to which the use of fabric as the main material on which to print overcomes some of the limitations of 3D printers.
In this paper, a clear and objective assessment of the properties of the obtained textile fabrics with 3D printing is proposed. The results of Capdevila et al. [10] depict that an accuracy of 76% was achieved in the analysis of draperies of woolen fabrics. In the present work, a close accuracy of 70% has been achieved in the analysis of textile linen fabrics. Compared to the standard method, the errors are of the order of 4%. In addition, in the present work, the data for fabrics are enriched with 3D elements printed on them.
The results obtained here complement those of Hussain et al. [13]. By using histograms of images, an accuracy of over 80% was achieved compared to the standard method for determining drape characteristics, close to that of the presented authors. An accuracy higher than this was achieved by Ragab et al. [11], who reported a maximum accuracy of 90%.
Sanad et al. [9] found that image processing techniques are more effective for weaving draperies in nonwovens than in woolen fabrics. This is complemented in the present work by methods for analyzing histograms of images, as well as an algorithm for obtaining three-dimensional shapes from two-dimensional images, with added features to assess the basic drape characteristics.
The methods proposed here for obtaining the 3D shape of drapes from their 2D images are suitable for use with 3D CAD systems. This complements the findings of Efendioglu et al. [18], who showed that 3D scanning, laser scanning, and stereo video cameras are applicable for this purpose. The use of color digital images removes the limitations of these methods, which require the use of complex technical equipment and a long time to obtain the three-dimensional shape of the scanned fabric drape. The use of digital images does not require complex and expensive equipment or complex computational procedures for processing the data obtained.
The results of the present work fulfill one of the recommendations of Rudolf et al. [16], which indicates that it is necessary to look for more methods that will lead to sufficient accuracy in the three-dimensional simulation of fabric drape. The algorithm proposed in this paper for obtaining a 3D shape of the fabric drape implements the recommendation.
The following research will be related to removing the limitations of the algorithm proposed here. More research is needed to assess the impact of factors influencing textile drape. This will improve the accuracy of the laziness obtained by removing the limitations of the algorithm proposed here.
5. Conclusions
The drape is an important property for garment appearance and is considered by pattern makers for garment design and production. Effects of design or seams are studied by different authors to modify garment drapes. With the application of innovative technologies such as 3D printing, we have tested the effect of 3D printing various geometries according to number, shape, and positioning or arrangement on linen fabric. Drape coefficients measured on pure fabric and fabric with 3D printed patterns depict another way to modify fabric drape and create complex shapes by using less material compared to the traditional manufacturing methods, which is seen as an advantage in the fashion industry.
A comparative analysis of the use of image histograms as a criterion for assessing changes in textile fabrics with and without printed 3D elements on them was conducted. It was found that in the textile fabrics without printed 3D elements, the region of interest in the histogram has a smaller range and more pixels compared to the textile fabrics on which 3D elements are printed. The results were confirmed by the measurement with a standard drape tester. In this analysis, higher values of the draping coefficient were obtained for fabrics without 3D elements than for those without such elements. The difference in the drape coefficient is up to 4% for both types of fabrics.
An algorithm is proposed that implements the basic principles for obtaining a 3D shape of a drape based on its 2D images. The algorithm is supplemented with basic functions for estimating the changes in fabric drape after printing 3D elements on it. Compared to the standard drape tester, the proposed algorithm offers 70% accuracy in determining the drape characteristics of fabrics with 3D printed shapes on them.
From the comparative analysis of the results obtained in the present work with those indicated in the available literature, it was found that the data from the available literature have been updated, improved, and supplemented. Software and hardware are offered, through which the characteristics of fabric drape with and without 3D printed elements can be determined in an accessible and objective way. These instruments can be used for these purposes, ensuring sufficient accuracy of measurements.
The achieved accuracy is sufficient for the application of the algorithm for practical purposes, in determining the drape characteristics and their 3D reproduction from their two-dimensional color digital images.
The methods and technical means proposed in the present work can be used in the analysis of fabrics from which to produce garments, curtains, upholstery, etc.
Author Contributions
Conceptualization, T.S. and Z.Z.; methodology, T.S.; algorithm, Z.Z.; validation, E.I., E.S. and J.I.; formal analysis, E.S.; investigation, Z.Z., J.I., E.S. and E.I.; resources, T.S., E.S., E.I. and Z.Z.; data curation, T.S.; writing—original draft preparation, T.S. and Z.Z.; writing—review and editing, T.S.; visualization, Z.Z. and T.S.; supervision, T.S.; project administration, T.S.; funding acquisition, Z.Z. and J.I. All authors have read and agreed to the published version of the manuscript.
Funding
This research received no external funding.
Institutional Review Board Statement
Not applicable.
Informed Consent Statement
Not applicable.
Data Availability Statement
The data will be available on request.
Acknowledgments
The authors would like to thank Andrea Ehrmann for the support during the work in the framework of Students Erasmus + mobility between the Polytechnic University of Tirana and Fachhochschule Bielefeld University of Applied Sciences in Germany.
Conflicts of Interest
The authors declare no conflict of interest.
References
- Beltrami, M.; Orzes, G.; Sarkis, J.; Sartor, M. Industry 4.0 and sustainability: Towards conceptualization and theory. J. Clean. Prod. 2021, 312, 12773. [Google Scholar] [CrossRef]
- Ahmad, S.; Miskon, S.; Alabdan, R.; Tlili, I. Towards Sustainable Textile and Apparel Industry: Exploring the Role of Business Intelligence Systems in the Era of Industry 4.0. Sustainability 2020, 12, 2632. [Google Scholar] [CrossRef]
- Madsen, D. The Emergence and Rise of Industry 4.0 Viewed through the Lens of Management Fashion Theory. Adm. Sci. 2019, 9, 71. [Google Scholar] [CrossRef]
- Grimmelsmann, N.; Martens, Y.; Schäl, P.; Meissner, H.; Ehrmann, A. Mechanical and electrical contacting of electronic components on textiles by 3D printing. Procedia Technol. 2016, 26, 66–71. [Google Scholar] [CrossRef]
- Goudswaard, M.; Abraham, A.; Goveia da Rocha, B.; Andersen, K.; Liang, R.-H. FabriClick: Interweaving pushbuttons into fabrics using 3D printing and digital embroidery. In Proceedings of the Crafting Textiles, DIS ’20, Eindhoven, The Netherlands, 6–10 July 2020; pp. 379–393. [Google Scholar]
- Denker, M.; Diec, D.; Saglam, M. Possibilities of Fabric Embeds in 3D Printing. 2021. Available online: https://merlindenker.de/files/Fabric_Embeds_in_3D_Printing.pdf (accessed on 23 June 2022).
- Peng, H.; Mankoff, J.; Hudson, S.; McCann, J. A Layered Fabric 3D Printer for Soft Interactive Objects. In Proceedings of the 33rd Annual ACM Conference on Human Factors in Computing Systems (CHI ’15), Seoul, Korea, 18 April 2015; Association for Computing Machinery: New York, NY, USA, 2015; pp. 1789–1798. [Google Scholar] [CrossRef]
- Pei, E.; Shen, J.; Watling, J. Direct 3D printing of polymers onto textiles: Experimental studies and applications. Rapid Prototyp. J. 2015, 21, 556–571. [Google Scholar] [CrossRef]
- Sanad, P.; Cassidy, T.; Cheung, T.; Evans, E. Fabric and garment drape measurement—Part 2. J. Fiber Bioeng. Inform. 2013, 6, 1–22. [Google Scholar] [CrossRef]
- Capdevila, X.; Carrera-Gallissà, E. Application of discriminant analysis to parameters describing the drape for two types of woven fabrics. J. Text. Inst. 2015, 107, 784–790. [Google Scholar] [CrossRef]
- Ragab, A.; Fouda, A.; El-Deeb, H.; Hemdan, A. A simple method for measuring fabric drape using digital image processing. J. Text. Sci. Eng. 2017, 7, 1000320. [Google Scholar]
- Pan, N.; Lin, C.; Xu, J. A new method for measuring fabric drape with a novel parameter for classifying fabrics. Fibers 2019, 7, 70. [Google Scholar] [CrossRef]
- Hussain, A.; Xin, W.; Naveed, T.; Waqar, I.; Iqbal, D.; Zhong, Y.; Yu, Z. Optimization of fabric drape measurement based on 3D model. Industriatextila 2019, 70, 318–323. [Google Scholar] [CrossRef]
- Alikhanov, J.; Penchev, S.; Georgieva, T.; Moldazhanov, A.; Shynybay, Z.; Daskalov, P. An indirect approach for egg weight sorting using image processing. Food Meas. Charact. 2017, 12, 87–93. [Google Scholar] [CrossRef]
- Petrak, S.; Naglic, M.; Rogale, D.; Geršak, J. Analysis of polygonal computer model parameters and influence on fabric drape simulation. Materials 2021, 14, 6259. [Google Scholar] [CrossRef] [PubMed]
- Rudolf, A.; Zadravec, M.; Stjepanović, Z. Investigations regarding the effects of simulating parameters during 3D garments’ drape simulations. Fibres Text. East. Eur. 2016, 24, 143–150. [Google Scholar] [CrossRef][Green Version]
- Han, M.-G.; Chang, S.-H. Draping simulation of carbon/epoxy plain weave fabrics with non-orthogonal constitutive model and material behavior analysis of the cured structure. Composites Part A. Appl. Sci. Manuf. 2018, 110, 172–182. [Google Scholar] [CrossRef]
- Efendioglu, N.; Mutlu, M.; Pamuk, O. An investigation on usability of 3D visualization and simulation programs in leather apparel. J. Text. Inst. 2021, 112, 1–16. [Google Scholar] [CrossRef]
- Ju, E.; Choi, M. Estimating cloth simulation parameters from a static drape using neural networks. IEEE Access 2020, 8, 195113–195121. [Google Scholar] [CrossRef]
- Korger, M.; Bergschneider, J.; Lutsz, M.; Mahltig, B.; Finsterbusch, K.; Rabe, M. Possi ble Applications of 3D Printing Technology on Textile Substrates. IOP Conf. Ser. Mater. Sci. Eng. 2016, 141, 012011. [Google Scholar] [CrossRef]
- Meyer, P.; Döpke, D.; Ehrmann, A. Improving adhesion of three-dimensional printed objects on textile fabrics by polymer coating. J. Eng. Fibers Fabr. 2019, 14, 1–7. [Google Scholar] [CrossRef]
- Kramer, L. SFAE. Construction of an inexpensive dreapeometer. In Proceedings of the International Textile Conference 2016, Bangalore, India, 22 January 2016. [Google Scholar]
- Mladenov, M.; Penchev, S.; Dejanov, M.; Mustafa, M. Automatic classification of grain sample elements based on color and shape properties. Sci. Bull. Ser. C Univ. Politech. Bucharest 2011, 73, 39–54. [Google Scholar]
- Spahiu, T.; Fafenrot, S.; Grimmelsmann, N.; Piperi, E.; Shehi, E.A. Varying fabric drape by 3D-imprinted patterns for garment design. IOP Conf. Ser.: Mater. Sci. Eng. 2017, 254, 172023. [Google Scholar] [CrossRef]


Publisher’s Note: MDPI stays neutral with regard to jurisdictional claims in published maps and institutional affiliations. |
© 2022 by the authors. Licensee MDPI, Basel, Switzerland. This article is an open access article distributed under the terms and conditions of the Creative Commons Attribution (CC BY) license (https://creativecommons.org/licenses/by/4.0/).