Abstract
The manufacturing industry has witnessed rapid changes, including unpredictable product demand, diverse customer requirements, and increased pressure to launch new products. To deal with such changes, the reconfigurable manufacturing system has been proposed as one of the advanced manufacturing systems that is close to the realisation of smart manufacturing since it is able to reconfigure its hardware, software, and system structures in a much quicker manner. Conventional simulation technologies lack convergence with physical manufacturing systems, and reconfigurable manufacturing lines require the manual construction of production line models for each reconfiguration. This study presents a digital twin-based integrated reconfiguration assessment application that synchronises with real-time manufacturing data and provides accurate, automated simulation functionality to build and analyse a manufacturing system. The paper discusses the architectural design and implementation of the application, an information model, and an assessment model that enable quantitatively assessment on reconfigurations of manufacturing systems from various aspects. The effectiveness of the proposed application is verified via application to an automotive parts production line to assess the reconfiguration indicators of the manufacturing system under different scenarios. The results reveal that the proposed application provides faster and more accurate reconfiguration assessments compared to existing methods. The findings of this study are expected to facilitate accurate and consistent decision making for evaluating the various indicators of production line performance.
1. Introduction
With the advent of globalisation, the manufacturing industry has started facing dynamic market changes, such as unpredictable product demand, shortened product lifecycle, and increased demand for customised products [1,2]. Uncertainty in the market is expected to increase, leading to a decrease in the lifecycle of products and manufacturing technology, and an increase in competition among manufacturing companies [3]. In line with the above-mentioned changes in the manufacturing paradigm, several approaches and attempts have been made in various fields to improve the manufacturing system [1]. The existing dedicated manufacturing system (DMS) for mass production can produce a single product cost-effectively with the required quality [4]. The flexible manufacturing system (FMS) focuses on the production of multiple products in a product family, facilitated by the production of various products in one manufacturing system. However, the FMS, which is not designed for structural change, cannot respond to sudden changes such as variations in demand, flexible batches, and machine failures [4,5]. Koren et al. proposed a reconfigurable manufacturing system (RMS) “designed at the outset for rapid change in structure, as well as in hardware and software components to quickly adjust production capacity and functionality within a part family in response to sudden changes in market or in regulatory requirements” to overcome the limitations of the existing manufacturing systems [6].
The 21st century has been witnessing manufacturing innovation in many countries, starting with the rapid development of information and communication technologies (ICT) in various fields and “Industrie 4.0” proposed by Germany in 2011 [7,8,9]. Smart manufacturing, which is a new paradigm in the manufacturing industry since the fourth industrial revolution, includes a set of innovative technologies that support effective and accurate decision making in real time through the introduction of various ICT technologies and convergence with the existing manufacturing industry [8]. Although there is no clear definition of smart manufacturing, it can be defined as “a fully integrated and collaborative manufacturing system that responds in real time to meet the changing demands and conditions in the factory, supply network, and customer requirements”. Thus, smart manufacturing includes technologies and systems that can respond to internal and external changes in real time, which make it possible to build a lighter and more flexible production system compared to conventional manufacturing systems [7,10,11]. RMS belongs to the category of smart manufacturing; these systems are part of the fourth industrial revolution environment and can contribute to smart manufacturing implementation [12]. Qin et al. reported that the current manufacturing industry did not comprehensively achieve the Industrie 4.0 level; despite the gap between the current manufacturing and smart manufacturing, FMS and RMS were assessed as systems closest to Industrie 4.0. [13,14]. Koren et al. claimed that the use of the core technologies of smart manufacturing would enable real-time operational decision making within RMS [1]. However, the manufacturing system has a very complex structure; in particular, there are several alternatives for configuring the reconfigurable manufacturing line (RML). For example, the number of possible configurations of an RML comprising 10 machines is more than 500 [15]. Although many studies on the definition of RMS and the selection of configuration alternatives for manufacturing lines have been conducted [1,12], there remains a lack of research on how to assess the performance of a line quantitatively while considering various factors to support decision making when reconfiguring a line. Due to the complexity in the evaluation of the RMS, it is necessary to incorporate an assessment model that enables quantitative evaluation on the effectiveness of the RMS with considerations on various aspects of manufacturing system.
Simulation technologies are important tools for analysing complex manufacturing systems [16,17,18]. In terms of manufacturing, simulation focuses on modelling manufacturing organisations, behaviours, and processes in virtual models that can be used from the shop floor to the supply chain levels for as-is and to-be manufacturing and support operations, assessment of manufacturing resource allocation and scheduling alternatives, and continuous improvement of manufacturing operations through performance prediction benchmark comparison [19]. To build a smart manufacturing system, only simulations expressed in detail down to the component level that can analyse, optimise, and verify the system must be considered [17]. However, in a situation in which the focus is primarily on physical products rather than virtual models with convergence with the physical model, it is difficult to solve these problems with simple simulation technology [18]. Digital twin (DT) technology is gaining popularity as a potential solution to this problem [16,17,18,20]. In an environment wherein manufacturing site data are collected through communication networks, such as the industrial internet of things (IIoT) and various sensors, each physical device can be expressed as a virtual representation defined by a DT. With simulation as a core technical functionality, the DT can help derive performance indicators for various production control techniques [21,22]. Therefore, the application of DT technology to the production system allows the analysis, evaluation, optimisation, and prediction of the current scenario by synchronising manufacturing site information and functions in real time, enabling dynamic prediction unlike the existing simulation models [16,23]. For the RMS, in which the production line is frequently reconfigured, the benefits of utilising DT-based simulation over the existing simulation must be clarified.
Accordingly, this research proposes a DT-based application that can quantitatively assess various aspects of reconfiguration for the RMS. This proposed application is designed to achieve responsiveness to rapid market changes during the planning and operation stages for manufacturing systems. DT simulation, which is an advanced concept of existing simulation, was applied to predict and assess various performances of the production line. Compared with existing simulation methods, this method can build and run the simulation model faster and more accurately. To verify the proposed application, the aims of this study were to:
- Define the concept and purpose of DT-based integrated reconfiguration assessment application for RMS;
- Describe the architectural framework and detailed definitions to satisfy the purpose of the proposed application;
- Design the technical functionalities and operational procedures of the DT module;
- Propose an information model appropriate for RMS to operate the DT-based simulation and reconfiguration assessment;
- Present the quantitative assessment criteria, assessment elements, and assessment methods for various performances of the production line belonging to the RMS;
- Apply the proposed application to an actual automotive part production line to verify its effectiveness.
2. Research Background
2.1. Reconfigurable Manufacturing System (RMS)
In 1999, Koren et al. proposed the RMS, an open system architecture that quickly and economically responds to unpredictable market changes, such as rapidly changing product demands and shortened product lifecycles [1,6]. By the end of the 20th century, to gain a competitive edge in the global market, manufacturing companies aimed at establishing a manufacturing system that could achieve three goals: low-cost production, high product quality, and a rapid and cost-effective response to market changes [3]. Owing to the rapid development of ICT and the increasingly diverse and complex customer requirements in the 21st century, the new goal is to gain competitiveness in ever-changing and challenging markets by producing new products in the existing manufacturing systems [3,7,8,9]. To meet this goal, a production line of the RMS should have the following six key characteristics to ensure responsiveness while reducing reconfiguration time [1,3,6].
- Scalability: Capability to modify production capacity by adding or removing resources and/or changing system components;
- Convertibility: Capability to transform the functionality of the existing systems and machines to fit new production requirements;
- Diagnosability: Capability to monitor product quality in real time and perform rapid diagnoses of the root-causes of product defects;
- Customisation: System or machine flexibility around a part family; that is, obtain customised flexibility within the part family;
- Modularity: Compartmentalisation of operational functions into units that can be manipulated between alternative production schemes;
- Integrability: Capability of integrating modules rapidly and precisely by hardware and software interfaces.
These key characteristics improve system responsiveness by minimising the time and cost of reconfiguration in the manufacturing line, and research on its technological applications is currently being conducted in many industries [1,12]. Construction of such a system that combines the advantages of the traditional manufacturing systems ensures high flexibility and productivity. Table 1 compares the DMS, FMS, and RMS [12]. The FMS expands product range, whereas the RMS rapidly responds to various requirements and changing circumstances; this means that the focus is more on customised flexibility than on production flexibility [7,13,24]. Accordingly, the RMS can quickly bring the required quantity to the market in a timely manner despite the rapidly changing manufacturing paradigm and goals of the existing manufacturing systems; further, it can help save cost and time compared to the existing manufacturing system and improve product quality based on the in-line inspection technology.

Table 1.
Comparison among the features of DMS, FMS, and RMS; Adapted with permission from [12], 2018, Elsevier.
2.2. Digital Twin (DT)
The concept of DT was first introduced by Grieves in 2003 and it has been continuously developed since then. It can be defined as an integrated virtual model of information objects and functional units based on the configuration of heterogeneous physical elements [25,26,27,28]. The DT is an advanced concept and compared with existing simulation models, the DT model has the following advanced features [18,26,29,30,31,32,33]:
- Automatic model creation with predefined configurational and functional units;
- Reflection of the production site information onto the model by convergence with ICT and information synchronisation;
- Advanced processing with an optimisation algorithm or plan generation based on horizontal coordination with engineering applications;
- Repeated derivation of indicators for dynamic prediction and diagnosis reflecting various situations.
Efficient operation can be achieved through overall product lifecycle management (PLM) from product design to manufacturing and service by applying a DT to manufacturing. In the product manufacturing phase, simulations and predictions based on the DT-based physical and virtual shop floors, shop floor service system, and shop floor DT data configurations are performed for production plans and processes in a virtual environment to provide an optimisation strategy for the shop floor service system and achieve real-time monitoring and control [18,26,34,35].
The above properties of DT allow cyber-physical integration in the production phase; they would increase the accuracy of management and the efficiency of decision making [25,36,37,38]. Furthermore, this DT model is used in research for the advancement of processes and operations [18,39,40]. From the RMS production planning viewpoint, real-time decision making is a very complex problem; the application of the major components of smart manufacturing, such as the multiagent system and digital manufacturing to RMS, ensures the effectiveness and efficiency of real-time operational decision making [1]. In this study, the DT concept was applied as a virtual model to develop an advanced simulation technology based on the technical definition of operation and procedures.
2.3. Assessment Indicators of RMS
The key performance indicator (KPI) is an indicator of a company’s ability to measure and monitor performance to streamline operations through benchmarking against internal goals or external competitors for evaluating the business performance, productivity, and human contribution [41,42]. The need for an indicator that can enumerate reconfigurations, determine the optimal reconfiguration, and assess the six key characteristics of the RMS from various perspectives leads to an increase in the demand for the RMS. Studies analysing RMS performance have been conducted since the early 2000s [12,43]. However, these studies tend to lack quantifiable indicators of reconfigurations with a limited scope of research because there are numerous factors that contribute to the reconfiguration of the system; it is difficult to identify the relationship between these variables [44]. Hasan et al. measured the reconfigurations of reconfigurable machines, which is a core element of the RMS that uses the multi-attribute utility theory and power function approximation to propose a service-level index for the assessment of RMS performance and reconfiguration processes for a multiple-part family RMS [2,44]. Benderbal et al. proposed the assessment of the modularity of the system using an archived multi-objective simulated annealing-based approach, which aims at maximising system modularity and minimising system completion time and system cost for optimising RMS design [45]. Similarly, a study was conducted to assess the modularity in a distributed manufacturing system based on a design structure matrix [46]. Eguía et al. proposed an assessment that contributes to increasing productivity by identifying and quantifying the inefficiency of system operation considering time, labour, and energy consumption of different RMS modules based on the data envelopment analysis technique [47]. Youssef et al. proposed reconfiguration smoothness (RS) to measure the smoothness and ease of a manufacturing system in terms of cost, time, and effort at the time of configuration selection; they also reported RS at three levels: market-level RS (TRS), system-level RS (SRS), and machine-level RS (MRS) [15]. Existing studies use assessment methodologies for single characteristics of the RMS; studies on integrated assessment of various factors related to reconfigurations are difficult to find. Therefore, this study aims to propose an assessment model that can comprehensively assess the reconfigurations of the production line at the time of line design or during the reconstruction of RMS.
3. DT-Based Integrated Reconfiguration Assessment Application of RMS
3.1. Concept and Definition of Technical Terms in the Proposed Application
The application proposed in this study aims to support decision making by assessing the reconfiguration of a production line in the RMS more accurately and quickly by using DT-based simulation which uses a model that is synchronised with the production site. In the case of traditional simulation modelling, whenever the production line is reconfigured, a user must manually re-build the model. In addition, the disconnection of information from the production site and the user’s proficiency considerably affects the accuracy of the simulation result. The model synchronised with the production site can increase the accuracy of the simulation result. Because the line is reconfigured to respond to frequent demand fluctuations, consistent and automated modelling procedures are required. The definitions of terms frequently used in this study are as follows. Configuration period (CP) refers to the period in which the manufacturing line changes the existing production configuration to a different configuration to respond to changing market demands; the RMS must respond to at least one CP [15]. Demand scenario (DS) means the scenario constituting each CP, consisting of product mix and product volume, which are demand information, as well as scenario occurrence probability [15]. Reconfigurable machine (RM) is a facility that can manufacture one or more part families, with the flexibility to respond to the manufacturing of new products [48].
Figure 1 shows the conceptual model proposed in this study. This application comprises four main components. The information model uses the real-time data collected at the manufacturing site for DT model creation, synchronisation, and simulation. The simulation-based DT module creates a DT model based on the information model, synchronises it with the shop floor, performs simulations, and predicts simulation results. The reconfiguration assessment module assesses the reconfigurations of the manufacturing line based on the simulation results and the assessment elements of the assessment and information models. The proposed application assesses the reconfigurations of the RML for each CP in the RMS equipped with a data exchange system using information media, such as various sensors or IIoT.
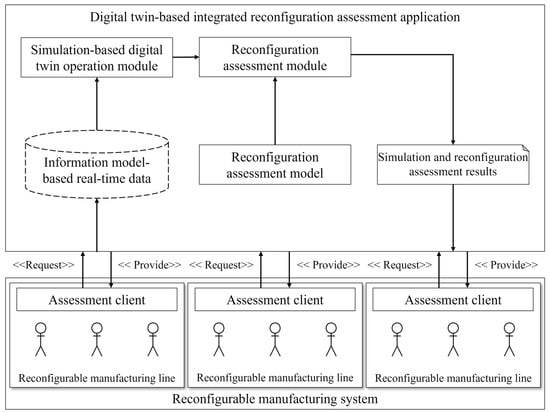
Figure 1.
Conceptual map of the proposed application.
3.2. Architectural Framework and DT of the Proposed Application
Figure 2 depicts the architectural framework of the proposed application. The framework is divided into an RMS comprising (1) an RML, (2) legacy systems that collect and process information collected from the line, (3) a component manager, (4) DT operation module, and (5) a reconfiguration assessment module that corresponds to the scope of application proposed in this study. The description of each component is provided below.
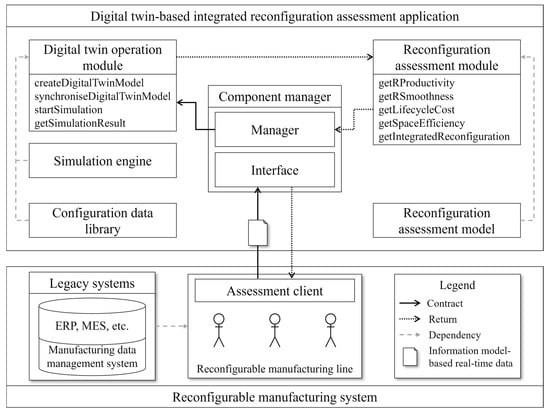
Figure 2.
Architectural framework of the proposed application.
- RML: A line that has the reconfigurability to produce multiple products in one manufacturing line. It can respond to the production of various products and expand production capacity through reorganisation of the manufacturing line by adding and removing resources in the manufacturing line.
- Legacy systems: A system that acquires information related to production activities performed in actual production sites. The system is a general legacy system used in the industry (e.g., enterprise resource planning, manufacturing execution system (MES), and point of production), and data from various systems are acquired, stored, processed, and integrated through the manufacturing data management system.
- Component manager: It comprises an interface for exchanging information between the RML and the proposed application, as well as a manager for driving and managing other modules in the application. The information received through the interface is transferred to the DT operation module; the DT operation module is run based on the information, and it receives the assessment result of the line and returns it to the client through the interface.
- DT operation module: As a core component of the application, the DT model of the production line is created and synchronised with the shop floor, and the simulation result is calculated based on the information received through the component manager. This module includes a simulation engine along with a DT configuration data library that contains a predefined base model amenable to rapid modelling and performing logical operations, such as those pertaining to production and logistics, scheduling, and priority rules as well as metadata. The principal differences between the existing simulation modelling process and this module are the automation of the modelling procedure using the DT configuration library and synchronisation with the manufacturing site based on an information model. The base model is imported based on metadata when constructing the simulation model, and it consists of manufacturing resources. Metadata are configuration data utilised when using the base model and logic. This includes manufacturing information collection time and the location of the configuration data. Furthermore, to enable accurate simulation, the unit functions of resources are reflected in the simulation model at the time it is collected. The DT model includes the production plan, product information, scalable production range, process information, and machine information.
- Reconfiguration assessment module: This module evaluates the assessment items related to the reconfigurations of the RML using the simulation result value predicted by the DT operation module and data received through the component manager and assessment model. After the calculation, this module returns the assessment results and the simulation results to the component manager. To comprehensively assess the integrated reconfiguration of the manufacturing line, the RS, reconfiguration productivity, lifecycle cost, and space efficiency are assessed. Subsequently, the integrated reconfiguration indicator is calculated using the four indicators.
An automotive part production line must respond to frequent product demand and specification changes required by automotive original equipment manufacturers (OEMs). This implies that the production line must meet production plans while producing various existing and new products. As the existing line does not have such flexibility, the production line must be designed from the product design stage when a product is changed or a new product is introduced. Further, disposal costs are incurred when the product is discontinued. In addition, it is difficult to establish a production plan and predict the feasibility of production when an emergency order from an OEM is received. Even if a production plan is established, it is difficult to respond to unexpected scenarios arising from sudden problems such as machine failure. In this study, an assessment of the feasibility of production plan at the request of the customer and productivity through DT simulation reflecting real-time data collected from the field is conducted to solve this problem. Figure 3 shows a flowchart of the application procedure for assessing the line at the time of line reconfiguration or new production line configuration.
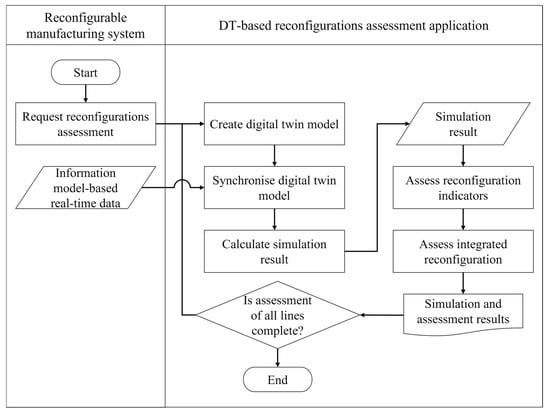
Figure 3.
Flowchart of the reconfiguration assessment procedure.
DT comprises the following four steps at each line reconfiguration time:
- DT model creation: This step simulates the configuration and unit function of the DT model from the information model and process configuration information of the line. The model configuration uses a base model and logic to simulate the physical manufacturing system and logistics as a DT model by utilising the simulation engine. In this step, the unit function simulates the function by utilising the logic defined in the DT configuration data library.
- Synchronisation of DT model: This step maps the information model-based data to the composition and unit functions of the DT model. In this step, the parameter information regarding manufacturing products, processes, and capacity is input, and the real-time information collected at the manufacturing site is input to the configuration and unit function of the DT model.
- Start simulation: In this step, simulation is performed using the DT model. Discrete event simulation (DES), which is a core function of the DT operation model, is performed. Through previous steps, the model performs a more accurate and realistic simulation.
- Obtaining the simulation result (get Simulation Result): This step involves collecting simulation results from the DT model. The simulation results calculated in this step include productivity, operation rate, space utilisation, and investment cost; these results are transmitted to the reconfiguration assessment module to calculate the reconfiguration assessment indices and integrated reconfiguration results. The definition of the result for each simulation is as follows: Productivity refers to the total number of products manufactured during line operating hours. Operation rate refers to the actual operating time relative to the operating time of the line. Line operating time is the sum of the operating time and stop loss time, where stop loss is the sum of failure attributed to machine failure and line stoppage, the preparation and adjustment loss from preparation and finishing before and after work, production type change, jig exchange, and machine check and adjustment to ensure normal operation. Space utilisation is the ratio of the manufacturing line to a given space area. Investment cost is the cost required to construct and operate a manufacturing line.
Figure 4 shows a sequence diagram for the operation procedure of the application. The assessment client checks the demand and production plan information prior to configuring the line and configures the processes required for production accordingly. Subsequently, when requesting an assessment, the information model-based real-time data collected from the production site to the legacy system, configured processes, and demand information are transmitted to the application. If real-time data cannot be collected at the production site, the DT model cannot be synchronised with the field, and only predefined reference data serving as reference information are transmitted. Thus, the configuration and function of the model are mapped using predefined reference data instead of real-time data in the DT model synchronisation step. This is the same as the existing simulation model; however, the user does not need to proceed with the simulation modelling work through an automated procedure. The received data are transferred to the operation module of the DT; the simulation results calculated by the DT module are transferred to the reconfiguration assessment module. These results are used for assessment based on the reconfiguration assessment model when calculating the reconfiguration indicators, and they are returned to the assessment client along with the simulation results. The assessment client can request an assessment of one or more lines, and the application runs until the assessments of all models are completed; the assessment results of all requested lines are returned to the assessment client to compare and analyse the results. Therefore, the assessment client can quickly and repeatedly draw and analyse the assessment results of repetitive line reconfiguration through the application, while confirming whether the demand and deadline are met, and the production plan is achievable. Line reconstruction can be performed by selecting the optimal one among several alternatives.
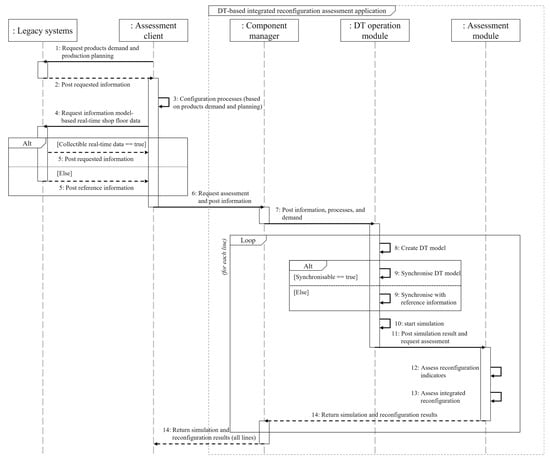
Figure 4.
Procedure of the proposed application.
3.3. Information and Assessment Models for DT-Based Reconfiguration Assessment
A virtual representative description synchronised with on-site resources composed of various types of models and data is important for the successful application of the DT [21]. This information model has been revised from the DT model that supports vertical integration and horizontal coordination for DT operation procedures to suit the application proposed in this study [49]. Existing studies on information models for simulation focus on rapid modelling and interoperability [49,50,51,52,53]. However, they do not include advanced simulation through dynamic prediction and diagnosis of the manufacturing site status. To obtain a detailed information model reflecting the current situation of the manufacturing site, the accuracy of the simulation model needs to be increased using vertical coordination [49]. The changes made in the information model proposed in this study, when compared with the model proposed by Park et al. [49], are as follows:
- Determination of the reconfigurable resource has been added to the information required for the resource description of the existing shop floor;
- Product family information focusing on the RMS rather than a single product has been added;
- Information on RM composing the RML includes information on corresponding product varieties and product groups and information on scalability judgement, and information on scalability, which corresponds to whether facilities and buffers composing a line can be added or removed, has been defined;
- A change plan for the production line has been added considering the characteristics of being able to produce various products in a single line.
The following information has been added to the information model, for reconfiguration assessment: demand information comprising DS, CP, and investment period information, and information on manufacturing resources, required area, number of facilities owned by the line, and workers; cost information comprising fixed costs and investment budgets, such as the prices of facilities, modules, buffers, and material handling equipment constituting the manufacturing line, as well as line operating costs and labour costs. This information is used to assess the investment costs and reconfiguration in the simulation stage. This information includes the arrangement layout for facilities, buffers, and constrained space constituting a line.
This model contains various elements constituting the manufacturing line, relationship between each element, processes to be performed, and various planning information for production. It is an object-oriented model composed of five classes: product, process, plan, plant, and resource. The definition and main components of each class are as follows. Product represents the information of a product, and the main components are customer information, bill of material, and subparts and product family information. Process refers to the process information on machine and material for production; the main components contain information on process, material input, and logistics. Plan is a class for product delivery plans as well as procurement plans for parts and semi-finished products provided by vendors and production plans; this class includes information such as planned production volume, operation schedule, and the non-operational plan as major components. Resource is a class composed of information on manufacturing resources for production, including information on general machines, RMs, buffers, material transfer devices, and operators performing processes. Plant is a class that creates and synchronises the DT model using information of the four classes described above. It comprises the layout of the RML, location of manufacturing resources, and site information collected in real time. Further, this class includes instantiated information about products, process, planning, and resources, and it expresses the condition of the site accurately by including the current information regarding the physical production line collected via media. Using the information, one can create and synchronise the objects of the actual production line.
Figure 5 shows classes representing the data and relationships between product, process, and plan by objectifying them.
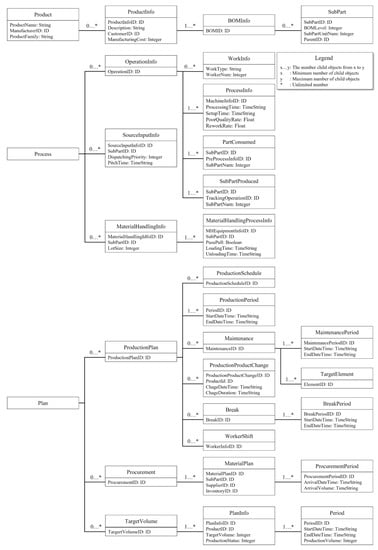
Figure 5.
Product, process, and plan classes of the information model.
Figure 6 depicts classes representing the data and relationship between resource and plant. Data collected for the above-described information model are different for each class. An object-oriented concept information model to improve the performance for data storage and processing was proposed, because of the massive amount of manufacturing data are collected from IIoT, legacy systems, and business solutions that are being used. Further, this information model is used for building DT models of RMLs and evaluating reconfigurations. Moreover, it is possible to build DT models of manufacturing lines other than the RML. In this study, the proposed application is limited to utilising the real-time data collected in the field but not dealing with the method for the collection of the data, because there are many studies on the approaches for collecting the data from the field. Once the data are collected, the DT model can be constructed based on this information. If there is no real-time data exchange system in the field, it is impossible to reflect real-time data. Therefore, a simulation model was built to suit the information model format.
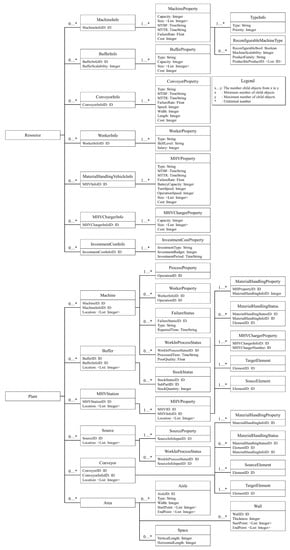
Figure 6.
Resource and plant classes of the information model.
The RMS should be able to respond quickly and efficiently to changes in market demand while satisfying productivity improvement and low lifecycle cost requirements. Therefore, in consideration of these aspects, reconfiguration assessment items are defined to able to assess the responsiveness of the manufacturing line and the lifecycle cost as shown in Table 2. With the introduction of reconfigurable lines and reconfigurable facilities, space efficiency items are additionally defined to assess the space efficiency compared to the existing lines [54,55].

Table 2.
Definition of reconfiguration indicators.
The RS suggested by Youssef et al. [15] was used as the RS factor (RSF). The RSF is an index used to evaluate the cost, time, and effort required for reconfiguring a production line. The RSF is an assessment index for determining RS during the expected investment cycle, calculated by considering both the RS and the feasibility of configuration of the production line pairs that satisfy the DS of the configuration periods [15]. It is expressed as follows:
where i, j, k, Cij, and Pik, represent the number of CPs, number of DSs in the i − 1th CP, number of DSs in the i-th CP, configuration layout in the j-th DS of the i-th CP, and probability of meeting the k-th DS in the i-th CP, respectively.
The RS comprises three elements: TRS, SRS, and MRS [15]. TRS refers to the smoothness at the market level that reflects the cost and time required to purchase or lease additional machines, machine modules, and stations to satisfy the production scenario for a configuration period, as well as to sell or return the related machines to be removed in the next cycle. SRS refers to the cost, time, and effort required to add, remove, and relocate facilities, stations, and logistics machines to satisfy the configuration period scenario [15]. MRS refers to the RS at the facility level considering the facility modules added or removed from the maintained facility and the operation cluster added or removed to satisfy the scenario for the configuration period [15]. As this study aims to assess the RML, the assessment scope takes the hardware level in account, and it is assumed that there are no restrictions on assessing TRS and MRS at the software level. That is, the RS in this paper is only assessed for the RSF at the hardware level, and the smoothness related to the facility between SRS and MRS is assessed. SRS considers installation and removal of RML machines and racks, and MRS considers installation and removal or movement of machine modules. The RS is defined as the sum of SRS and MRS [54,55].
The SRS and MRS are respectively defined as follows:
where M1, M2, Mm, R1, R2, Rm, and rtype represent the set of previously installed machines, set of machines to be installed in the next CP, set of machines moving from their existing location, set of previously installed racks, set of racks installed in the next CP, set of racks moved from their existing location, and the weight according to the liquidity of the rack, respectively.
where δ, j1, j2, and MCi represent the set of added machine modules, set of machine modules to be added in the next CP, and set of module components in the i-th machine, respectively.
Reconfiguration productivity (RP) is an index used to evaluate the production capacity and scalability of a production line by applying demand fulfilment (DF) and the scalability of production capacity (S) during the CP calculated from the DT model [54,55]. The throughput of DF and the average scalability of S are calculated using the results from the simulation. The is affected by the accuracy of the demand forecast. It is recommended that a weight higher than the scalability being set as satisfying the forecast demand is more important than coping with the average fluctuation. However, the importance of scalability becomes relatively higher when the accuracy of demand forecasting is low [54].
Lifecycle cost (C) is an index for evaluating the facility investment and operating costs compared to the investment budget, given as [54,55]
where and investment cost (IC) represent the initial investment cost, respectively, and reconfigurable operation cost (ROC). Further, C can be divided into IC and ROC. ROC is divided into additional investment costs (AC) and operation costs (OC), and AC is the cost considering the purchase cost of machines or modules added according to the configuration period shown in
where Ms and Psi represent the set of machines that can be added for production scalability and the probability of adding machines for production scalability, respectively.
Further,
The OC is the cost required for the operation of the production line and it can be calculated using the results of simulation.
where Mik, Nt, Tw, Cmp, Top, Tid, Cop, and Cid represent the set of machines in the k-th DS in the i-th CP, number of workers input to the t-th machine, working time with the input workers, labour cost per unit time, top (machine operation) time, machine idle time, machine operation cost per unit time, and machine idle cost per unit time, respectively.
Space efficiency (SE) is an index defined to assess how efficiently a space is used based on the area of the line compared to the constrained space where the manufacturing line can be configured. It evaluates the area occupied by a layout [54,55], as follows:
where Mik, Rik, and represent the set of machines installed in the k-th DS in the i-th CP, number of racks installed in the k-th DS in the i-th CP, and minimum required area of the t-th installation. Further,
The integrated assessment index calculated by the reconfiguration assessment model is defined by the standardised Euclidean distance between the above-mentioned four assessment item indicators and the ideal value [54,55]. Here, the ideal value refers to the CP of the production line, which is defined as an ideal value . Here, n denotes the number of CPs to which the RML corresponds. The RS, C, and SE defined above can be the ideal values when no line changes are made at the time of reconfiguration of the production line. RP is defined as n because the productivity should be at its best for all configuration periods. The above four assessment items are coordinated in 4D, and then, the distance from the outlier is calculated as
where m, λrs, srs, λrp, srp, λc, sc, λse, and sse represent the number of RML alternatives, RS weight, RS standard deviation, RP weight, RP standard deviation, weight of C, standard deviation of C, SE weight, and SE standard deviation, respectively.
The smaller integrated index value is the more reasonable alternatives calculated results become and it can be seen to be closer to the most ideal values. According to the pre-set weight for each assessment item, an integrated reconfiguration index based on the assessment intention of the decision maker can be calculated for the selection of the most adequate alternative for the reconfiguration of the production line.
4. Industrial Case Study
4.1. Application Environment and Information
The proposed application consists of DT simulation method that utilises information model for creating DT and synchronisation with the field, and assessment model for evaluation of various aspects of manufacturing systems. This application was applied to an actual production line that produces automotive door trim to validate performance of the application and to ensure that all functions of the application were met. The case study implemented in the study was based on the proposed architectural framework. The input elements of the framework are included in the information model; these elements are divided into assessment and simulation elements as shown in Table 3. To compare the results from simulation and reconfiguration assessment on different manufacturing systems, DML, FML, and RML are assessed. Cars generally consist of four doors. Thus, the manufacturing line produces four door trims for each vehicle type in each line. The reconfigurations for the door trim production for five types were evaluated. Table 4 summarises the differences between each line.

Table 3.
Input elements for reconfiguration assessment and DT simulation.

Table 4.
Comparison between DML, FML, and RML.
RM indicates whether reconfigurable facilities are applied to the line. Producible products represent the number of varieties that can be produced in a line. Scalability indicates whether the machines and racks can be added or removed. The setup time represents the preparation time for production, which includes machine changes and system settings when a product is changed in the line. For DML, changing the product produced in a line is impossible. For the line reconfiguration time when producing a new product, the DML must dispose the machines from the existing line and build new layouts and facilities. Considering the door trim maker, a line reconfiguration time of three months is required. For FML, the facility introduction and line reconfiguration requires one month. The time spent building machines required for producing a new product and the time spent constructing the layout are considered in the line reconfiguration time.
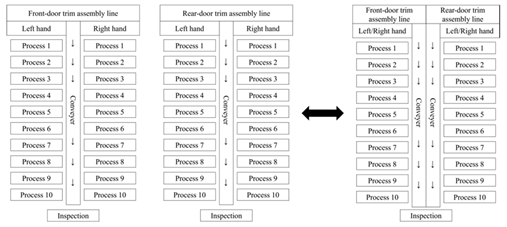
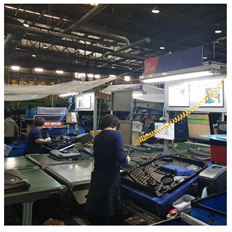
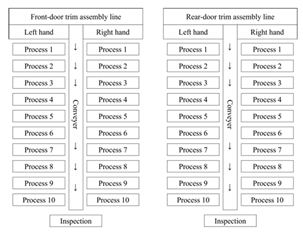
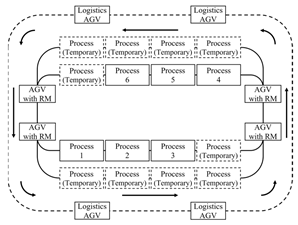
The first target line is the DML in Iksan, South Korea, which mass produces door trims, wherein parts are transported on a conveyor belt and workers assemble parts on an assembly table. The actual appearance of the line is shown in the view of the DML in Table 5. The layout of the DML in Table 5 shows the layout of this line. The detailed name of the process has been declared as confidential information by the manufacturer, thus it is indicated by a process number. When product demand is relatively higher, the front door trim and the rear door trim are produced separately. When the demand is relatively lower, the front and rear door trims are produced simultaneously on a single line.

Table 5.
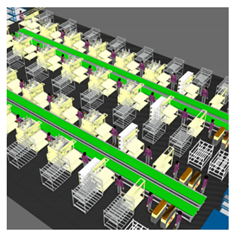
Layout and view of DML, FML, and RML.
The second target line is an FML that produces multiple products on one production line; the basic structure of the performing assembly is similar to that of the DML. However, this line can produce the five models on one line by applying flexible machines. Every time the product is changed, it incurs the setup time related to the manual change of the machines by the worker, as well as setting of the line system. Prior to the production of new products, line configuration time was required to produce machines and the establishment of the line. This line is a simulation model built to compare the assessment results for the FMS and RMS. The model of this line is shown in the view of the FML in Table 5; the layout is similar to the DML.
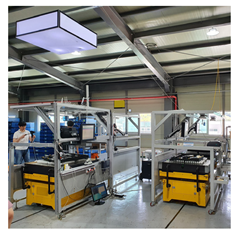
The final target line is the RML with the characteristics of RMS. The RML in this study determines the components corresponding to the assembly process to minimise the time and cost required for product change; further, it configures the workstations in a modular form and arranges these workstations to meet the order of the processes to establish an assembly line. This line can respond quickly to changes in products being manufactured by applying RMs such as reconfigurable jigs; further, it is scalable and can add and remove workstations according to the changes in demand. The line is located at a plant in Gimhae, South Korea, and the actual view of the line is shown in the view of the RML in Table 5. This line utilises various automated machines and automated guided vehicles (AGVs). The operator can easily check the product and process information and quickly reconfigure the line according to the production plan with these core technologies, open networks, software development, and information collected from the field. The layout of the RML in Table 5 shows the layout of this line. Boxes marked with solid lines indicate the process configuration for basic assembly, and they are composed of a reconfigurable module designed to be configured with input, assembly, and inspection processes in a movable standardised workstation. The processes marked with dotted lines are temporary processes, which are configured to allow the addition and removal of modules. In this line, reconfigurable jigs on the AGVs are used for transfer instead of fixed equipment such as a conveyor belt.
Table 6 displays the implementation information of the main components of this application. The application was developed using C# and Net framework 4.5.2. The component manager is implemented with the transmission control protocol/internet protocol (TCP/IP) corresponding to packet switching. In this application, data are exchanged in the extensible markup language (XML) format to ensure versatility and efficient application of technology for data integration in heterogeneous environments. A simulation engine is implemented based on Plant Simulation 13.1, which is a PLM software from Siemens.

Table 6.
Overall information of components used in the case study.
4.2. Implementation and Assessment Scenario
The information model-based field data delivered by the assessment client are received as XML to the proposed application. The information that manages process configuration, target production volume, and target production delivery date of the line desired by the client and the data collected from the field of RML such as MES are transmitted to the component manager. Figure 7 shows the initial screen of the application.
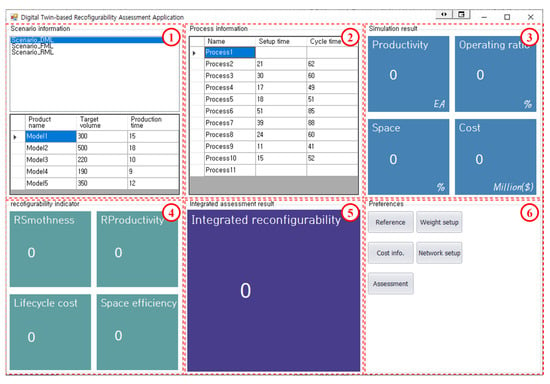
Figure 7.
Snapshot of implemented DT-based reconfiguration assessment application.
The initial screen of the application is divided into the following six areas:
- Scenario information: The scenario of the line for the assessment is displayed at the top of this area. At the bottom of the area, products produced by the line to be assessed, target production volume, and production time allocated to the production of each product are displayed.
- Process information: The area shows the process information of the product. As the process type and number required for manufacturing each product are different, the setup time and cycle time required for each process are displayed, which are reflected in the DT model.
- Simulation result: This area displays the simulation results of the DT model generated based on the information shown in areas 1 and 2 for each scenario, information collected on site, and previously defined reference information. After simulation is performed, results are displayed for each line in this area.
- Reconfiguration indicators: This area displays the reconfiguration assessment results. The displayed results are assessment results of RS, RP, C, and SE.
- Integrated assessment result: The corresponding area displays the integrated reconfiguration index of the production line calculated using Equation (10) for the four reconfiguration assessment elements obtained through the assessment.
- Preferences: This area provides various functions for reconfiguration assessment. It is composed of the functions to check information such as the process required for each line configuration, the space required for each machine, mean time to repair, weight settings for the integrated reconfiguration index, and cost information for calculating investment and lifecycle costs.
Figure 8 shows the DT models of the DML, FML, and RML for the assessment and comparison of reconfigurations of the door trim assembly line. Area 1 in Figure 8 shows the unit assembly line of DML. The FML shown in area 2 in Figure 8 is an assembly line that is composed of a single line. The third production line is the RML which is shown in area 3 in Figure 8. After checking the configuration information of the line, the user begins reconfiguration assessment for each scenario. Figure 9 shows a screenshot of the DT model simulation to produce RML reconfiguration assessment and simulation results.
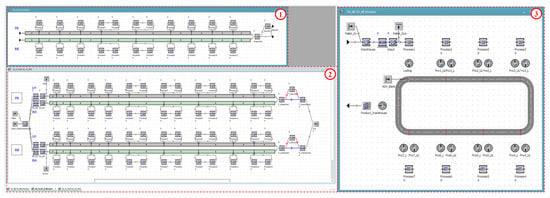
Figure 8.
Snapshot of created DML, FML, and RML DT models.
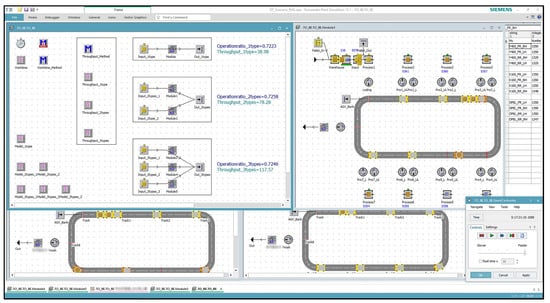
Figure 9.
DT model simulation screen.
The reconfiguration assessment scenario proceeds with the three lines. The DML comprises five assembly lines that respond to five types of door trims. The FML comprises one line equipped to produce five types of door trims. Finally, the RML has no limit on the number of product types that can be produced per line, and it consists of three assembly lines. The demand information, which is one of the evaluation factors for the assessment of three lines reconfiguration evaluation factors, is defined as follows. For the target door trim maker, the expected investment cycle of the line is 1.5 y, and the average CP is 0.5 y. Therefore, the target line must respond to three times of CP during the expected investment cycle. To this end, three assessment scenarios are configured:
- The demand for products changes at each CP; however, the products produced do not change and thus the assessment scenario is as shown scenario 1 in Figure 10;
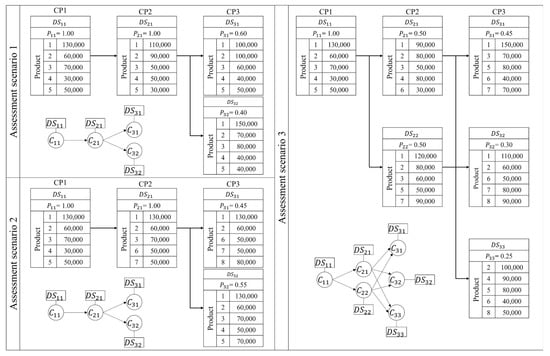 Figure 10. Reconfiguration assessment scenarios.
 - The product changes in each CP, but the demand does not change for products that have been produced constantly and the scenario is as shown scenario 2 in Figure 10;
- Both product demand and product change at each CP and the scenario is as shown scenario 3 in Figure 10.
Door trims are assumed to be produced through the same production process because no significant changes exist in the work process even for different products. Thus, the assembly line is assumed to be the same regardless of modules, and racks constituting the machines and equipment itself are replaced at each CP. When a new product is produced to assess RS, the DML and FML are relatively penalised compared to the RML. The DML and FML do not have RMs; therefore, they require a period of manufacturing and installation of equipment and time to rebuild the layout prior to producing a new product.
4.3. Assessment and Application Results
4.3.1. Simulation and Reconfiguration Assessment Result
Based on the three assessment scenarios, the simulation results are summarised in Table 7, and the reconfiguration assessment results are listed in Table 8. The first assessment scenario for the DML and RML satisfied the DS for all CPs since only the demand changes at each CP. For FMS, the result does not satisfy the DS as a setup time is required whenever the product is changed, and the operation rate is the lowest (64%). For the RS of the reconfiguration assessment indicators, a result value close to an ideal value is obtained in the DML and RML as the number of products does not change, compared to that in the FML, wherein the product needs to be changed. As for the integrated reconfiguration evaluation result, the RML shows the best value.

Table 7.
Results of the simulation for the assessment scenarios.

Table 8.
Results of the reconfiguration assessment for the assessment scenarios.
In the second assessment scenario, the production variety changes. The DML and FML have to face a downtime to manufacture a new product. According to the simulation results, the operation rate decreases and fails to satisfy the DS at the CP. Additional investment costs are incurred for the DML and FML because of the new machines, line relocation, and disposal of existing machines. Based on the reconfiguration assessment results, RML has the values closest to the ideal values in terms of four indicators: RS, RP, C, and SE. The RS assessment result of the FML is better than that of the DML; however, the DML is assessed to have a better result than the FML in terms of RP.
The last assessment scenario indicates that the results are similar to the second evaluation scenario. For DML and FML, productivity does not meet the target demand due to the down time resulting from the changes in product type. Space utilisation is similar to that in other assessment scenarios, and the investment cost of the last assessment scenario is the highest since investment in machines is required. For the reconfiguration assessment, the RML is calculated to be close to the ideal value for all indicators, and the results for the DML and FML are evaluated to be similar to those in the second assessment scenario.
The highest productivity is achieved in the DML where the product type remains the same while only the demand for the product changes. However, it is difficult to meet the demand exceeding production capacity on time with the existing production line. While FML can respond to changes in product type, the production capacity of the line itself is low. Comprehensively considering the assessment scenarios, the productivity of the RML is on average 25% higher than that of the DML and FML. The RML, with a relatively low loss in the line operation, has the highest; similar results are obtained for space utilisation. The RML with a low setup time is observed having a 26% higher operation rate than existing lines. Compared with existing lines, RML has 15% lower space utilisation and 29% lower investment cost. For reconfiguration assessments, the RS of the RML is significantly lower than those of other lines. The RP of the DML and RML is relatively close to the ideal value. The C value of the DML was evaluated to be the worst, and the SE showed a slight difference with all lines. In terms of integrated reconfiguration of each line, the result of the RML was the most ideal, and DML and FML were less efficient than the RML. Furthermore, the assessment results of the two lines were calculated to be similar. Therefore, the evaluation results show that the RML can respond quickly, cost effectively, and space efficiently to changes in product demand and product type.
4.3.2. DT Application Result
There are several advantages when the DT simulation is applied. First, the DT simulation predicted the result more accurately than the existing simulation. Table 9 compares the actual daily, weekly, monthly, and annual production quantities of production models 3 and 4, production quantities predicted by simulation and DT. These results are based on the actual production quantity as 100%; the prediction accuracy is given as follows:

Table 9.
Comparison of the total actual volume, simulation predicted volume, and DT simulation predicted volume.
The existing simulation model calculates the result value with the model built using standard information, such as the probability of defective products or equipment failure. In the DT model, more accurate information, such as equipment failure history and elapsed time since equipment maintenance, is reflected using data collected on site. The monthly and annual results for model 3 reveal that the accuracy of the simulation result values are 93.7% and 78.1%, respectively, whereas those of the DT simulation result values are 99.6% and 91.7%, respectively, which implies that the existing simulation results show a large difference from the actual production quantity. Furthermore, a comparison of the prediction accuracy for the total of the daily, weekly, monthly, and annual production revealed that the accuracy of the simulation is 80.3% and the accuracy of the DT is 92.7%.
In terms of the monthly results for model 4, the accuracy of the simulation is 92.7%, and that of the DT is 98.7%. In terms of the annual results, the accuracy of the simulation is 95.6%, and that of the DT result is 98.7%. As for the total production, the accuracy of the simulation is 95.4%, and that of the DT is 98.7%. A comprehensive check on the results indicates that the accuracy of daily and weekly production is not significantly different from the conventional simulation and DT simulation results. Although there is an error in monthly and annual production predictions from the actual production quantities, the simulation prediction accuracy is 84.5%, which shows a difference of 10.5% in the error from the actual production, compared to the DT simulation prediction accuracy of 95%.
The second advantage of the application is that the time needed in manual engineering tasks for the simulation analysis are shortened. Figure 11 shows a flowchart showing the procedure of traditional simulation model building and that of DT simulation.
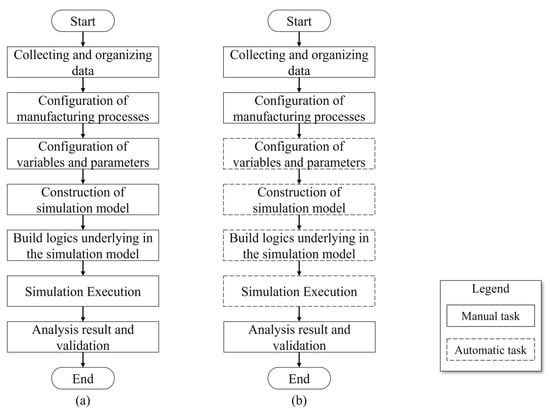
Figure 11.
Comparison between (a) existing and (b) DT-based simulation procedures.
It is possible to configure a model with several automated procedures using the DT configuration library. Therefore, a user is not required to manually build a simulation model by configuring variables and parameters through the existing modelling procedure. Because predefined logic is used, there is no need to build the logic directly in the model; and the simulation is automatically performed. With the existing simulation modelling method, the addition of only one machine requires the user to directly build and modify the simulation model, configure the machine variables and parameters, and build the logic of the simulation model. In this case, the simulation model must be re-established by reflecting the relevant requirements not only during CP but also whenever the demand fluctuates, and when expansion or removal of machines in lines is required. However, the DT model can promptly build a simulation model required by the user by simply configuring the production process. This allows the user to respond quickly to a sudden change in the demand or the time of line reorganisation, and to calculate and compare results more dynamically when evaluating various RML alternatives.
5. Discussion and Conclusions
5.1. Discussion
This study proposed an application based on DT simulation and an assessment model that could comprehensively assess not only the productivity of the production line, but also various elements associated with reconfigurations. The efficiency of the DT simulation compared with existing simulations was discussed. As summarised in Table 9, it was confirmed that the DT operation module consisting of the DT configuration library and simulation engine provides more accurate results than that of traditional simulation. A comparison of the two results showed that the longer the production period and the greater the quantity of products produced, the greater difference in prediction accuracy from the existing and DT simulations is observed. This indicates that the prediction accuracy of the DT simulation is higher than that of the existing simulation. It was also confirmed that DT automates part of the simulation procedure. By mapping the unit functions and behaviours of resources of the manufacturing site to the simulation model defined based on the information model, requisite manual procedures such as configuration, logics building, and execution can be reduced. Based on the existing studies on DT, there are several studies proposing a modelling and application of virtual entities for smart manufacturing with the provision of efficiency such as time costs needed in the application of DT in supporting automatic reconfiguration [18,23,36,56]. However, many of studies have focused on the concept providing, definition building, and foreseeing of the expected effect of the application of DT with lack on comparison on the perspective of the accuracy of the result yielded by DT and existing simulation. Furthermore, this research proposed a practical method to apply the conceptual part to a real industry. Existing studies on the DT also mentioned that using information is an important aspect of the process [21,49]. Compared with studies on information models focusing on rapid modelling and interoperability, the information model proposed in this study differs in that it considers vertical integration for synchronisation with the production site [50,51,52,53]. In addition, this information model was revised in consideration of embracing the characteristics of the RMS.
To evaluate a complex manufacturing system, this paper proposed an integrated assessment model of market responsiveness, productivity, and lifecycle cost. This model includes elements for assessing various objectives of the manufacturing system from various angles, and it allows the elements to be integrated and assessed. According to the assessment result, we confirmed that the RMS can more quickly and cost effectively respond to market changes such as demand fluctuations and product changes compared to the DMS and FMS. Existing assessment studies related to the characteristics of RMS are evaluations on a single aspect, such as modularity and productivity [44,46,47]. The novelty of this model is the assessment of reconfiguration using simulation results. To summarise the application, the conclusions are as follows. In terms of productivity, it was confirmed that DML showed the highest productivity than other lines. However, considering the assessment criteria for various aspects of manufacturing system, it was confirmed that DML could not be satisfied in all aspects except the productivity. If the production duration is long, DML would be the best alternative for mass production, but it should not be considered to cope with market changes that are becoming more diverse and complex. For FML, it confirmed that various products can be produced in a single production line. However, this line needs to produce new product other than the designated products, since the system cannot be changed and it was confirmed that additional costs and down time are incurred in this situation. Although this line may be efficient if the production line produces only a small variety of designated products, it was evaluated to be not enough to respond to market changes. In the case of RML, several studies needed to be conducted in advance, since it was evaluated to be the most efficient manufacturing system in line with changes in the manufacturing paradigm. It was confirmed that it is the system that can respond most efficiently to various internal and external changes. In terms of management, this application contributes to efficient selection of manufacturing system and response to market changes. Furthermore, it contributes to deriving an optimal alternative by dynamically assessing the production line in operation or design stage.
5.2. Conclusions
This study proposed an architectural framework of the application and a DT simulation method. Furthermore, an information model that can achieve interoperability by synchronising real-time data collected on site with the DT model and integrating distributed data was proposed. This model can describe resources and functions of the existing manufacturing system; however, it is suggested that it should be used to assess various reconfigurations while focusing on describing the RML. Finally, an assessment model that can comprehensively evaluate the reconfigurations of the RMS was defined. The application proposed in this study was applied to an automotive part production line in Iksan and Gimhae, South Korea, as a case study to verify its effectiveness. The proposed application enabled the comprehensive assessment of the feasibility of response to the production of various products by applying assessment scenarios to the DML, FML, and RML. Furthermore, it contributed to the selection of the optimal alternative for the production line.
The proposed application supports decision making to ensure an accurate, spontaneous response for each RML configuration. To the best of the authors’ knowledge, this is the first study to assess comprehensive reconfigurations through automated DT-based modelling. In addition, this study is an early case of coordination between DT and RMS.
Currently, there are a few limitations in this study: First, the proposed application only supports the automotive part production line, and therefore, future studies should focus on providing support to production lines in various manufacturing fields equipped with the RMS. Second, as each manufacturing field considers different evaluation factors to be important, guidelines to set the weight of the evaluation model must be established such that it is suitable for each manufacturing field; this can be achieved by evaluating the lines of various manufacturing fields with various weights for the evaluation model proposed in this study. Third, the proposed application focuses on the assessment of the production line. Therefore, it does not provide an optimal alternative to the configuration of the process for the production line. It is necessary to further develop research not only to evaluate the RML reconfigurations but also to propose optimal process configurations through convergence with advanced analytics technology, various optimisation methods, and artificial intelligence technology, which have been attracting increasing research interest.
Author Contributions
Conceptualisation, J.Y., Y.H.S. and S.D.N.; methodology, J.Y., Y.H.S. and D.L.; software, J.Y. and D.L.; validation, J.Y.; formal analysis, J.Y.; writing—original draft preparation, J.Y.; writing—review and editing, S.D.N.; visualisation, J.Y.; supervision, S.D.N.; project administration, S.D.N. All authors have read and agreed to the published version of the manuscript.
Funding
This research was funded by the Ministry of Trade, Industry and Energy (MOTIE) and Korea Institute for Advancement of Technology (KIAT) through the International Cooperative R&D program [P0009839, Cyber Physical Assembly and Logistics Systems in Global Supply Chains (C-PALS)] and IT R&D Program of MOTIE/KEIT [20004170, Development of Optimal Productivity Prediction Technology Based on Collaboration of Human and Machine].
Institutional Review Board Statement
Not applicable.
Informed Consent Statement
Not applicable.
Data Availability Statement
Not applicable.
Conflicts of Interest
The authors declare no conflict of interest.
References
- Koren, Y.; Gu, X.; Guo, W. Reconfigurable Manufacturing Systems: Principles, Design, and Future Trends. Front. Mech. Eng. 2018, 13, 121–136. [Google Scholar] [CrossRef]
- Hasan, F.; Jain, P.K.; Kumar, D. Service Level as Performance Index for Reconfigurable Manufacturing System Involving Multiple Part Families. Procedia Eng. 2014, 69, 814–821. [Google Scholar] [CrossRef][Green Version]
- Koren, Y. The Emergence of Reconfigurable Manufacturing Systems (RMSS). In Reconfigurable Manufacturing Systems: From Design to Implementation; Springer: Cham, Switzerland, 2020; pp. 1–9. [Google Scholar] [CrossRef]
- Mehrabi, M.G.; Ulsoy, A.G.; Koren, Y.; Heytler, P. Trends and Perspectives in Flexible and Reconfigurable Manufacturing Systems. J. Intell. Manuf. 2002, 13, 135–146. [Google Scholar] [CrossRef]
- Koren, Y.; Shpitalni, M. Design of Reconfigurable Manufacturing Systems. J. Manuf. Syst. 2010, 29, 130–141. [Google Scholar] [CrossRef]
- Koren, Y.; Heisel, U.; Jovane, F.; Moriwaki, T.; Pritschow, G.; Ulsoy, G.; Van Brussel, H. Reconfigurable Manufacturing Systems. CIRP Ann. 1999, 48, 527–540. [Google Scholar] [CrossRef]
- Wiktorsson, M.; Do Noh, S.D.; Bellgran, M.; Hanson, L. Smart Factories: South Korean and Swedish Examples on Manufacturing Settings. Procedia Manuf. 2018, 25, 471–478. [Google Scholar] [CrossRef]
- Kang, H.S.; Lee, J.Y.; Choi, S.; Kim, H.; Park, J.H.; Son, J.Y.; Kim, B.H.; Do Noh, S. Smart Manufacturing: Past Research, Present Findings, and Future Directions. Int. J. Prec. Eng. Manuf. Green Technol. 2016, 3, 111–128. [Google Scholar] [CrossRef]
- Henning, K. Recommendations for Implementing the Strategic Initiative Industrie 4.0; Technical Report for National Academy of Science and Engineering: Munich, Germany, 2013. [Google Scholar]
- National Institute of Standards and Technology; Laboratory Program. Smart Manufacturing Operations Planning and Control; NIST: Gaithersburg, MD, USA, 2014.
- Wang, S.; Wan, J.; Li, D.; Zhang, C. Implementing Smart Factory of industrie 4.0: An Outlook. Int. J. Distrib. Sens. Netw. 2016, 12, 3159805. [Google Scholar] [CrossRef]
- Bortolini, M.; Galizia, F.G.; Mora, C. Reconfigurable Manufacturing Systems: Literature Review and Research Trend. J. Manuf. Syst. 2018, 49, 93–106. [Google Scholar] [CrossRef]
- Qin, J.; Liu, Y.; Grosvenor, R. A Categorical Framework of Manufacturing for industry 4.0 and Beyond. Procedia CIRP 2016, 52, 173–178. [Google Scholar] [CrossRef]
- Gruber, F.E. Industry 4.0: A Best Practice Project of the Automotive Industry. In Digital Product and Process Development Systems; Kovács, G.L., Kochan, D., Eds.; Springer: Berlin/Heidelberg, Germany, 2013; pp. 36–40. [Google Scholar]
- Youssef, A.M.A.; ElMaraghy, H.A. Assessment of Manufacturing Systems Reconfiguration Smoothness. Int. J. Adv. Manuf. Technol. 2006, 30, 174–193. [Google Scholar] [CrossRef]
- Liu, Q.; Zhang, H.; Leng, J.; Chen, X. Digital Twin-Driven Rapid Individualised Designing of Automated Flow-Shop Manufacturing System. Int. J. Prod. Res. 2019, 57, 3903–3919. [Google Scholar] [CrossRef]
- Schluse, M.; Priggemeyer, M.; Atorf, L.; Rossmann, J. Experimentable Digital Twins—Streamlining Simulation-Based Systems Engineering for industry 4.0. IEEE Trans. Ind. Inform. 2018, 14, 1722–1731. [Google Scholar] [CrossRef]
- Tao, F.; Jiangfeng, C.; Qinglin, Q.; Zhang, M.; Zhang, H.; Fangyuan, S. Digital Twin-Driven Product Design, Manufacturing and Service with Big Data. Int. J. Adv. Manuf. Technol. 2018, 94, 3563–3576. [Google Scholar] [CrossRef]
- McLean, C.; Leong, S. The Expanding Role of Simulation in Future Manufacturing. In Proceedings of the 2001 Winter Simulation Conference, Arlington, VA, USA, 9–12 December 2001; IEEE Publications: Washington, DC, USA, 2001; Volume 2, pp. 1478–1486. [Google Scholar]
- Monostori, L.; Kádár, B.; Bauernhansl, T.; Kondoh, S.; Kumara, S.; Reinhart, G.; Sauer, O.; Schuh, G.; Sihn, W.; Ueda, K. Cyber-Physical Systems in Manufacturing. CIRP Ann. 2016, 65, 621–641. [Google Scholar] [CrossRef]
- Schroeder, G.N.; Steinmetz, C.; Pereira, C.E.; Espindola, D.B. Digital Twin Data Modeling with Automation and a Communication Methodology for Data Exchange. IFAC PapersOnLine 2016, 49, 12–17. [Google Scholar] [CrossRef]
- Park, K.T.; Jeon, S.W.; Noh, S.D. Digital Twin Application with Horizontal Coordination for Reinforcement-Learning-Based Production Control in a Re-Entrant Job Shop. Int. J. Prod. Res. 2021, 1–17. [Google Scholar] [CrossRef]
- Tao, F.; Zhang, M.; Nee, A.Y.C. Digital Twin Driven Smart Manufacturing; Academic Press: Cambridge, MA, USA, 2019. [Google Scholar]
- Koren, Y. General RMS Characteristics. Comparison with Dedicated and Flexible Systems. In Reconfigurable Manufacturing Systems and Transformable Factories; Springer: Berlin/Heidelberg, Germany, 2006; pp. 27–45. [Google Scholar]
- Cheng, Y.; Zhang, Y.; Ji, P.; Xu, W.; Zhou, Z.; Tao, F. Cyber-Physical Integration for Moving Digital Factories Forward Towards Smart Manufacturing: A Survey. Int. J. Adv. Manuf. Technol. 2018, 97, 1209–1221. [Google Scholar] [CrossRef]
- Grieves, M. Digital Twin: Manufacturing Excellence through Virtual Factory Replication. White Pap. 2014, 1, 1–7. [Google Scholar]
- Tao, F.; Cheng, J.; Qi, Q. IIHub: An Industrial Internet-of-Things Hub toward Smart Manufacturing Based on Cyber-Physical System. IEEE Trans. Ind. Inform. 2017, 14, 2271–2280. [Google Scholar] [CrossRef]
- Liao, Y.; de Freitas Rocha Loures, E.D.F.R.; Deschamps, F. Industrial Internet of Things: A Systematic Literature Review and Insights. IEEE Internet Things J. 2018, 5, 4515–4525. [Google Scholar] [CrossRef]
- Alam, K.M.; El Saddik, A. C2PS: A Digital Twin Architecture Reference Model for the Cloud-Based Cyber-Physical Systems. IEEE Access. 2017, 5, 2050–2062. [Google Scholar] [CrossRef]
- Uhlemann, T.H.J.; Schock, C.; Lehmann, C.; Freiberger, S.; Steinhilper, R. The Digital Twin: Demonstrating the Potential of Real Time Data Acquisition systems. Procedia Manuf. 2017, 9, 113–120. [Google Scholar] [CrossRef]
- Park, K.T.; Im, S.J.; Kang, Y.S.; Noh, S.D.; Kang, Y.T.; Yang, S.G. Service-Oriented Platform for Smart Operation of Dyeing and Finishing Industry. Int. J. Comput. Integr. Manuf. 2019, 32, 307–326. [Google Scholar] [CrossRef]
- Park, K.T.; Nam, Y.W.; Lee, H.S.; Im, S.J.; Noh, S.D.; Son, J.Y.; Kim, H. Design and Implementation of a Digital Twin Application for a Connected Micro Smart Factory. Int. J. Comput. Integr. Manuf. 2019, 32, 596–614. [Google Scholar] [CrossRef]
- Gabor, T.; Belzner, L.; Kiermeier, M.; Beck, M.T.; Neitz, A. A Simulation-Based Architecture for Smart Cyber-Physical Systems. In Proceedings of the IEEE international conference Autonomic Comput, Wuerzburg, Germany, 17–22 July 2016; IEEE Publications: Washington, DC, USA, 2016; Volume 2016, pp. 374–379. [Google Scholar]
- Boschert, S.; Rosen, R. Digital Twin—The Simulation Aspect. In Mechatronic Futures; Springer: Cham, Switzerland, 2016; pp. 59–74. [Google Scholar]
- Tao, F.; Zhang, M.; Cheng, J.; Qi, Q. Digital twin workshop. A New Paradigm for Future Workshop. Comput. Integr. Maanuf Syst. 2017, 23, 1–9. [Google Scholar]
- Tao, F.; Zhang, H.; Liu, A.; Nee, A.Y.C. Digital Twin in Industry: State-of-the-Art. IEEE Trans. Ind. Inform. 2018, 15, 2405–2415. [Google Scholar] [CrossRef]
- Ding, K.; Chan, F.T.S.; Zhang, X.; Zhou, G.; Zhang, F. Defining a Digital Twin-Based Cyber-Physical Production System for Autonomous Manufacturing in Smart Shop Floors. Int. J. Prod. Res. 2019, 57, 6315–6334. [Google Scholar] [CrossRef]
- Qi, Q.; Tao, F. Digital Twin and Big Data Towards Smart Manufacturing and Industry 4.0: 360 Degree Comparison. IEEE Access. 2018, 6, 3585–3593. [Google Scholar] [CrossRef]
- Vachálek, J.; Bartalský, L.; Rovný, O.; Šišmišová, D.; Morháč, M.; Lokšík, M. The Digital Twin of an Industrial Production Line Within the industry 4.0 Concept. In Proceedings of the 21st international conference Process Control (PC), Štrbské Pleso, Slovakia, 6–9 June 2017; Volume 2017, pp. 258–262. [Google Scholar]
- Zhang, H.; Liu, Q.; Chen, X.; Zhang, D.; Leng, J. A Digital Twin-Based Approach for Designing and Multi-Objective Optimization of Hollow Glass Production Line. IEEE Access. 2017, 5, 26901–26911. [Google Scholar] [CrossRef]
- Ahmad, M.M.; Dhafr, N. Establishing and Improving Manufacturing Performance Measures. Robot. Comput. Integr. Manuf. 2002, 18, 171–176. [Google Scholar] [CrossRef]
- Zairi, M. Benchmarking: The Best Tool for Measuring Competitiveness. Benchmarking Qual. Mgmt. Tech. 1994, 1, 11–24. [Google Scholar] [CrossRef]
- Gumasta, K.; Kumar Gupta, S.; Benyoucef, L.; Tiwari, M.K. Developing a Reconfigurability Index Using Multi-Attribute Utility Theory. Int. J. Prod. Res. 2011, 49, 1669–1683. [Google Scholar] [CrossRef]
- Hasan, F.; Jain, P.K.; Kumar, D. Machine Reconfigurability Models Using Multi-Attribute Utility Theory and Power Function Approximation. Procedia Eng. 2013, 64, 1354–1363. [Google Scholar] [CrossRef]
- Haddou Benderbal, H.H.; Dahane, M.; Benyoucef, L. Modularity Assessment in Reconfigurable Manufacturing System (RMS) Design: An Archived Multi-Objective Simulated Annealing-Based Approach. Int. J. Adv. Manuf. Technol. 2018, 94, 729–749. [Google Scholar] [CrossRef]
- Farid, A.M.; McFarlane, D.C. A Tool for Assessing Reconfigurability of Distributed Manufacturing Systems. IFAC Proc. 2006, 39, 523–528. [Google Scholar] [CrossRef]
- Eguía, I.; Villa, G.; Lozano, S. Efficiency Assessment of Reconfigurable Manufacturing Systems. Procedia Manuf. 2017, 11, 1027–1034. [Google Scholar] [CrossRef]
- Katz, R. Design Principles of Reconfigurable Machines. Int. J. Adv. Manuf. Technol. 2007, 34, 430–439. [Google Scholar] [CrossRef]
- Park, K.T.; Yang, J.; Noh, S.D. VREDI: Virtual Representation for a Digital Twin Application in a Work-Center-Level Asset Administration Shell. J. Intell. Manuf. 2021, 32, 501–544. [Google Scholar] [CrossRef]
- Riddick, F.H.; Lee, Y.T. Core Manufacturing Simulation Data (CMSD): A standard representation for manufacturing simulation-related information. In Proceedings of the Fall Simulation Interoperability Workshop (Fall SIW) SISO, Orlando, FL, USA, 20–24 September 2010; pp. 1–9. [Google Scholar]
- Mónica, R.L.; Christian, B.; Friedrich, M.; Bernd, K.; Urlich, B.; Waldemar, S. Agent-based communication to map and exchange shop floor data between MES and material flow simulation based on the open standard CMSD. IFAC-PapersOnLine 2016, 49, 1526–1531. [Google Scholar] [CrossRef]
- Bloomfield, R.; Mazhari, E.; Hawkins, J.; Son, Y.J. Interoperability of manufacturing applications using the Core Manufacturing Simulation Data (CMSD) standard virtual representation. Comput. Ind. Eng. 2012, 62, 1065–1079. [Google Scholar] [CrossRef]
- Lee, J.Y.; Kang, H.S.; Kim, G.Y.; Noh, S.D. Concurrent material flow analysis by P3R-driven modeling and simulation in PLM. Comput. Ind. 2012, 63, 513–527. [Google Scholar] [CrossRef]
- Park, S.H. Assessments of the Production Reconfigurability for Assembly Lines Using Modeling and Simulation. Master’s Thesis, Sungkyunkwan University, Suwon, Korea, 2016. [Google Scholar]
- Lee, S.; Park, S.; Yang, J.; Son, Y.H.; Ko, M.J.; Lim, J.W.; Kong, H.; Jung, Y.; Kim, S.; Noh, S.D.; et al. Modeling & Simulation-Based Assessments of Reconfigurability and Productivity for Automotive Module Assembly Lines. J. Comput. Des. Eng. 2019, 24, 233–247. [Google Scholar] [CrossRef]
- Zhang, C.; Xu, W.; Liu, J.; Liu, Z.; Zhou, Z.; Pham, D.T. Digital twin-enabled reconfigurable modeling for smart manufacturing systems. Int. J. Comput. Integr. Manuf. 2021, 34, 709–733. [Google Scholar] [CrossRef]
Publisher’s Note: MDPI stays neutral with regard to jurisdictional claims in published maps and institutional affiliations. |
© 2022 by the authors. Licensee MDPI, Basel, Switzerland. This article is an open access article distributed under the terms and conditions of the Creative Commons Attribution (CC BY) license (https://creativecommons.org/licenses/by/4.0/).
