Article

Effect of Optimization Software on Part Shape Accuracy and Production Times during Rough Milling of Aluminum Alloy

1
Department of Technologies, Materials and Computer Aided Production, Faculty of Mechanical Engineering, Technical University of Košice, Mäsiarska 74, 040 01 Košice, Slovakia
2
Prototyping and Innovation Centre, Faculty of Mechanical Engineering, Technical University of Košice, Park Komenského 12A, 042 00 Košice, Slovakia
3
Continental Automotive Systems Slovakia, Cesta ku Continentalu 8950/1, 960 01 Zvolen, Slovakia
*
Author to whom correspondence should be addressed.
Machines 2022, 10(12), 1212; https://doi.org/10.3390/machines10121212
Submission received: 21 November 2022 / Revised: 7 December 2022 / Accepted: 9 December 2022 / Published: 14 December 2022
(This article belongs to the Section Advanced Manufacturing)

Abstract

:
Reducing production costs during machining processes can be implemented in several ways, including various methods of cutting parameters optimization. The aim of the described research was to evaluate the effectiveness of software that optimizes the NC (Numerical Control) code generated from a CAM (Computer Aided Manufacturing) system. The experiments were carried out in rough milling. For the experiment, a sample with five pockets was designed and fabricated using the original NC programs from the CAM system and optimized NC programs. Evaluated criteria were the impact on the accuracy of the produced surfaces and degree of production time savings. When using the optimization software, despite more intensive cutting conditions, deviations on the side surfaces of the pockets were reduced from 3 to 23%. On the horizontal surfaces, for two pockets, there was an increase in deviations of a maximum of 7.8%, and for the remaining three pockets, there was a decrease in deviations ranging from 8.3 to 36%. The optimized NC programs achieved time savings ranging from 12.8 to 15.9%. This knowledge is important for manufacturers, as it allows shortening production times and thereby reducing related costs.

1. Introduction

During rough milling operations, there are low requirements on machining accuracy, and emphasis is placed on removing the largest possible volume of material in the shortest possible time. In determining the cutting parameters, the magnitude of the cutting forces, the machining stability given by the rigidity of the machine–tool–workpiece system, and the available torque or power of the spindle are usually considered. Another factor to consider is the rate of tool wear, particularly when machining difficult-to-cut materials. However, achieving highly efficient machining parameters under these constraints is a significant challenge in CNC machining.
Cutting parameters, such as the depth of cut, feed rate, and cutting speed, play the most important roles in the optimization of roughing. In the conventional approach to the creation of NC programs, the values of these parameters are determined based on the experience of workers or data from tool manufacturers. However, to avoid situations such as chatter, excessive tool wear, spindle overload, or feed mechanisms that cause downtime and increase costs, cutting conditions must be chosen conservatively.
Improving the cutting parameters is the easiest way to improve machining efficiency; however, it is also necessary to determine the upper limit of usable machining parameters. This is a multi-variable solution to a problem that considers several aspects, such as the machining method, machine performance, toolpath strategies, tool properties, clamping method, and type of subsequent finishing operation. Consequently, optimization of the roughing process is difficult.
Typically, the selection of machining parameters is based on a trial-and-error approach [1]; however, this approach can be time-consuming, and the outcome depends on the skills and experience of the technologist-programmer. A suitable alternative may be to select machining parameters through a series of experiments.
Zhang et al. [2] proposed a method for optimizing rough milling parameters based on a combination of offline optimization and real-time process monitoring when machining titanium alloy. They used a mathematical model to increase machining efficiency. This model considers limitations, such as cutting force, stability, spindle torque, and power. The spindle speed and radial and axial depths of cut are considered as variables. In the titanium alloy machining case described herein, the machining efficiency increased by 118% after optimization.
A comparison of three types of rough milling method, namely, slot, plunge, and trochoidal milling, is described in [3]. Experiments carried out on the EN AW 7075 T6 aluminum alloy determined that slot milling is the best milling operation in terms of energy consumption and material removal rate, whereas sustainable productivity gain factor was the worst for trochoidal milling. Improving energy efficiency in the milling process through an optimization model was also addressed by Feng et al. [4]. The energy consumption model of the machine tool is also included in the method described in [5]. The parameters of the milling process, namely spindle speed and feed rate, are optimized. The aim of the optimization is to reduce the cost of machining.
Zoghipour et al. [6] evaluated the machining performance of rough milling pockets made of brass alloys. Three milling methods were used: concentric, trochoidal, and profit milling. The authors concluded that the optimization of cutting conditions reduced the production time, cutting force, and dimensional error, and increased material removal rate, considering technological and manufacturing constraints. Both the desirability function method and genetic-algorithm-based approach were used for optimization.
The adaptive NC program implemented using a custom optimization module was described by Ridwan et al. [7]. A key feature of the module is its ability to perform adaptive feed rate optimization by maintaining a constant load within the capabilities of the machine tool. A case study carried out on an aluminum alloy sample showed a 29% reduction in machining time.
The feed rate in three-axis rough milling can also be optimized using an artificial-neural-network-based method [8]. The data obtained by the process monitoring were employed to optimize the performance of the machine spindle. The authors declared an improvement in machining efficiency from 12 to 23% and a reduction in spindle power variance from 27 to 50%. Verification of the method was performed on a sample of aluminum alloy.
The typical effort in designing production processes is put into optimization of any activity. Modification of the NC codes consists of several steps [9]. One of the steps is the optimization of the sequence of operations, which affects the number of tool changes, and of rotations and tilts of the milling table. The next step is the optimization of the machining strategies to ensure the accuracy and quality of machined surfaces in relation to the machining time [10]. The third possible step is the optimization of the code structure to reduce the number of blocks or eliminate unnecessary (duplicate) commands. One of the aims of NC program modification is to reduce machining time and increase the efficiency of the production process. The importance of this objective is also declared by the development of specialized software [11].
Data on the expected production time are important for planning and organizing production. The most common source of these data is the programming system. The production time was calculated based on a simulation of the process; thus the data obtained are indicative only. Compared to simulation times, real times can be up to a tenth percent higher. This issue has been partially addressed in [12] where the authors compared four strategies for creating the shaped surface of an aluminum alloy AlCu4Mg sample. NC programs were subsequently generated using the CAM system. The real production times were 10–58% longer than the simulated ones.
The cutting conditions were determined based on the tool used, material being machined, and performance characteristics of the machine. By default, they were set according to the most critical section of the tool paths, which leads to underutilization of the tool capabilities in other sections. Two main forms of adaptive management were used to address this problem: the online form of adaptive control, which can be part of the machine control system [13], and the offline form, which uses specialized software. The optimization software implemented in the machine control system is described in [14]. The proposed algorithm optimizes the feed rate. The machine time savings reached 26% and machining time was reduced by 35%. Offline optimization was described by Liu et al. [15]. The optimization was focused on adjusting the feed rate in the corner milling process to prevent a reduction in accuracy, vibration, and wear or complete failure of the tool.
Feed optimization is a frequently solved problem, not only in rough milling. Lee et al. [16] dealt with the adjustment of the feed rate values at intersecting toolpaths. In this study, a method that performs feed rate scheduling with consistency in the crossing direction is proposed. The effect of feed rate on machine behavior in high-speed machining (HSM) and circular interpolation was discussed by Gassara et al. [17]. Rattunde et al. [18] proposed a feed optimization methodology for rough milling based on spindle performance monitoring. The proposed method iteratively adjusts the feed rate with each production cycle based on the prediction of a Gaussian Process model.
Higher values of the cutting parameters increase the productivity of rough milling, but simultaneously worsen the surface condition of the workpiece in relation to subsequent finishing operations. The surface is machined with deviations that, if negative, may exceed the allowance for the subsequent finishing operation. For example, a deviation after roughing of −0.3 mm with a retained allowance of 0.25 mm will cause an undercut of 0.05 mm on the finished surface. In contrast, for positive deviations, the finishing allowance may increase to a value unacceptable for the next finishing operation.
The experiments described in this study are focused on assessing the suitability of using optimization software for two and a half dimension (2.5D) rough milling. The experiments had two objectives. The first was to assess the effect of tool loading on the shape and dimensional deviations of the produced surfaces. The evaluated samples were prepared using NC programs from the CAM system and optimization software. The second objective was to compare the machining times using the standard and optimized NC programs. The authors used individually designed software in conjunction with process monitoring. The presented study evaluates commercially available software designed for normal production milling without requiring application under special conditions. These factors increase the reliability of applying the results in real production.

2. Design and Implementation of Experiments

2.1. Methodology

To achieve the objectives, the experiment was carried out in the following steps:
  • Production of a sample with five open pockets, each pocket being made with a different tool-load intensity. A CAM system was used for programming.
  • Production of identical samples using NC programs modified by optimization software.
  • Comparison of accuracy of pockets made on individual samples and between all samples using a coordinate measuring machine (CMM).
  • Comparison of rough milling times for standard and optimized NC programs.
For the experiment, a sample in the form of a turbine wheel with five interblade pockets was designed. SolidWorks (Dassault Systems SolidWorks Corp, Waltham, USA) CAD (Computer Aided Design) was used to design the turbine wheel. The diameter of the sample (Figure 1) was 90 mm, the height of the cylindrical part with the blades was 23 mm, and the depth of pockets was 20 mm. The material of the sample was aluminum alloy AlMg3 (EN AW 5754) with a tensile strength of 180–250 MPa. The maximum weight ratios of the alloying elements are listed in Table 1. The raw material was a 90 mm diameter cylinder with a height of 40 mm, prepared by turning.
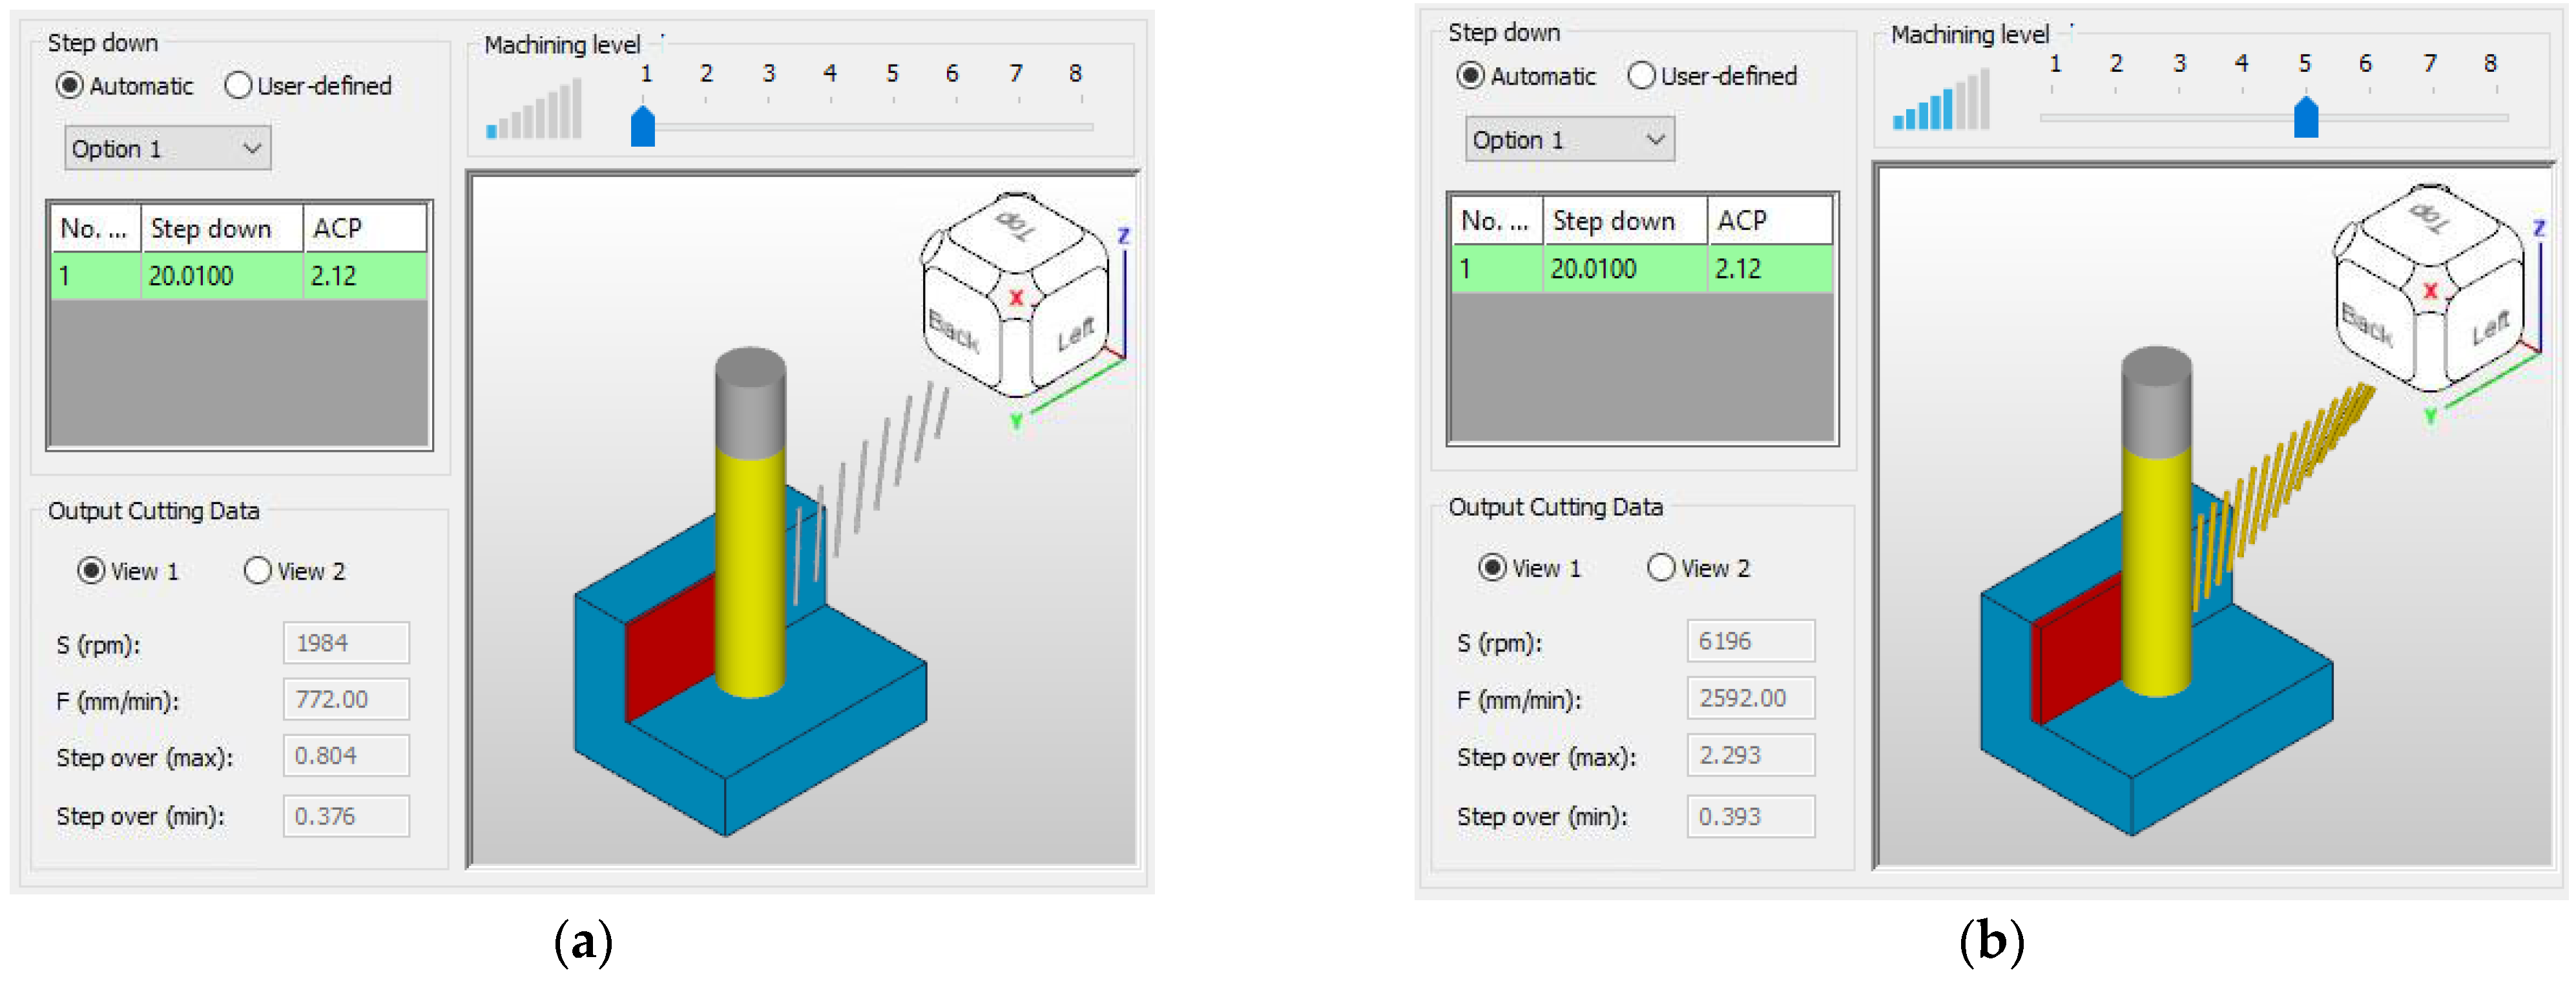
A 5-axis DMG Mori DMU 60 eVo continuous milling machine (DMG Mori Corporation, Bielefeld, Germany) with a Heidenhain TNC 640 control system was used to produce samples. SolidCAM 2021 (SolidCAM Inc., Newtown, CT, USA) with an appropriate postprocessor was selected as the CAM system for the creation of NC programs. The iMachining 2D strategy was chosen to create the pockets, allowing eight levels of tool-load intensity to be set. The pockets were machined at different load intensities, from levels 1 to 5. The method for adjusting load intensity is shown in Figure 2. The CAM system recalculated the cutting conditions based on the set load intensity, as shown in the area on the bottom left in Figure 2, where these are visible.
A separate NC program was generated for each pocket. The NC programs were used to produce the first sample. The tool paths are illustrated in Figure 3. The numbers indicate the level of load intensity of the tool and correspond to the number identifying the pocket in the following text.
For the second sample, the NC program from the CAM system was modified using Eureka Chronos software (Roboris Srl, Ospedaletto–Pisa, Italy). This software was designed for feed optimization, and the expected result is reduced machine time, improved surface quality, and extended tool life [19]. Here, feed optimization is possible according to the selected criterion or artificial intelligence (AI) mode. The software allows the user to select the intensity of the load on the tool via the so-called performance index for five degrees. The lowest degree, 1, was for the longest possible tool life, while the highest degree, 5, was designed to minimize production time. For sample production, the software was set to AI mode, with a mean performance index value of 3. The software did not affect the toolpaths.
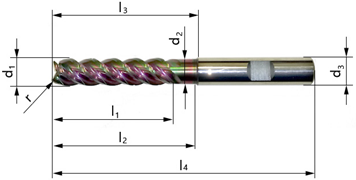
A carbide end mill with a corner radius CCR-AL. SA.12, 0.45°. Z4.R0, 2.HB.EL DLC (manufactured by WNT, supplier Ceratizit S.A., Mamer, Luxembourg) was used as the tool in this experiment. The tool diameter was 12 mm and designed for trochoidal milling. The tool parameters are listed in Table 2. In the CAM system, a cutting speed of vc = 350 m·min−1 and feed per tooth of fz = 0.12 mm were defined for the tool. However, the iMachining strategy adjusts the cutting conditions according to the set tool-load intensity. The adjusted cutting parameters are listed in Table 3. All tests were performed with 8% emulsion Zubora 65 H Extra (Zeller + Gmelin GmbH & Co. KG, Eislingen/Fil, Germany). This cutting fluid was designed for machining steel, cast iron, and aluminum alloys. A flood-cooling method was then employed. The produced samples are shown in Figure 4.
Wall and bottom deviations were determined for each pocket of both samples. Measurements were performed using CMM Zeiss DuraMax HTG (Carl Zeiss, Jena, Germany). A touch stick with a 3 mm diameter ball was used. A computer-aided design (CAD) model of the sample was used to create the measurement program. The data were evaluated using the Zeiss Calypso software.

2.2. Deviations on the Side Surfaces

The aim of the measurements was to determine the surface deviations based on the tool load. The measurement of the sidewall deviations was carried out at half the height of the pocket, which was pulled by a continuous motion along the entire circumference of the pocket. The values were taken at 2060 points.
The sidewall deviations of the sample made with the NC programs from the CAM system are shown in Figure 5. As the tool-load intensity increases, the deviation values along the entire length of the profile increase. The most significant increase was observed at both ends of the profile and its center, in the region with the smallest inner radius. On the concave part, there was a noticeable transition from a negative to a positive deviation towards the edge of the sample. The convex part was dominated by a positive deviation; towards the edge of the sample the positive and negative deviations alternate. The positive deviations were significantly larger.
The deviations of the sidewalls of the sample made using the NC programs from the optimization software are shown in Figure 6. The intensity of the tool load had the same effect on the deviations as in the previous sample.
A comparison of the maximum positive, maximum negative, and mean values of the pocket sidewall deviations is given in Table 4. When using the optimization software, in three cases (i.e., tool-load intensities 1, 3, and 5), the maximum positive deviations increased; in the other two cases (i.e., tool-load intensities 2 and 4), the deviations decreased. In contrast, the maximum negative deviations were smaller in four cases (i.e., tool-load intensities 1–4) when using the optimization software and for one case (i.e., tool-load intensity 5), the deviations were identical. A comparison of the mean deviations reveals that all sidewalls created by the optimization software exhibited smaller deviations.
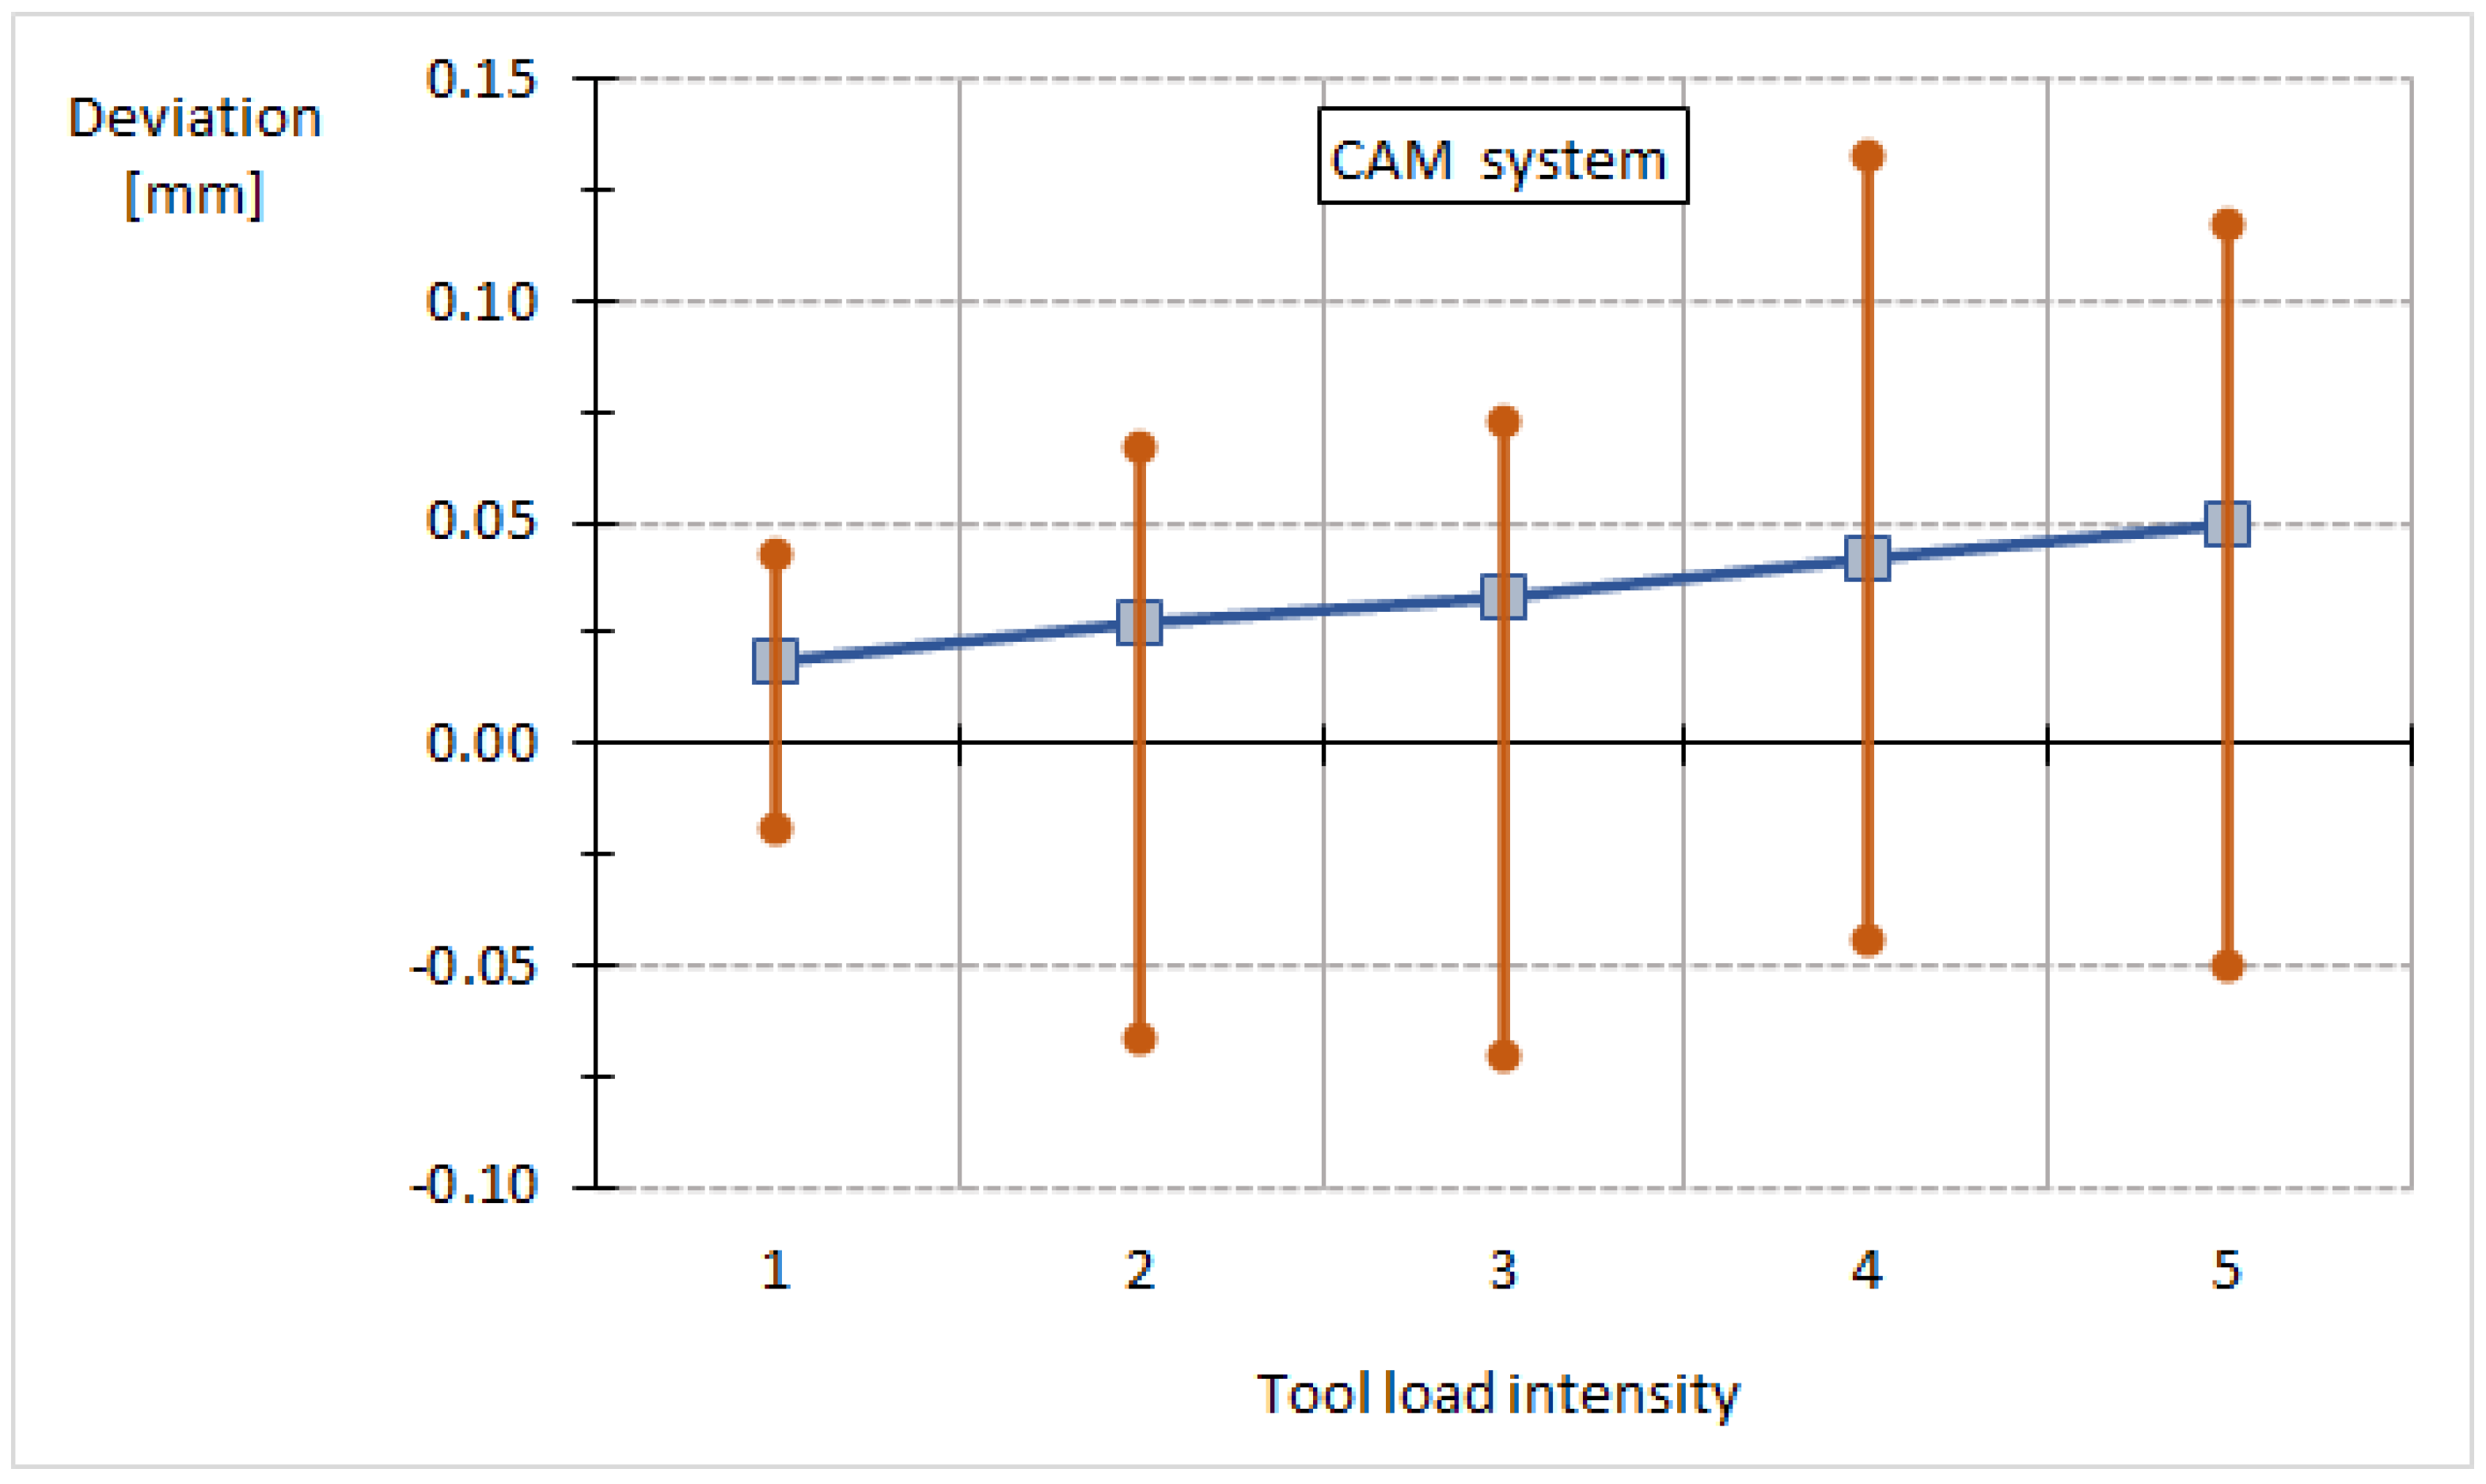
Figure 7 contains a graph of the deviations on the sidewalls made with the CAM system. The mean values of the deviations increased with an increase in the tool-load intensity. The smallest variance of values was achieved at tool-load intensity 1 (0.062 mm), and the largest at tool-load intensity 4 (0.176 mm). The maximum negative deviations were larger than the maximum positive deviations, except for the case of tool-load intensity 4. For a remaining allowance of 0.1 mm in the next finishing operation, the minimum actual allowance would be 0.08 mm at an intensity of 1 and only 0.03 mm at an intensity of 3. The maximum value of the allowance ranged from 0.143 (intensity 1) to 0.233 mm (intensity 4).
The deviations on the surfaces obtained by applying the optimization software are shown in Figure 8. Even in this case, the mean values of the deviations increased with the tool-load intensity. The variance in the deviation values increased with increasing tool-load intensity from 0.073 (intensity 1) to 0.178 mm (intensity 5). If an allowance of 0.1 mm were left for the next finishing operation, the minimum actual allowance value would be between 0.05 mm (intensity 5) and 0.083 mm (intensity 1). Therefore, maximum value of the allowance ranged from 0.156 (intensity 1) to 0.228 mm (intensity 5).
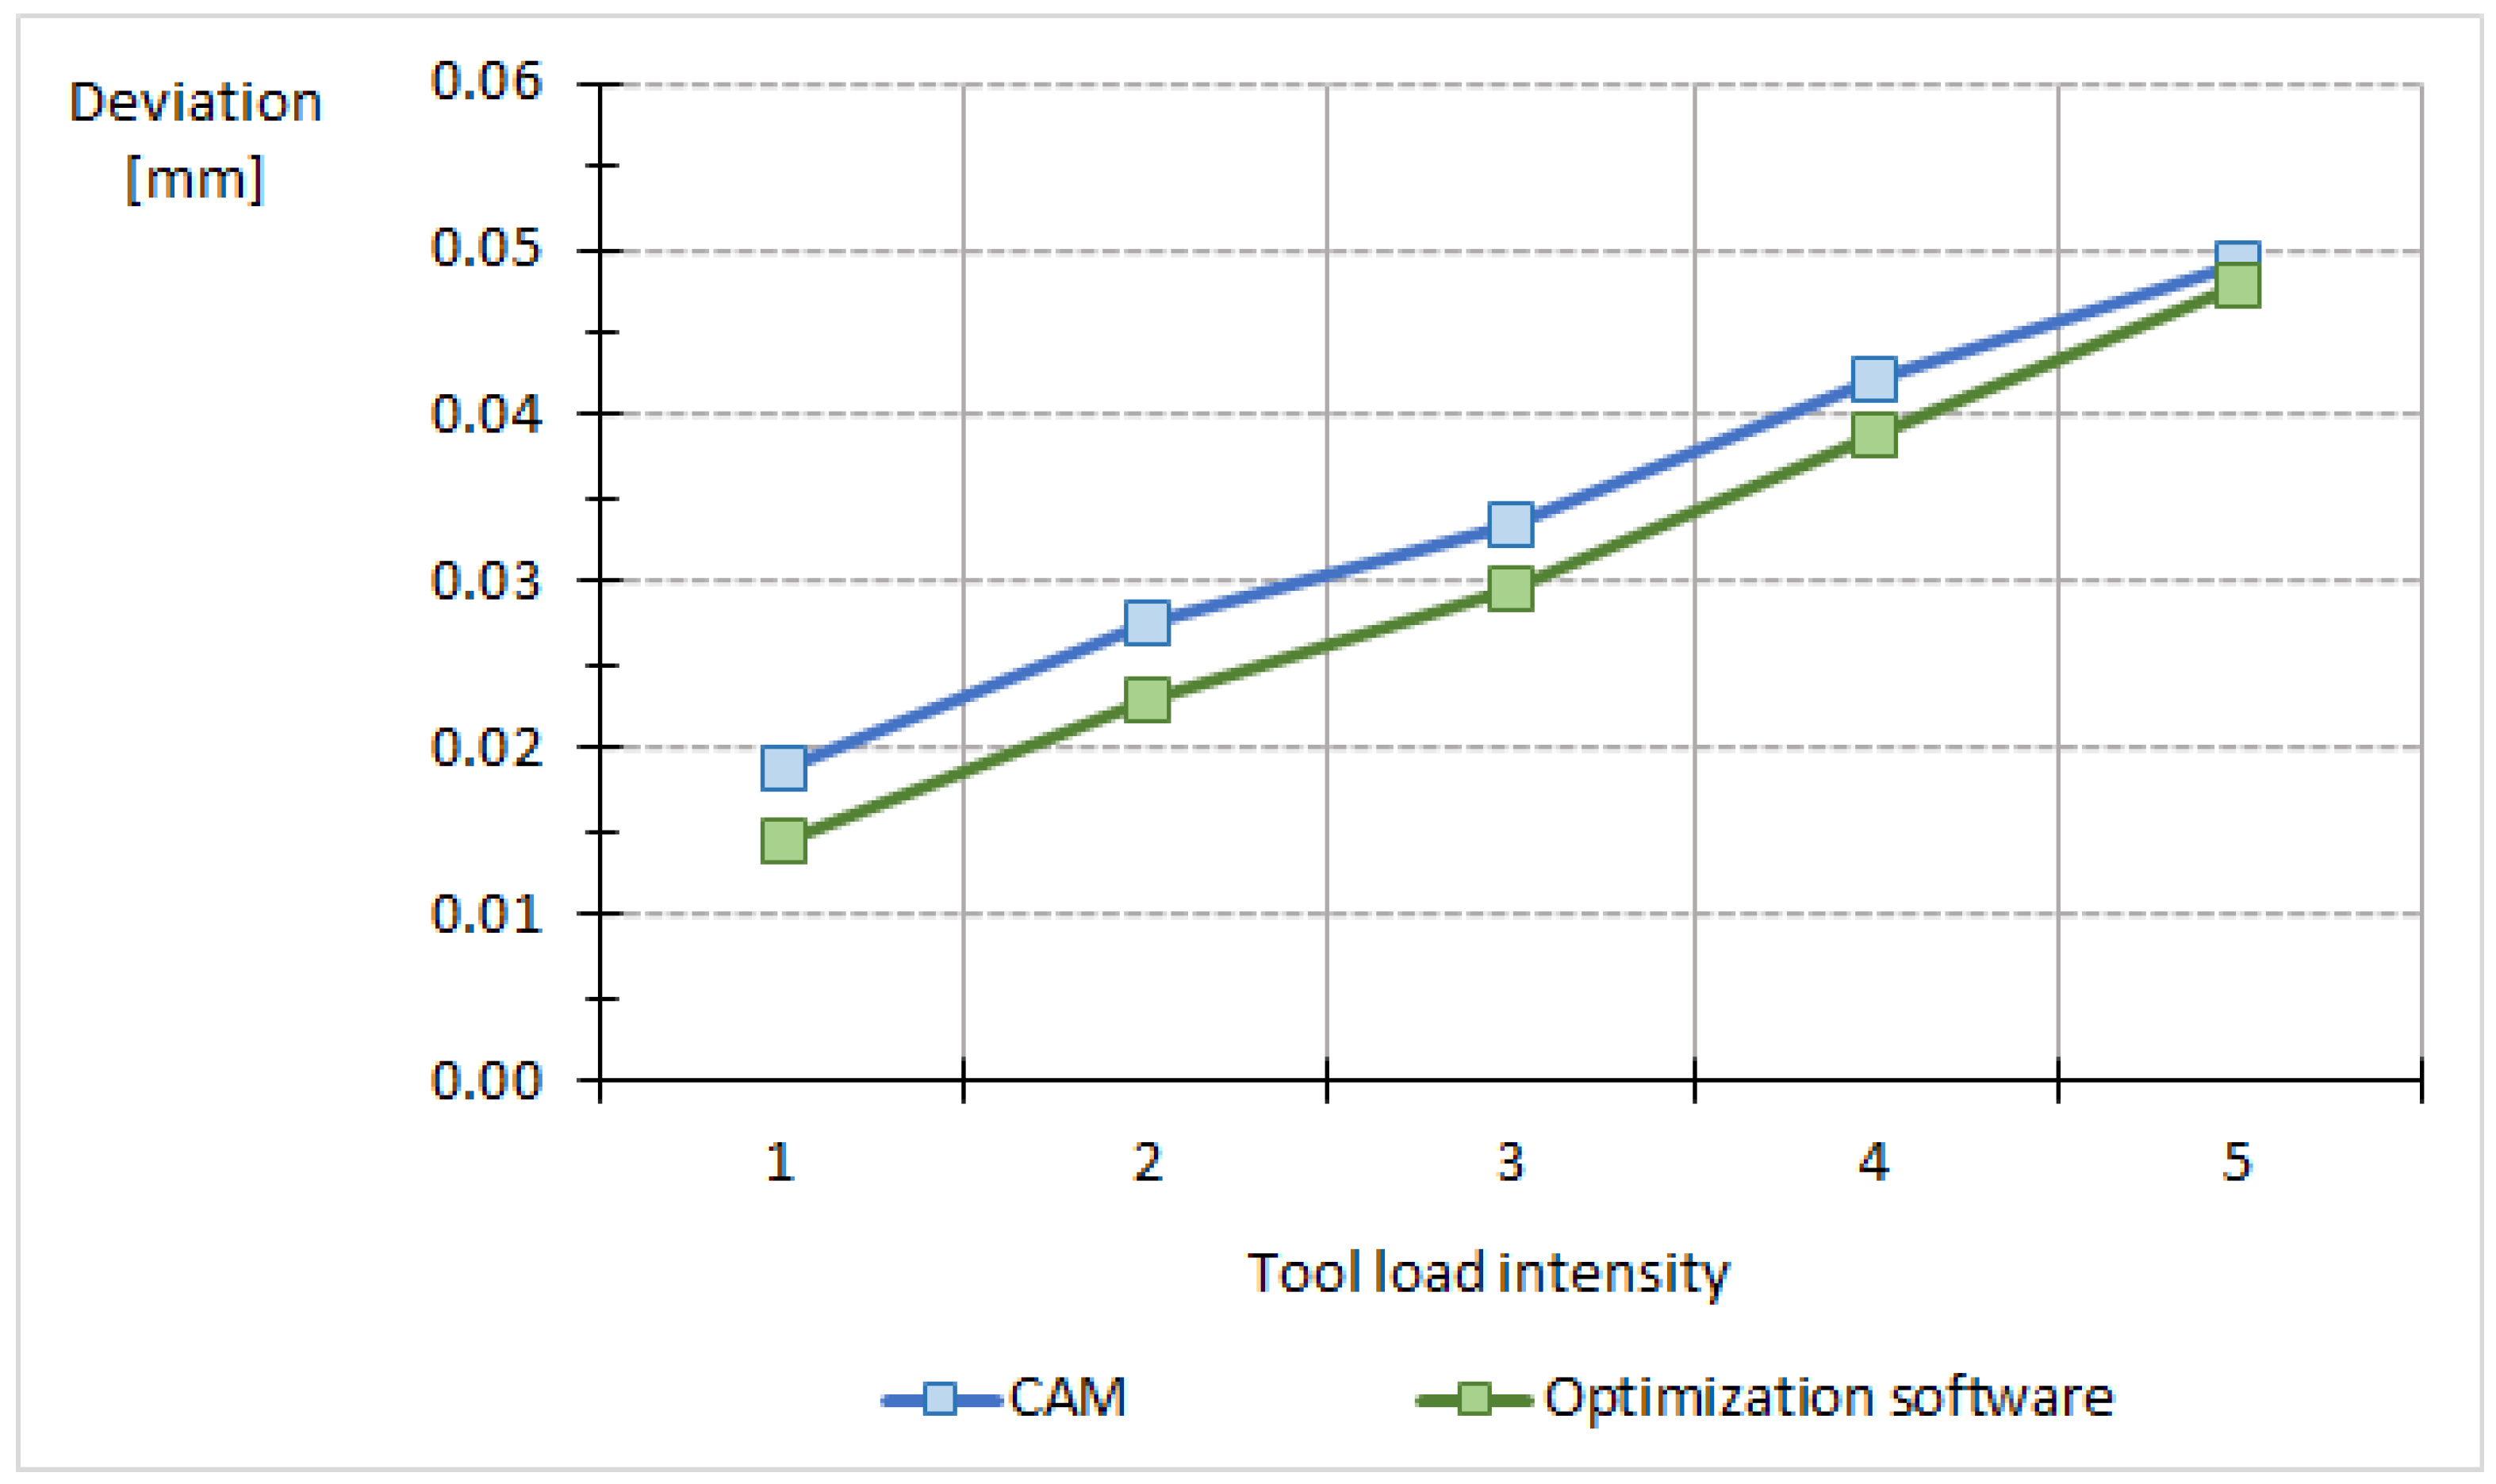
The graph in Figure 9 compares the mean deviations of the sidewalls produced by the CAM system and optimization software. In both cases, the deviations increased with increasing tool-load intensity. At each tool-load intensity, lower deviations were obtained using the optimization software. The difference in deviations decreased with increasing tool-load intensity; at intensity 1, the deviations were 23% lower, and at intensity 5, the deviations were 3% lower.

2.3. Deviations on the Horizontal Surfaces

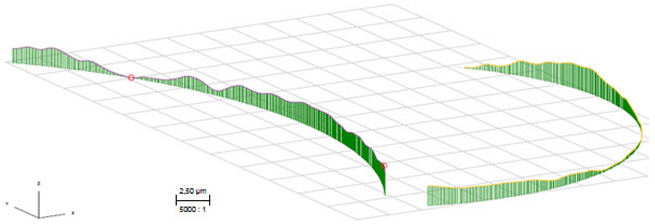
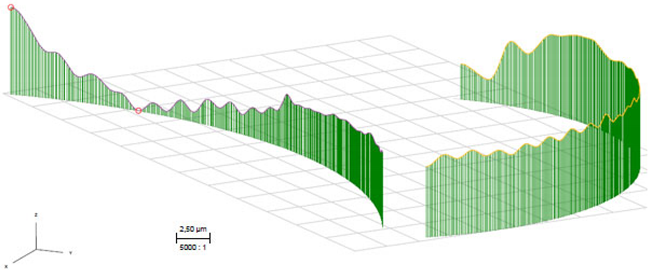
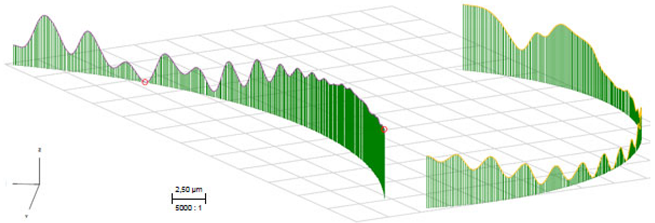
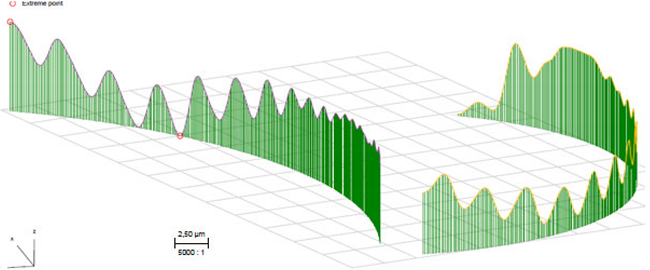
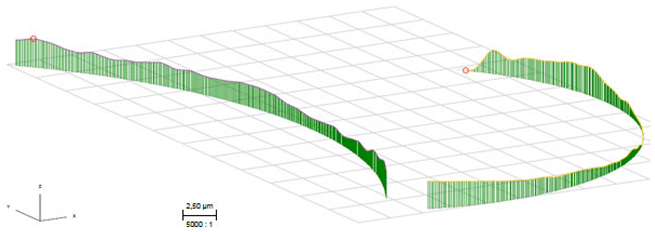
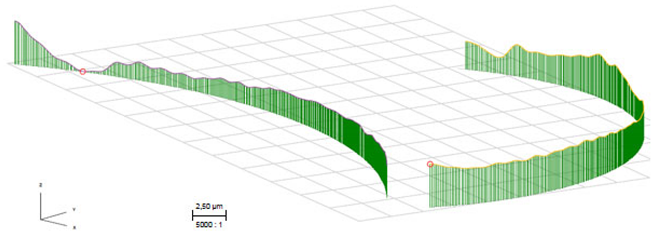
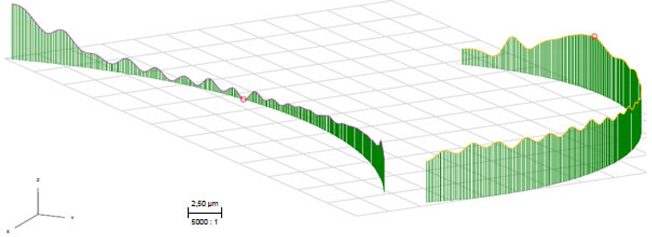
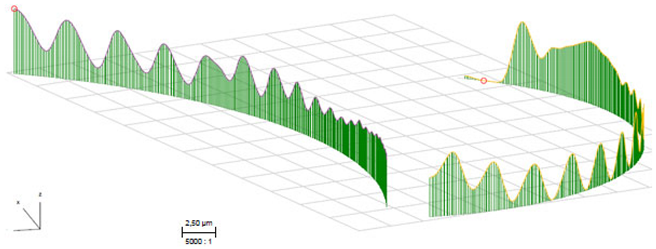
The measurement of the deviations at the bottom was performed on two separate curves offset from the pocket walls. Measurements were taken at 805 points.
The courses of deviation at the bottom of the pockets made with the NC programs from the CAM system are shown in Table 5. The smallest maximum deviation was 3.2 µm at tool-load intensity 1 and the largest was 11.4 µm at intensity 5.
The courses of the deviations in the sample made with the NC programs from the optimization software are shown in Table 6. With increasing tool-load intensity, the maximum deviation values increased, and the smallest and largest maximum deviations were 3.6 and 8.3 µm at intensities 1 and 5, respectively.
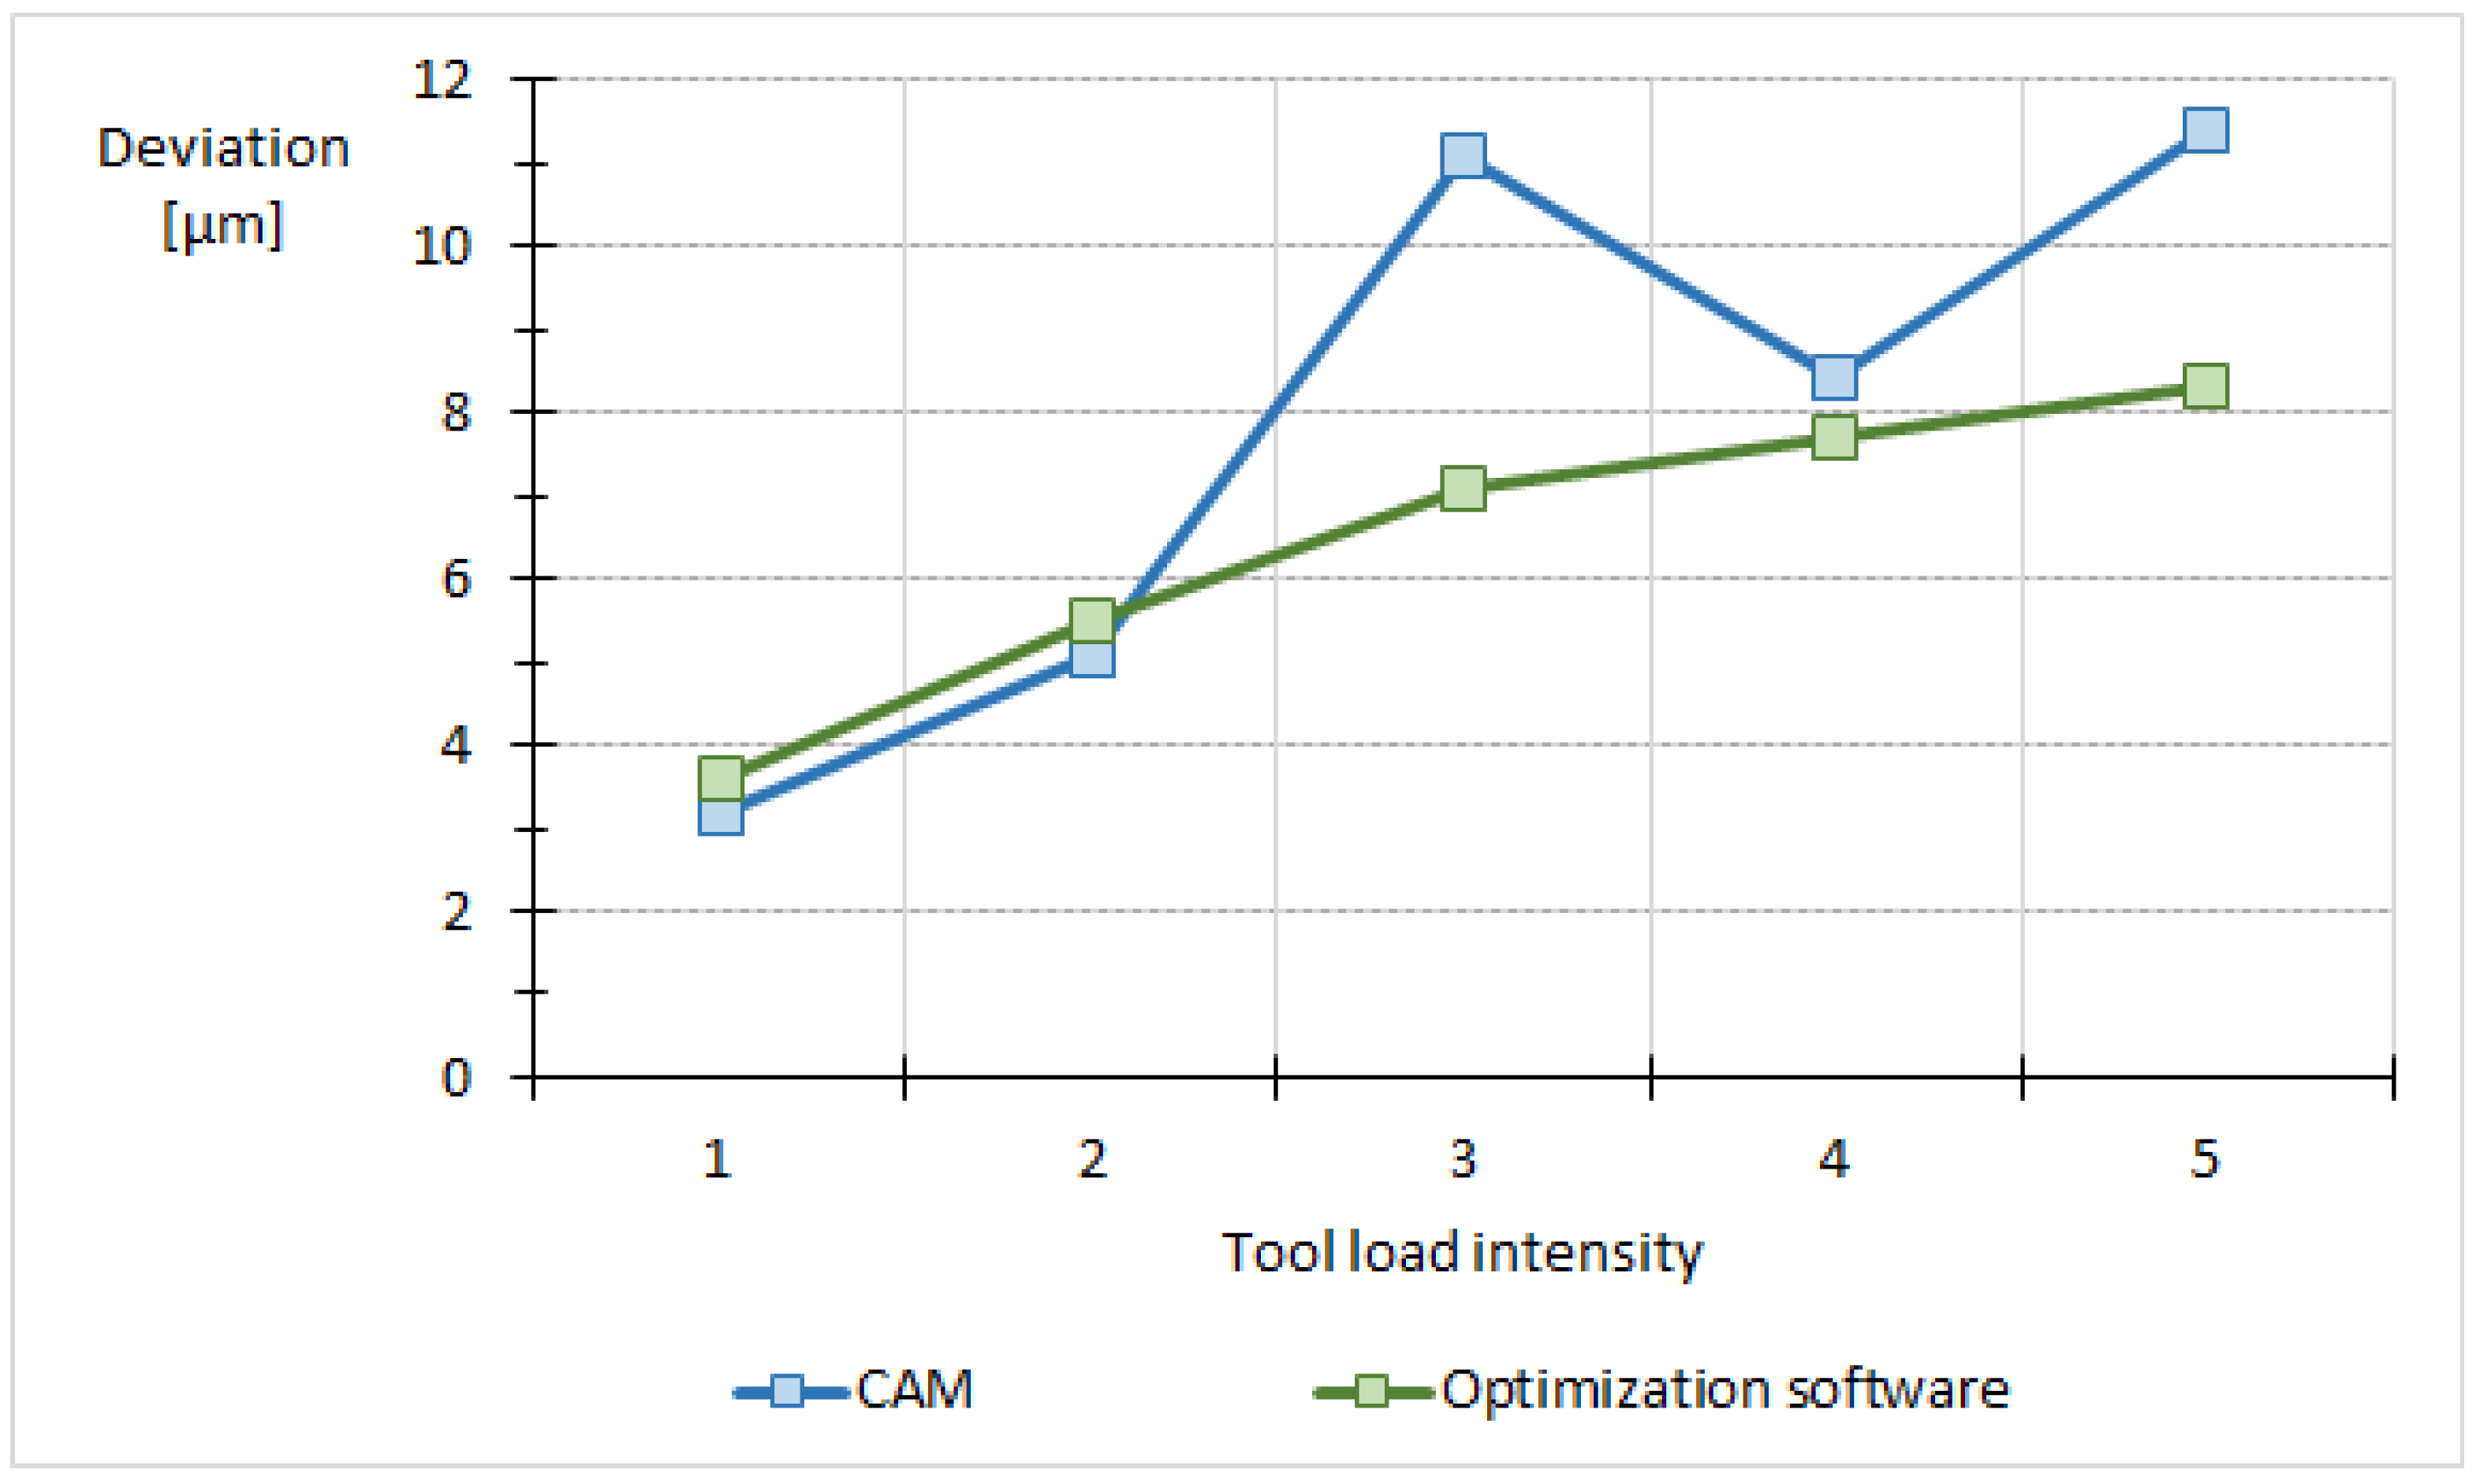
A comparison of the maximum values of the deviations at the bottom of the pockets is presented in Table 7, and in the graph in Figure 10. The deviations increase with increasing tool-load intensity, except for the deviation of the pocket made using the NC program from the CAM system at an intensity of 3. In two cases (i.e., tool-load intensities 1 and 2), the deviations were larger when the optimization software was used, whereas in the remaining three cases, the deviations were larger when the CAM software was used.

2.4. Comparison of Machining Times

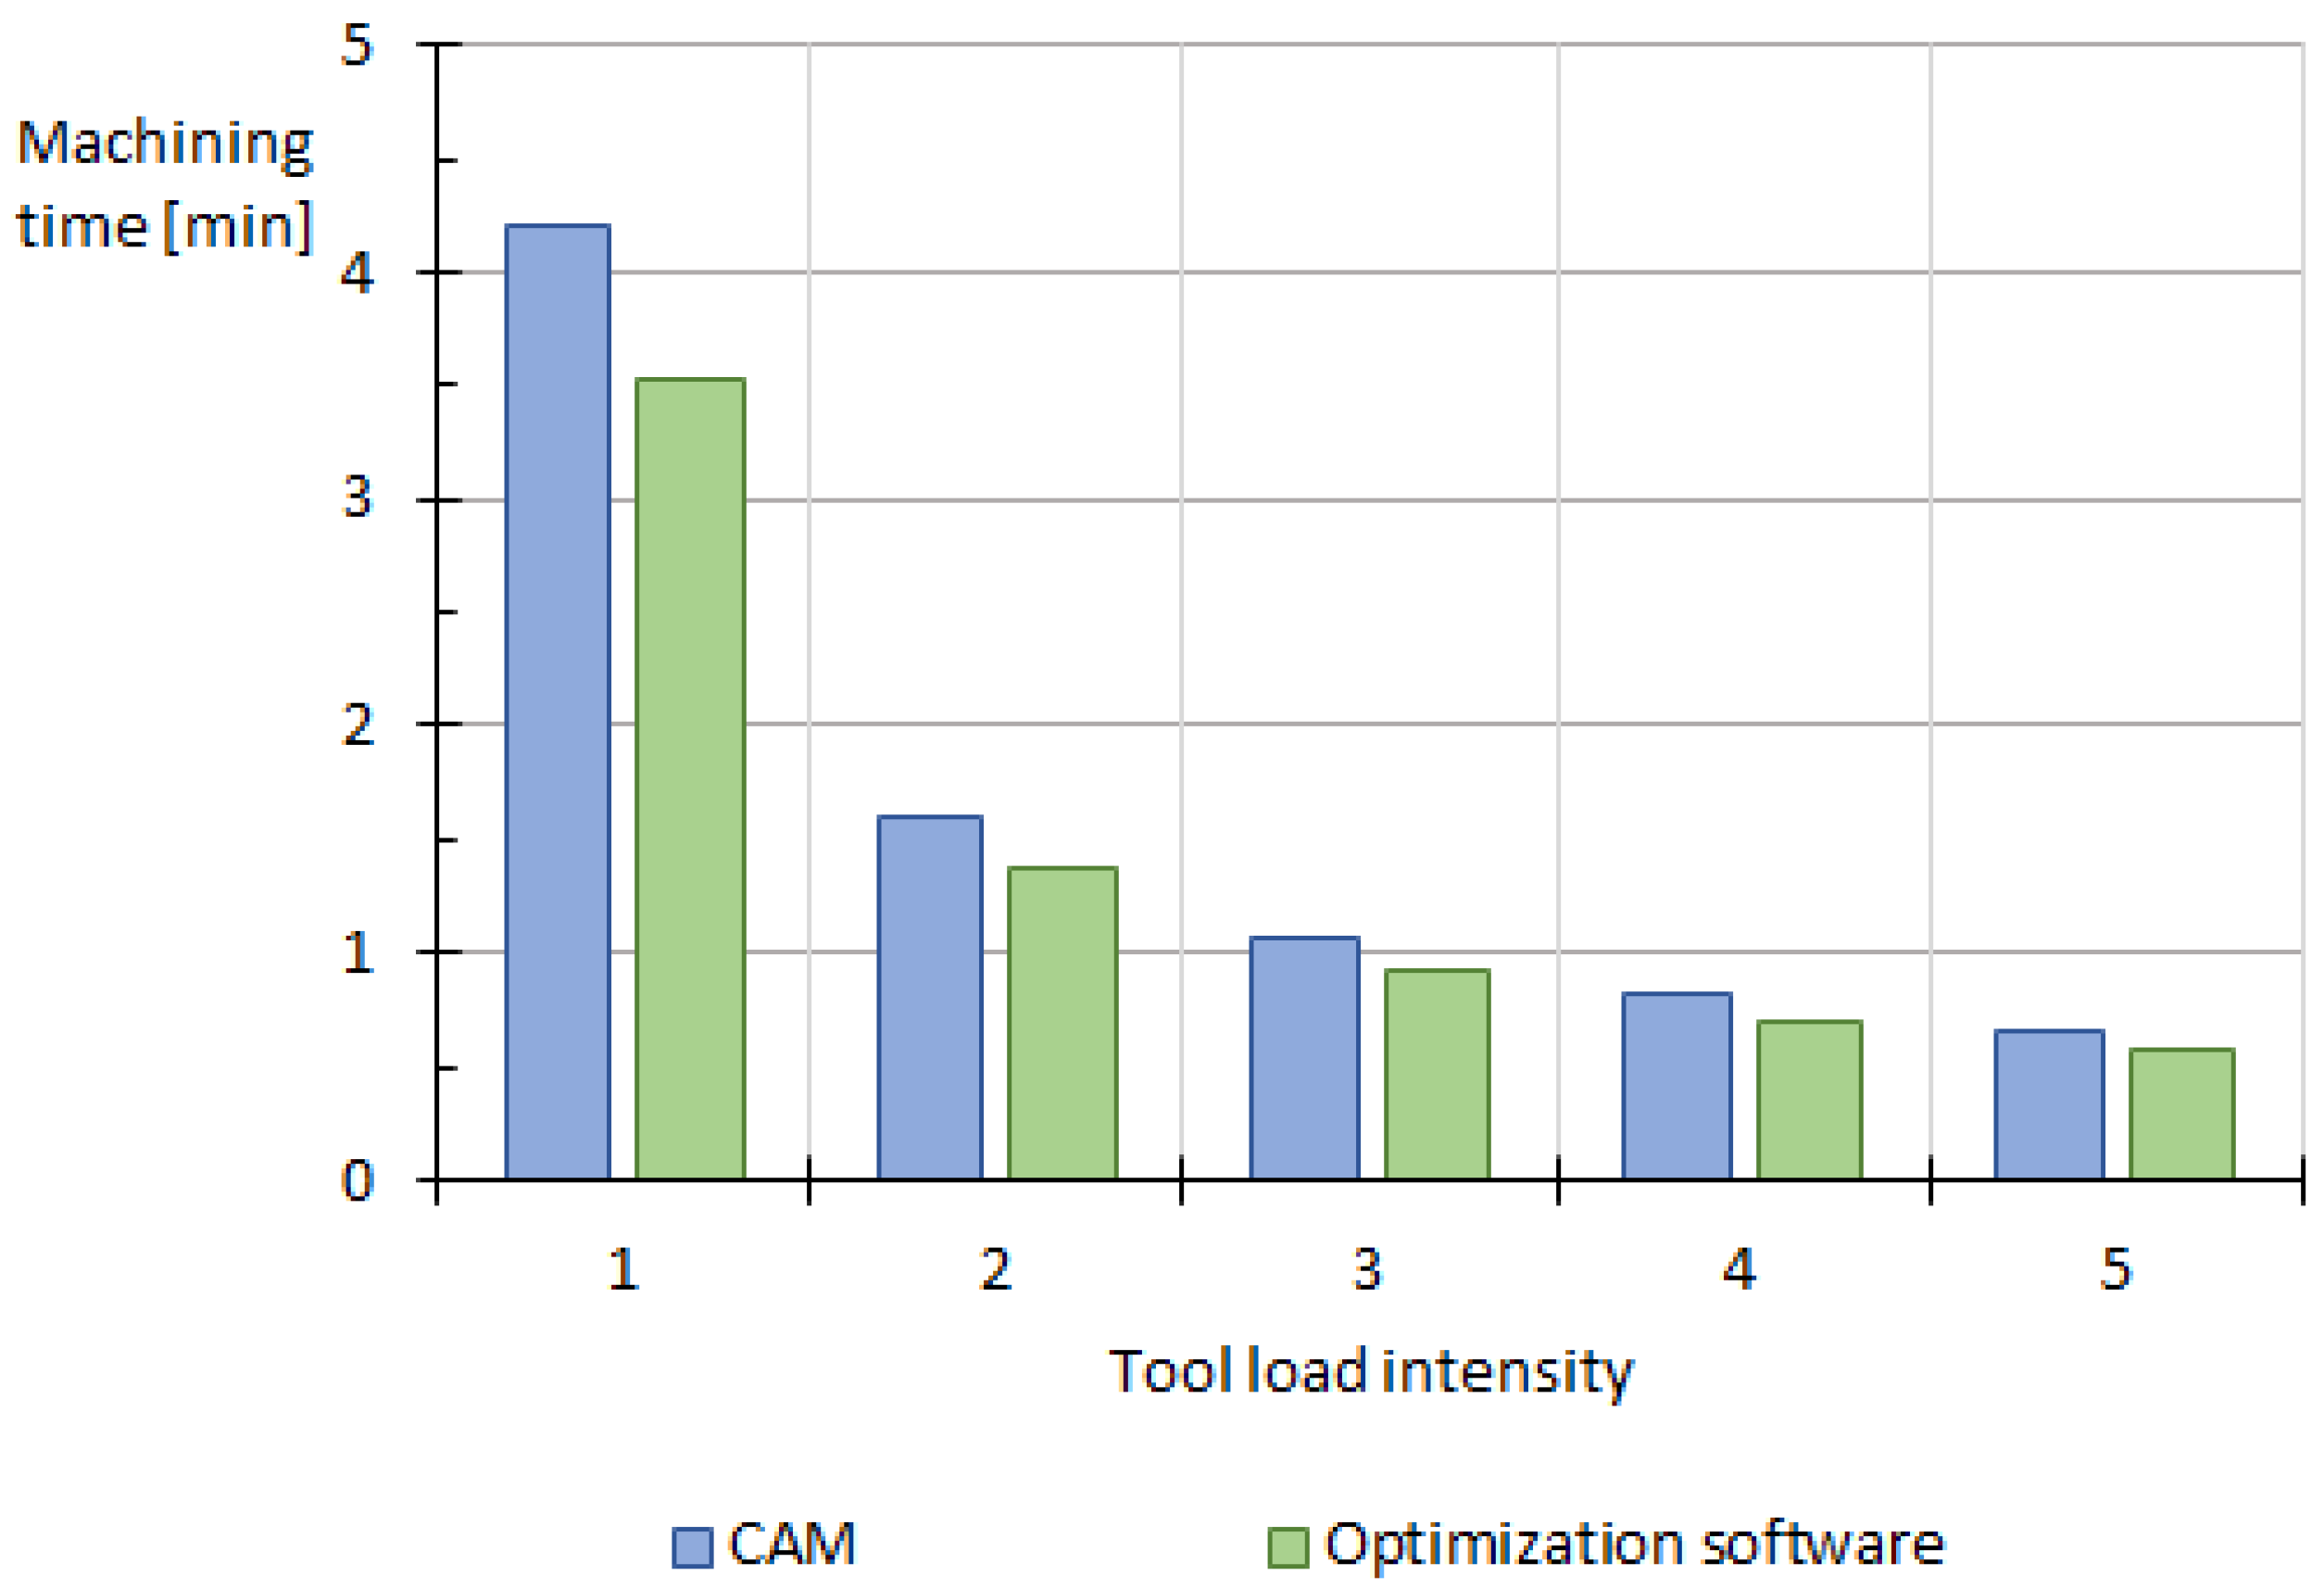
To evaluate the effectiveness of the optimization software, the time data from the simulation in the CAM system were first compared with the time data from the simulation in the optimization software. Simultaneously, the optimization software provided data on the expected time savings. The simulation times and expected time savings are presented in Table 8. As the tool-load intensity increased, the machining time decreased, and the expected time savings also decreased (from 17.8 to 14.0%).
Real production times were recorded directly using the machine control system. The measurement was started by spinning the tool and was completed after the tool was removed and its rotation stopped. For pockets made with NC programs from the CAM system, the real machining time was longer than the simulated time in all cases. Even for pockets made with optimized NC programs, the machining time was longer than that in the simulation. The real-time savings ranged from 15.9 to 12.8% for tool-load intensities of 1 and 5, respectively. The results are presented in Table 9.
The graph in Figure 11 presents the machining times. With increasing tool-load intensity, the machining times were shortened using NC programs from both the CAM system and optimization software. As the intensity increased, the benefit of the optimization software decreased.
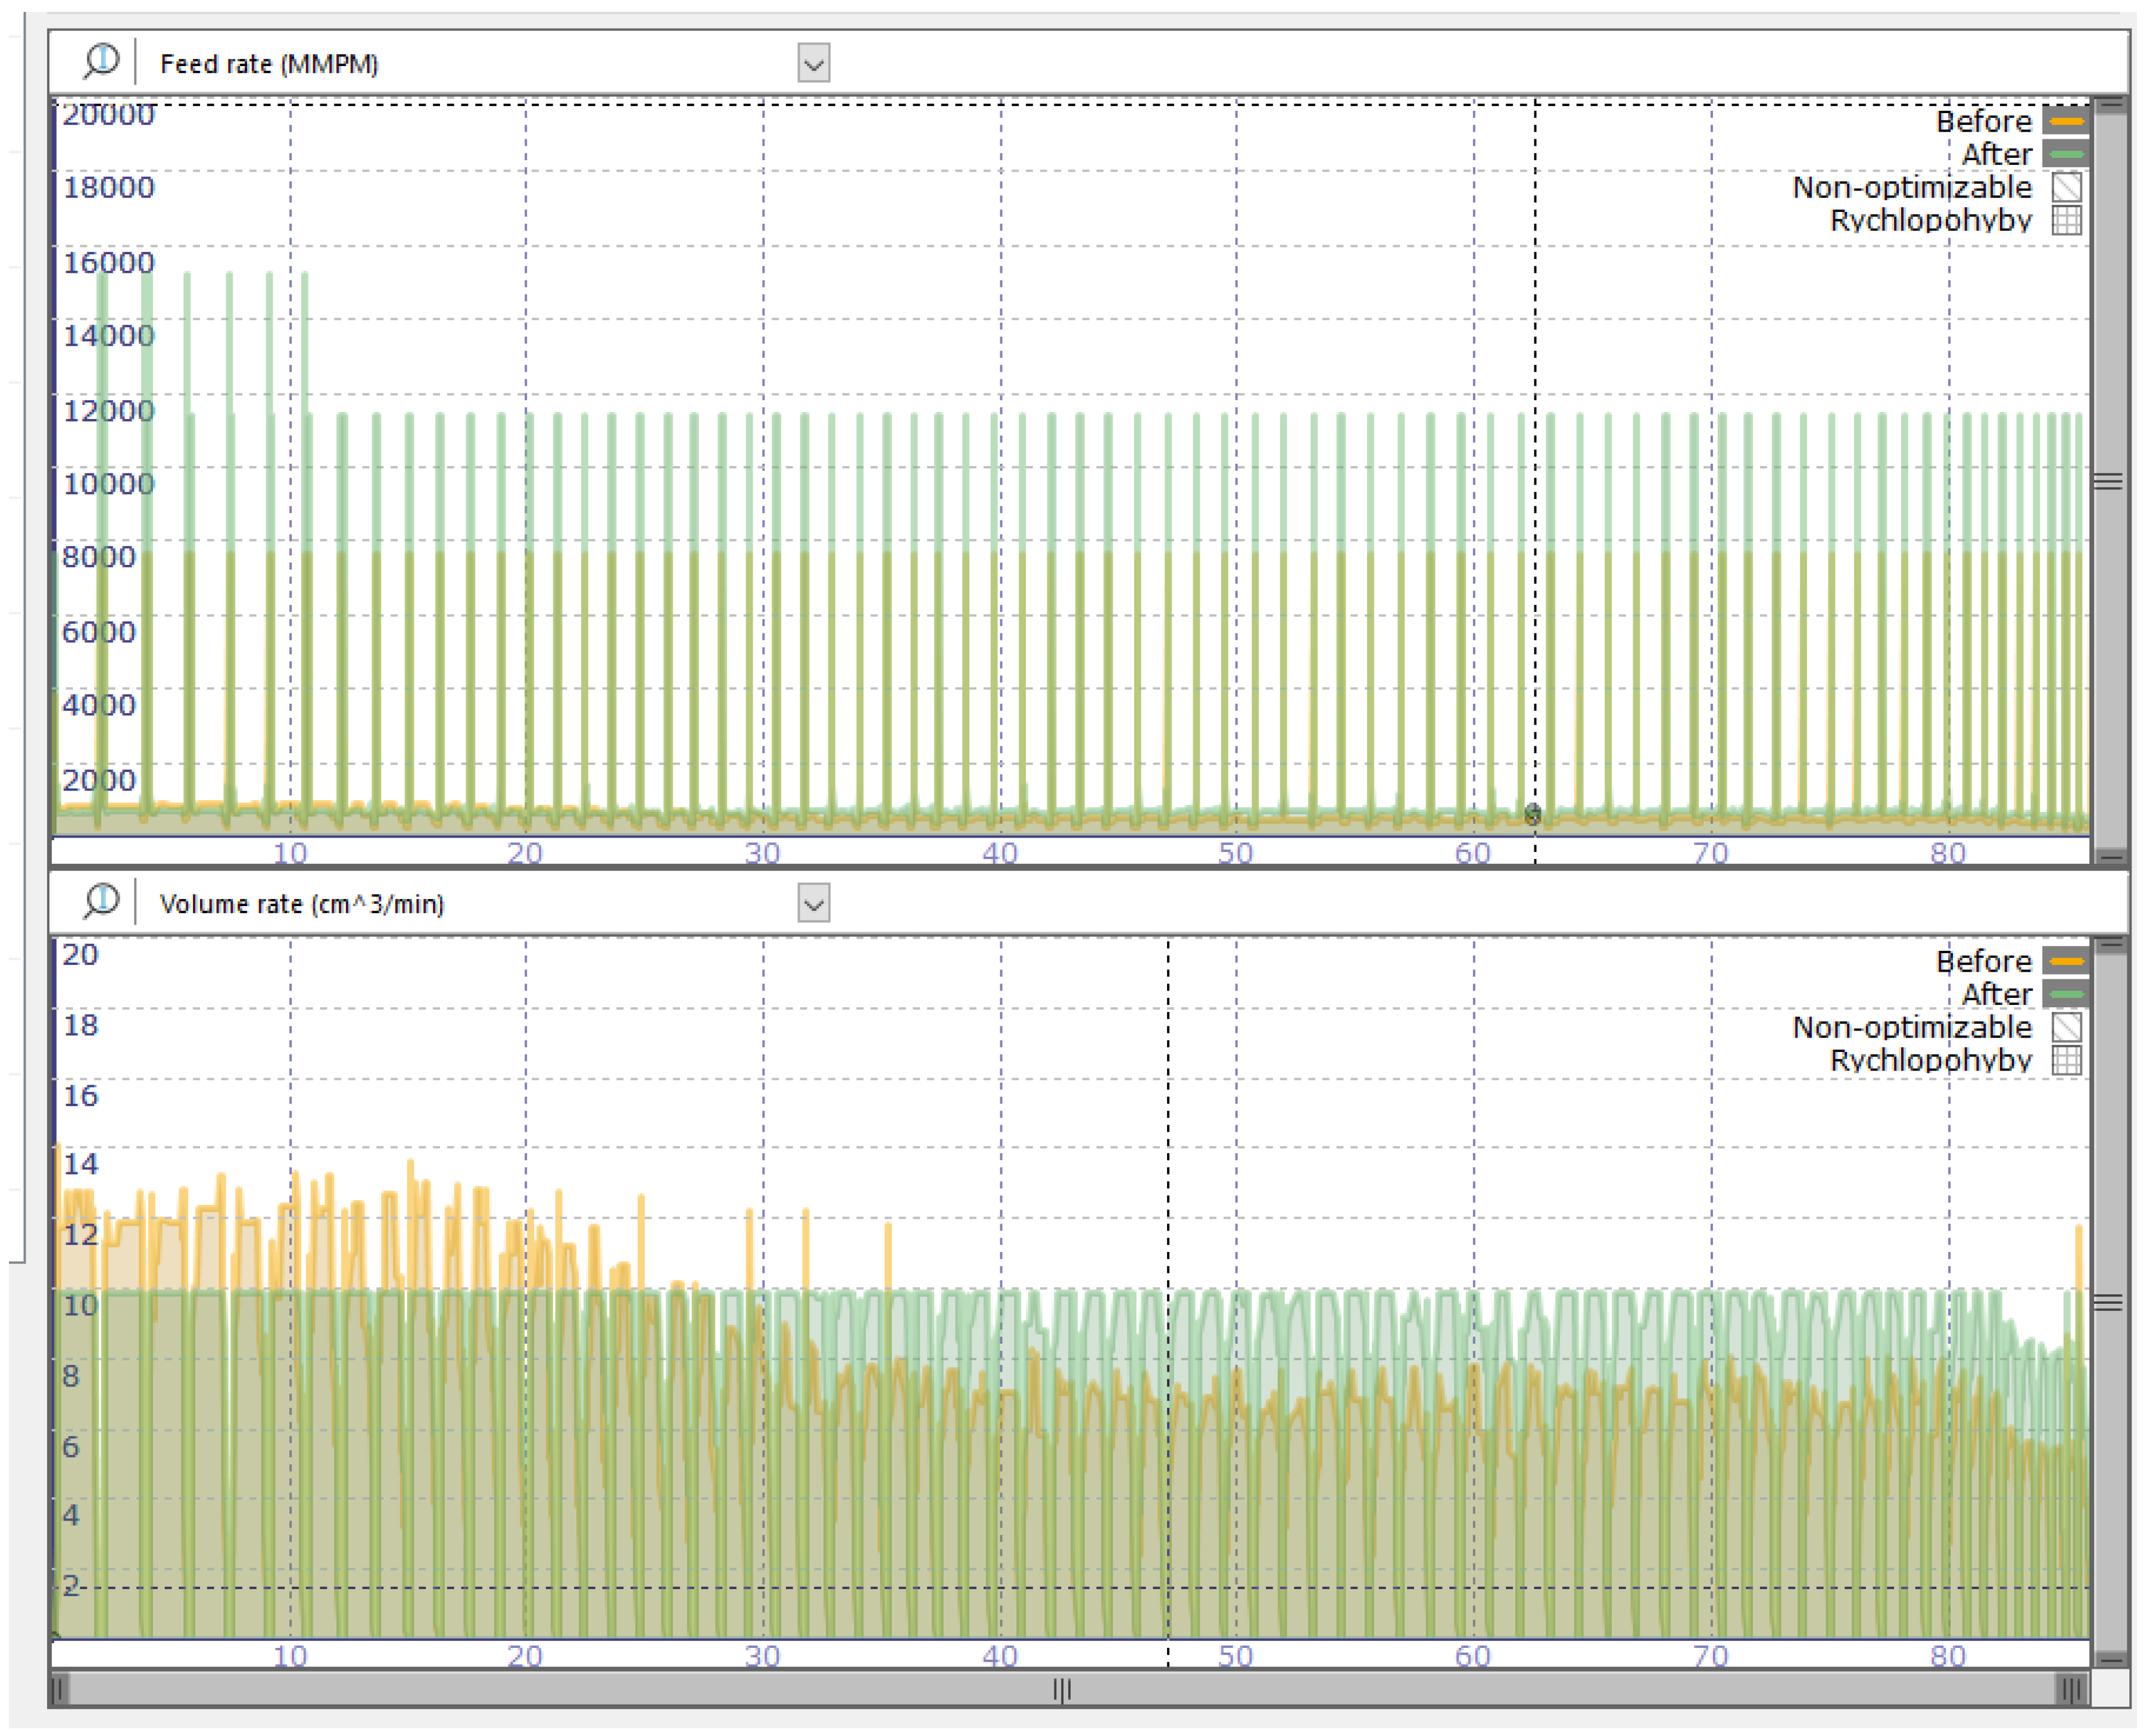
The operating principle of the optimization software is shown in Figure 12. The upper part of the image shows the adjustment of feed rate values. The lower part of the figure shows the adjustment of the material volume removal. These adjustments reduced the peak load of the tool and increased the feed in places with a low load. The graphs are for a pocket made with a tool-load intensity of 1.
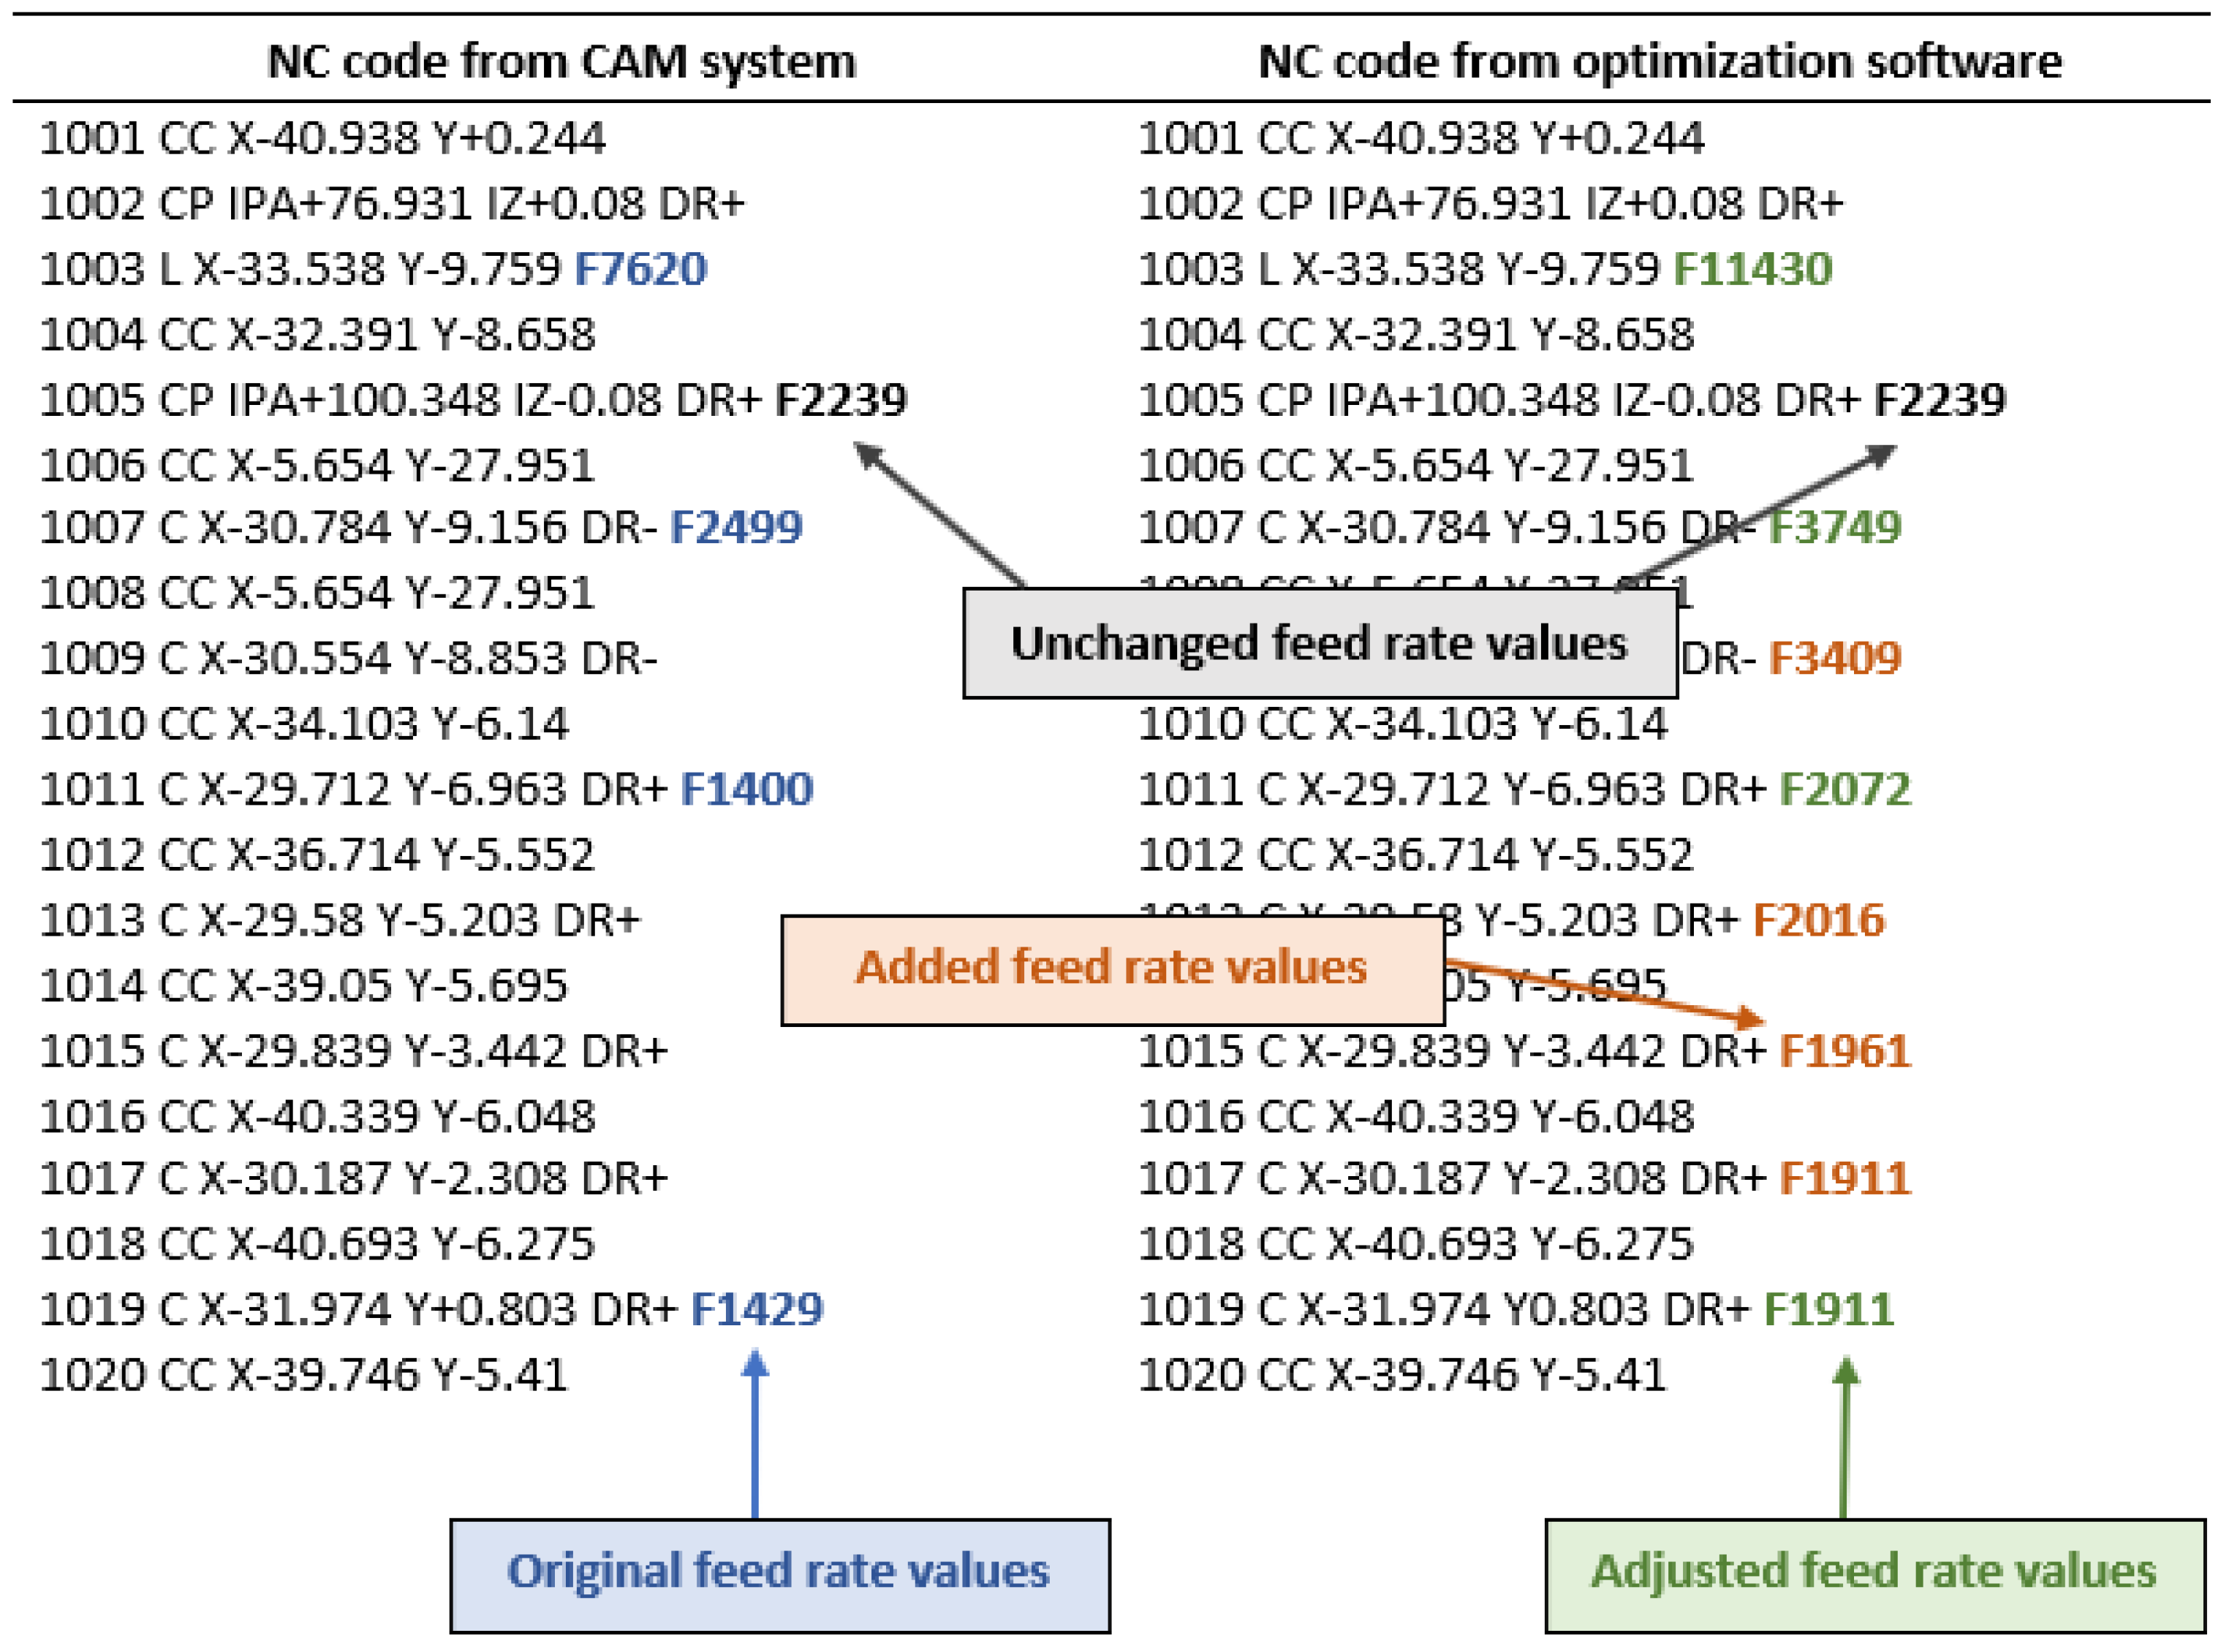
Figure 13 compares portions of the original and optimized NC codes. The optimization software interferes with the NC code by modifying the feed rate values. In the displayed part of the program, the optimized feed rate values were increased; in only one case, the value was unchanged (block 1005). The software added a command for setting the feed rate to some NC code blocks (e.g., block 1017), thus optimizing the feed rate even at short distances. The NC code shown is for a pocket made with a tool-load intensity of 3.

3. Conclusions

In this study, the benefits of a software designed to optimize NC programs generated by a CAM system were experimentally investigated. The samples prepared by the two groups of NC programs were compared. In the first group, the NC program was in its original CAM-system-generated state. In the second group it was optimized. Based on the obtained results, the following conclusions can be drawn:
  • Despite the intensification of the cutting conditions by the optimization software, there was no increase in the deviations of the produced sidewall surfaces. In contrast, at each tool-load intensity, lower deviations, ranging from 3 to 23%, were achieved using the optimization software. Thus, optimization software can be used without enlarging the side-finishing allowances.
  • On horizontal surfaces, the optimization software caused an increase in deviations at the two lowest tool-load intensities (by 12.5 and 7.8%). For the other three load intensities, a decrease in the deviations was observed from 8.3 to 36%. Using the optimization software, the deviations increased evenly with increasing tool load. Owing to the use of absolute deviations in the optimization software, it was not necessary to increase the finishing allowances.
  • There was a reduction in the machining times in all cases, regardless of the cutting tool presetting load. At the lowest set load intensity, a time saving of 15.9% was achieved. With increasing load intensity, the time saving decreased; however, even the lowest achieved time saving of 12.8% is a great benefit for practical use.
The results demonstrated the validity of using optimization software and promote knowledge on the use of offline optimization tools. The reviewed literature focused on purpose-built software, which in some cases also requires monitoring the ongoing machining process. This study evaluated an easily accessible solution based on the use of commercial software that does not require interventions in the CNC machine. Compared to experimentally designed software in the reviewed literature, the reduction in machining time was not as significant, but the major advantages included versatility and availability. The expanding range of optimization software and its ease of use creates conditions for its rapid expansion in both experimental and practical activities.
Future follow-up work aims to verify the effectiveness of the optimization software:
  • when compared with other CAM systems,
  • when deployed on machine tools with a different control system,
  • during five-axis milling of shaped surfaces.

Author Contributions

Conceptualization, P.I. and M.V.; methodology, P.I.; software, M.D., J.B. and S.B.; validation, M.V., P.I. and M.D.; formal analysis, S.B.; investigation, J.B.; resources, P.I.; data curation, P.I.; writing—original draft preparation, P.I. and M.V.; writing—review and editing, S.B.; visualization, P.I. and M.D.; supervision, M.V.; project administration, P.I.; funding acquisition, M.V. All authors have read and agreed to the published version of the manuscript.

Funding

This study was funded by the Scientific Grant Agency of the Ministry of Education of the Slovak Republic (projects VEGA 1/0457/21 and KEGA 048TUKE-4/2020).

Institutional Review Board Statement

Not applicable.

Informed Consent Statement

Not applicable.

Conflicts of Interest

The authors declare no conflict of interest.

References

  1. Singh, P.K.; Saini, P.; Kumar, D. Multi response optimization of CNC end milling of AISI H11 alloy steel for rough and finish machining using TGRA. Mater. Today Proc. 2020, 26, 2564–2573. [Google Scholar] [CrossRef]
  2. Zhang, X.; Pan, T.; Ma, A.; Zhao, W. High efficiency orientated milling parameter optimization with tool wear monitoring in roughing operation. Mech. Syst. Signal Process. 2022, 165, 108394. [Google Scholar] [CrossRef]
  3. Urbikain Pelayo, G.; Olvera-Trejo, D.; Luo, M.; Tang, K.; López de Lacalle, L.N.; Elías-Zuniga, A. A model-based sustainable productivity concept for the best decision-making in rough milling operations. Measurement 2021, 186, 110120. [Google Scholar] [CrossRef]
  4. Feng, C.; Guo, H.; Zhang, J.; Huang, Y.; Huang, S. A systematic method of optimization of machining parameters considering energy consumption, machining time, and surface roughness with experimental analysis. Int. J. Adv. Manuf. Technol. 2022, 119, 7383–7401. [Google Scholar] [CrossRef]
  5. Li, W.; Li, B.; He, S.; Mao, X.; Qiu, C.; Qiu, Y.; Tan, X. A novel milling parameter optimization method based on improved deep reinforcement learning considering machining cost. J. Manuf. Process. 2022, 84, 1362–1375. [Google Scholar] [CrossRef]
  6. Zoghipour, N.; Yaratan, A.F.; Kaynak, Y. Multi objective optimization of rough pocket milling strategies during machining of lead-free brass alloys using Desirability function and Genetic algorithms-based analysis. Procedia CIRP 2021, 99, 145–150. [Google Scholar] [CrossRef]
  7. Ridwan, F.; Xu, X.; Ho, F.C.L. Adaptive execution of an NC program with feed rate optimization. Int. J. Adv. Manuf. Technol. 2012, 63, 1117–1130. [Google Scholar] [CrossRef]
  8. Xie, J.; Zhao, P.; Hu, P.; Yin, Y.; Zhou, H.; Chen, J.; Yang, J. Multi-objective feed rate optimization of three-axis rough milling based on artificial neural network. Int. J. Adv. Manuf. Technol. 2021, 114, 1323–1339. [Google Scholar] [CrossRef]
  9. Plaza, M.; Zebala, W. A decision model for investment analysis in CNC centers and CAM technology. Comput. Ind. Eng. 2019, 131, 565–577. [Google Scholar] [CrossRef]
  10. Beňo, J.; Ižol, P.; Tomáš, M.; Varga, J. A fragmentation based approach to the free form surface milling. Acta Mech. Slov. 2015, 19, 26–32. [Google Scholar] [CrossRef]
  11. CGTech. Feed Rate Optimization. Available online: https://cgtech.com/feed-rate-optimization (accessed on 14 June 2022).
  12. Ižol, P.; Vrabeľ, M.; Maňková, I. Comparison of milling strategies when machining freeform surfaces. In MSF; Materials Science Forum—Novel Trends in Production Devices and Systems; Trans Tech Publications Ltd.: Stafa-Zurich, Switzerland, 2016; Volume 862, pp. 18–25. [Google Scholar] [CrossRef]
  13. Heidenhain. Dynamic Efficiency—Effizient und Prozesssicher Bearbeiten. Available online: https://www.heidenhain.de/fileadmin/pdf/de/01_Produkte/Technische_Dokumentation/TI_Dynamic_Efficiency_ID1081192_de.pdf (accessed on 17 March 2022).
  14. Park, H.-S.; Qi, B.; Dang, D.-V.; Park, D.Y. Development of smart machining system for optimizing feedrates to minimize machining time. J. Comp. Des. Eng. 2018, 5, 299–304. [Google Scholar] [CrossRef]
  15. Liu, X.; Ding, Y.-P.; Yue, C.; Zhang, R.; Tong, X. Off-line feedrate optimization with multiple constraints for corner milling of a cavity. Int. J. Adv. Manuf. Technol. 2016, 82, 1899–1907. [Google Scholar] [CrossRef]
  16. Lee, C.-H.; Yang, F.; Zhou, H.; Hu, P.; Min, K. Cross-directional feed rate optimization using tool-path surface. Int. J. Adv. Manuf. Technol. 2020, 108, 2645–2660. [Google Scholar] [CrossRef]
  17. Gassara, B.; Baili, M.; Dessein, G.; Hbaieb, M.; Saï, W.B. Feed rate modeling in circular–circular interpolation discontinuity for high-speed milling. Int. J. Adv. Manuf. Technol. 2013, 65, 1619–1634. [Google Scholar] [CrossRef] [Green Version]
  18. Rattunde, L.; Laptev, I.; Klenske, E.D.; Möhring, H.-C. Safe optimization for feedrate scheduling of power-constrained milling processes by using Gaussian processes. Procedia CIRP 2021, 99, 127–132. [Google Scholar] [CrossRef]
  19. Eureka. Eureka Chronos. Available online: https://www.roboris.it/wp-content/uploads/2021/04/Chronos-Eng-042021.pdf (accessed on 15 March 2022).
  20. Ceratizit Group. CircularLine—End Milling Cutter with Corner Radius. Available online: https://cuttingtools.ceratizit.com/gb/en/products/5359512002.html (accessed on 20 May 2022).
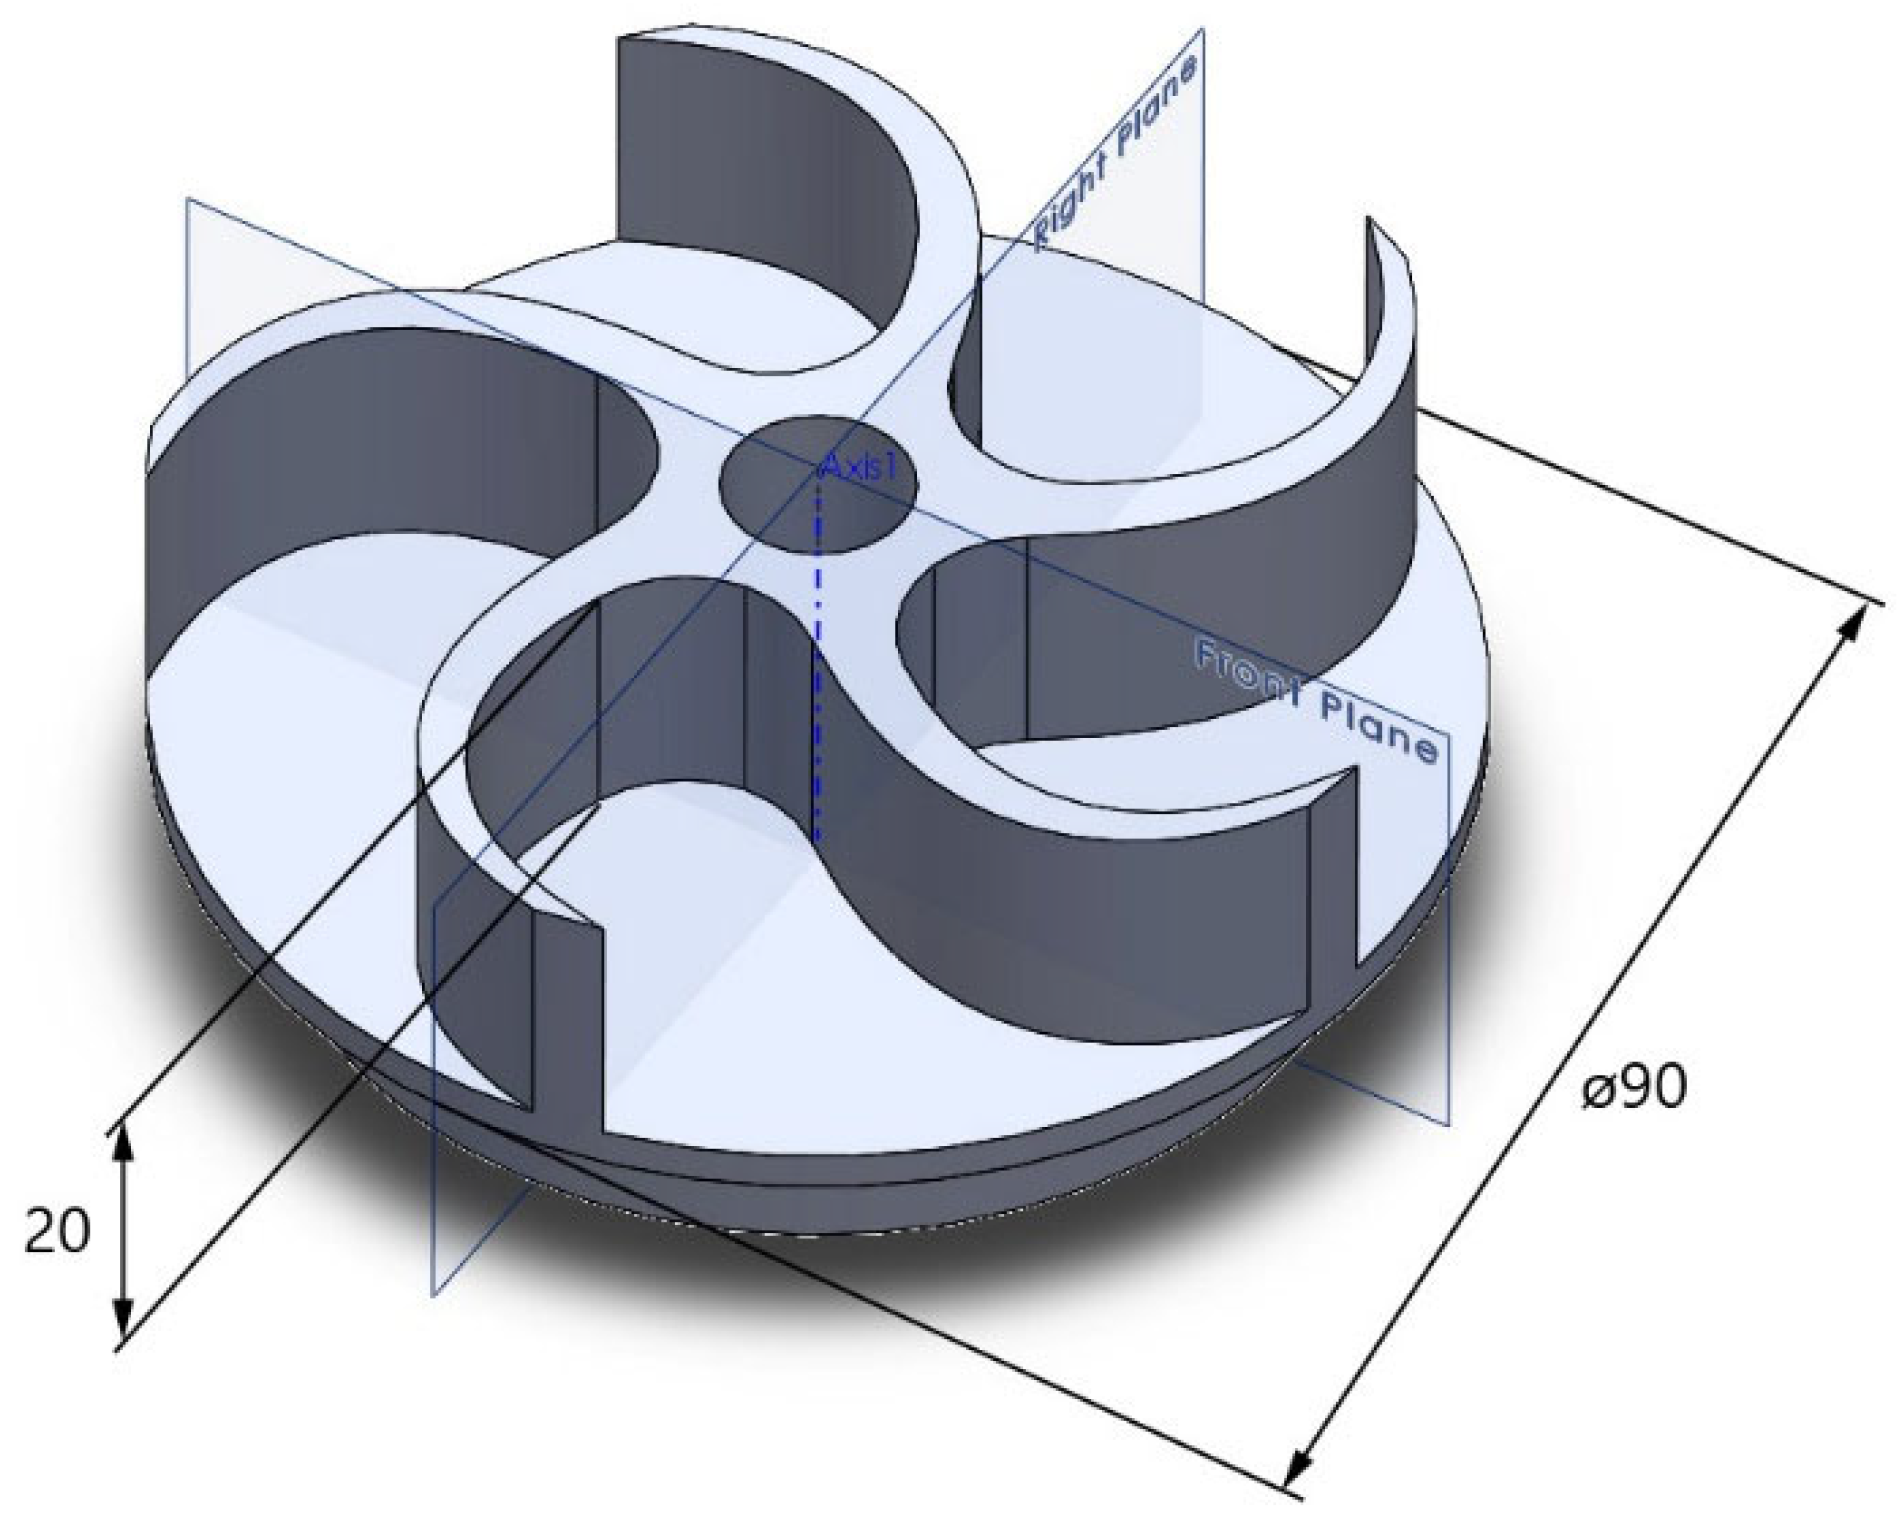
Figure 1. CAD model of the designed sample.
Machines 10 01212 g001
Figure 2. Setting the tool-load intensity in the CAM system (a) level 1 (b) level 5.
Machines 10 01212 g002
Figure 3. Toolpaths with an indication of the degree of load intensity of the tool.
Machines 10 01212 g003
Figure 4. Machined samples (left) using standard NC programs, (right) using optimized NC programs.
Machines 10 01212 g004
Figure 5. Deviations on the sidewalls of the sample made with the CAM system.
Machines 10 01212 g005
Figure 6. Deviations on the sidewalls of the sample made with the optimization software.
Machines 10 01212 g006
Figure 7. Deviations on the sidewalls of the pockets made with the CAM system.
Machines 10 01212 g007
Figure 8. Deviations on the sidewalls of the pockets made with optimization software.
Machines 10 01212 g008
Figure 9. Comparison of mean deviations on the sidewalls of pockets made with CAM and optimization software.
Machines 10 01212 g009
Figure 10. Comparison of maximum deviations at the bottom of the pockets.
Machines 10 01212 g010
Figure 11. Comparison of real machining times.
Machines 10 01212 g011
Figure 12. Adjustment of feed rate and material-removal rate values by optimization software.
Machines 10 01212 g012
Figure 13. Comparison of NC codes from CAM system and optimization software.
Machines 10 01212 g013
Table 1. Maximum weight ratio of alloying elements [%] of material EN AW 5754.
SiFeCuMnMgCrZnTiOthers
0.40.40.10.53.60.30.20.150.15
Table 2. Parameters of the tool [20].
ød1
[mm]
ød2
[mm]
ød3
[mm]
r
[mm]
l1
[mm]
l2
[mm]
l3
[mm]
l4
[mm]
z
[–]
λs
[°]
γs
[°]
1211.6120.24960641094458
Sketch of the toolMachines 10 01212 i001
Table 3. Cutting parameters.
Tool-Load Intensity12345
Spindle speed [min−1]19844457560060756196
Feed rate [mm·min−1]7721754223924792592
Step over min–max [mm]0.38–0.800.40–1.110.40–1.470.40–1.860.39–2.29
Table 4. Comparison of sidewall deviations of samples.
Tool-Load IntensityCAMOptimization Software
Maximum Negative Deviation
[mm]
Maximum
Positive
Deviation
[mm]
Mean Deviation
[mm]
Maximum Negative Deviation
[mm]
Maximum
Positive
Deviation
[mm]
Mean Deviation
[mm]
1−0.0200.0430.019−0.0170.0560.014
2−0.0660.0670.028−0.0270.0630.023
3−0.0700.0730.033−0.0340.0740.030
4−0.0440.1330.042−0.0410.1060.039
5−0.0500.1170.049−0.0500.1280.048
Table 5. Deviations at the bottom of the pockets made with the CAM system.
Tool-Load IntensityCourse of Deviations
1Machines 10 01212 i002
2Machines 10 01212 i003
3Machines 10 01212 i004
4Machines 10 01212 i005
5Machines 10 01212 i006
Table 6. Deviations at the bottom of the pockets made with the optimization software.
Tool-Load IntensityCourse of Deviations
1Machines 10 01212 i007
2Machines 10 01212 i008
3Machines 10 01212 i009
4Machines 10 01212 i010
5Machines 10 01212 i011
Table 7. Comparison of the maximum values of deviations at the bottom of the pockets.
Deviations [µm]
Tool-Load Intensity12345
CAM3.25.111.18.411.4
Optimization software3.65.57.17.78.3
Table 8. Machining times from simulations and expected time savings.
Tool-Load IntensityCAM
Simulated Time [Min]
Optimization Software
Simulated Time [Min]Estimated Time Saved [%]
14:003:1717.92
21:231:0916.87
30:530:4416.98
40:380:3313.16
50:310:2616.13
Table 9. Real machining times and real-time savings.
Tool-Load IntensityCAM
Real Time [Min]
Optimization Software
Real Time [Min]Real Time Saved [%]
14:123:3215.9
21:361:2214.6
31:040:5514.1
40:490:4214.3
50:390:3412.8
Publisher’s Note: MDPI stays neutral with regard to jurisdictional claims in published maps and institutional affiliations.