Article

A Study of 2D Contour Measurement System at Tool Center Point of Machine Tools

1
Graduate Institute of Precision Manufacturing, National Chin-Yi University of Technology, Taichung 411030, Taiwan
2
Department of Mechanical Engineering, National Chung Hsing University, Taichung 402202, Taiwan
3
Department of Vehicle Engineering, National Formosa University, Yunlin 632301, Taiwan
*
Author to whom correspondence should be addressed.
Machines 2022, 10(12), 1199; https://doi.org/10.3390/machines10121199
Submission received: 10 November 2022 / Revised: 4 December 2022 / Accepted: 7 December 2022 / Published: 10 December 2022

Abstract

:
This study proposes a 2D contour measurement system at the tool center point (TCP) that consists of a Blu-ray pickup head and position sensitive detector (PSD). The TCP displacement is equivalent to the relative position between the tool and workpiece. When the machine tools operate the machine part along the desired contour, the TCP displacement affects the machining geometric accuracy. To evaluate the TCP displacement, the contour errors are measured by the cross-grid encoder (KGM) in practice. However, it is difficult to install KGM as it is large and expensive. In this study, an optical measurement system (OMS) is constructed to measure the TCP displacement, named TCP-OMS. A Blu-ray pickup head was installed on the spindle as a tool, and a PSD was installed on the table as a workpiece. To enhance the measurement signal’s resolution and precision of TCP-OMS, the noise was reduced by an AC voltage stabilizer, a DC regulator, and a low-pass filter. The experimental results show that the resolution of displacement measurement was less than 1 μ m , and the linearity regions of the X-orientation and Y-orientation were ±3 mm . The motion test on the circular paths were performed on an actual machine tool, and the repeatability tests of this measurement system were verified. The measurement data of circular paths were collected by TCP-OMS and KGM and the results were then compared. When the feed rate of the circular paths increased, the circular deviations were magnified, simultaneously. The axis reversal spikes were observed at the quadrants of a circular path. These measurement results of TCP-OMS matched with the measurement results of KGM. The TCP-OMS developed in this study is characterized by simple installation, compactness, and a low price. It is suitable for 2D contour measurement at the tool center point of machine tools.

1. Introduction

In the machining operation, relative motion is engaged, that is, a primary motion (cutting speed), and a secondary motion (feed). These motions by the machine tool cause relative motion between the tool and workpiece. With these motions, the desired shape and surface texture of a part can be produced. Therefore, the displacement of the tool center point (TCP) is the relative motion between the tool and workpiece in the machining process. The machining performance is dependent on the TCP displacement along the toolpath. In a recent study on the milling of a blade, Prof. Zhu proposed four topics to discuss: milling process planning, milling force of turbine blades, machining errors, and vibration and surface quality [1,2,3]. In terms of vibration and surface quality, one of the problems was caused by the TCP position deviation. Therefore, the TCP dynamic behavior had a signification impact on the vibration and surface quality. In order to measure the contour of the toolpath at the TCP displacement of machine tools, there are two kinds of the common measuring instruments which can be divided into contact and non-contact types. The contact measurement equipment is a double ball bar (DBB). However, a DBB only measures the contour of a circular path, and the radius of a circular path is limited to the instrument specification. DBB cannot perform high feed motions. Since the cross-grid encoder (KGM) performs the non-contact optical measurement, the advantages of KGM are its high resolution, high feed motion, and wide measuring range. More importantly, it measures the contour in arbitrary paths. However, a KGM is difficult to install, large, and expensive. The gap between its detector and the grad plate is only 1 mm. Damage can easily occur during installation, leading to high maintenance costs. Hence, TCP displacement measurement equipment is developed in this study, which is able to perform non-contact optical measurement. The Blu-ray pickup head and position-sensitive detector (PSD) performed contour measurement with a high feed motion. The optical measurement system of TCP displacement (TCP-OMS) is characterized by 2D arbitrary path measurement, compactness, simple installation, and low cost.
To estimate the TCP’s dynamic behavior of machine tools under high feed motion, many scholars have aimed to develop novel TCP measurement equipment alongside conventional measurement instruments, such as DBB and KGM. Shang et al. [4] adopted a DBB to measure the contour errors of the K1 path through the function of a rotational tool center point (RTCP) in a five-axis machine tool. Liu et al. [5] developed a TCP measurement instrument which was similar to DBB. In this measurement instrument, both ends of a bar are provided with balls. The ball at one end of the bar is installed on the tool holder of the spindle, whereas the ball at the other end of the bar is combined with a rotary encoder and installed on the table. This bar is equipped with a linear transducer. The TCP displacement measurement is based on linear displacement and rotational angle. Iwai and Mitsui [6] proposed a TCP measurement instrument composed of rotary encoders and a link mechanism, named a rotary encoder and link mechanism (RELM). The relative positions of the spindle and table are analyzed by three rotary encoders and the given link mechanism. Weikert [7] and Bringmann and Maglie [8] used linear measurement instruments with probes for TCP displacement measurements. The tool holder of the spindle clamped the ceramic ball, and the linear measurement instruments were installed on the table. In order to measure the displacements on the three directions of TCP simultaneously, Weikert and Bringmann employed three and four linear measurement instruments, respectively. The installation orientation of the linear measurement instruments are different from the Cartesian coordinates of machine tools. The measured data are collected in order to obtain the three axial directions displacement of TCP by coordinate transformation. However, the TCP measurement systems proposed in these studies are of the contact type, which cannot perform a high feed motion. To enhance the machining accuracy, some studies utilized non-contact measurement instruments to obtain the dynamic behavior of TCP under high feed motion. Lee et al. [9] and Nagoka and Matsubara [10] proposed the mechatronic model of machine tools, where KGM was employed for 2D contour measurement to verify their mechatronic model under high feed motion. Sato et al. [11] and Tseng et al. [12] presented the accelerometer for TCP displacement measurement. An accelerometer measures the three axes signals simultaneously. It is small-sized and easy to install on machine tools. However, the measuring data of an accelerometer are an acceleration signal that must be integrated twice to obtain the position signal. This procedure leads to the amplification of noise during measurements and the poor precision of the position signal. Therefore, the accelerometer can be applied to the TCP response measurement but is not suitable for the contour measurement at a high feed motion. Shanzhi et al. [13] and Tang et al. [14] proposed the TCP displacement measurement for a circular test by a laser interferometer. The X-axis and Y-axis displacements of TCP were measured on the optical interference principle. Jywe et al. [15,16] installed a laser head on the spindle and a PSD on the table. The TCP displacement was obtained when the PSD received laser light. The resolution of PSD signals was 1.5 μ m . Gao et al. [17,18] used a surface encoder to the measure biaxial position. The principle is that the p-polarized laser light as a light source penetrates through the polarizing beam splitter and quarter-wave plate (λ/4 plate). It reaches the grid surface and is reflected. The polarizing beam splitter reflects it to the four quadrant photoelectric sensors through the lens, and then the position can be obtained. Flores et al. [19] developed a measurement system composed of a 2D angle grid and two 2D slope sensors, named the dual-mode surface encoder. Park et al. [20] developed a TCP measurement system using visual images. First, a small cuboid is used as a measurement window, and the target point’s color and the pixel value are recorded using a 2D matrix. Subsequently, the center point of the target object is selected, and the position of the target point in 2D coordinates is determined. Finally, the target’s movement is scanned using the measurement window to find the minimum and maximum values of the X-axis and Y-axis. The maximum value of the X-axis is expressed as 2, and the maximum value of Y-axis is expressed as 1. The minimum value of the X-axis is expressed as 4, and the minimum value of the Y-axis is expressed as 3. The purpose of this is to find the target center point. When the target moves, the target center point is looked for again and stored. Some scholars showed that they were able to recognize the position from a circular light spot that formed on the four-quadrant sensor based on a Blu-ray pickup head [21,22]. Lin and Sun [23] adopted a laser diode to generate elliptic laser light. This is because the vertical deviation angle is larger than the horizontal deviation angle when the laser diode is excited. Two cylindrical lenses are regarded as horizontal beam expanders that transform the elliptic light into symmetrically circular light. The light passes through the collimator lens, and then the light is transformed by a horizontal beam expander into parallel light. It is focused on the test plane through the objective lens and reflected onto the original path. It is reflected by the beam splitter and passes through the cylindrical lenses. The astigmatism is generated before it reaches the sensor. Ivan et al. [24,25] and Li [26] applied a PSD to a position measurement system and introduced the position computing method. Huang et al. [27] proposed the position compensation method for the PSD measurement. This study described that the farther the PSD was from the center during position measurement, the larger the error was between the measurement result and the actual and measured positions. The authors proposed a compensation method to solve the error. The current signal is converted into a voltage signal, and the voltage signal is filtered and amplified by the operational amplifier. Then, the analog signal is converted into a digital signal, which is imported into the single-chip microcomputer to calculate the actual position. Several studies presented the novel methods based on the optical sensors and the optical principles [28,29,30]. However, these studies focus on the flatness error and the workpiece surface texture.
This paper proposes a TCP contour measurement system that performed non-contact optical measurement, named TCP-OMS. This optical measurement system is original, with a compact structure, simplified installation process, and low cost. Before the actual machining operation, the TCP contour performance can be evaluated by TCP-OMS. First, the basic principles of Blu-ray pickup heads, PSD, and signal processing were introduced. Subsequently, the TCP-OMS was verified for light intensity, PSD signals correction, system resolution, and linearity. Finally, the TCP-OMS was installed on an actual machine tool to validate the performance of the 2D contour measurement of TCP. The contour measurement performed circular paths with different feed motions. The experimental result shows that TCP-OMS has a similar motion trend to KGM.

2. Construction of the TCP-OMS

The architecture of the TCP-OMS proposed in this study is shown in Figure 1. The mains supply was supplied to the PSD after the AC voltage stabilizer and DC regulator. The light spot was focused onto the PSD by the Blu-ray pickup head. The PSD generated the corresponding voltage to the output signals based on the light spot position. The low-pass filter filtered the output signals with the high-frequency noise. The analog signal was converted by data acquisition (DAQ) into the digital signal. A human machine interface (HMI) was designed using LabVIEW software on a personal computer (PC) to observe the condition of the motion trajectory.

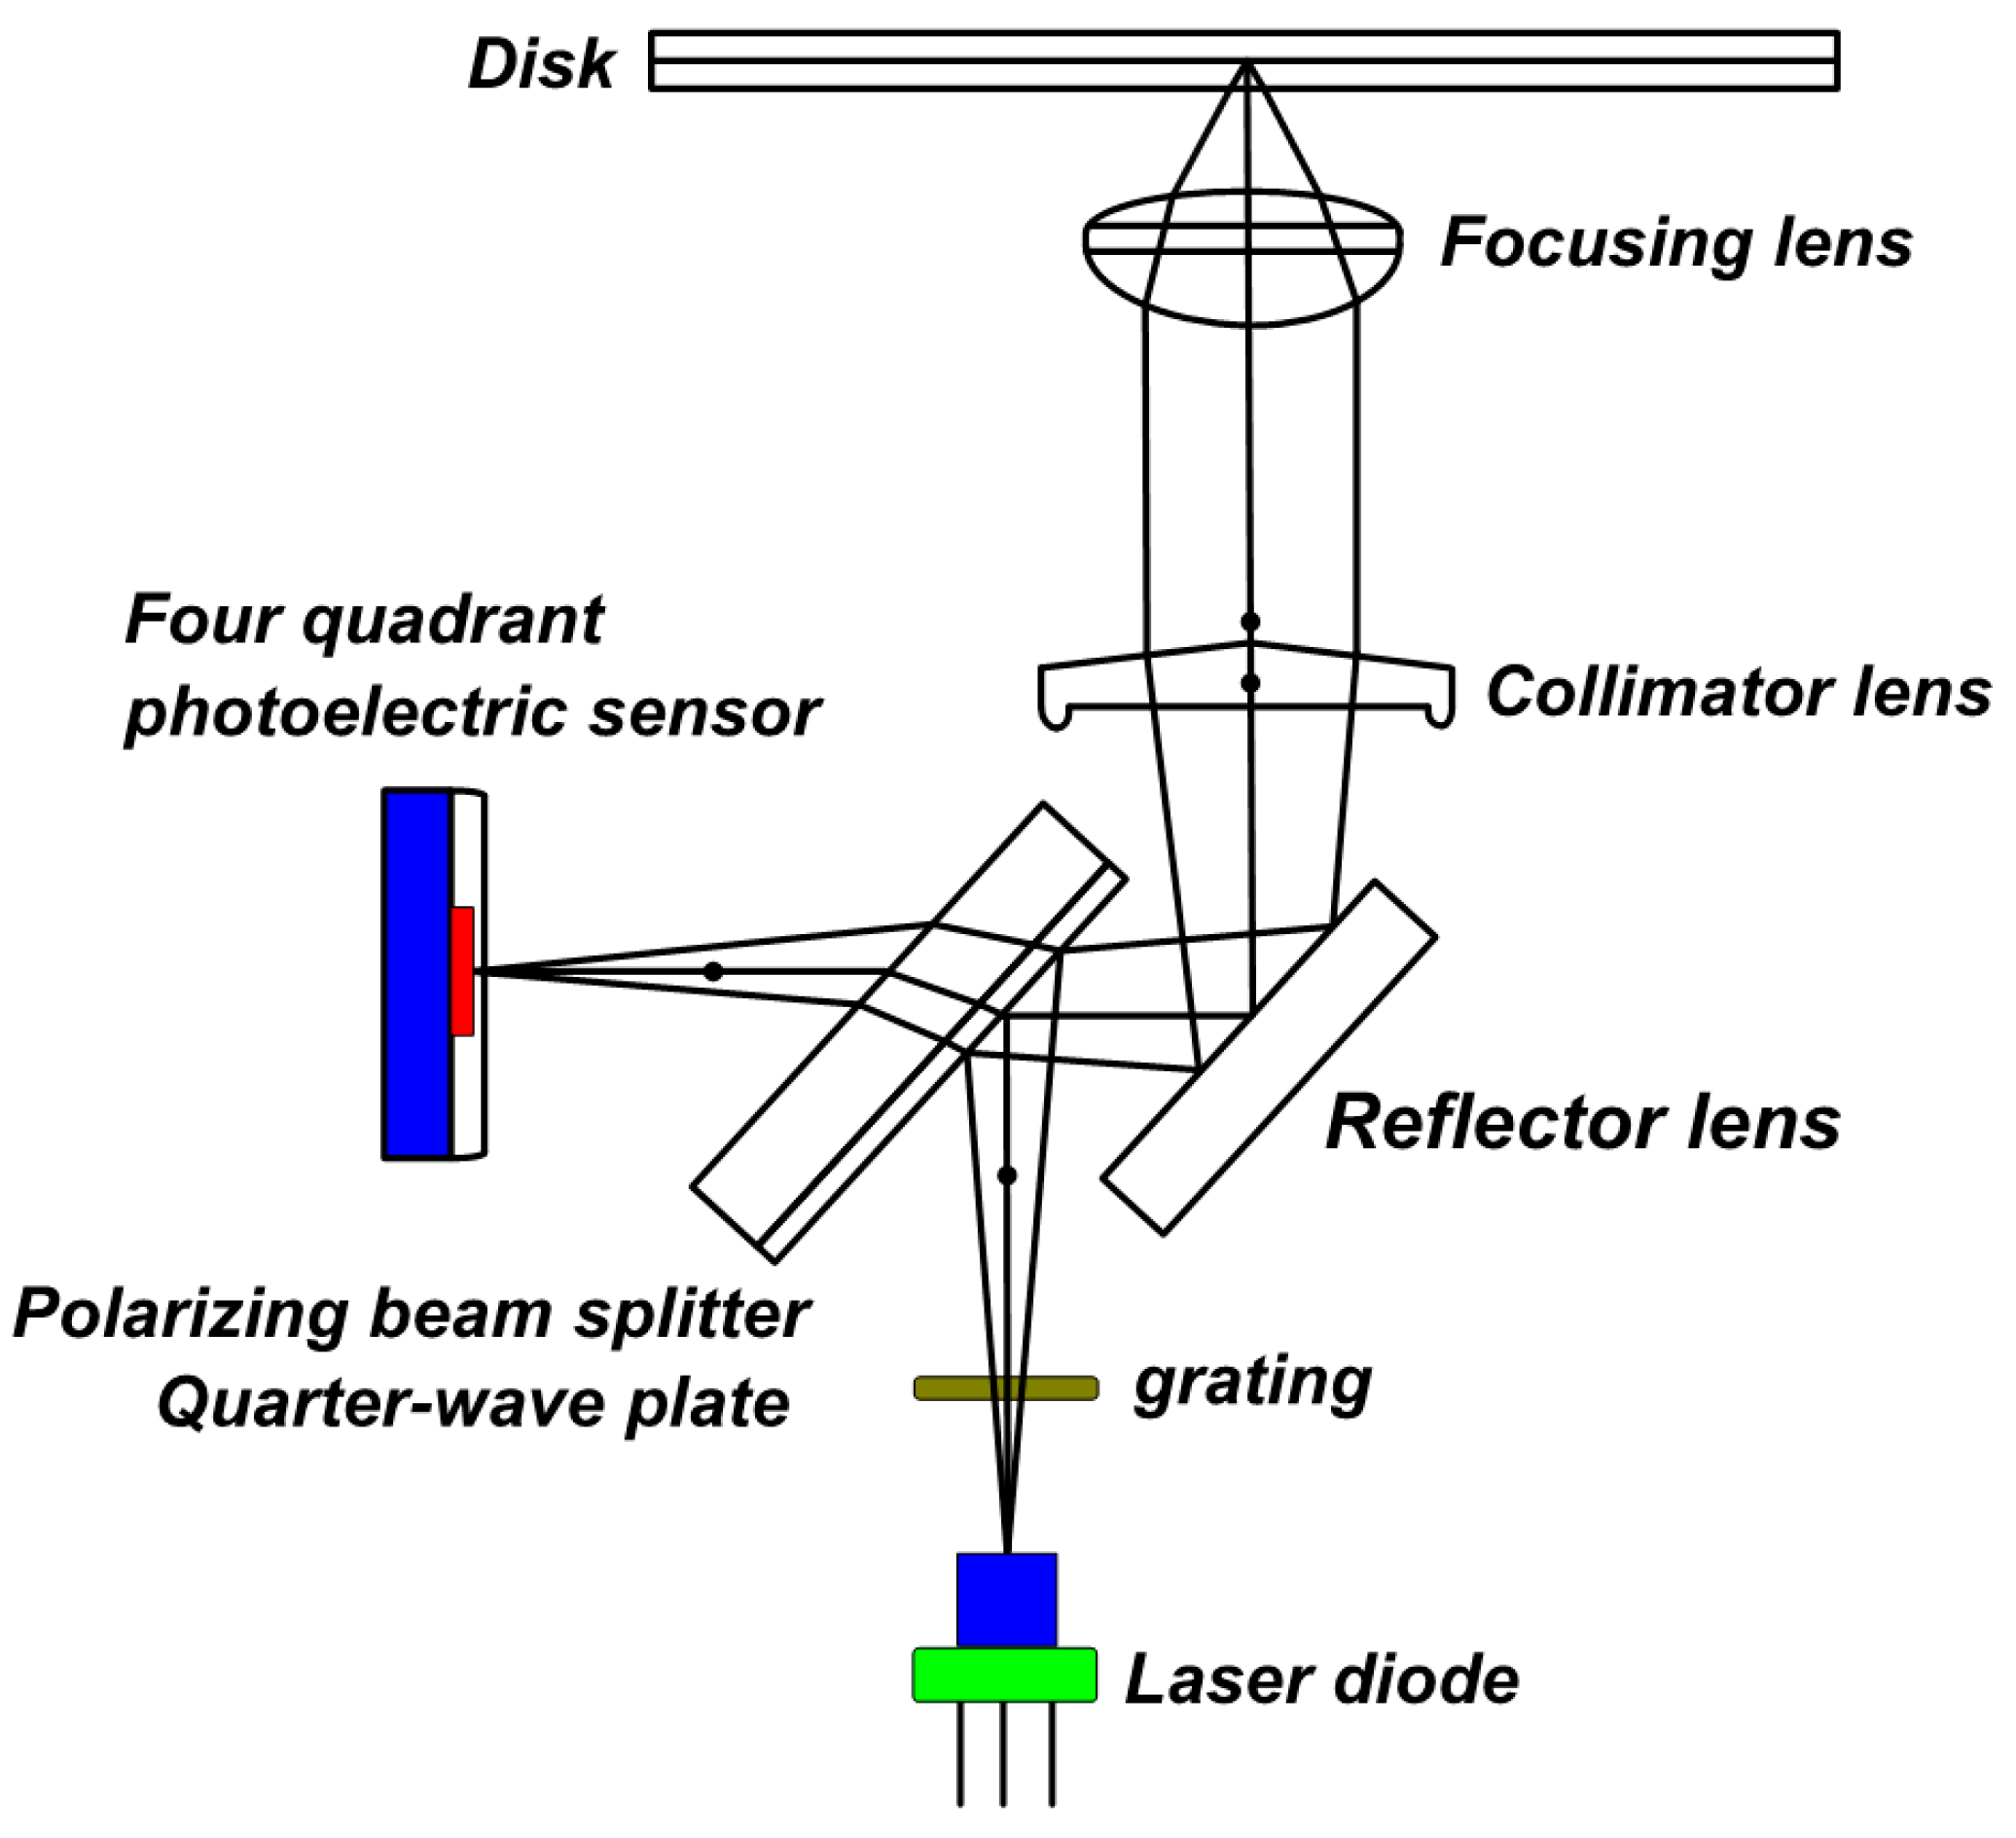
2.1. Blu-Ray Pickup Head

The optical pickup head comprises a laser diode, grating, polarizing beam splitter, reflector lens, λ/4 plate, collimator lens, focusing lens, and four quadrant photoelectric sensors. The optical path principle of an optical pickup head is shown in Figure 2. The emission beam of the laser diode passed through the grating. The light was split into 0th-order and ±1st-order lights. After the light entered the polarizing beam splitter, a p-polarized light was reflected. The light was changed into circular polarized light when it passed through the λ/4 plate, the reflector lens changed the light direction, and the focusing lens focused the light on the optical disc to form a small light spot. The 0th-order light was used to decide whether the light spot was focused on the optical disc. The ±1st-order light was used to verify the data read by the optical disc. The crater reflection of the small light spots on the optical disc was recorded. The reflected light returned along the original light path and passed through the λ/4 plate. It was changed to an s-polarized light, which penetrated through the polarizing beam splitter. The light entered the astigmatic lens, leading to astigmatism. The four quadrant sensors transferred the light signal from the optical system to the photodetection device, then, the light signals were converted into electronic signals as readable data. According to the optical path principle of the optical pickup head, the TCP-OMS adopted a PSD to replace the optical disc in this study. A PSD was installed as a workpiece on the table of the machine tool. The optical pickup head was installed as a cutting tool on the machine tool’s spindle. The laser of the optical pickup head was transmitted to the PSD, and the light spot on the PSD was the TCP position. Therefore, when the machine tool performed the toolpath motion, the motion trajectory of TCP was measured by the TCP-OMS.

2.2. Position Sensitive Detector

The PSD is a common photoelectric displacement sensor. Figure 3 shows how a one-dimensional PSD (1D-PSD) obtains the current signal from the light spot position. The PSD center point is the origin. When the incident light irradiates Point A of PSD, the photocurrents captured by the two lateral electrodes in the same orientation are I x 1 and I x 2 , respectively. If the PSD surface resistivity is uniform, the light spot position is inversely proportional to the photocurrent and is expressed as
I x 1 I x 2 = L x 2 X A L x 2 + X A
where L x is the X-direction measurement range of PSD and X A is the X-direction distance from Point A to PSD origin. To measure the motion path of a 2D contour, a two-dimensional PSD (2D-PSD) is employed, as shown in Figure 4. The position-sensing principle of 2D-PSD was the same as 1D-PSD but there were additional photocurrents, I y 1 and I y 2 , of the two lateral electrodes in the Y-direction. According to Equation (1), the X-direction and Y-direction of the light spot position can be expressed as
X A = L x 2 I x 2 I x 1 I x 1 + I x 2
Y A = L y 2 I y 2 I y 1 I y 1 + I y 2
where L y is the Y-direction measurement range of PSD and Y A is the Y-direction distance from Point A to PSD origin. Generally, a resistor is used in the sensor of PSD to convert the current signal into voltage signal. The voltage signal can be directly read by the DAQ device.
The PSD used in this study has four sets of output signals, which are the voltage signals of the X-direction light intensity ( V x s u m ), the voltage signals of the Y-direction light intensity ( V y s u m ), the voltage signals of the X-direction light spot position ( V x d i f f ), and the voltage signals of the Y-direction light spot position ( V y d i f f ). The light spot position of PSD is expressed as
X p o s i t i o n = K × V x d i f f V x s u m
Y p o s i t i o n = K × V y d i f f V y s u m
where K is a proportional constant, defined as the ratio of PSD position voltage to light intensity. This is because the light intensity influences the position voltage of PSD. The light intensity must be first corrected to make the K is constant value and obtain stable output signals during measurement. Therefore, the measurement system proposed in this study shot a laser source at the PSD. When the machine tool performed the feed motion on a 2D plane, the motion trajectory of TCP was measured according to the displacement of PSD, and the dynamic behavior of TCP under high feed motion was observed. Therefore, the TCP-OMS proposed in this study shot a laser at the PSD. When the machine tool performed a feed motion on a 2D plane, the motion trajectory of TCP was observed by the measured PSD position.

2.3. Signal Processing

To improve the resolution and precision of the TCP-OMS, the supply voltage of this system and the influence of external electromagnetic wave noise must be reduced. This study constructed AC voltage regulation, DC voltage regulation, and the low-pass filter to decrease the influence of signal noise. The general utility power was 60 Hz AC, and the supply voltage quality and stability were enhanced by using an AC voltage stabilizer and a DC regulator. The AC voltage stabilizer was a P5 Power Plate produced by PS Audio. Because the supply power of the PSD was the DC voltage, the AC to DC voltage converter was adopted for DC voltage conversion and 24 V voltages supplied. The voltage output was stabilized at ±15 V by a DC regulator that designed a DC voltage stabilizing circuit. The low-pass filter circuit was designed in this study to reduce the high-frequency noise of PSD output signals. The transfer function of the low-pass filter is
H ω = 1   0 °     ω < ω c 0             ω > ω c
where ω is the input frequency and ω c is the cutoff frequency of the low-pass filter. If   ω < ω c , the input signal processed by the low-pass filter is the same as the output signal. If   ω > ω c , the input signal processed by the low-pass filter and the output signal is 0. As the toolpath motion bandwidth of the TCP contour measurement was within 100 Hz, the cutoff frequency was set as 1 kHz to avoid the distortion of output signals. Therefore, the sampling frequency of the TCP-OMS was set as 10 kHz.

3. Verification of the TCP-OMS

The TMS-OMS was calibrated and verified and corrected in this section. First, the fixtures of the Blu-ray pickup head and PSD were designed. Then, the signals of the Blu-ray pickup head and PSD were corrected, and the precision of the TCP-OMS was verified. The actual verification result shows that the peak-to-valley value of PSD output signals was about 1.6 μ m . The digital filter processed the output signals, and the peak-to-valley was less than 1.0 μ m , as shown in Table 1. Subsequently, the resolution of the TCP-OMS was verified by a nano-moving table, and the system resolution was 1 μm. Finally, the linear movements were performed on an actual machine tool. The measured data of the TCP-OMS and linear scale on machine were compared, and the linearity of the TCP-OMS was verified. The measuring linearity regions of the X-direction and the Y-direction were within ±3 mm in the TCP-OMS.

3.1. Fixtures of Optical Equipment Development

In this study, the optical pickup head adopted a Blu-ray pickup head (GBW-H10N, LG Corp., Seoul, Republic of Korea). The Blu-ray has a shorter wavelength and smaller focal spot. The PSD was a DL100-7-PCBA3 produced by First Sensor. To perform the actual measurements of the TCP-OMS, the fixtures of the Blu-ray pickup head and PSD were designed in this study. Figure 5 shows the position of the Blu-ray pickup head that was installed beneath the fixture. A φ20 mm round bar was arranged above the fixture. The round bar was clamped by a tool holder and installed on the spindle. Figure 6 shows the fixture for installing the PSD. Using T-gib, this fixture was mounted on the table of a machine tool. The counterbore hole in this fixture was designed to prevent the bolt head from being higher than the PSD after locking. Figure 7 shows the TCP-OMS installed on the machine tool. The light of the Blu-ray pickup head irradiated the PSD and the TCP. When the Blu-ray was transmitted to PSD, the output signals of PSD were processed by the low-pass filter circuit. A DAQ (USB-6281, National Instruments) collected the signals, and the analog signal was converted into a digital signal. The position signals of the light spots were observed by the HMI. When the machine tool performed a 2D contour motion, the position signals of light spot were the motion trajectory of TCP.

3.2. Correction of Measurement System

There were two stages used to correct the TCP-OMS. In the first stage, the light intensity control test of the Blu-ray pickup head sensed the PSD. However, the PSD acquisition was characterized by an allowable maximum light intensity per unit area, and the light intensity was proportional to the light power. This test determined the optimal control conditions for the Blu-ray pickup head during the PSD measured. The laser diode driver (505B, Newport Corporation, Irvine, CA, USA) supplied the current to the Blu-ray pickup head. The laser power meter (45-545A, Industrial Fiber Optics) measured the light power of the Blu-ray pickup head to obtain the linear relationship between the current and light power. Figure 8 shows that when the current of the Blu-ray pickup head was 35–65 mA, the light power was proportional to the current. When the spacing between the Blu-ray pickup head and PSD was 1.5 mm , the light intensity limitation of the PSD was 2 mW and the required current of the Blu-ray pickup head was 50 mA . Therefore, the proportional constant K of position voltage and light power of the PSD was worked out. According to the provided setting conditions, the K value of the TCP-OMS was 5 mm / V .
In the second stage, the output signals of the PSD were processed to enhance the resolution and precision of the TCP-OMS. The laser was transmitted to the PSD, and the original signal was measured, as shown in Figure 9. The position signals of the TCP-OMS were limited to under 0.1 sec. Figure 9a,b represents the position signals of the X-direction and Y-direction, respectively. The peak-to-valley value of the X-direction position signal was about 161.10 μ m , and the peak-to-valley value of the Y-direction position signal was about 131.95 μ m .
To observe the frequency content of the noise of the original signals, the noise frequency distribution under 500 Hz was observed by using fast Fourier transform (FFT), as shown in Figure 10. In the Figure 10, Figure 11, Figure 12 and Figure 13, the upper and lower graphs represent the position signals of the X-direction and the Y-direction, respectively. Figure 10 shows the obvious amplitude from 60 Hz and its frequency multiplication. As the utility power was 60 Hz, the AC voltage stabilizer was adopted for filtering, as shown in Figure 11. The test results shows that after the original signal had passed through the AC voltage stabilizer, the 60 Hz of the utility power and its frequency multiplication were reduced effectively. However, there were still high-frequency noises after the AC voltage stabilizer had been run. Therefore, the low-pass filter processed the position signal of the PSD, as shown in Figure 12. The test results prove that the low-pass filter was able to effectively eliminate high-frequency noises, but the low frequency still had 60 Hz and 52 Hz signals. Hence, this study designed a DC voltage stabilizing circuit to eliminate the 60 Hz, as shown in Figure 13. The influence of 60 Hz was reduced effectively after the DC regulator was used, but the 52 Hz signal still existed. However, when the PSD was free of the irradiation of a Blu-ray, there was no 52 Hz. Therefore, the PSD with/without the irradiation of a Blu-ray was measured, as shown in Figure 14. Figure 14a,b shows the V x d i f f and V y d i f f signals, respectively. The upper and lower graphs represent light source on turn off and light source on turn on, respectively. The result proves that 52 Hz was the phenomenon induced by the light source on turn on/off.
To effectively reduce the peak-to-valley value of signals and enhance the precision of the position signal, this study proposed processing the original signal, including AC voltage stabilizer, low-pass filter, and DC regulator. Table 2 shows the results of different signal processing methods. Obviously, the peak-to-valley values of the signals were reduced effectively after signal processing, and the precision of the position signal measurement was enhanced.

3.3. TCP-OMS Performance

The static correction of the TCP-OMS was performed in Section 3.2. The motion performance of the TCP-OMS is verified in this section. It aims at the resolution and linearity during the movement of the TCP-OMS. The resolution of the TCP-OMS was corrected by using the piezo nanopositioning stage (P-615 NanoCube® XYZ Piezo System, PI). The resolution of this stage was 1 nm . The PSD was set up at this stage for a 2D contour motion. One axis was moved by 1 μ m each time, with a total stroke of 10 μ m , while the other axis stayed. The X-axis was moved first, and the Y-axis stayed, as shown in Figure 15a. Afterwards, the Y-axis was moved, and the X-axis remained stationary, as shown in Figure 15b. In these figures, the upper figure and the lower figure represent the results of the X-axis and the Y-axis, respectively. The measurement results show that the resolution of the TCP-OMS could be 1 μm.
In the linearity performance of the TPC-OMS, this system was set up on an actual machine tool, as shown in Figure 7. Figure 16 shows the test path. The origin of the machine tool (X = 0, Y = 0) was set as the starting point of the table. First, the table remained in the Y-direction, and the table movements were directed in the +X and −X directions. Then, the table remained in the Y-direction, and movements were directed in the +Y and −Y directions. The table movement was kept slow, and the total stroke was 5 mm . This measurement was repeated three times. Figure 17a,b shows the X-direction and Y-direction movement results, respectively. The repeated measurement results of single axis direction were fitted. The X-direction and Y-direction linearity of the TCP-OMS were 0.47% and 1.53%, respectively. Therefore, the TCP-OMS were in the linear range of X = ±3 mm and Y = ±3 mm , and the X-direction and Y-direction linearity of this system were less than 1.6%.

4. Experimental Results

To validate the dynamic path measurement performance of the TCP-OMS developed in this study, the validation test was performed on a small three-axis vertical CNC machine tool. To observe the TCP toolpath motion more intuitively, this study designed an HMI using the LabVIEW software. This HMI displayed the light intensity, the toolpath motion time, the position signal, and the frequency response, as shown in Figure 18.
This study used the circular path of the XY plane for this system validation. The radius of the circular path was 1 mm. The advantage of a circular path was that the X-axis and Y-axis moved synchronously during the motion and the reversal spikes occurred at the four quadrantal points during the circular motion. As the travel direction reversed, the axial motion decelerated to zero and accelerated as the friction of movement was overcome, leading to reversal spike. Another advantage of a circular path was that the contour errors of a circular path increased with the feed rate. With the constant circular radius ( R ) and increasing feedrate ( f ), the centripetal acceleration ( a c ) became very high ( a c = f 2 / R ). Due to the excitement of the greater centripetal acceleration, contour errors between the actual path and ideal path were caused. The contour errors in this study were circular deviations ( G ) and radial deviations ( F ), according to ISO 230-4. The circular deviation was the difference between the measured maximum radius of a circle and the minimum radius of a circle. The radial deviation was the difference between the actual path and reference path, including maximum radial deviation ( F m a x ) and minimum radial deviation ( F m i n ). A KGM was used for measuring the same circular tests, and the experimental results of KGM and the TCP-OMS were compared.
To observe the contour errors of a circular tests, the experimental feed rates were 1000 mm / min , 2000 mm / min , 3000 mm / min , 4000 mm / min , and 5000 mm / min ; Figure 19a,b shows the measurement results of the TCP-OMS and KGM, respectively. The experimental results show that the contour errors between the actual path and reference path increased with the feed rate. Regarding axial reversal spike, the experimental results of feed rate 1000 mm / min were discussed in order to observe the effect of friction when the travel direction reversed. Figure 20a,b shows the measurement results of the TCP-OMS and KGM, respectively. The contour errors were magnified to observe the reversal spikes at the four quadrants of a circle. The observed reversal spikes are obvious in both systems. However, the two measurement systems had inconsistent G values based on the experimental results. The G value of the TCP-OMS was larger than the G value of KGM. The contour errors of the TCP-OMS and KGM were calculated as follows: G = 0.0280 mm , F m a x = 0.0076 mm , and F m i n = −0.0204 mm for TCP-OMS and G = 0.0104 mm , F m a x = 0.0054 mm , and F m i n = −0.0050 mm for KGM. Therefore, the measurement error between both systems was about 18 μ m . Hence, the repeatability tests were performed using the same circular path and feed rate thirty times. Figure 21 shows the evaluation of measurement data for each circular test: the arithmetic mean, standard deviation, and standard deviation of the mean from top to bottom, respectively. The variation of the arithmetic mean was 0.9926–0.9933 mm, which included the contour errors and the reversal spikes. The variation of the standard deviation was 0.0060–0.0063 mm, and the variation of the standard deviation of the mean was 0.98 × 10⁻⁴–1.02 × 10⁻⁴ mm. These experimental results demonstrated the repeatability of TCP-OMS. These experimental comparison result shows that the circular tests of TCP-OMS and KGM had the same trend, but there was a difference of 18 μ m for the two kinds of systems.

5. Conclusions

In machining operations, the machine tool produces the desired shape of a part based on the relative motion of the cutting tool and the workpiece. The TCP is the cutting position between the cutting tool and the workpiece. To evaluate the motion contour performance of the TCP before actual machining, this study developed an optical measurement system of TCP, named TCP-OMS. The resolution of TCP-OMS is 1 μ m , and the linearity of this system in the linear range is lower than 1.6%. Moreover, this study performed the circular tests for validation, and the contour errors and the axial reversal spikes were observed. Like KGM, TCP-OMS performs non-contact measurement, although the sensitivity of TCP-OMS is not as high as KGM. However, TCP-OMS adopts a Blu-ray pickup head and a PSD, which offer the advantages of being compact, being easy to install on a machine, reducing calibration time, and low price. Furthermore, the compact construction of TCP-OMS is suitable for measuring dynamic TCP behaviors. TCP-OMS exhibits several favorable features worthy of further development. First, future research will involve focusing on optimizing the measuring sensitivity. Second, PSD with higher responsiveness will be able to favorably reduce non-linearity and enhance sensitivity. Finally, as the power supply and signal transmission of TCP-OMS are expected to adopt the wireless system, it will be useful to decrease the signal noise. Therefore, the promising potential for further improvement makes this measurement system suitable for future practical applications.

Author Contributions

The individual author contributions follow: conceptualization, B.-F.Y. and J.-S.C.; methodology, J.-S.C.; software, H.-Y.T.; validation, B.-F.Y., J.-S.C. and H.-Y.T.; formal analysis, B.-F.Y. and J.-S.C.; investigation, B.-F.Y. and H.-Y.T.; resources, B.-F.Y. and H.-Y.T.; data curation, B.-F.Y.; writing—original draft preparation, B.-F.Y. and J.-S.C.; writing—review and editing, H.-Y.T.; visualization, H.-Y.T.; supervision, J.-S.C.; project administration, B.-F.Y.; funding acquisition, B.-F.Y. All authors have read and agreed to the published version of the manuscript.

Funding

This research was funded by the National Science and Technology Council, Taiwan; grant number MSOT-111-2222-E-167-001.

Institutional Review Board Statement

Not applicable.

Informed Consent Statement

Not applicable.

Data Availability Statement

Not applicable.

Acknowledgments

The authors would like to thank the reviewers for their suggestions.

Conflicts of Interest

The authors declare no conflict of interest.

References

  1. Zhu, L.; Yan, B.; Wang, Y.; Dun, Y.; Ma, J.; Li, C. Inspection of blade profile and machining deviation analysis based on sample points optimization and NURBS knot insertion. Thin-Walled Struct. 2021, 162, 107540. [Google Scholar] [CrossRef]
  2. Yan, B.; Hao, Y.; Zhu, L.; Li, C. Towards high milling accuracy of turbine blades: A review. Mech. Syst. Signal Process. 2022, 170, 108727. [Google Scholar] [CrossRef]
  3. Hao, Y.; Zhu, L.; Yan, B.; Qin, S.; Cui, D.; Lu, H. Milling chatter detection with WPD and power entropy for Ti-6Al-4V thin-walled parts based on multi-source signals fusion. Mech. Syst. Signal Process. 2022, 177, 109225. [Google Scholar] [CrossRef]
  4. Shang, P.; Xu, A.; Zhang, D. A DBB-based accuracy measurement method for rotary axes of high speed 5-axis CNC machining center. In Proceeding of the 2010 International Conference on Mechanic Automation and Control Engineering, Wuhan, China, 26–28 June 2010. [Google Scholar]
  5. Liu, H.L.; Shi, H.M.; Li, B.; Li, X. A new method and instrument for measuring circular motion error of NC machine tools. Int. J. Mach. Tools Manuf. 2005, 45, 1347–1351. [Google Scholar] [CrossRef]
  6. Iwai, H.; Mitsui, K. Development of a measuring method for motion accuracy of NC machine tools using links and rotary encoders. Int. J. Mach. Tools Manuf. 2009, 49, 99–108. [Google Scholar] [CrossRef]
  7. Weikert, S. R-Test, a New Device for Accuracy Measurements on Five Axis Machine Tools. CIRP Ann. 2004, 53, 429–432. [Google Scholar] [CrossRef]
  8. Bringmann, B.; Maglie, P. A method for direct evaluation of the dynamic 3D path accuracy of NC machine tools. CIRP Ann. 2009, 58, 343–346. [Google Scholar] [CrossRef]
  9. Lee, K.; Ibaraki, S.; Matsubara, A.; Kakino, Y.; Suzuki, Y.; Arai, S.; Braasch, J. A Servo Parameter Tuning Method for High-Speed NC Machine Tools based on Contouring Error Measurement. WIT Tran. Eng. Sci. 2003, 44, 181–192. [Google Scholar]
  10. Nagaoka, K.; Matsubara, A. Improving motion accuracy of tool center point using model-reference feedforward controller. Procedia CIRP 2012, 1, 605–608. [Google Scholar] [CrossRef] [Green Version]
  11. Sato, R.; Tashiro, G.; Shirase, K. Analysis of the Coupled Vibration Between Feed Drive Systems and Machine Tool Structure. Int. J. Autom. Technol. 2015, 9, 689–697. [Google Scholar] [CrossRef]
  12. Tseng, H.C.; Tsai, M.S.; Cheng, C.C.; Li, C.J. Optimization of Computer Numerical Control Interpolation Parameters Using a Backpropagation Neural Network and Genetic Algorithm with Consideration of Corner Vibrations. Appl. Sci. 2021, 11, 1665. [Google Scholar] [CrossRef]
  13. Tang, S.; Wang, Z.; Jiang, Z.; Gao, J.; Guo, J. A new measuring method for circular motion accuracy of NC machine tools based on dual-frequency laser interferometer. In Proceeding of the 2011 IEEE International Symposium on Assembly and Manufacturing (ISAM), Tampere, Finland, 25–27 May 2011. [Google Scholar]
  14. Tang, S.; Wang, Z.; Zhong, L.; Gao, J. Influences of misalignments on circular path measurement based on dual-beam plane mirror interferometer. Optik 2013, 124, 4576–4580. [Google Scholar] [CrossRef]
  15. Jywe, W.Y.; Chen, C.J. A new 2D error separation technique for performance tests of CNC machine tools. Precis. Eng. 2007, 31, 369–375. [Google Scholar] [CrossRef]
  16. Jywe, W.Y.; Lin, B.J.; Shen, J.C.; Lee, J.D.; Huang, H.L.; Cho, M.C. Development of a Simple laser-based 2D Compensating System for the Contouring Accuracy of Machine tools. Int. J. Ind. Manuf. Eng. 2012, 6, 2061–2064. [Google Scholar]
  17. Gao, W.; Dejima, S.; Shimizu, Y.; Kiyono, S.; Yoshikawa, H. Precision Measurement of Two-Axis Positions and Tilt Motions Using a Surface Encoder. CIRP Ann. 2003, 52, 435–438. [Google Scholar] [CrossRef]
  18. Gao, W.; Dejima, S.; Yanai, H.; Katakura, K.; Kiyono, S.; Tomita, Y. A surface motor-driven planar motion stage integrated with an XY𝜃𝑍 surface encoder for precision positioning. Precis. Eng. 2004, 28, 329–337. [Google Scholar] [CrossRef]
  19. Flores, V.; Ortega, C.; Alberti, M.; Rodriguez, C.A.; Ciurana, J.D.; Elias, A. Evaluation and modeling of productivity and dynamic capability in high-speed machining centers. Int. J. Adv. Manuf. Technol. 2007, 33, 403–411. [Google Scholar] [CrossRef]
  20. Park, J.; Kim, J.; Lee, E.; Lee, M. Micro circular path measurement of two-axis stage using a machine vision system and the application. Int. J. Adv. Manuf. Technol. 2011, 56, 1049–1055. [Google Scholar] [CrossRef]
  21. Chang, H.W.; Lee, H.W.; Lin, C.T.; Wen, Q.Z. Development of Blue Laser Direct-Write Lithography System. Int. J. Eng. Technol. Innov. 2012, 2, 63–71. [Google Scholar]
  22. Huang, Y.J. Development and Application of a Three-Degree-of-Freedom Optical Vibration Measurement Probe. Master Thesis, Southern Taiwan University of Science and Technology, Tainan, Taiwan, 2012. [Google Scholar]
  23. Lin, Y.-N.; Sun, W.S. High Resolution Detection of Synchronously Determining Tilt Angle and Displacement of Test Plane by Blu-Ray Pickup Head. Phys. Procedia 2011, 19, 296–300. [Google Scholar] [CrossRef] [Green Version]
  24. Ivan, I.A.; Ardeleanu, M.; Laurent, G.J.; Tan, N.; Clevy, C. The metrology and applications of PSD (position sensitive detector) sensors for microrobotics. In Proceeding of the 2012 International Symposium on Optomechatronic Technologies (ISOT 2012), Paris, France, 29–31 October 2012. [Google Scholar]
  25. Ivan, I.A.; Ardeleanu, M.; Laurent, G. High Dynamics and Precision Optical Measurement Using a Position Sensitive Detector (PSD) in Reflection-Mode: Application to 2D Object Tracking over a Smart Surface. Sensors 2012, 12, 16771–16784. [Google Scholar] [CrossRef] [PubMed]
  26. Li, W.C. Applications of PSD & CCD on the Structure Displacement Measurement. Master Thesis, National Central University, Taoyuan, Taiwan, 2005. [Google Scholar]
  27. Huang, M.Z.; Shi, L.Z.; Wang, Y.X.; Ni, Y.; Li, Z.Q.; Ding, H.F. Development of a new signal processor for tetralateral position sensitive detector based on single-chip microcomputer. Rev. Sci. Instrum. 2006, 77, 083301. [Google Scholar] [CrossRef]
  28. Lu, Z.; Li, Z.; Zhao, C. A Novel Method for Reconstructing Flatness Error Contour of Long Surface Based on a Laser Displacement Sensor. IEEE Access 2019, 7, 118077–118110. [Google Scholar] [CrossRef]
  29. Zhu, L.; Dong, Y.; Li, Z.; Zhang, X.; Fang, F. Measurement and Analysis of the Stepwise Curved Surface of Diffractive Optical Elements by a Constant Speed Confocal Probe. Appl. Sci. 2019, 9, 2229. [Google Scholar] [CrossRef] [Green Version]
  30. Zou, X.; Zhao, X.; Li, G.; Li, Z.; Sun, T. Non-contact on-machine measurement using a chromatic confocal probe for an ultra-precision turning machine. Int. J. Adv. Manuf. Technol. 2017, 90, 2163–2172. [Google Scholar] [CrossRef]
Figure 1. Architecture of the TCP–OMS in this study.
Machines 10 01199 g001
Figure 2. Optical path principle of the optical pickup head.
Machines 10 01199 g002
Figure 3. Position sensing principle of 1D-PSD.
Machines 10 01199 g003
Figure 4. Position sensing principle of 2D-PSD.
Machines 10 01199 g004
Figure 5. Fixture of Blu-ray pickup head (GBW-H10N).
Machines 10 01199 g005
Figure 6. Fixture of PSD (DL100-7-PCBA3).
Machines 10 01199 g006
Figure 7. Schematic diagram shows the setup of the TCP–OMS on the actual machine.
Machines 10 01199 g007
Figure 8. Linear relationship between current and light power of the Blu-ray pickup head.
Machines 10 01199 g008
Figure 9. PSD output signals without signal processing. (a) Original signals for the X-direction; (b) original signals for the Y-direction.
Machines 10 01199 g009
Figure 10. Using FFT to observe the original PSD output signals.
Machines 10 01199 g010
Figure 11. PSD output signals based on AC voltage stabilizer.
Machines 10 01199 g011
Figure 12. PSD output signals after the low−pass filter was run.
Machines 10 01199 g012
Figure 13. PSD output signals based on DC regulator.
Machines 10 01199 g013
Figure 14. Power on/off of Blu−ray to observe the PSD output signals. (a) PSD output signals for the X−orientation; (b) PSD output signals for the Y−orientation.
Machines 10 01199 g014
Figure 15. Verification of TCP–OMS resolution. (a) TCP moves along X-axis; (b) TCP moves along Y-axis.
Machines 10 01199 g015
Figure 16. Schematic diagram of the test path design.
Machines 10 01199 g016
Figure 17. Measuring data of TCP–OMS are compared with LS on machine. (a) TCP moves along the X-axis; (b) TCP moves along the Y-axis.
Machines 10 01199 g017
Figure 18. Design an HMI to observe the TCP contour motion based on TCP–OMS.
Machines 10 01199 g018
Figure 19. TCP contour measurement perform circular tests with each feed rate. (a) Circular tests adopt TCP–OMS; (b) circular tests adopt KGM.
Machines 10 01199 g019
Figure 20. TCP contour errors in F1000 based on circular tests. (a) Contour errors of TCP–OMS; (b) contour errors of KGM.
Machines 10 01199 g020
Figure 21. Repeatability tests for circular paths carried out 30 times with F1000.
Machines 10 01199 g021
Table 1. PSD output signals processed by digital filter.
OrientationPeak-to-Valley Deviation ( μ m )
10 Points30 Points50 Points
X1.150.940.62
Y1.231.090.90
Table 2. Signal processing results for PSD output signals.
OrientationPeak-to-Valley Deviation ( μ m )
Original SignalsAC Voltage
Stabilizer
Low-Pass FilterDC Regulator
X161.1016.452.501.56
Y131.9513.052.551.57
Publisher’s Note: MDPI stays neutral with regard to jurisdictional claims in published maps and institutional affiliations.

