Abstract
In this paper, the experimental modes of a large-scale photoelectric theodolite tracking frame are presented. On the basis of the experimental data and the gradient-less optimization approach, the modeling strategy and the parameterized equivalent dynamic finite element model are presented. Shafting, three-point leveling units, and other components are reasonably simplified during the modeling process. Influence factors such as contact stiffness are introduced as dynamic parameters in the model. The optimized parametric model obtained demonstrates that the linearization modeling strategy represents the dynamic response characteristics of this type of structure accurately. The maximum relative error of the first four-order natural frequencies between numerical simulation and experimental data is 4.45% when the consistency of mode shapes is taken into account. The research results in this paper can provide engineering guidance for the dynamic stiffness optimization design of the large-scale photoelectric theodolite tracking frame.
1. Introduction
The large-scale photoelectric theodolite is an essential tracking and observing telescope in the long-distance target characteristic measurement, the aperture of its primary optical system is usually greater than 800 mm. Among these, the theodolite tracking frame is the primary bearing structure of the optical system, and its dynamic characteristics directly affect the servo bandwidth of photoelectric tracking equipment, thus indirectly affecting optical system tracking stability and tracking accuracy [1,2,3]. Because of the complexity of the internal structure, such as bearings and bolted connections, it is challenging to establish the tracking frame’s dynamic model with precision. The demand for the optimal design of the tracking frame’s dynamic stiffness is intensifying as the precision requirements of photoelectric tracking equipment continue to increase. How to establish an accurate and practical tracking frame dynamic model to guide engineering practice and improve optimization efficiency has become an unavoidable issue [4].
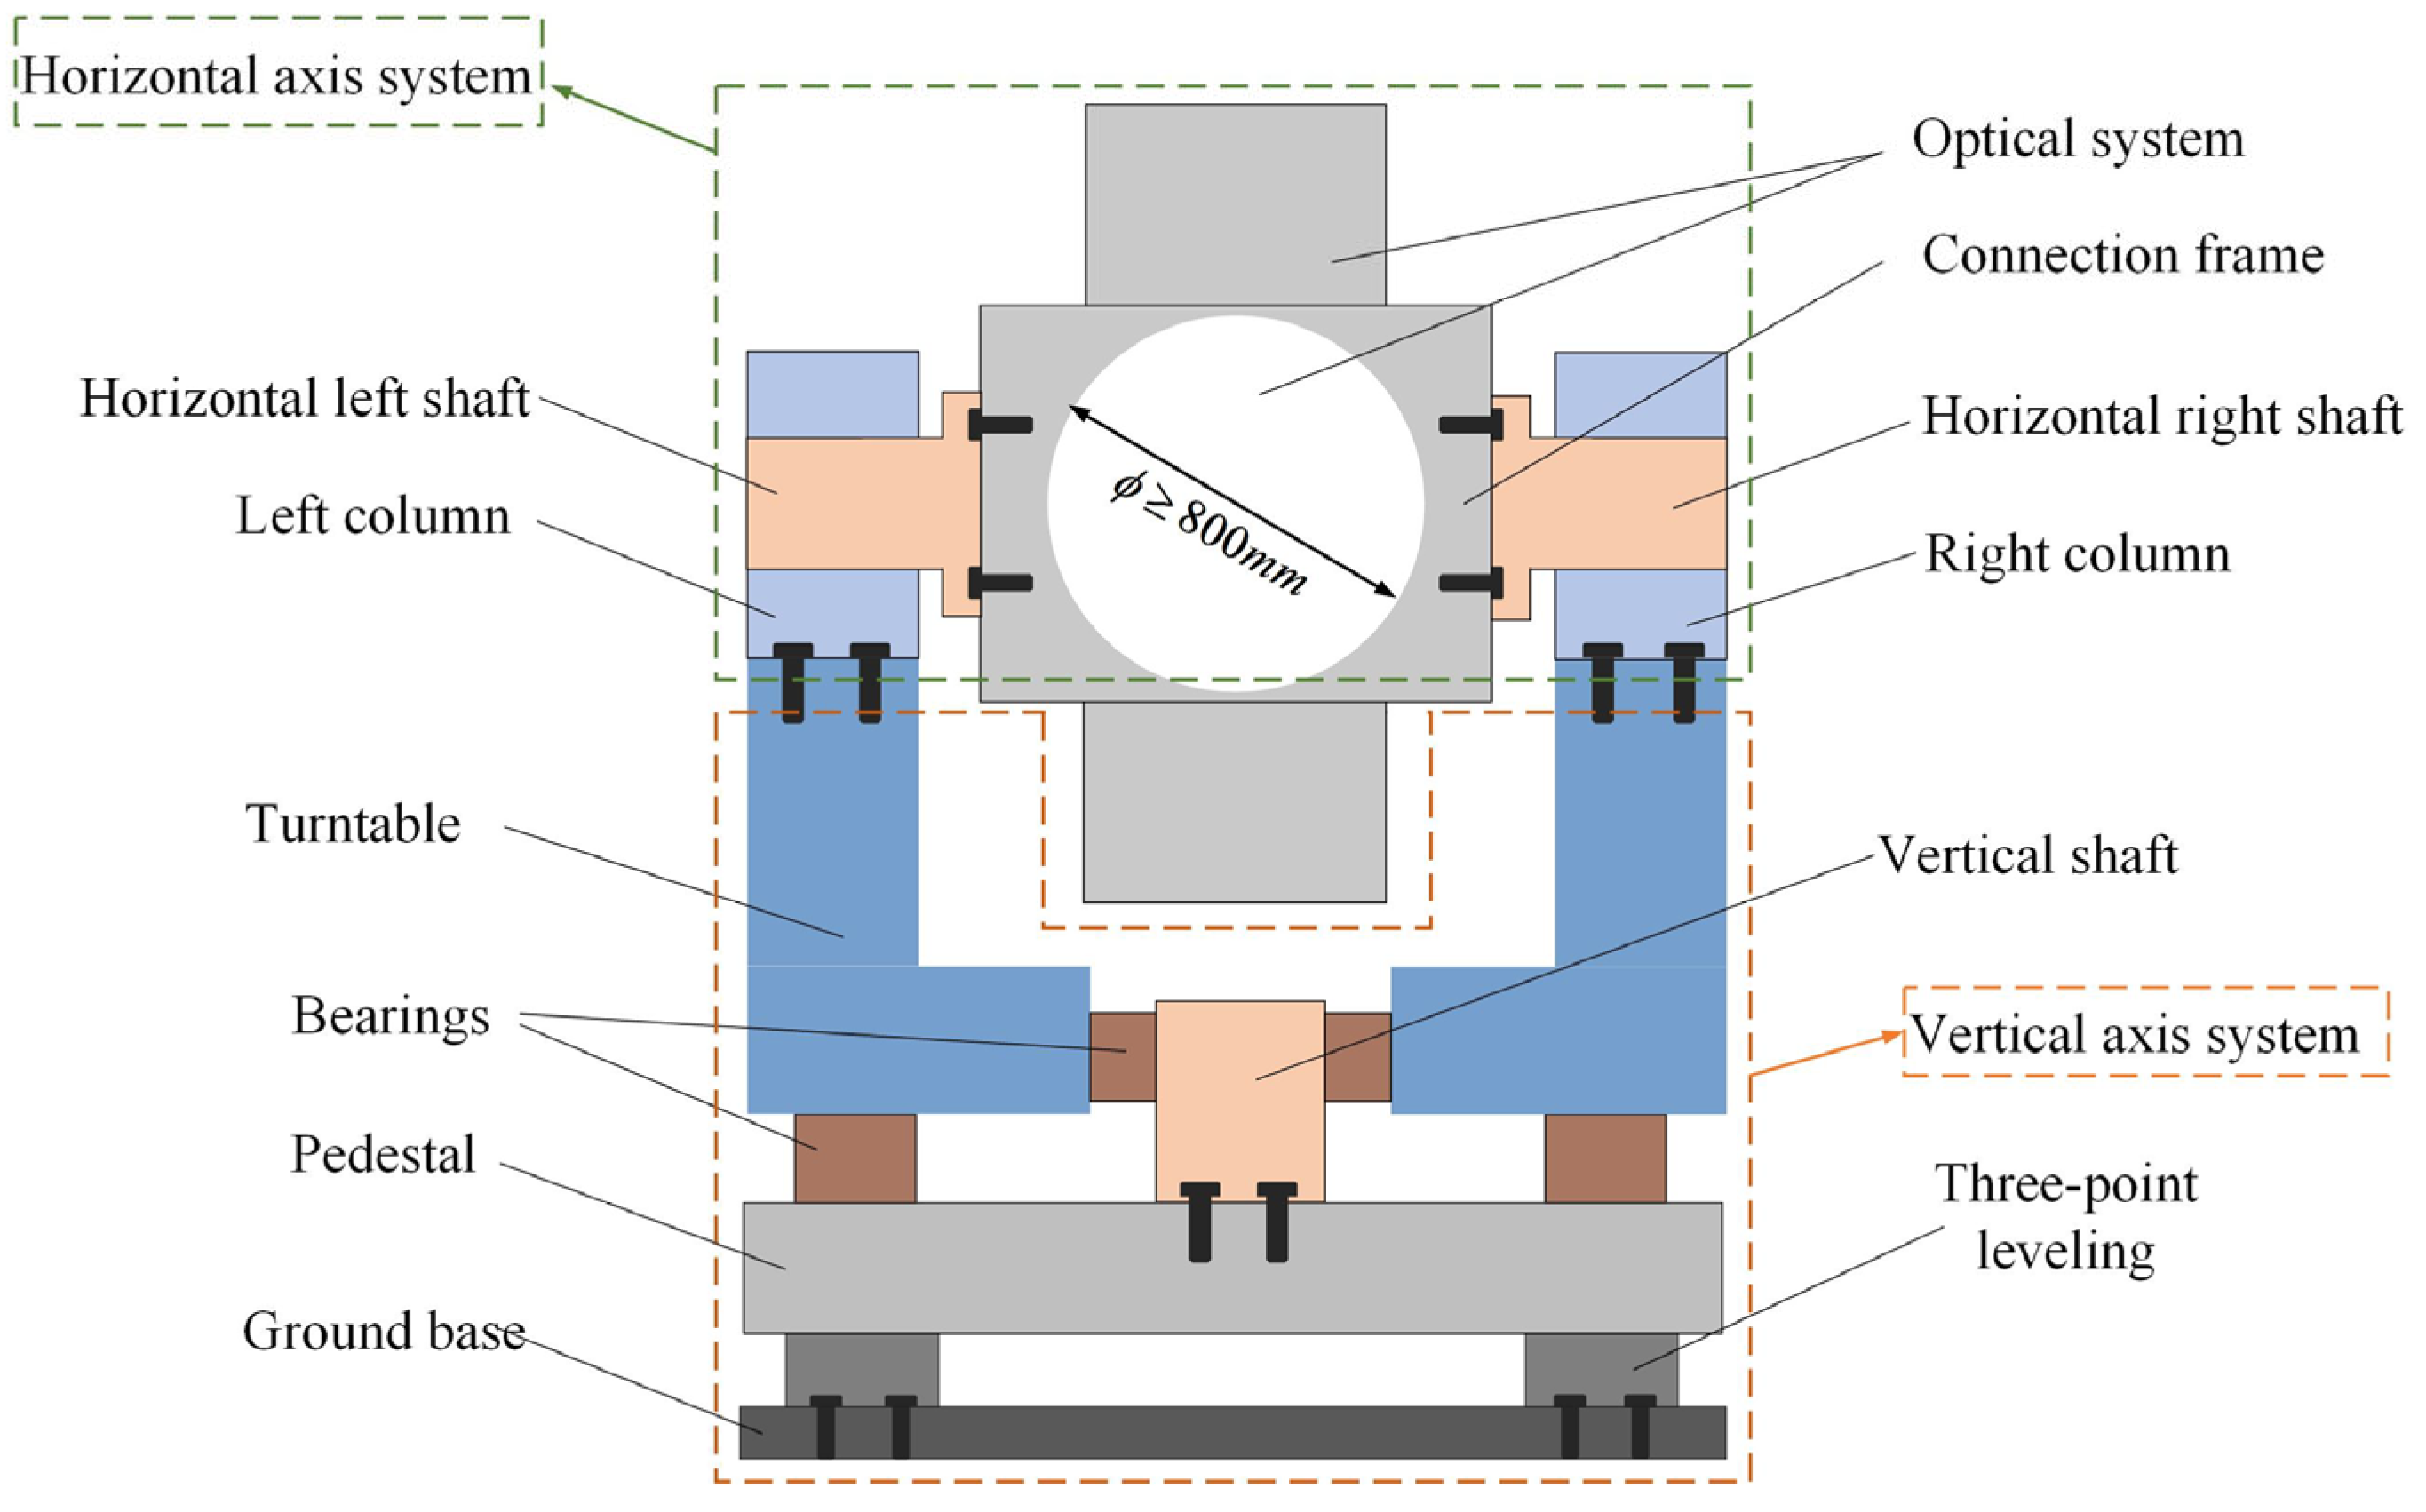
The internal structure of a typical photoelectric theodolite is depicted in Figure 1. The photoelectric theodolite consists of a tracking frame with attached optical systems, and the tracking frame can be subdivided into horizontal and vertical axis systems. To complete the tracking and observation of a target, the tracking frame allows for precise motion in the pitch and azimuth directions.
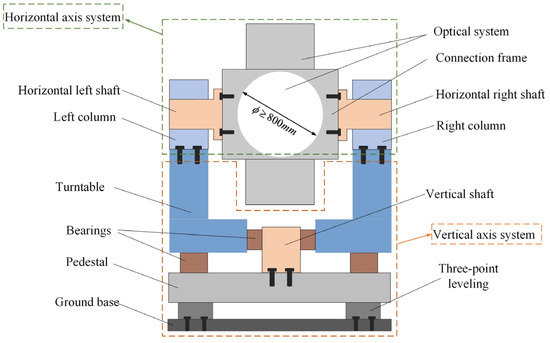
Figure 1.
Diagram of a typical photoelectric theodolite’s internal structure.
In order to obtain accurate measurement data, the photoelectric theodolite must be leveled prior to tracking and measuring task of the equipment. To realize the verticality of the vertical axis system of the equipment and the ground plane, the typical theodolite leveling system employs a three-point leveling structure, that is, a structure that can realize the movement and locking of the mechanism by using three units evenly distributed at 120 degrees. To achieve height adjustment, the leveling system employs a combination of wedges and spherical supports. In the process of modeling and analyzing the theodolite by means of numerical simulation, the complex contact conditions of the leveling structure make it difficult to guarantee the accuracy of the model. Typically, when the model considers the bolted connections as rigid connections, the stiffness of the entire machine is excessive that its dynamic characteristics cannot be precisely described [5].
The tracking frame, in addition to the complex support factors of the previously mentioned leveling system, has the support form of angular contact bearings. Angular contact bearings are made up of inner and outer rings as well as rolling elements, and the contact conditions of the structure are highly nonlinear [6,7]. If the equivalent simplification of the bearings is not performed, the number of meshes in the numerical simulation model is large, and the calculation results are difficult to converge. Therefore, the bearings in the tracking frame must be reasonably simplified, and the simplified bearings must have similar connection stiffness and contact conditions as before so that computational efficiency and accuracy can be considered.
To optimize the dynamic stiffness for the nonlinear physical problems of large and complex equipment, a large number of nonlinear dynamic theories and modeling methods have been proposed [8,9,10,11,12]. However, for low-speed and quasi-static tracking equipment such as photoelectric theodolite, it may be sufficient to use linearized models to analyze dynamic problems.
For photoelectric tracking equipment and photoelectric telescopes, the finite element method is widely used to analyze the dynamic characteristics of the structure [13,14]. Numerous studies have focused on the modeling and analysis of photoelectric equipment’s primary and secondary mirrors. Greiner, B. et al. updated the submodel of the Primary Mirror Assembly (PMA) as part of the SOFIA telescope’s research. They elaborated that the motion of the PMA significantly contributes to image motion and image size, particularly in the frequency range of 50 to 120 Hz [15]. For the SOFIA secondary mirror mechanism, Greiner, B. et al. correlate the test results with the finite element simulation model, in order to identify excited mode shapes [16]. Knight, J.B. [17] et al. conducted modal tap testing on the glass slumped mirror of the space telescope, and the results were within 5% of the predictions of the dynamic finite element model.
With regard to some large ground-based telescopes, the establishment and analysis of the entire model is also a major area of research for numerous academics. taking the Extremely Large Telescope (ELT) as the research object, Marchiori, G. [18] et al. calculated the natural frequencies of the telescope and the ground using the linear Finite Element Model (FEM). The results show that at the highest credible seism level, some structural units require local isolation devices to prevent seismic damage. Soler, M. et al. obtained the first ten modes and frequencies for the European Solar Telescope (EST) pointing to the horizon and to the zenith and discovered that the second mode affects the image motion, so the structural stiffness and the interface elevation drive must be increased [19]. Based on the existing data, Islam, M. [20] and his colleagues constructed the FEM and used it to analyze the dynamic characteristics of the John, A. Galt 26 m radio telescope, the next step in their research is to conduct modal tests and use the test results to modify the FEM for more precise analysis. Xie, J. [21] et al. performed a sweep frequency test of the small theodolite’s resonance points on the vibrating platform and constructed a FEM taking the contact conditions into account. However, their experiment did not yield the exact mode shapes, and the relative error regarding the lower-order natural frequencies between simulation and experiment is large.
All of these modeling techniques have yielded positive outcomes, but few studies have extended them to the modeling of large-scale photoelectric theodolite tracking frames. Moreover, these ground-based telescopes have no three-point leveling system, and their dynamic stiffness weakness is quite different from that of the photoelectric theodolite. Therefore, it is necessary to establish a dynamic model of the tracking frame and analyze its vibration characteristics.
This paper aims to develop a dynamic model of a large-scale photoelectric theodolite tracking frame and analyze its vibration characteristics in order to identify the equipment’s dynamic stiffness weakness. This paper’s second section introduces the calculation strategy. In the third section, the layout of the modal test and the test results are described. The fourth section provides an overview of the modeling procedure for the finite element model. In the fifth section, the results of the finite element simulation following parametric optimization are presented, the vibration characteristics of the tracking frame of photoelectric theodolite are analyzed synthetically by comparing the modal test results, and the calculation accuracy of the dynamic model is validated. Finally, in the sixth section, the conclusion and outlooks are discussed.
2. Calculation Strategy
This paper’s calculation strategy is described as follows:
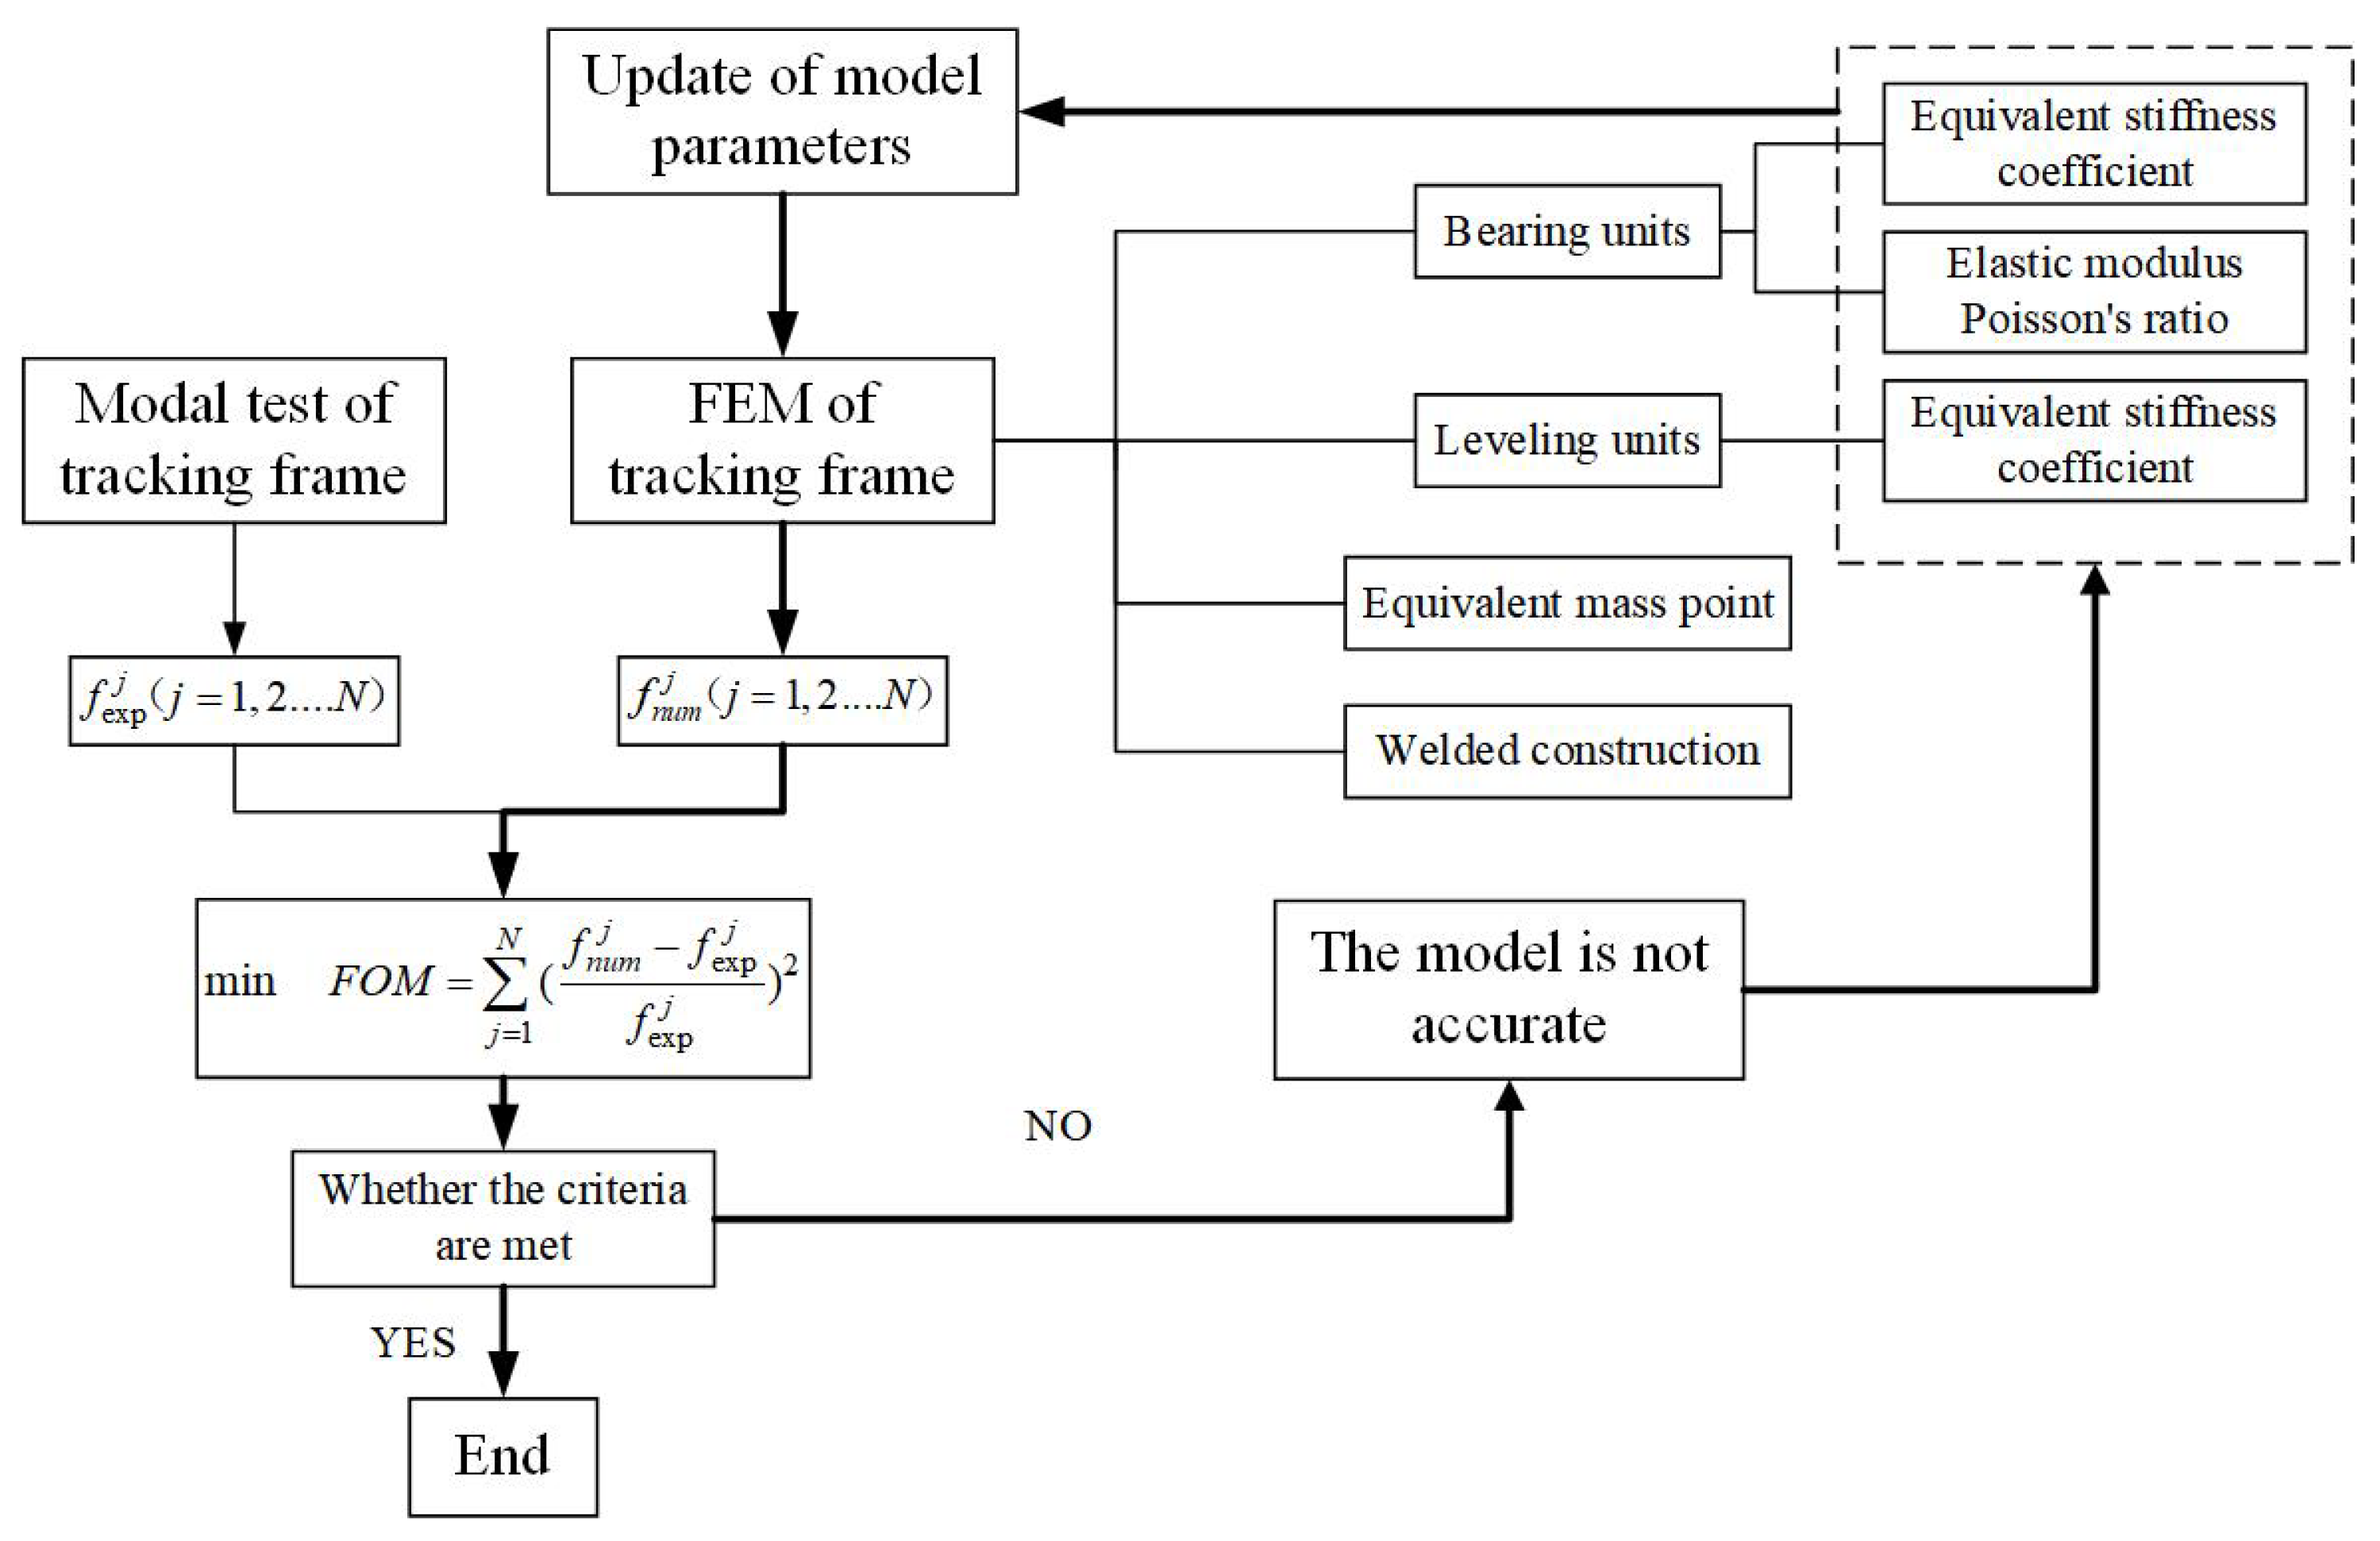
First, a modal test is implemented for the tracking frame of the large photoelectric theodolite, and the natural frequencies and mode shapes of the first N-order are obtained via the modal identification software. Second, a multi-parameter FEM is established, followed by a series of parametric equivalent simplifications on the three-point leveling units, bearing units, and other components. By comparing the relative error of natural frequencies obtained from experiment and simulation, the gradient-less optimization method is used to modify the model’s parameters, and a set of parameters closest to the modal test results is obtained. Figure 2 illustrates the flow chart that describes the calculation strategy employed in this paper.
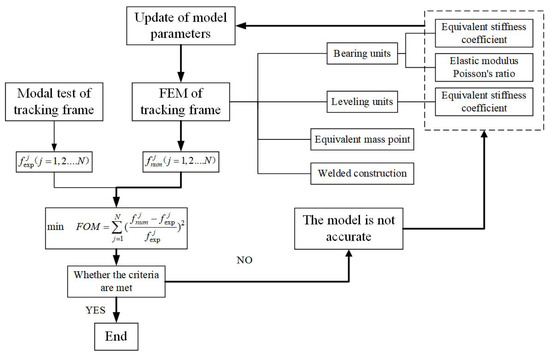
Figure 2.
Diagram of the calculation strategy employed in this paper.
The modal test is used to determine the first N-order natural frequencies of the structure, while finite element parameterization is used to model the principal boundary conditions affecting the dynamic characteristics of the structure.
By defining a numerical optimization model, aiming at minimizing the sum of squares of the relative errors of the natural frequencies between the simulation and the experiment, the precise numerical calculation of the boundary condition parameters of the tracking frame is obtained by using the gradient-less optimization approach. The following Formula (1) describes the aforementioned calculation strategy:
In Formula (1), represents the objective function defined in this paper; represents the first N-order natural frequencies obtained from the experiment; represents the first N-order natural frequencies obtained by numerical simulation; represents the elastic modulus of the specified structure; represents its Poisson’s ratio; and represents the tangential contact stiffness and normal contact stiffness of the specified structure.
The minimum to maximum range that can be imposed on the actual model applies to the elastic modulus constraint . In a similar manner, , and represent the constraints of Poisson’s ratio, tangential contact stiffness, and normal contact stiffness, respectively.
In this paper, the convergence criterion for the gradient-less optimization approach is Inequation (2). Notably, the dynamic model presented in this article focuses primarily on the lower-order frequencies of the tracking frame, only the relative error of the first four-order natural frequencies is restricted.
where represents the criterion, the value in this paper is 6%. It is noted that as the value of decreases, the computational precision and difficulty simultaneously increase.
3. Modal Test Layout and Results
In this section, the layout of the tracking frame modal test is introduced in Section 3.1. The results of the modal test are presented in Section 3.2.
3.1. Modal Test Layout of the Tracking Frame
In recent decades, experimental modal analysis (EMA) techniques have grown in popularity due to the affordability of modal test systems and the usability of their associated software [22,23]. By analyzing the excitation force and response in the time domain or frequency domain, the frequency response function of the system can be derived. The frequency, damping, and modal vector information are then obtained through the technique of identifying modal parameters.
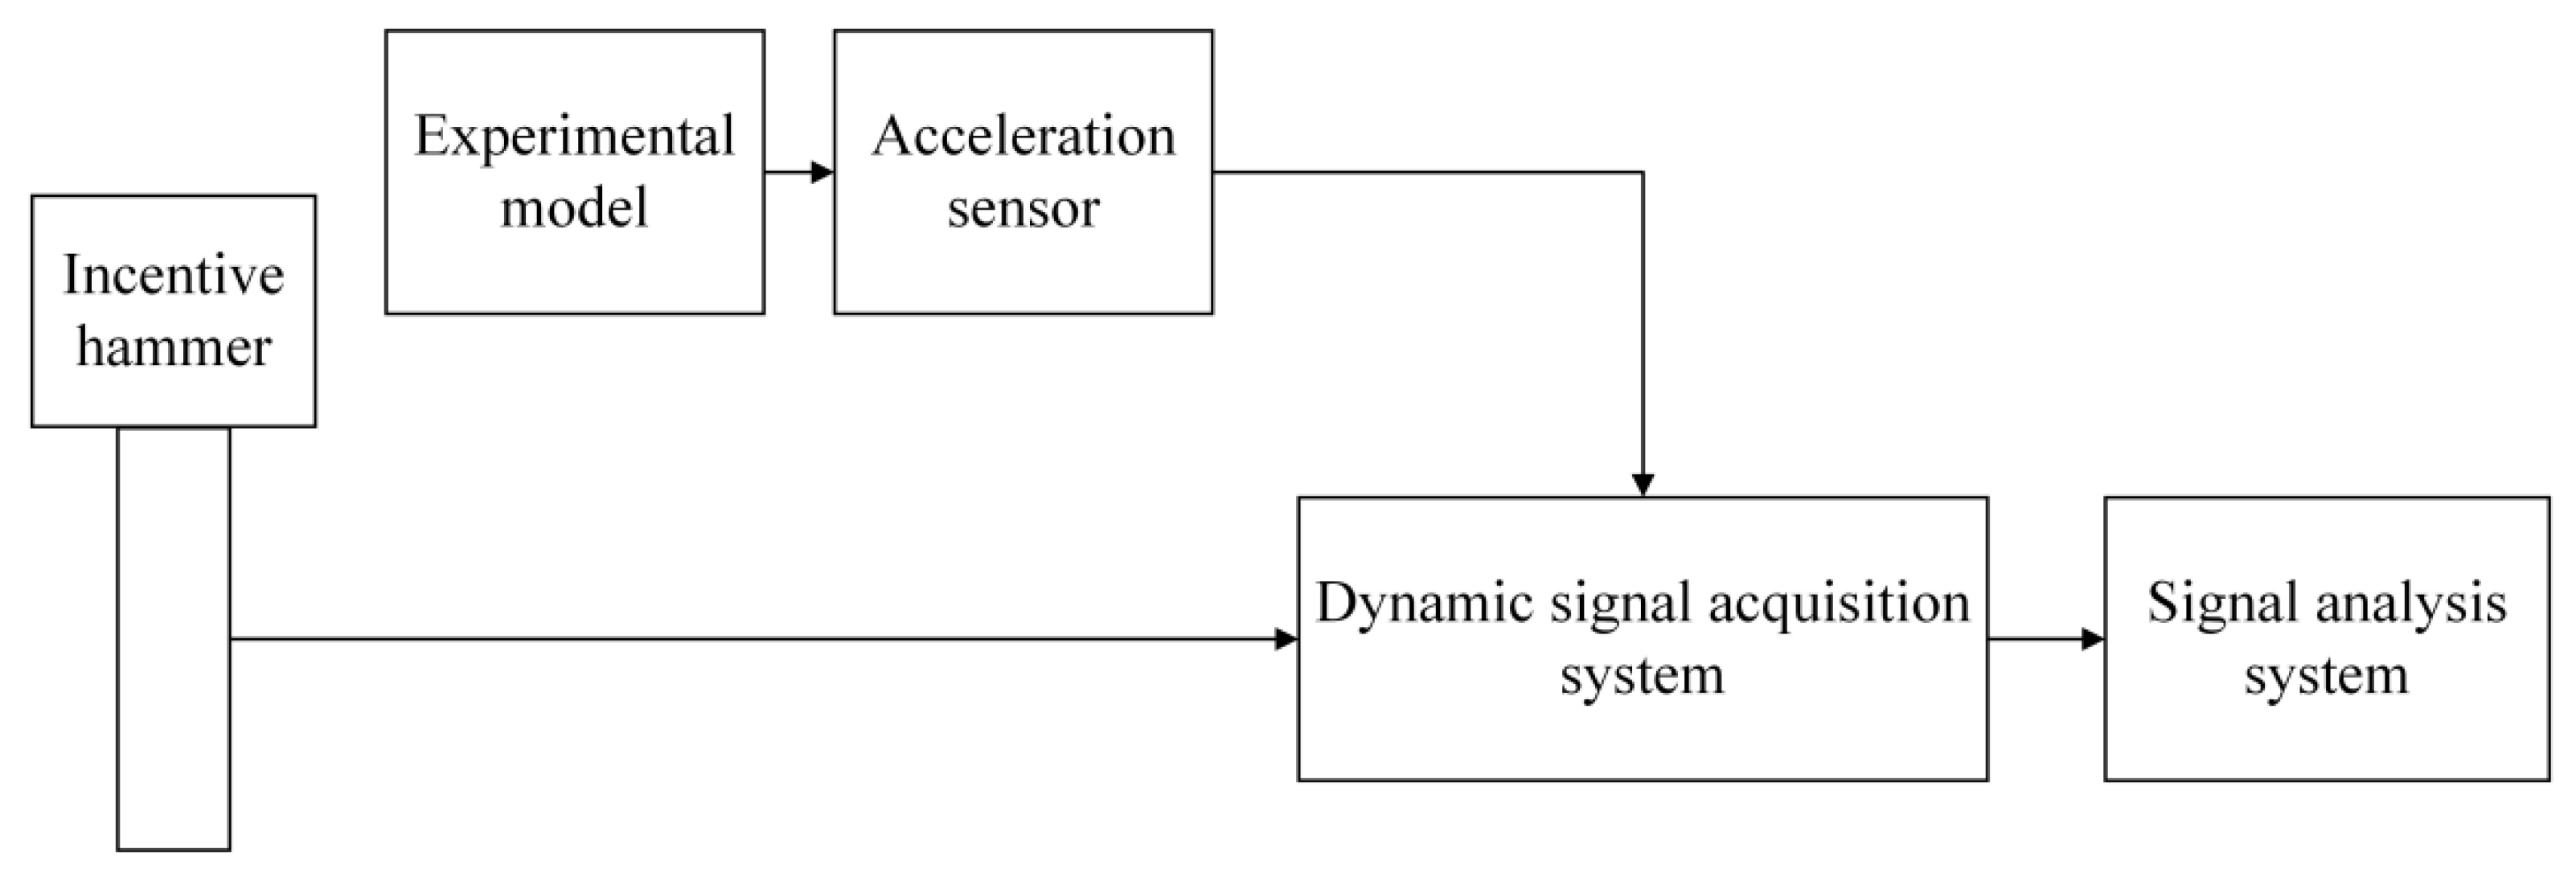
The process of modal test analysis includes the steps of applying excitation, acquiring parameters, and identifying parameters. In this article, the standard hammering method for modal testing is adopted. To obtain impulse excitation signals and acceleration response signals, hammering and a controller for dynamic signal analysis are employed. The data are then processed using modal parameter identification. Figure 3 depicts the flowchart of the modal test analysis.
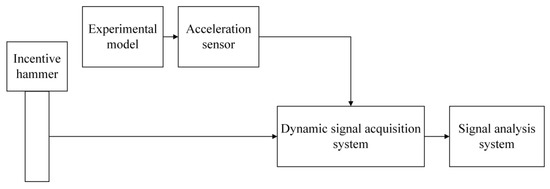
Figure 3.
Flowchart of modal test analysis.
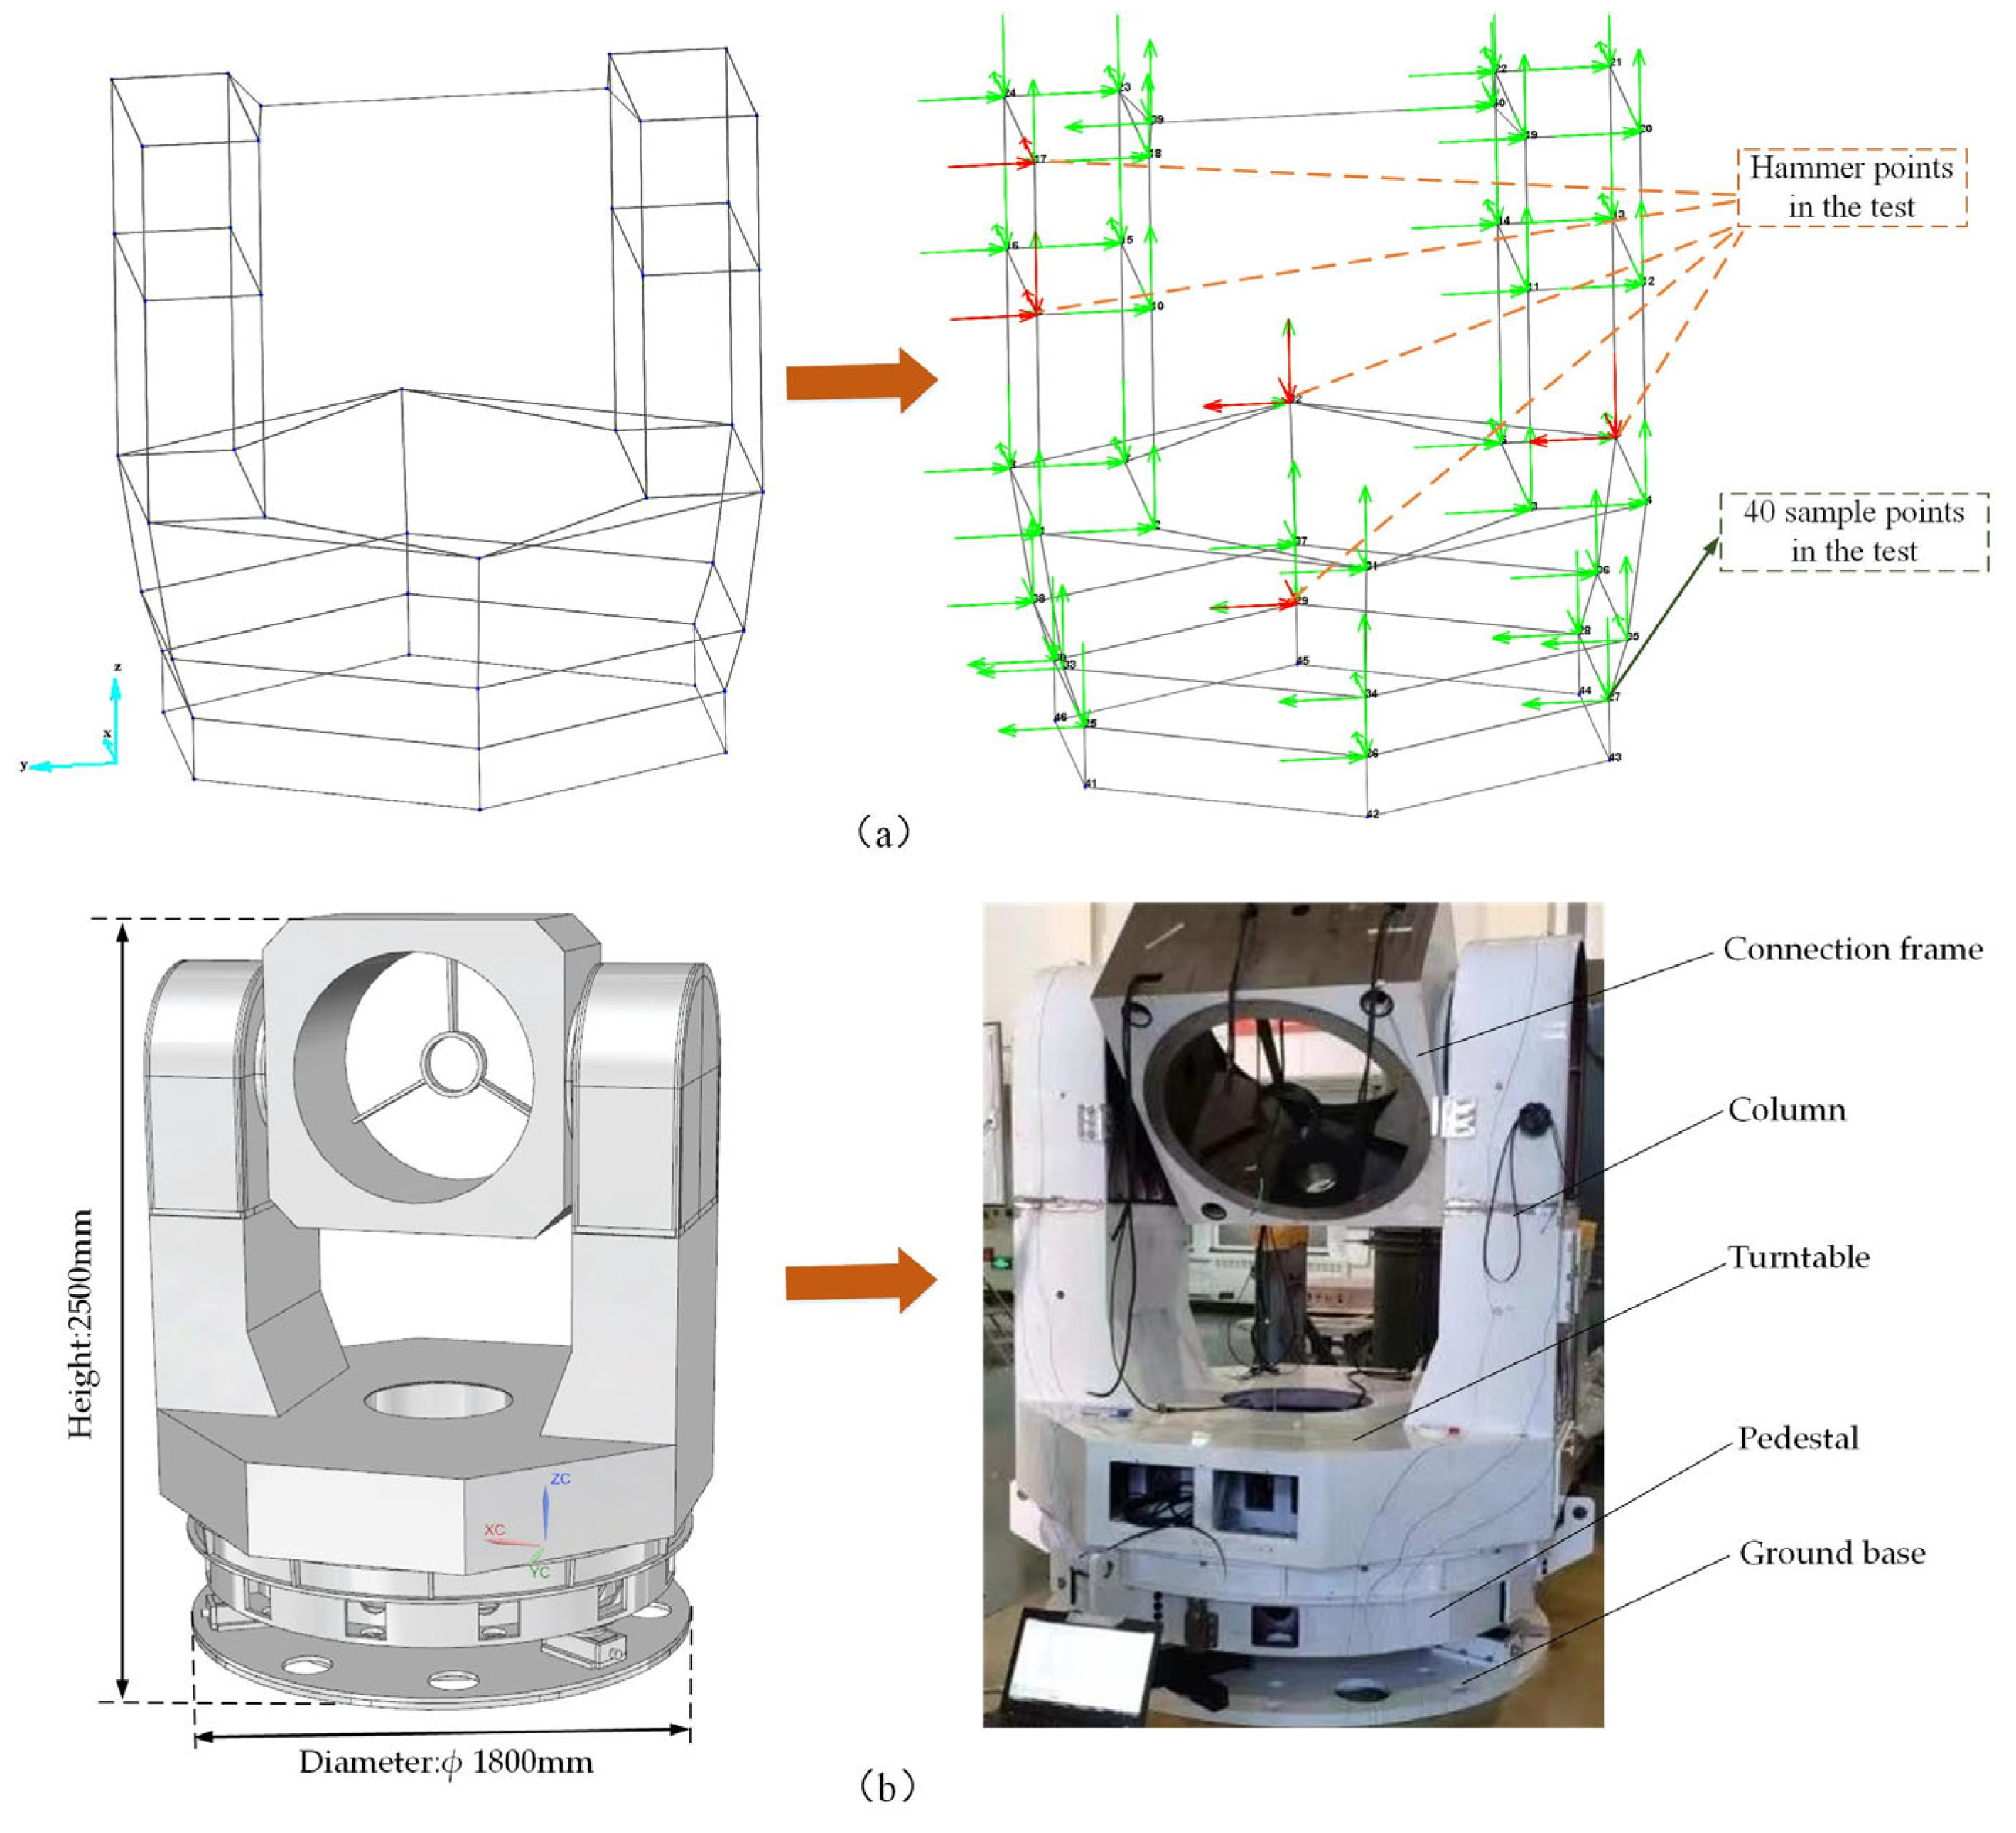
Modal tests require the layout of the test points of the test model to be planned in advance. The test points consist of response points and excitation points. After determining the distribution of test points, the spatial location of the test model must be determined, and the 3D coordinate values of these test points must be entered into the software used for modal identification. During the evaluation of this system, the response points of each sensor and the excitation points of the force hammer are shown in Figure 4. In this test, 40 response points were arranged according to the position coordinates of the actual model. To characterize the bending and rotation modes of the column, 16 response points are arranged on the left and right columns of the tracking frame. Ten response points are arranged on the upper surface of the turntable to characterize the torsional mode of the vertical axis system. Eight response points are arranged in the circumferential direction of the pedestal to characterize the shaking mode of the entire machine. Two response points are arranged on the connecting frame to characterize the bending mode of the horizontal axis system. In the final step, six response points are arranged in a circumferential direction around the ground base.
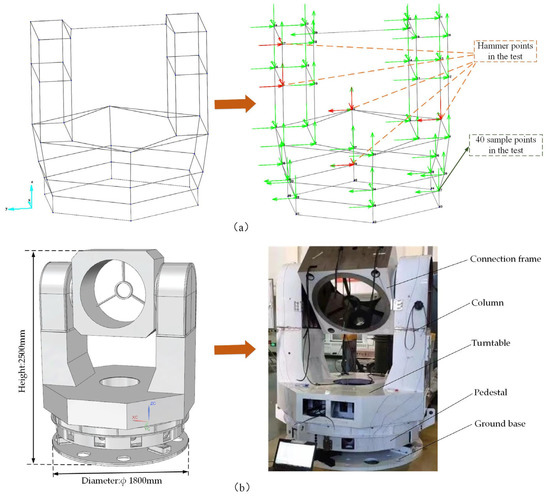
Figure 4.
Modal test configuration of the tracking frame. (a) The arrangement of response points and excitation points. (b) The components of the experimental model.
In Figure 4a, the red arrows represent the test’s excitation points and directions, with a total of 5 points and 11 directions. They are, respectively, located at the middle and upper left column, the bottom of the right column, the upper surface of the turntable and the lower surface of the pedestal. Note that all effective information of the transfer function matrix is obtained by moving the sensors without changing the position of the excitation points. Therefore, the modes obtained by each group of excitations are only partial modes. After all the excitations and sensor movements are completed, all the data are processed by N-modal software.
Because of the self-weight of the entire machine, this test can be regarded as a constrained modal test under the condition of imposing fixed constraints on the ground base’s bottom surface. In order to obtain the accurate frequency response function, each excitation point is struck three times in its set direction, and the excitation signals were treated by linear averaging. Table 1 details the acquisition instrument and sensor configuration parameters, while Table 2 details the modal test configuration parameters.

Table 1.
Configuration parameters of the acquisition instrument and sensors.

Table 2.
Configuration parameters of the modal test.
3.2. Results of Linear Modal Test
The test results are obtained using the modal test method. The acceleration sensor and force sensor signals are imported into the modal analysis software N-Modal in order to calculate the frequency response function. Utilizing the BBFD (Broadband in Frequency Domain) identification method.
Mode shapes are less intuitive to quantitatively compare than modal frequencies [18]. Modal Assurance Criterion (MAC) is a common method for comparing the degree of similarity between modal shapes and their respective analytical predictions.
According to [24], the MAC is defined as
where is the i-th modal vector, and is the j-th modal vector.
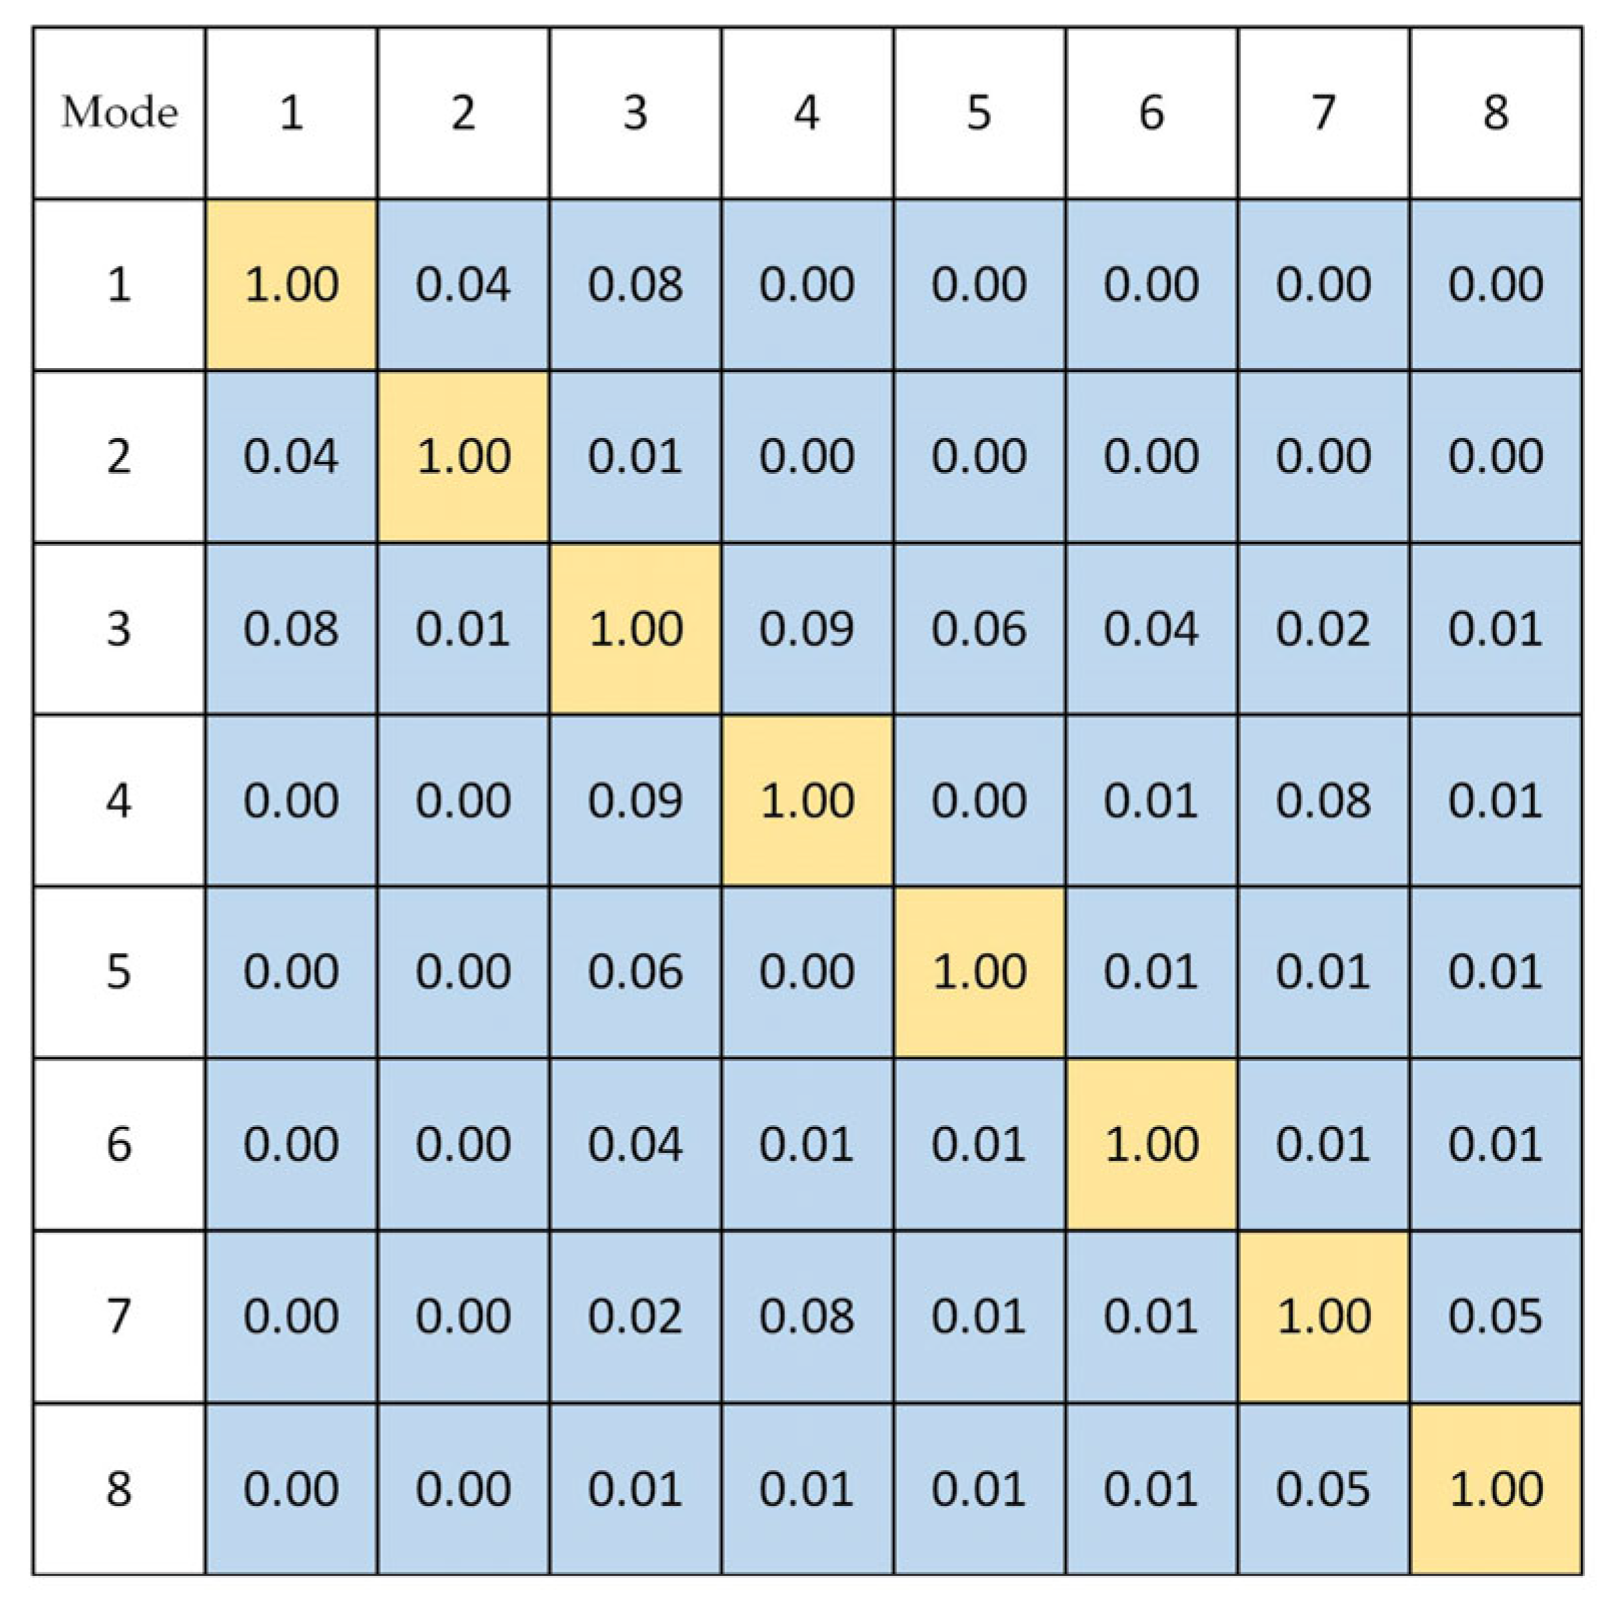
Nondiagonal elements of a MAC matrix should have values between 0 and 1. If all diagonal elements have a value of 1 and all other elements have a value of 0, then the modal vectors and are orthogonal to each other, which is also the perfect correlation. In general, however, non-diagonal elements have values less than 0.1, the result is acceptable. Figure 5 depicts the MAC diagram of the identification results. It shows that the identification results have a good modal orthogonality.
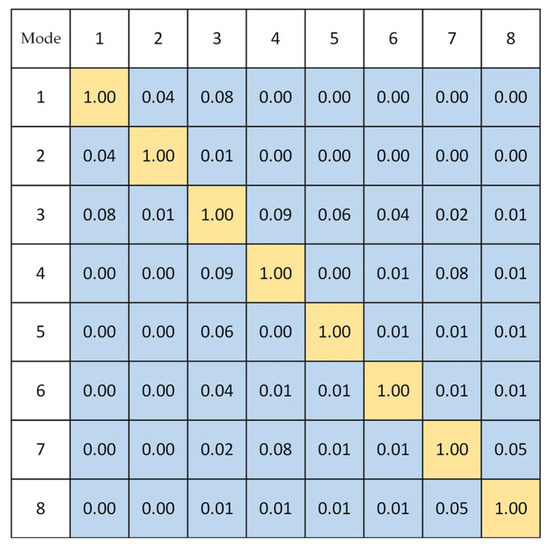
Figure 5.
MAC diagram of identification results of the modal test.
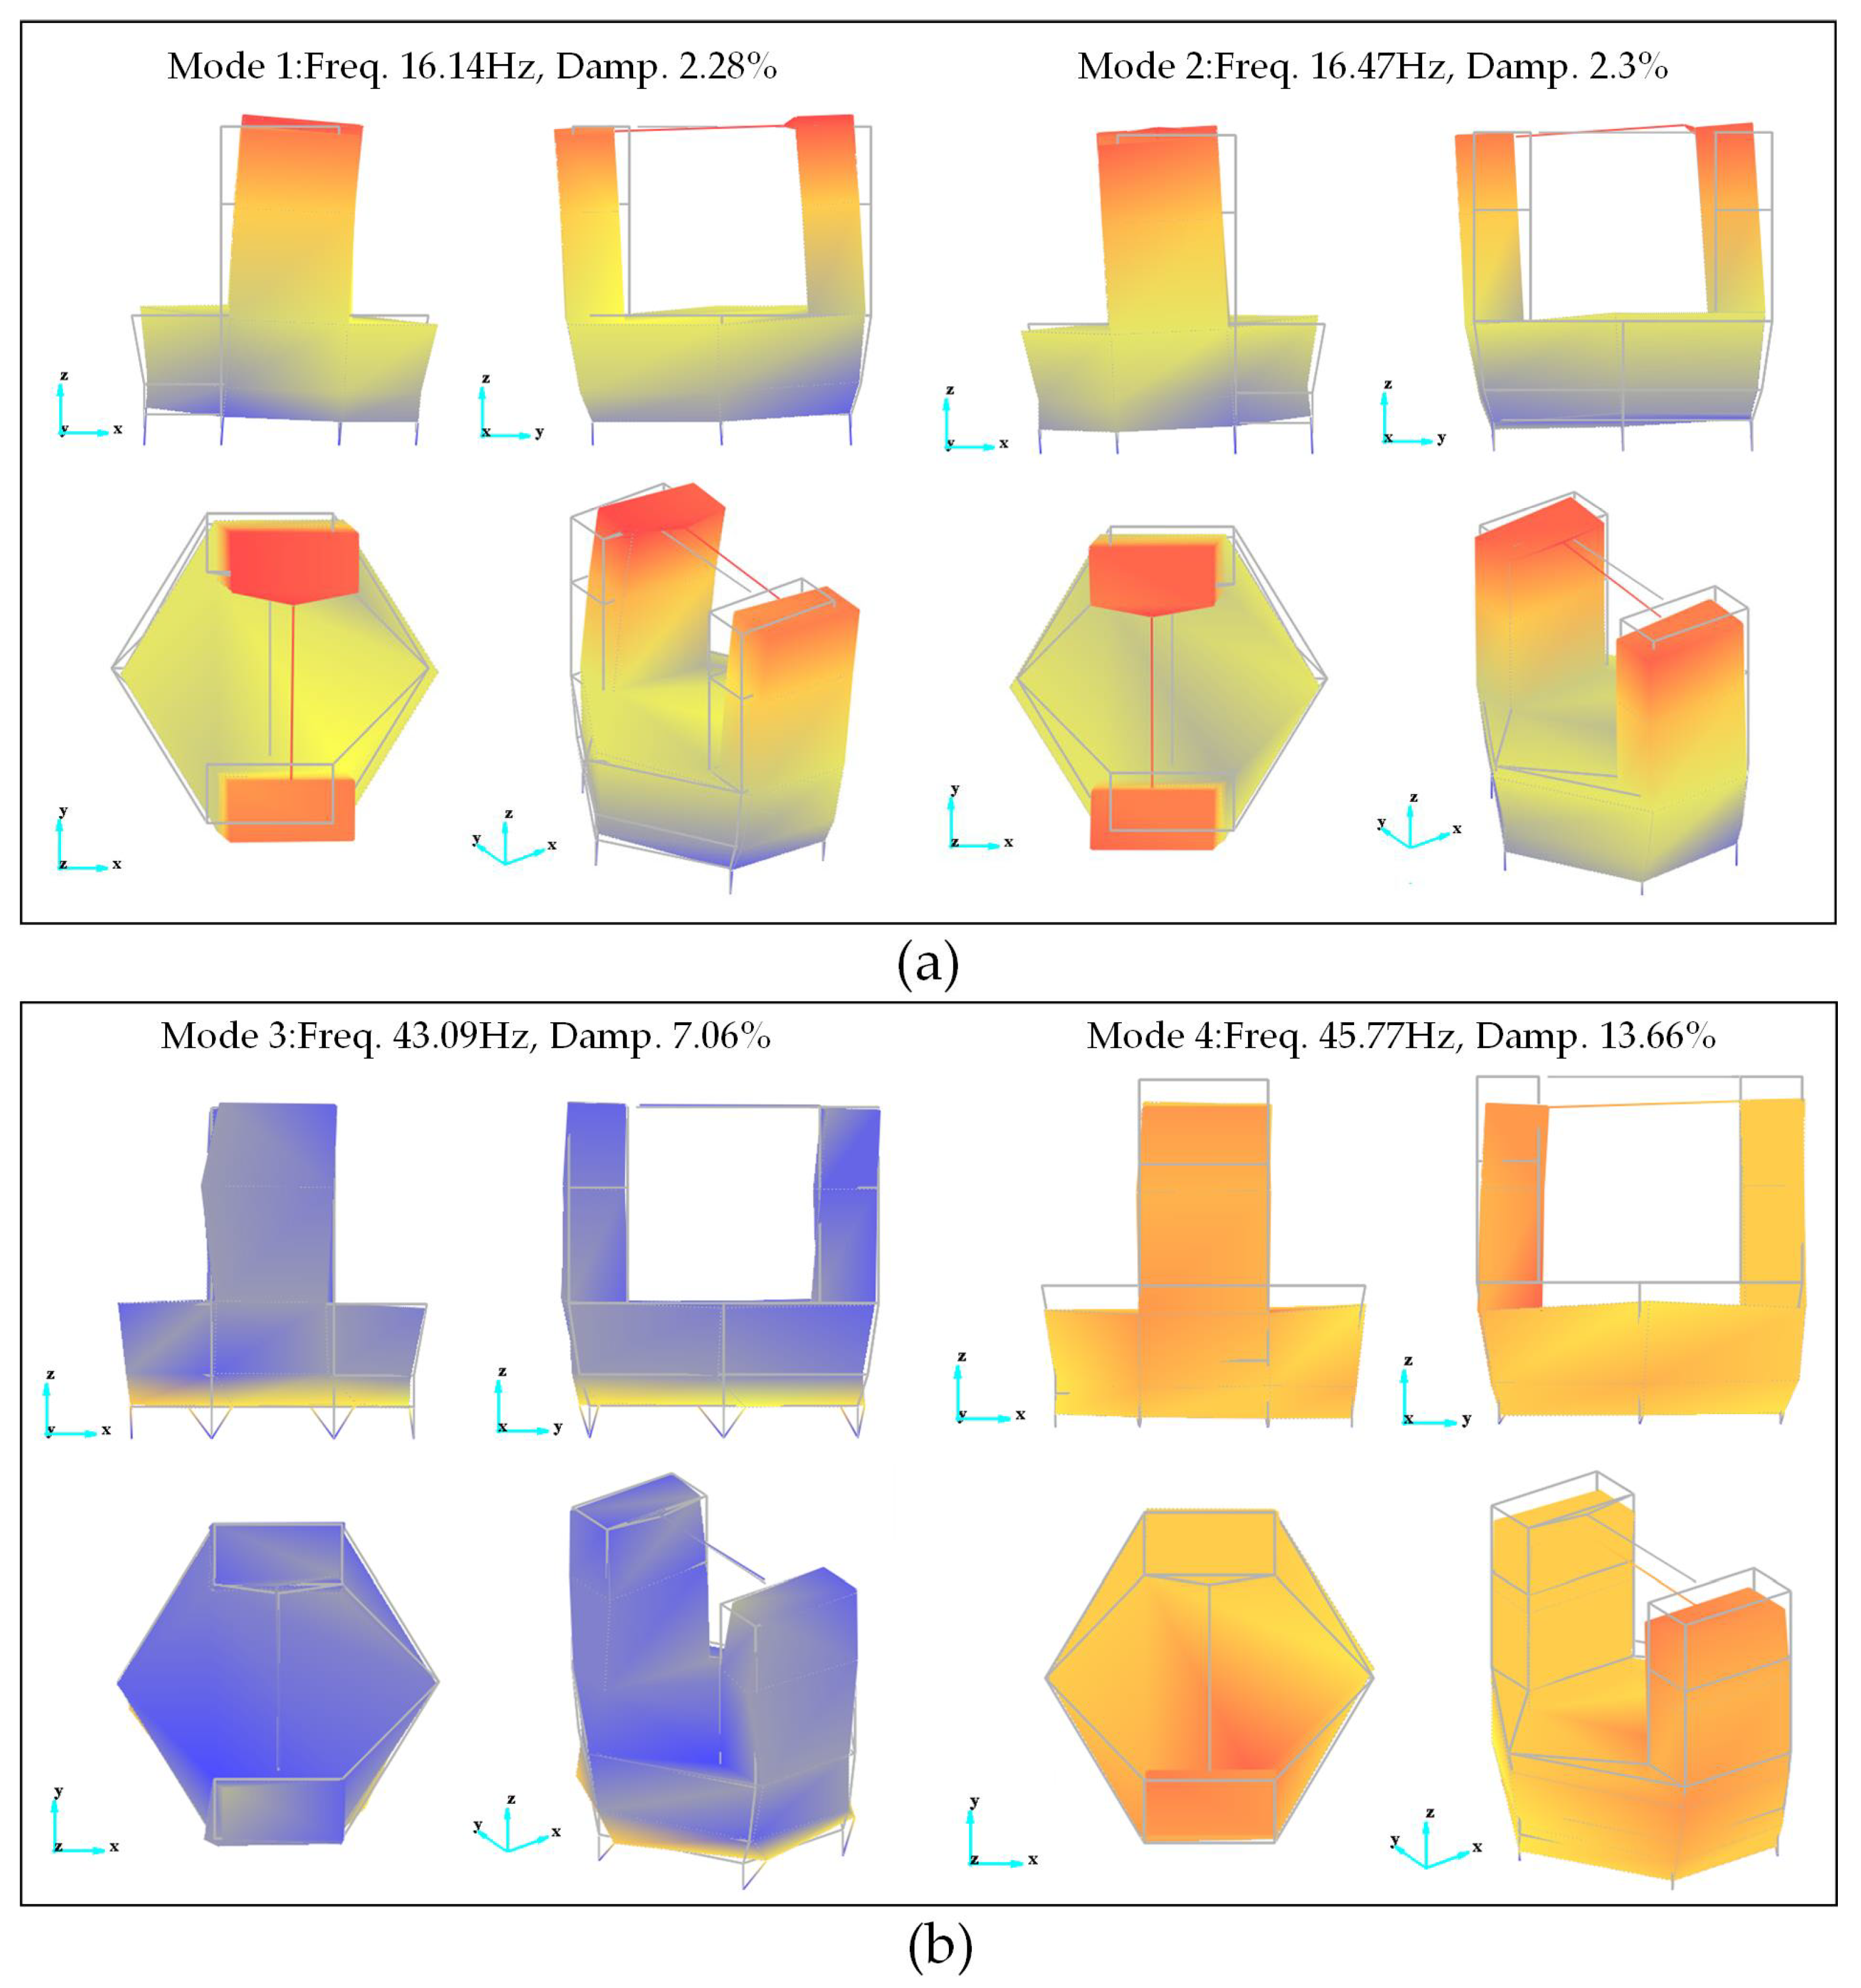
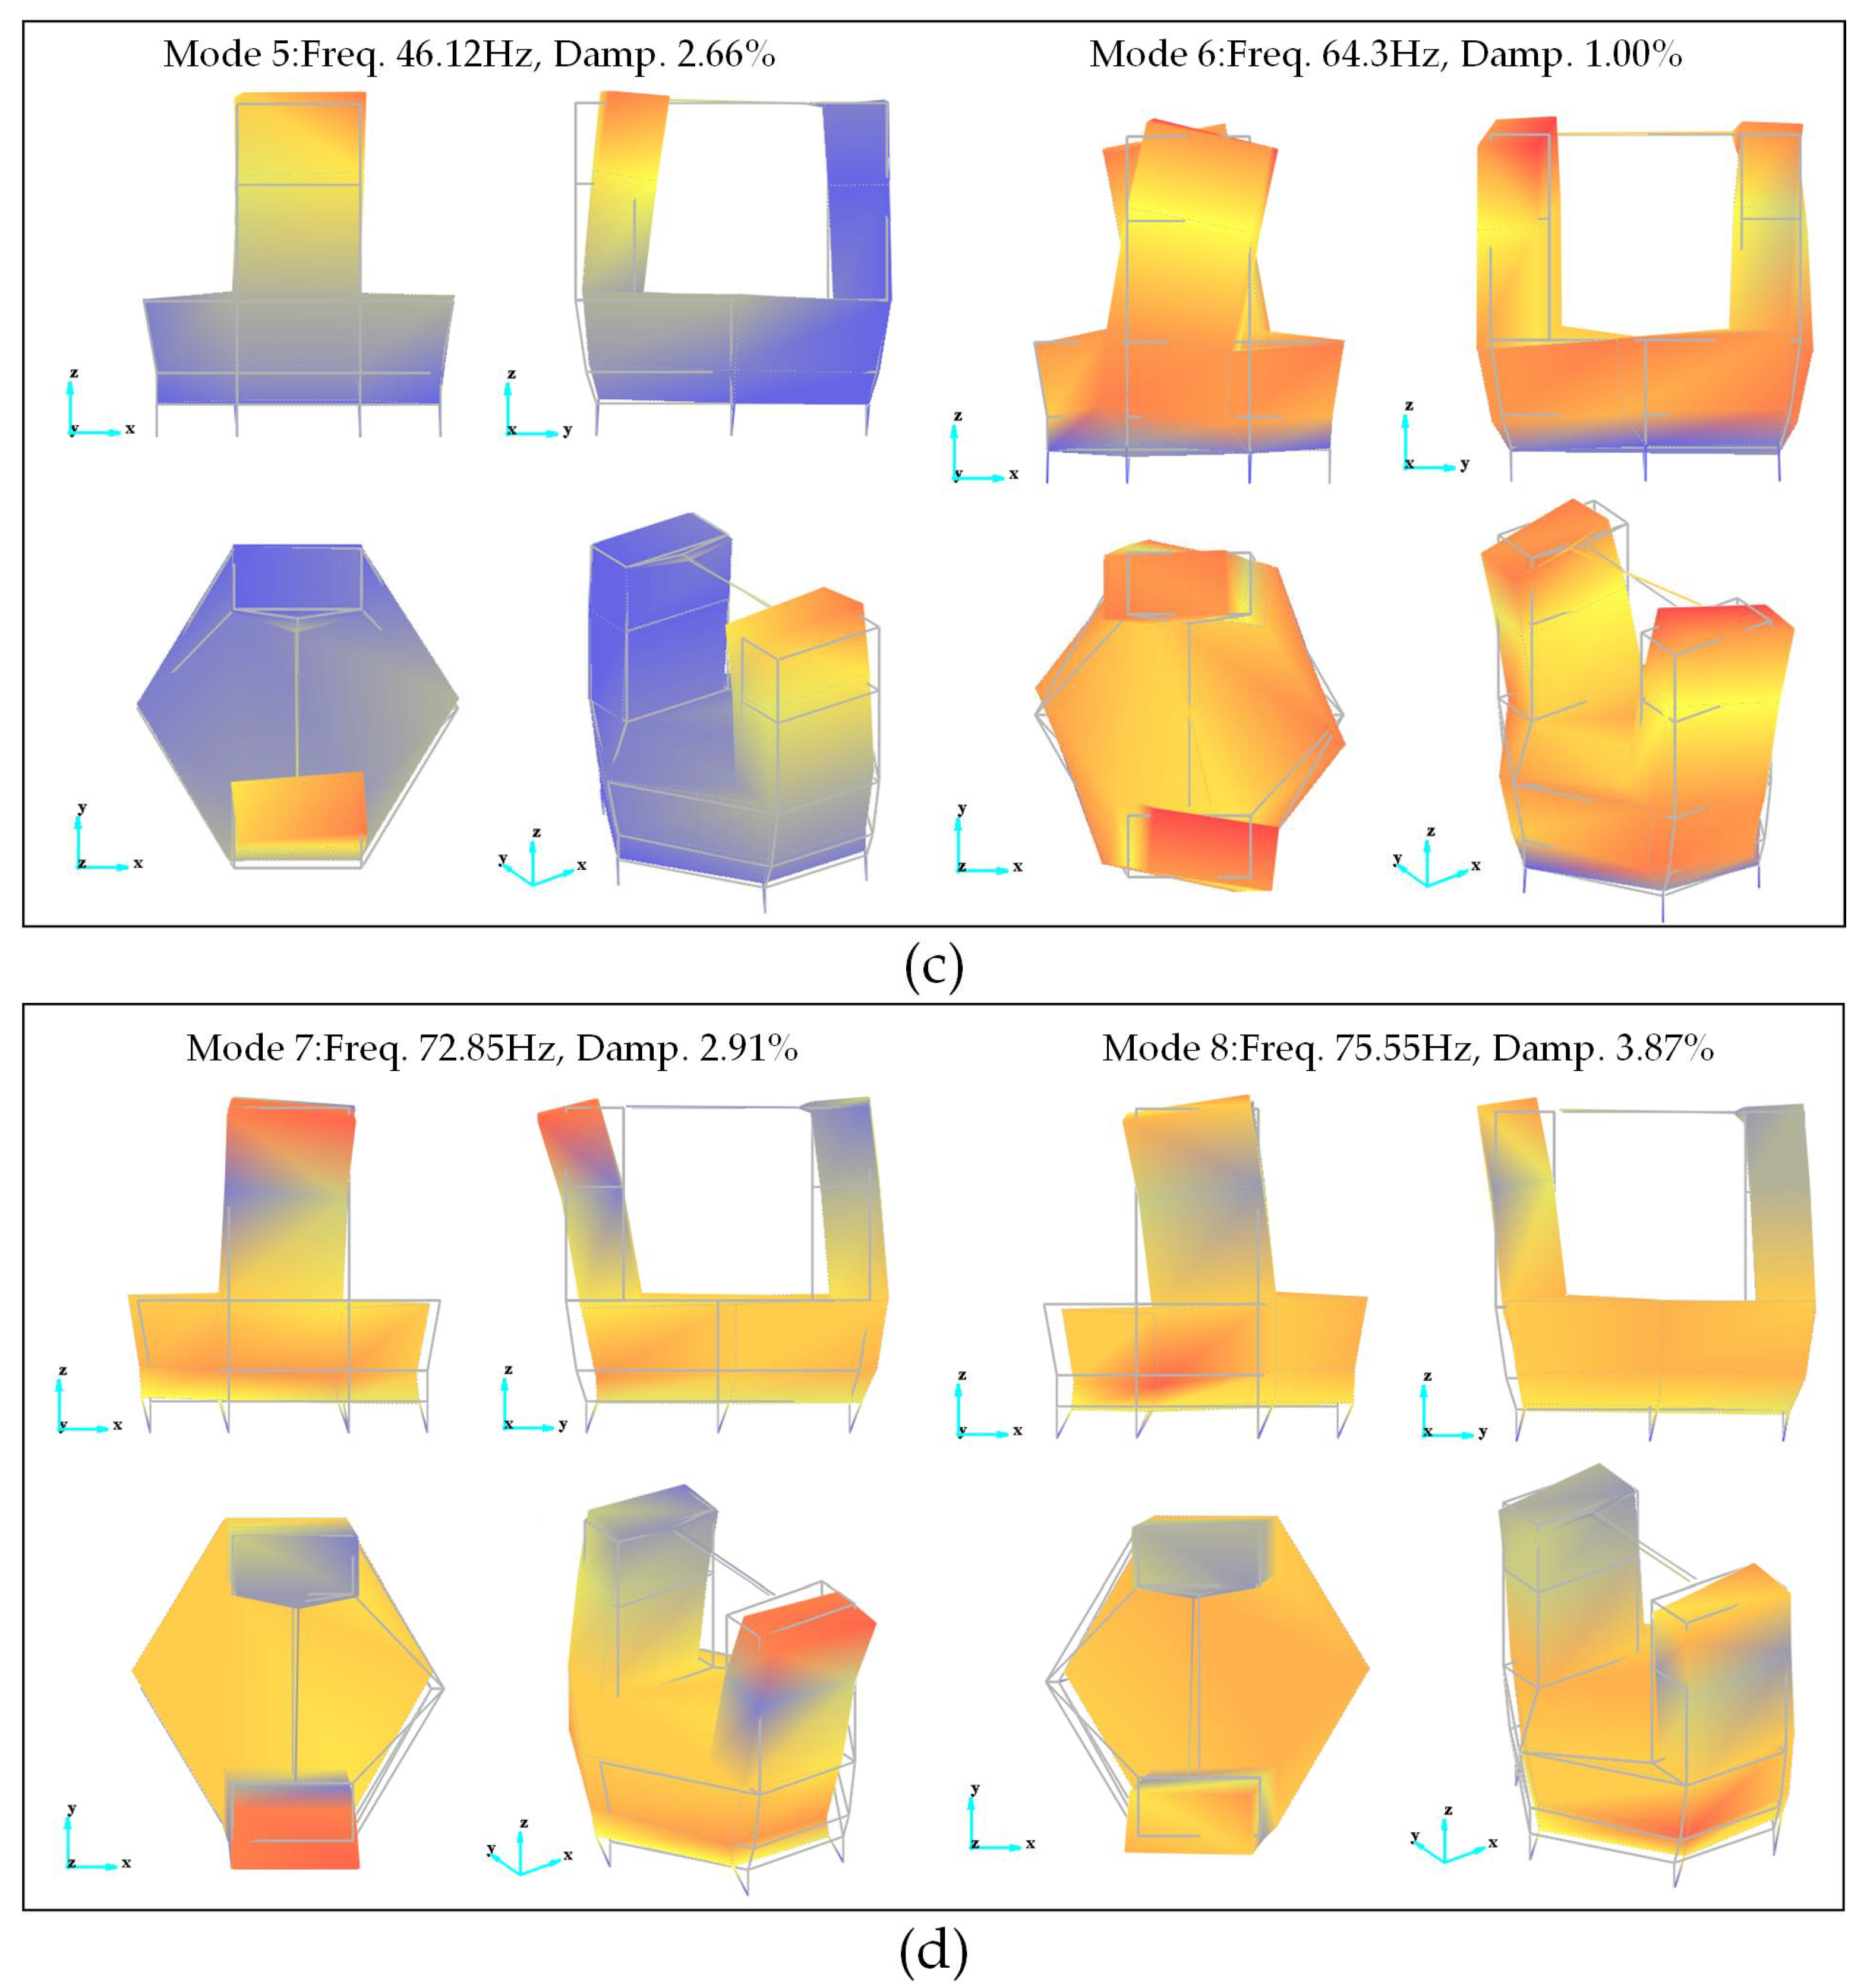
The first eight-order natural frequencies and description of mode shapes obtained from the tracking frame’s modal test are presented in Table 3. Figure 6 depicts the mode shapes corresponding to each mode order.

Table 3.
Modal test results of the tracking frame.
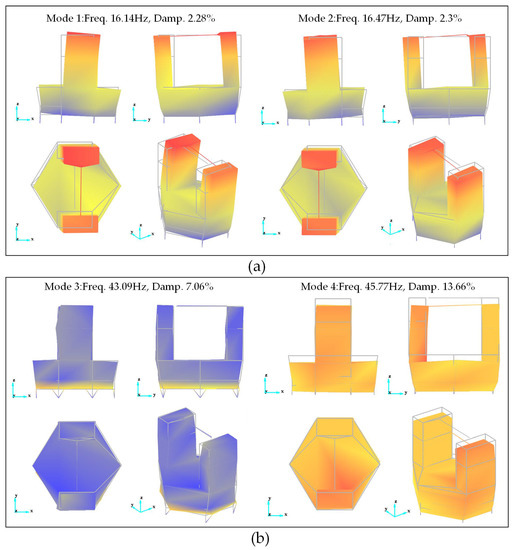
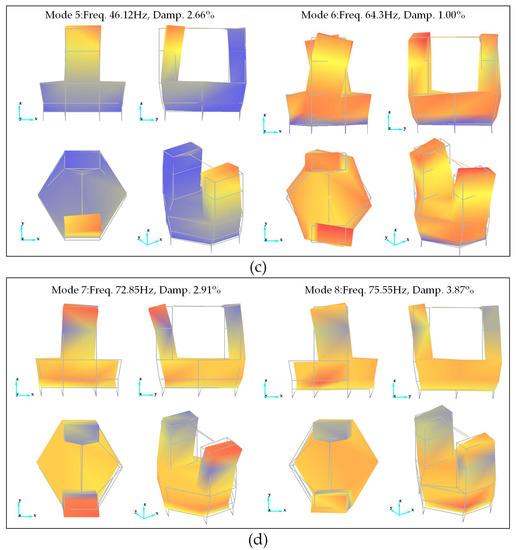
Figure 6.
The first 8-order mode shapes of the modal test. (a) The first and second order mode shapes. (b) The third and fourth order mode shapes. (c) The fifth and sixth order mode shapes. (d) The seventh and eighth order mode shapes.
The first four-order modes of the tracking frame belong to the lower modes, and their mode shapes indicate that the entire machine vibrates regularly in certain directions. Among them, the first two-order mode shapes are the unilateral bending of the entire machine around the leveling units, indicating that the leveling units exert a significant influence on the entire machine.
The third-order mode shape corresponds to the torsion of the entire machine around leveling units, the fourth-order mode shape corresponds to the heave of the entire machine along the vertical direction. The fifth-order mode shape corresponds to the bending of a single side of a column, the sixth-order mode shape corresponds to the torsion of the columns, and the seventh-order and eighth-order mode shapes correspond to the second-order bending of the entire machine.
4. Finite Element Modeling Process of the Tracking Frame
In this section, the description of the model simplification process is introduced in Section 4.1. The equivalent parameter models of bearing units and three-point leveling units are described in Section 4.2 and Section 4.3, respectively. The establishment of an equivalent parametric model is presented in Section 4.4.
4.1. Description of the Model Simplification Process
Considering that the results of the modal test are primarily dependent on the vertical axis system and that the model in this paper focuses on the lower modes of the tracking frame, the simplification process is described as follows:
The pedestal and turntable of the tracking frame have a large number of small holes and rounded corners in their welded structure. These characteristics have a negligible effect on the model’s precision and result in poor local mesh quality. Therefore, the model eliminates the small holes and rounded corners found within the pedestal and turntable.
This model is equivalent to load structures such as torque motors within the tracking frame by adding equal-weight solid structures at the corresponding centroid positions.
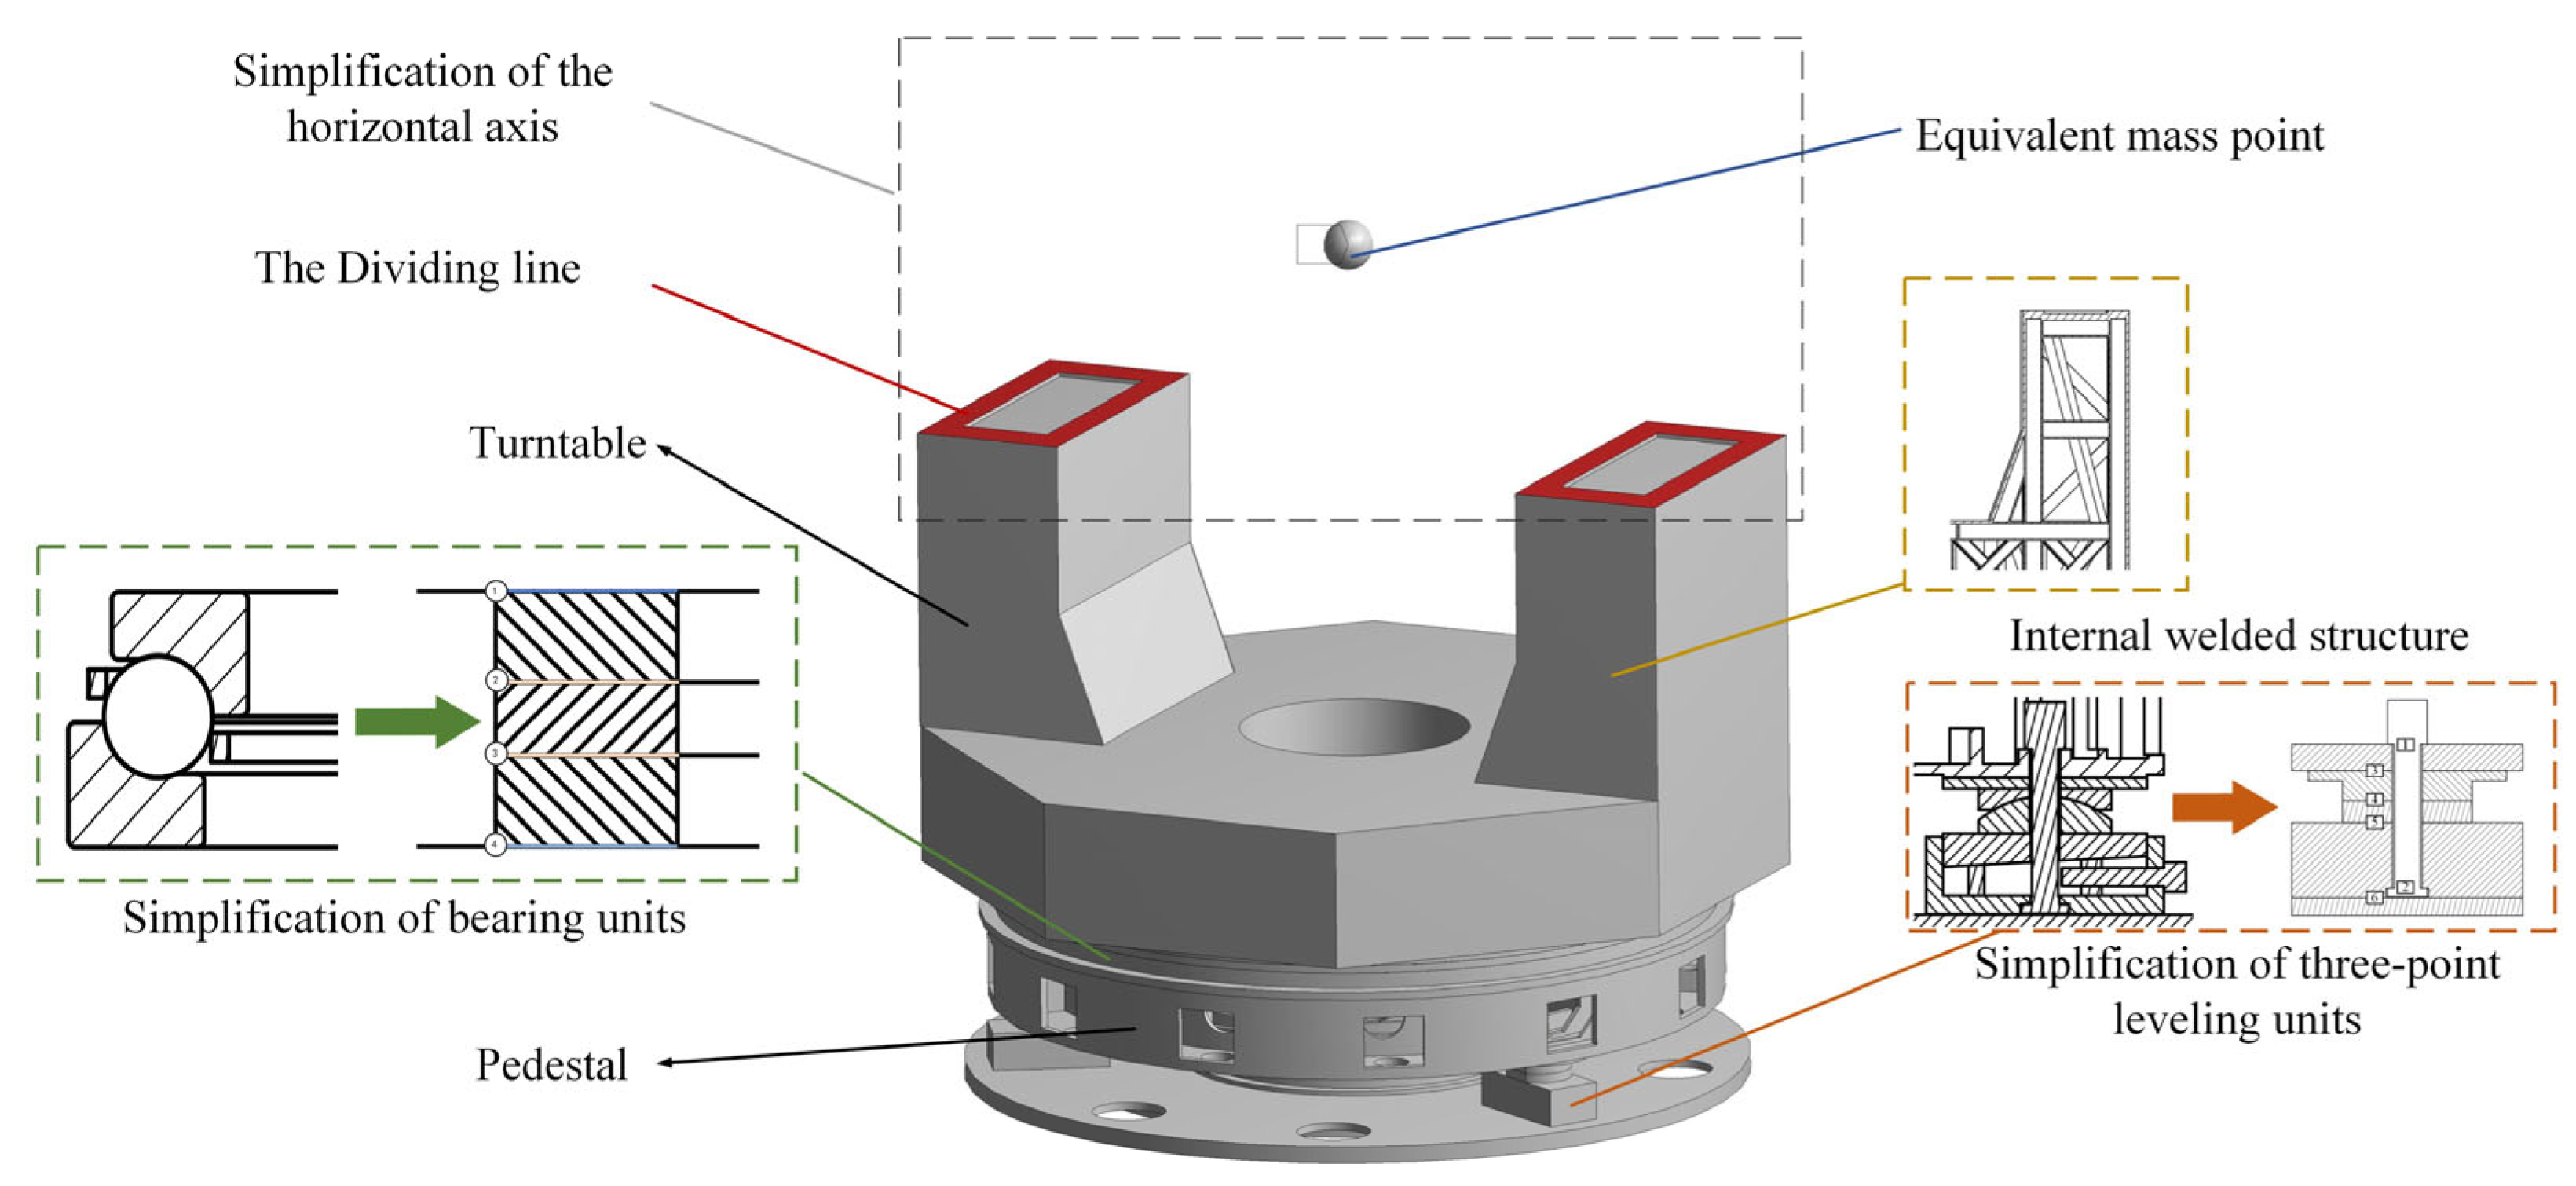
Take the top surfaces on both sides of the turntable as the dividing line for the horizontal axis system of the tracking frame and consider the components above the dividing line as the load of all structures below the dividing line. Calculate the component’s total mass and centroid position on the boundary, and then add equivalent mass points to the model.
In Section 4.2 and Section 4.3, the simplified procedure for the bearing units and three-point leveling units of the tracking frame will be described in detail. Figure 7 shows the schematic diagram of the simplified process of the tracking frame model.
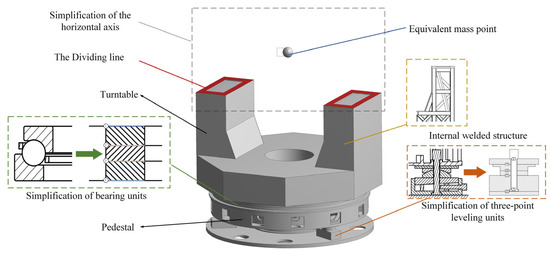
Figure 7.
Schematic diagram of the simplified process of tracking frame model.
4.2. Equivalent Parametric Model of Bearing Units
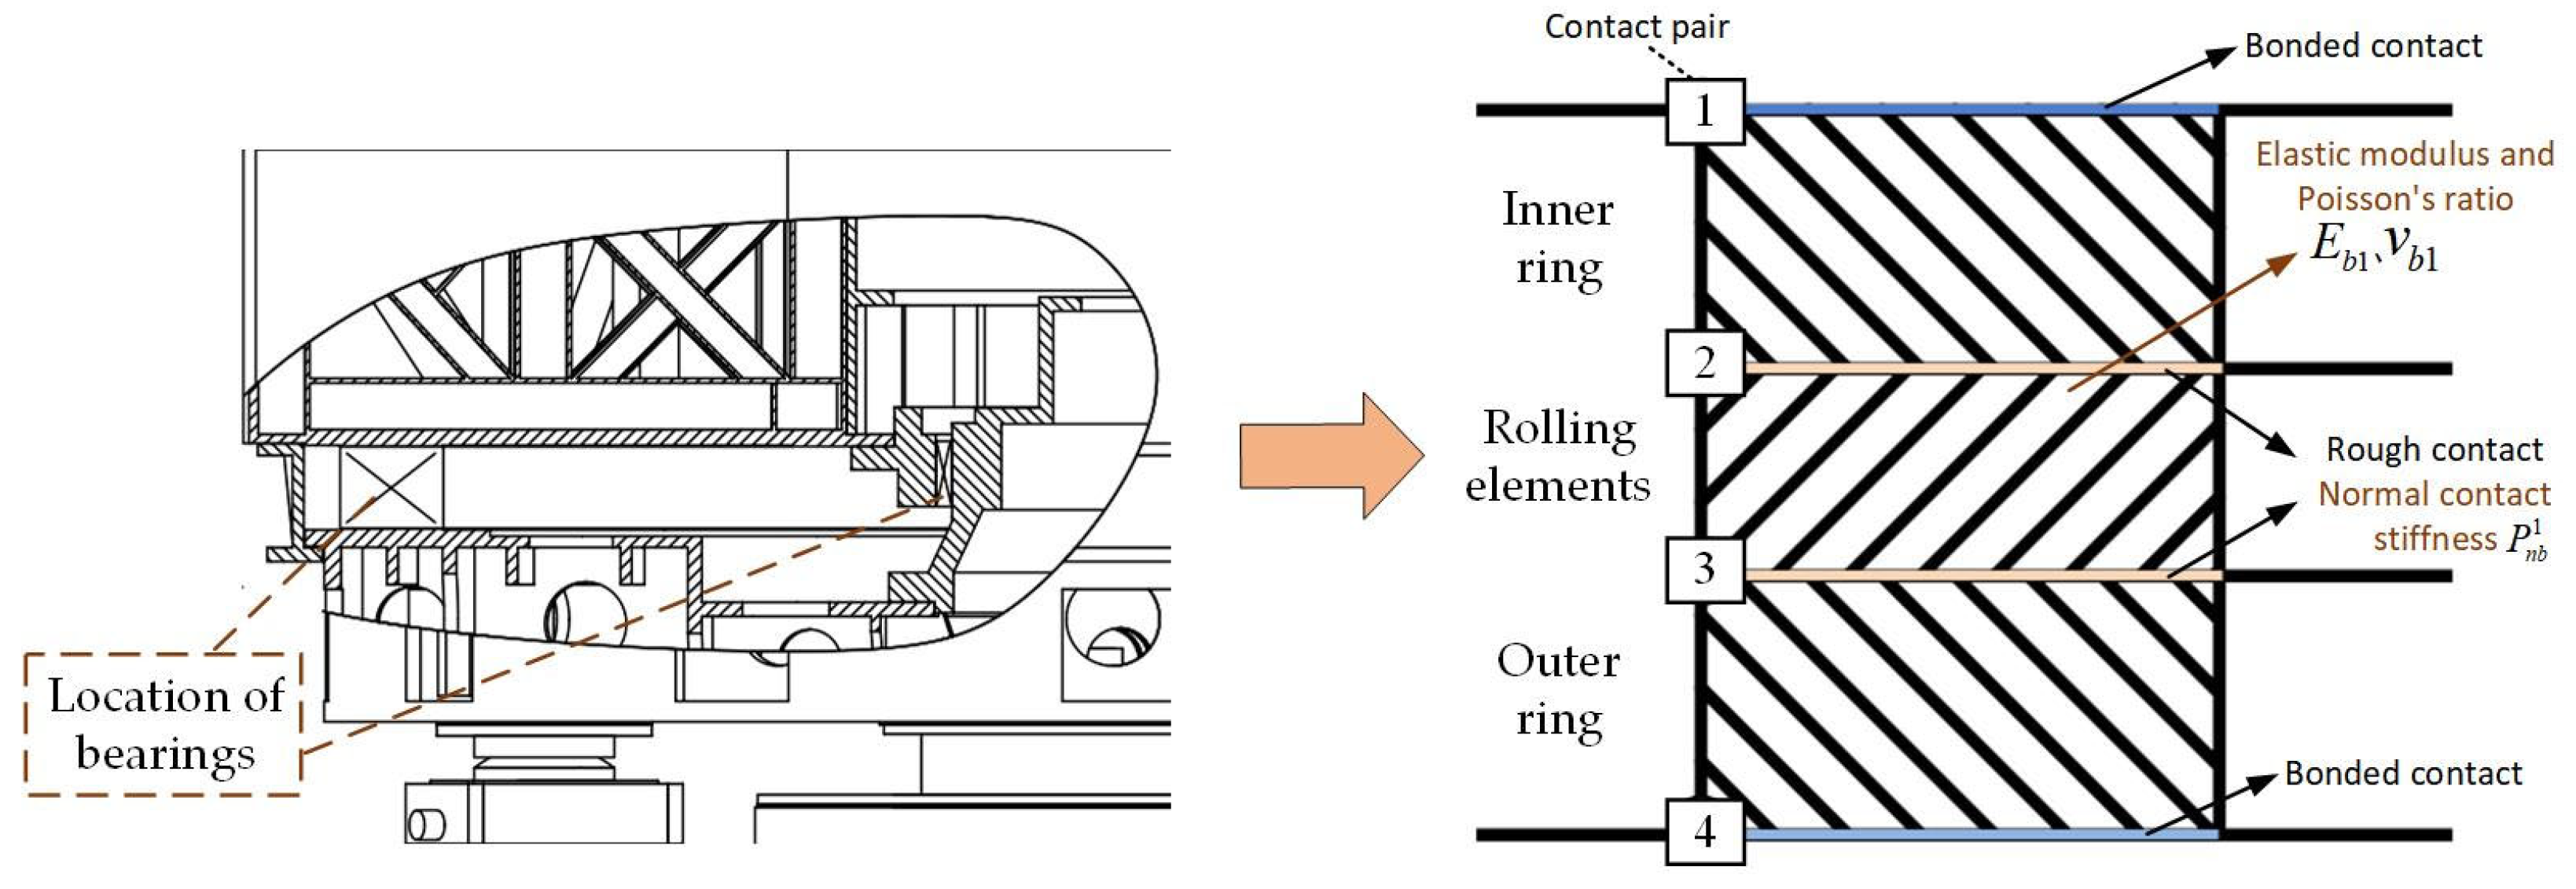
Considering the contact conditions within the bearing units are complicated, it is necessary to simplify them to ensure the convergence of the calculation model. As the purpose of this model is to investigate the vibration characteristics of the entire tracking frame, the bearing units have been simplified with a model of equal stiffness parts. To facilitate explanation, a single-bearing unit is used as an example here. The inner and outer rings and rolling elements of the bearing are reduced to three solid rings.
Contact is a nonlinear problem type. When two contact bodies touch or separate, there will be an abrupt change in stiffness, also known as the nonlinear behavior of state change. In the calculation of simple linear modal analysis, all contact surfaces are considered bonded to each other, and all nonlinear contact conditions are treated as linear. However, the prestress modal is calculated on the basis of the static results and the nonlinear contact behavior is considered in the process of static calculation. Consequently, it is essential to set the appropriate contact type for the model. Figure 8 depicts the contact pairs of a single-bearing unit in schematic form.
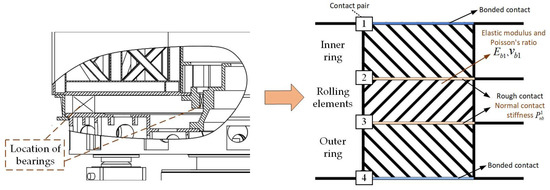
Figure 8.
Schematic diagram of the contact pairs of a single-bearing unit.
In accordance with the preceding description, the bearing unit has been reduced to three solid rings, which correspond to four contact pairs. Contact pair 2 between the inner ring and rolling elements and contact pair 3 between the outer ring and rolling elements are of the same contact type and are both set to a rough contact type that permits normal separation and greater friction in the tangential direction (specifies asymmetric contact behavior, using augmented Lagrange contact algorithm). The contact types of contact pair 1 and contact pair 4 between the inner and outer rings and the fixed surface are identical; they are both set to a bonded contact type that prohibits normal and tangential separation, and the Multi-Point Constraints (MPC) contact algorithm is implemented. The elastic modulus and Poisson’s ratio are assigned to the ring of rolling elements, and the normal contact stiffness is assigned to each contact surface of contact pairs 2 and 3.
4.3. Equivalent Parametric Model of Three-Point Leveling Units
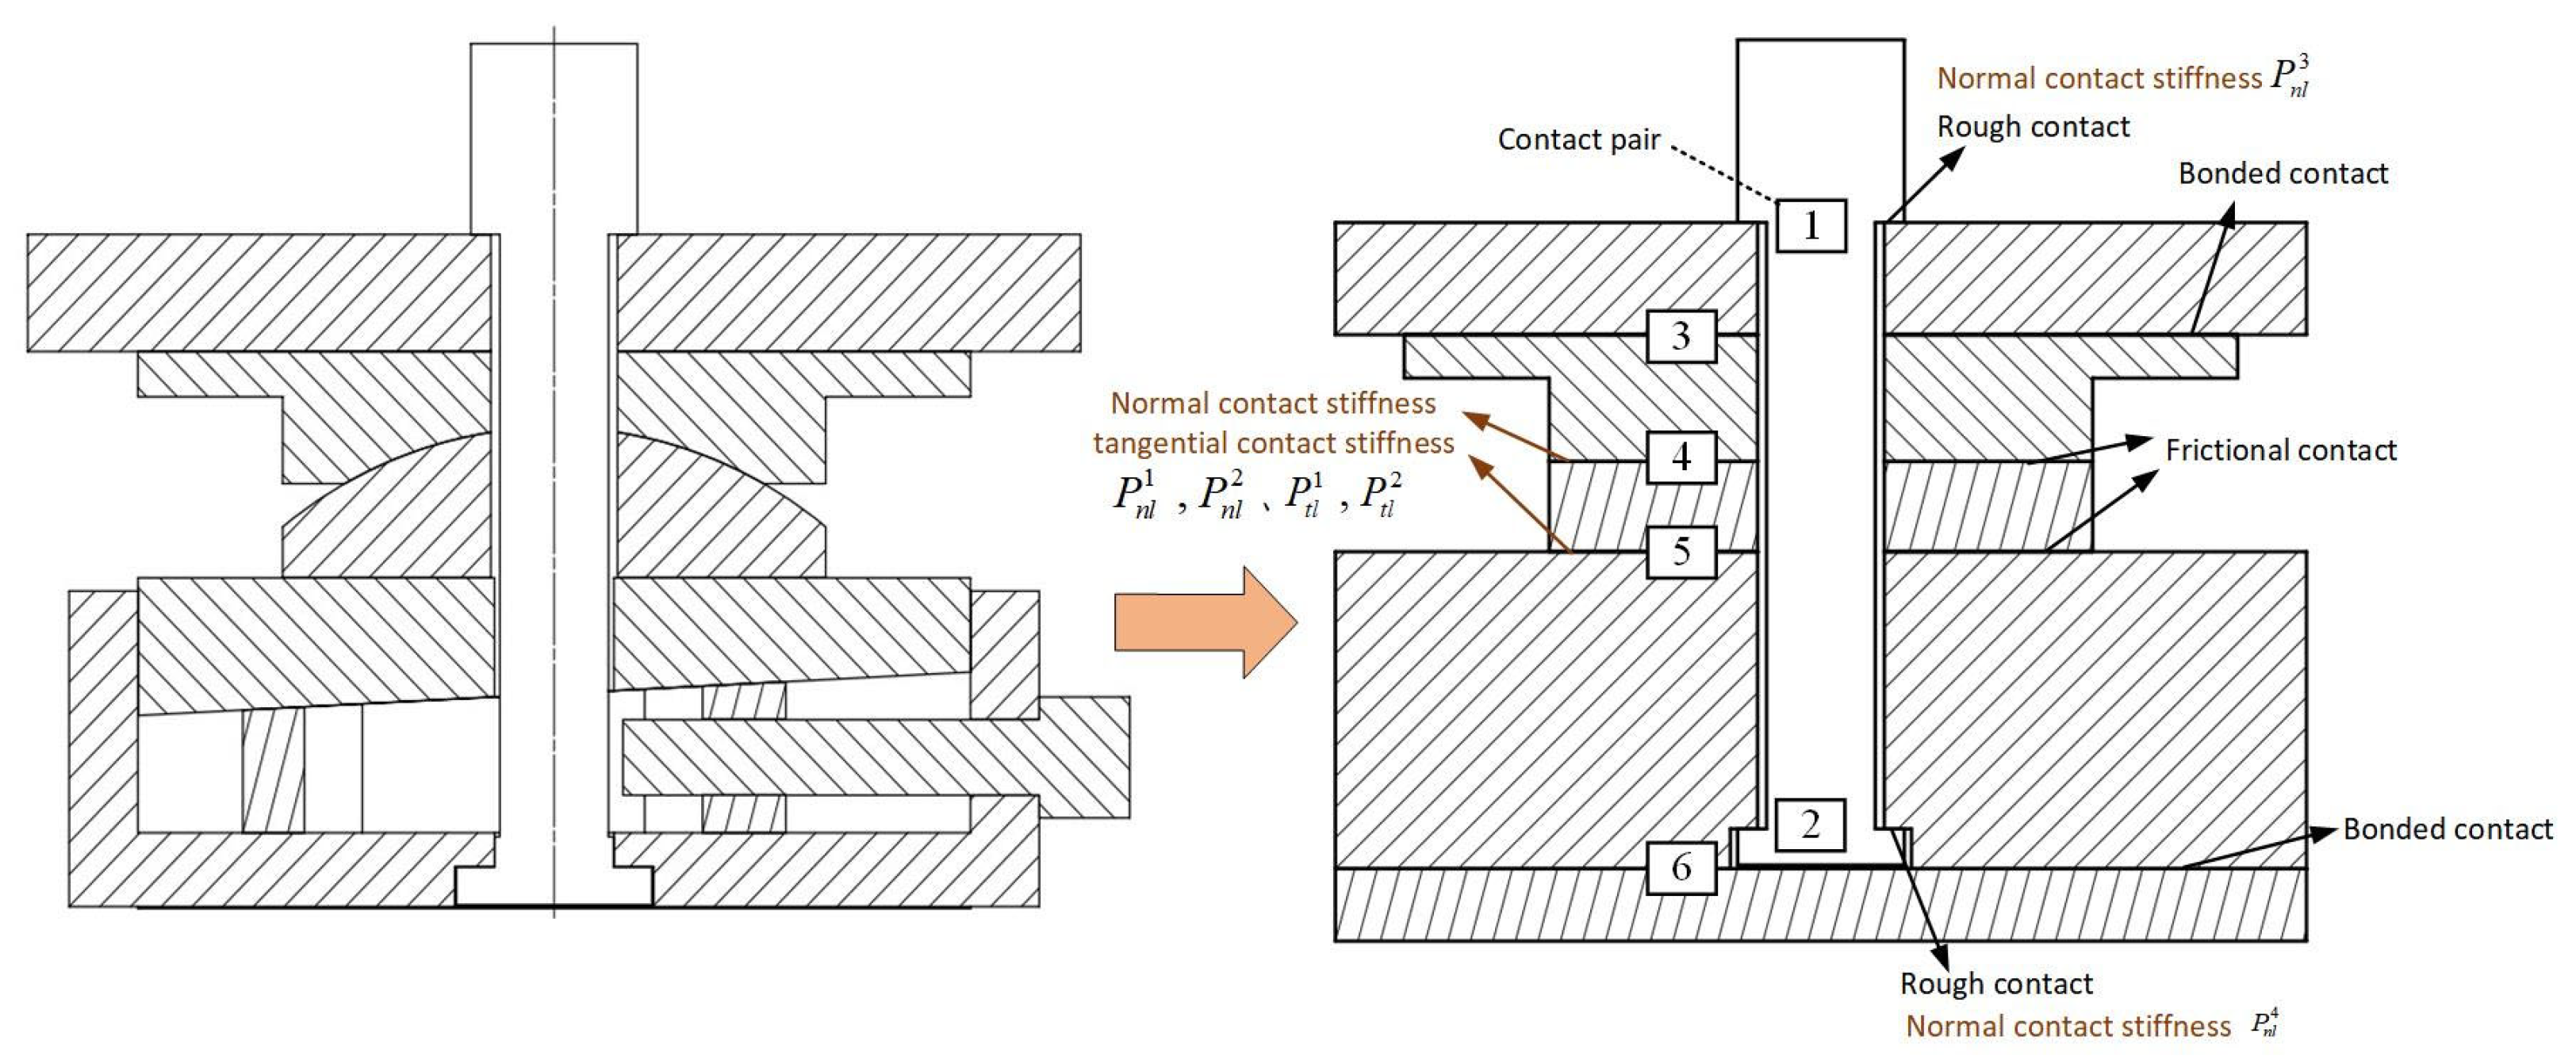
Due to being composed of bolts, spherical joints, and wedge blocks, the contact conditions of the three-point leveling units of the tracking frame are also complicated, and the simplification is also of great significance. In general, the contact simulation problem of a bolted connection uses the modeling method of a solid bolted connection, which has a higher calculation accuracy [21]; therefore, this modeling method is employed instead of spring element modeling. For ease of explanation, a single leveling unit is used as an example in this section. The outer surface of the hexagonal nut is simplified as a cylindrical surface, the joint surfaces between multiple bolted connections of leveling unit are subdivided into multiple mechanical parts, and respective contact conditions are set. The contact pairs of a single three-point leveling unit are illustrated in Figure 9. The contact situation of three-point leveling units is relatively complex, and this location primarily affects the low-order natural frequencies of the entire machine, which is the focus of this model; consequently, it is crucial to establish suitable contact conditions. The contact pairs 1 and 2 between the bolt and the two joint surfaces are both set to a rough contact type that permits normal separation and greater friction in the tangential direction. The contact pairs 4 and 5 are set to a frictional contact type that permits normal separation and tangential friction (the above two contact types both specify asymmetric contact behavior, using the augmented Lagrange contact algorithm). The contact pairs 3 and 6 are both set to a bonded contact type, which does not permit normal and tangential separation, and the MPC contact algorithm is employed. The normal contact stiffness and tangential contact stiffness are assigned to each contact surface of contact pairs 4 and 5 and the normal contact stiffness is assigned to each contact surface of contact pairs 1 and 2.
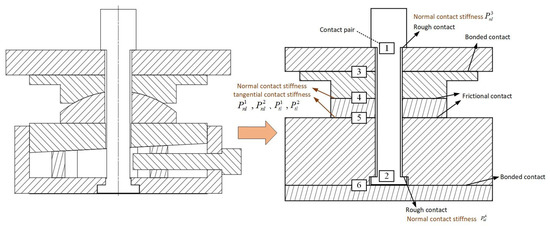
Figure 9.
Schematic diagram of the contact pairs of a single three-point leveling unit.
4.4. Establishment of Equivalent Parametric Model
Through the model simplification process described above, the entire simplified equivalent tracking frame model is established. The following mechanical parameters are assigned to the tracking frame model’s components: assign the material properties of the 45 steel to the three-point leveling units and bearing units (Density 7800 kg/m3, Young’s modulus 210 Gpa, Poisson’s ratio 0.29, linear isotropic elastic properties); assign the material properties of structural steel to the welded structure, including the turntable, columns and connection frame (Density 7800 kg/m3, Young’s modulus 206 Gpa, Poisson’s ratio 0.3, linear isotropic elastic properties); the material properties of QT-450 were assigned to the castings such as the pedestal and the ground base (Density 7000 kg/m3, Young’s modulus 173 Gpa, Poisson’s ratio 0.3, linear isotropic elastic properties). Noted that the elastic modulus and Poisson’s ratio of the bearing units specified here are the simulation model’s initial setting values. Its value may change greatly after parameter optimization. The mechanical material parameters mentioned previously are displayed in Table 4.

Table 4.
Mechanical material parameter properties of each material.
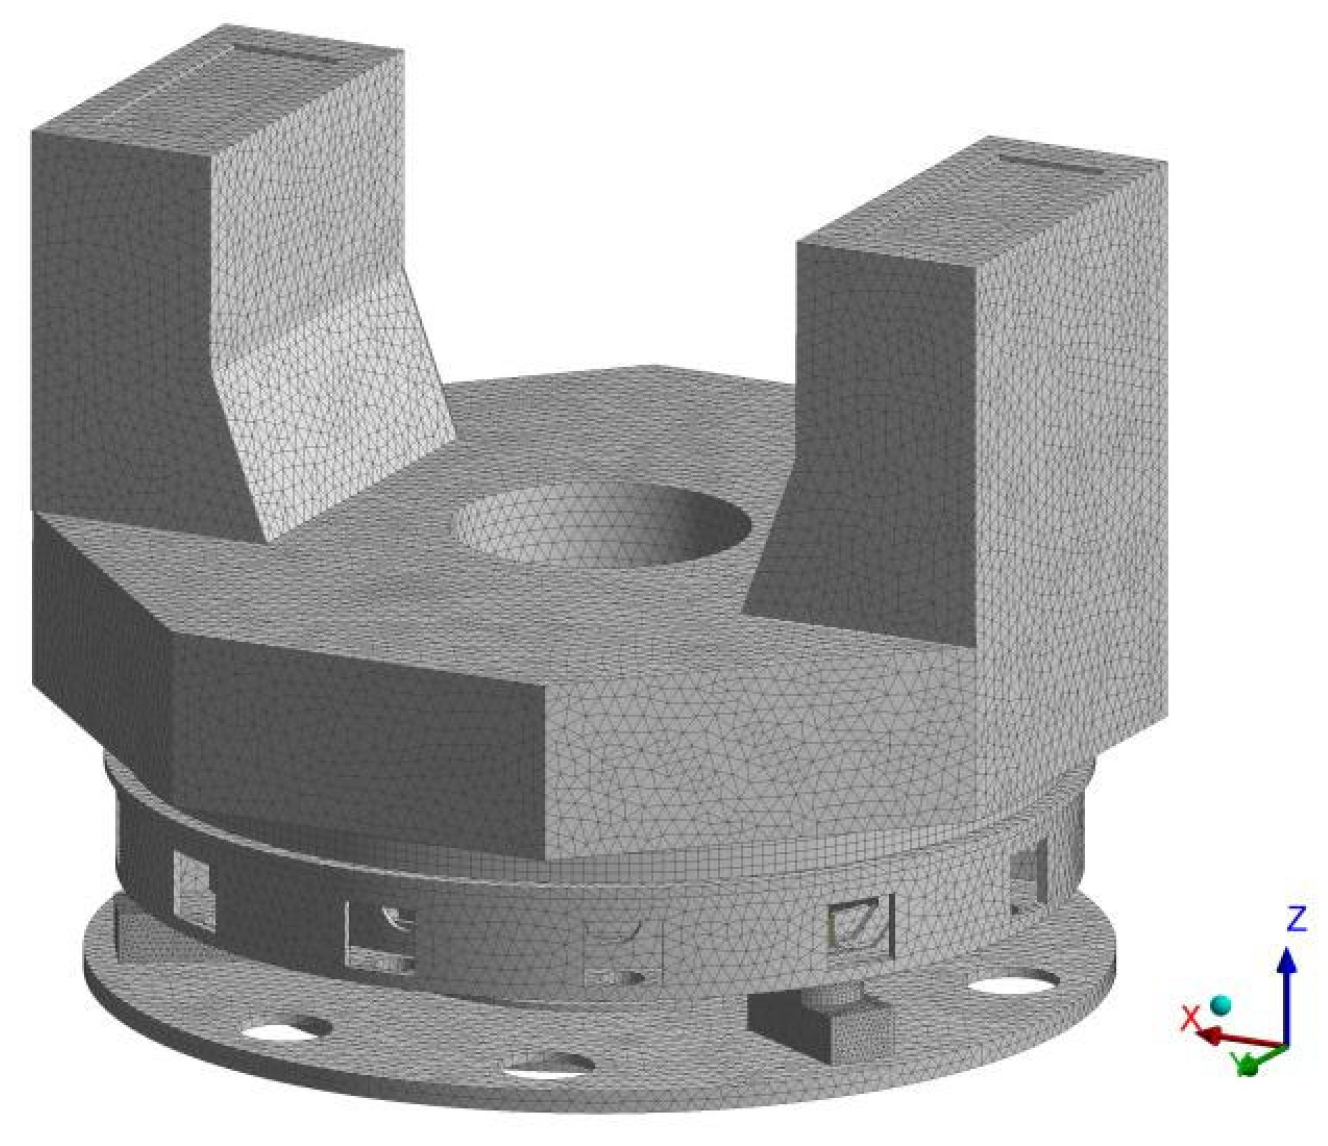
According to the force characteristics of each structure, the mesh is divided. Figure 10 is a schematic representation of the model’s final mesh distribution. The number of mesh cells is 438,920 and there are 841,725 nodes.
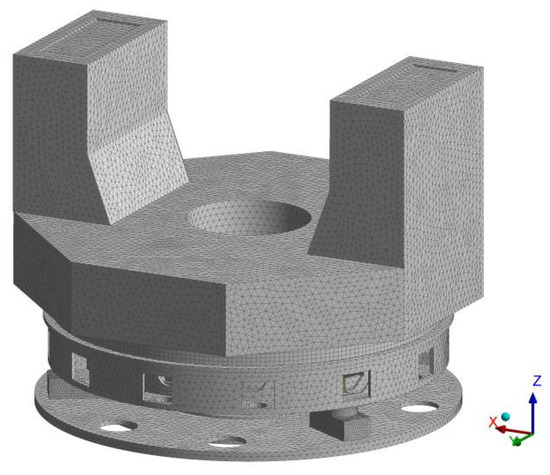
Figure 10.
Mesh distribution diagram of the tracking frame’s equivalent parametric model.
5. Results and Discussions
In this section, the static response under the initial static load of the model is introduced in Section 5.1, and the parameter optimization process and the results of the optimized model are described in Section 5.2 and Section 5.3, respectively. The discussion and analysis are presented in Section 5.4.
5.1. Static Response under the Initial Static Load
The parameterized modeling strategy described in this article applied the method of parameter optimization, and the contact type that can result in nonlinear behavior is considered during the modeling procedure. The initial parameter value has a significant impact on the precision of the optimization results. Therefore, a pre-stressed modal analysis must be performed on the tracking frame model.
In the initial state, the static response of the parameterized model is computed. According to the test condition, a fixed constraint is applied to the bottom surface of the ground base. Additionally, the model is pre-stressed, including the self-gravity of the overall structure and the bolt preload of the leveling units. According to the tightening torque value under actual working conditions, a small preload of 2KN is applied to three M30 bolts of the leveling units. Notably, the effect of successive tightening of bolts on the calculation results is disregarded here, and all preload loading is performed in a single loading step. Table 5 presents the model’s boundary conditions.

Table 5.
Boundary conditions of parameterized model.
The mechanical structure static module of the finite element analysis software ANSYS Workbench is used to solve the model’s statics and boundary conditions, and Mechanical APDL’s preconditioned conjugate gradient (PCG) solver is utilized.
5.2. Parameter Optimization Process
According to the initial parameter values provided, the model’s static simulation results are obtained. The results are then employed as input conditions to compute the modal response.
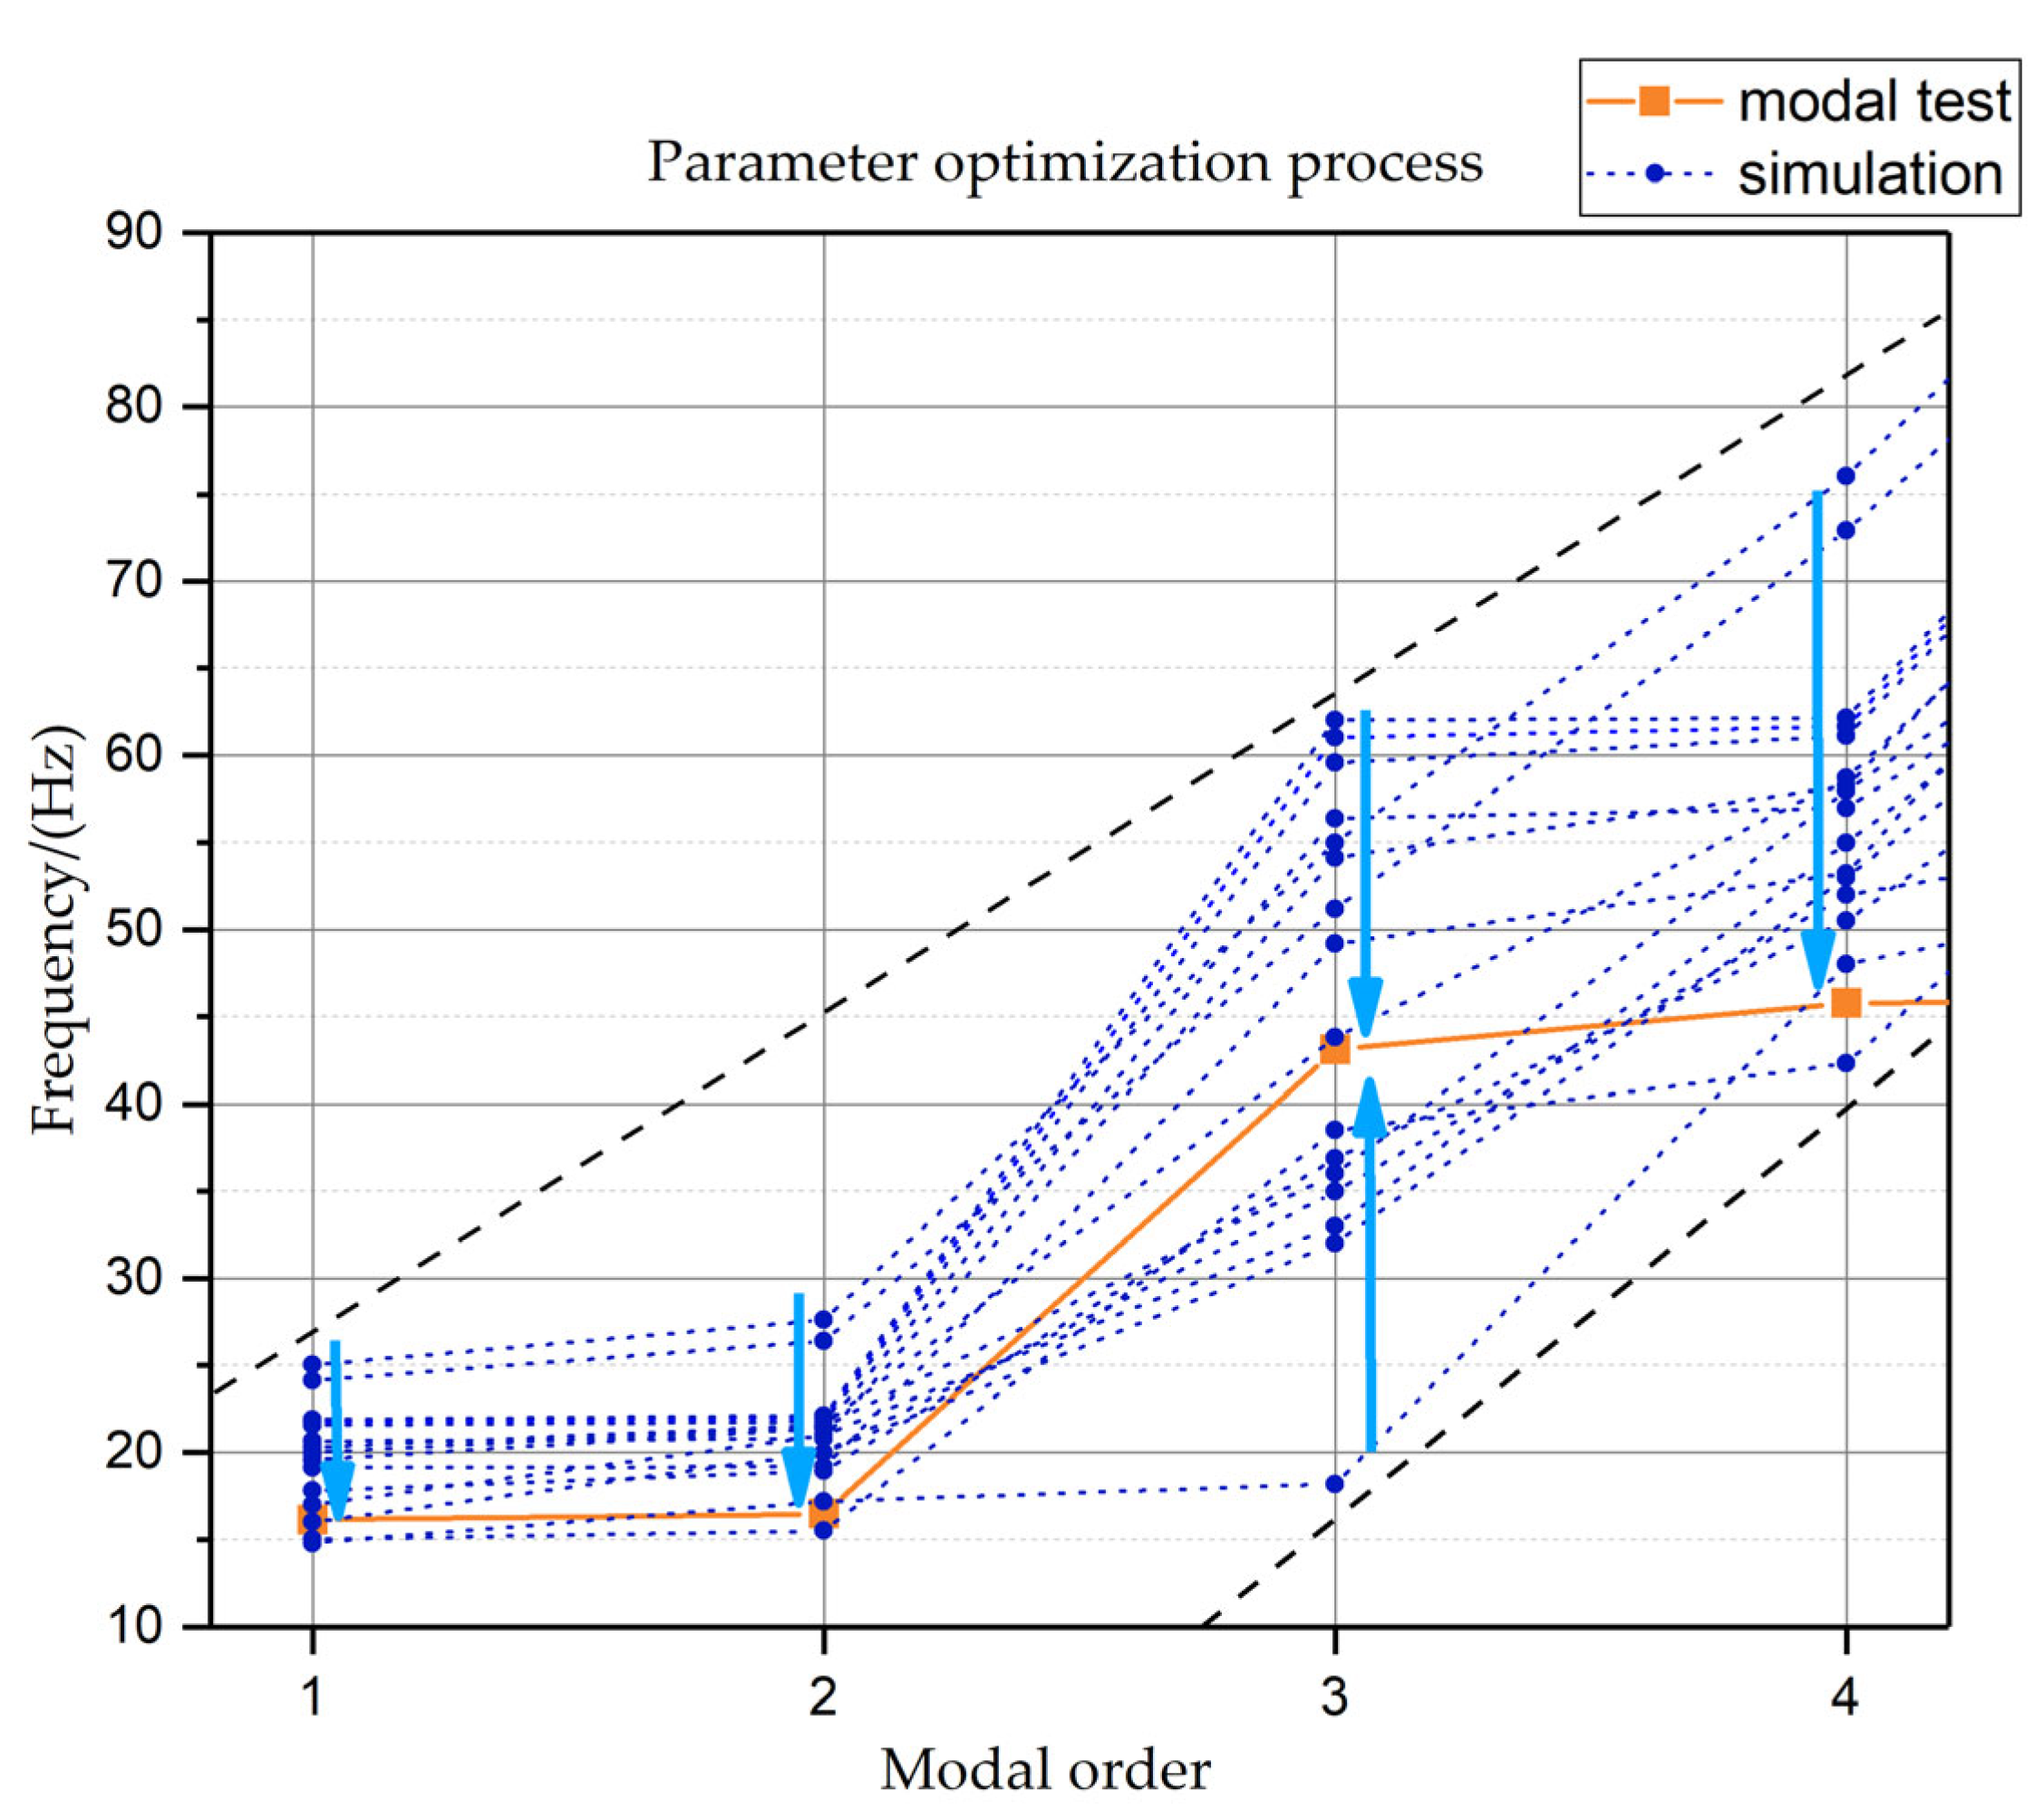
The optimization module of ANSYS Workbench is used to optimize the model’s parameters. The Multi-Objective Genetic Algorithm (MOGA) built into the software is employed here, which is a gradient-less optimization approach. The pertinent configurations are as follows: the number of initial samples is 20, the number of samples per iteration is 20, the maximum number of iterations is 3 and the maximum number of candidates is 10; the natural frequency of each mode was set as the optimization target, the target value corresponds to the experimental value of its respective mode order, and the priority of the first four-order modes was set to high importance, and the last four-order modes were set to lower importance. Figure 11 is a schematic diagram of the parameter optimization calculation process.
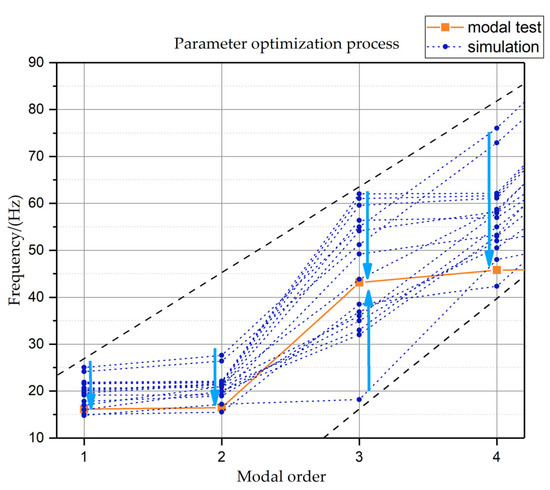
Figure 11.
Schematic diagram of parameter optimization calculation process.
Each group of different parameters will produce different numerical simulation results, and the optimization process will yield a series of reference candidates and their corresponding natural frequencies. Each set of frequency values is exported and evaluated by inequality (2) of Section 2. The final optimization result is a set of parameters satisfying the inequality.
5.3. Simulation Results of the Optimized Model
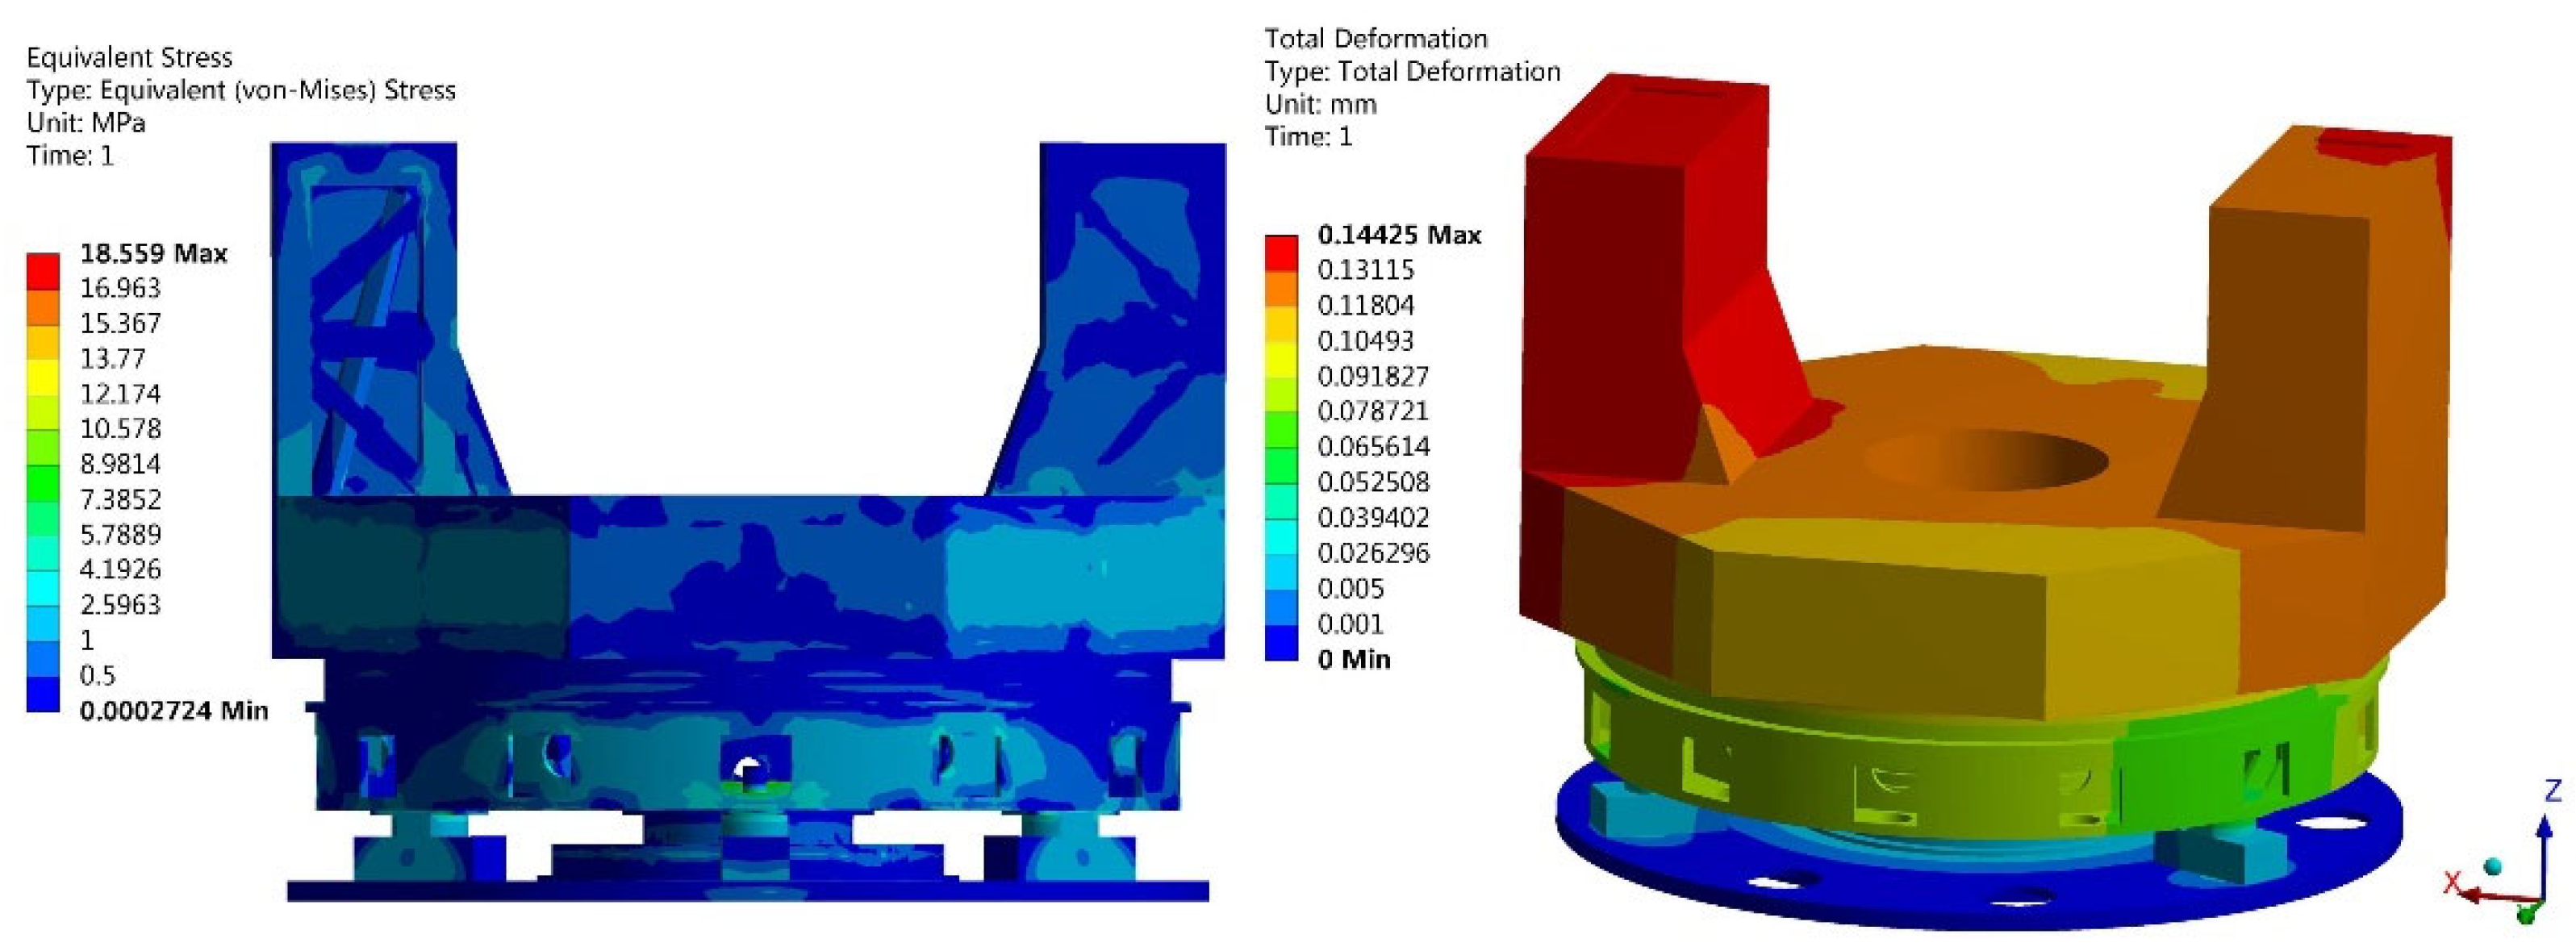
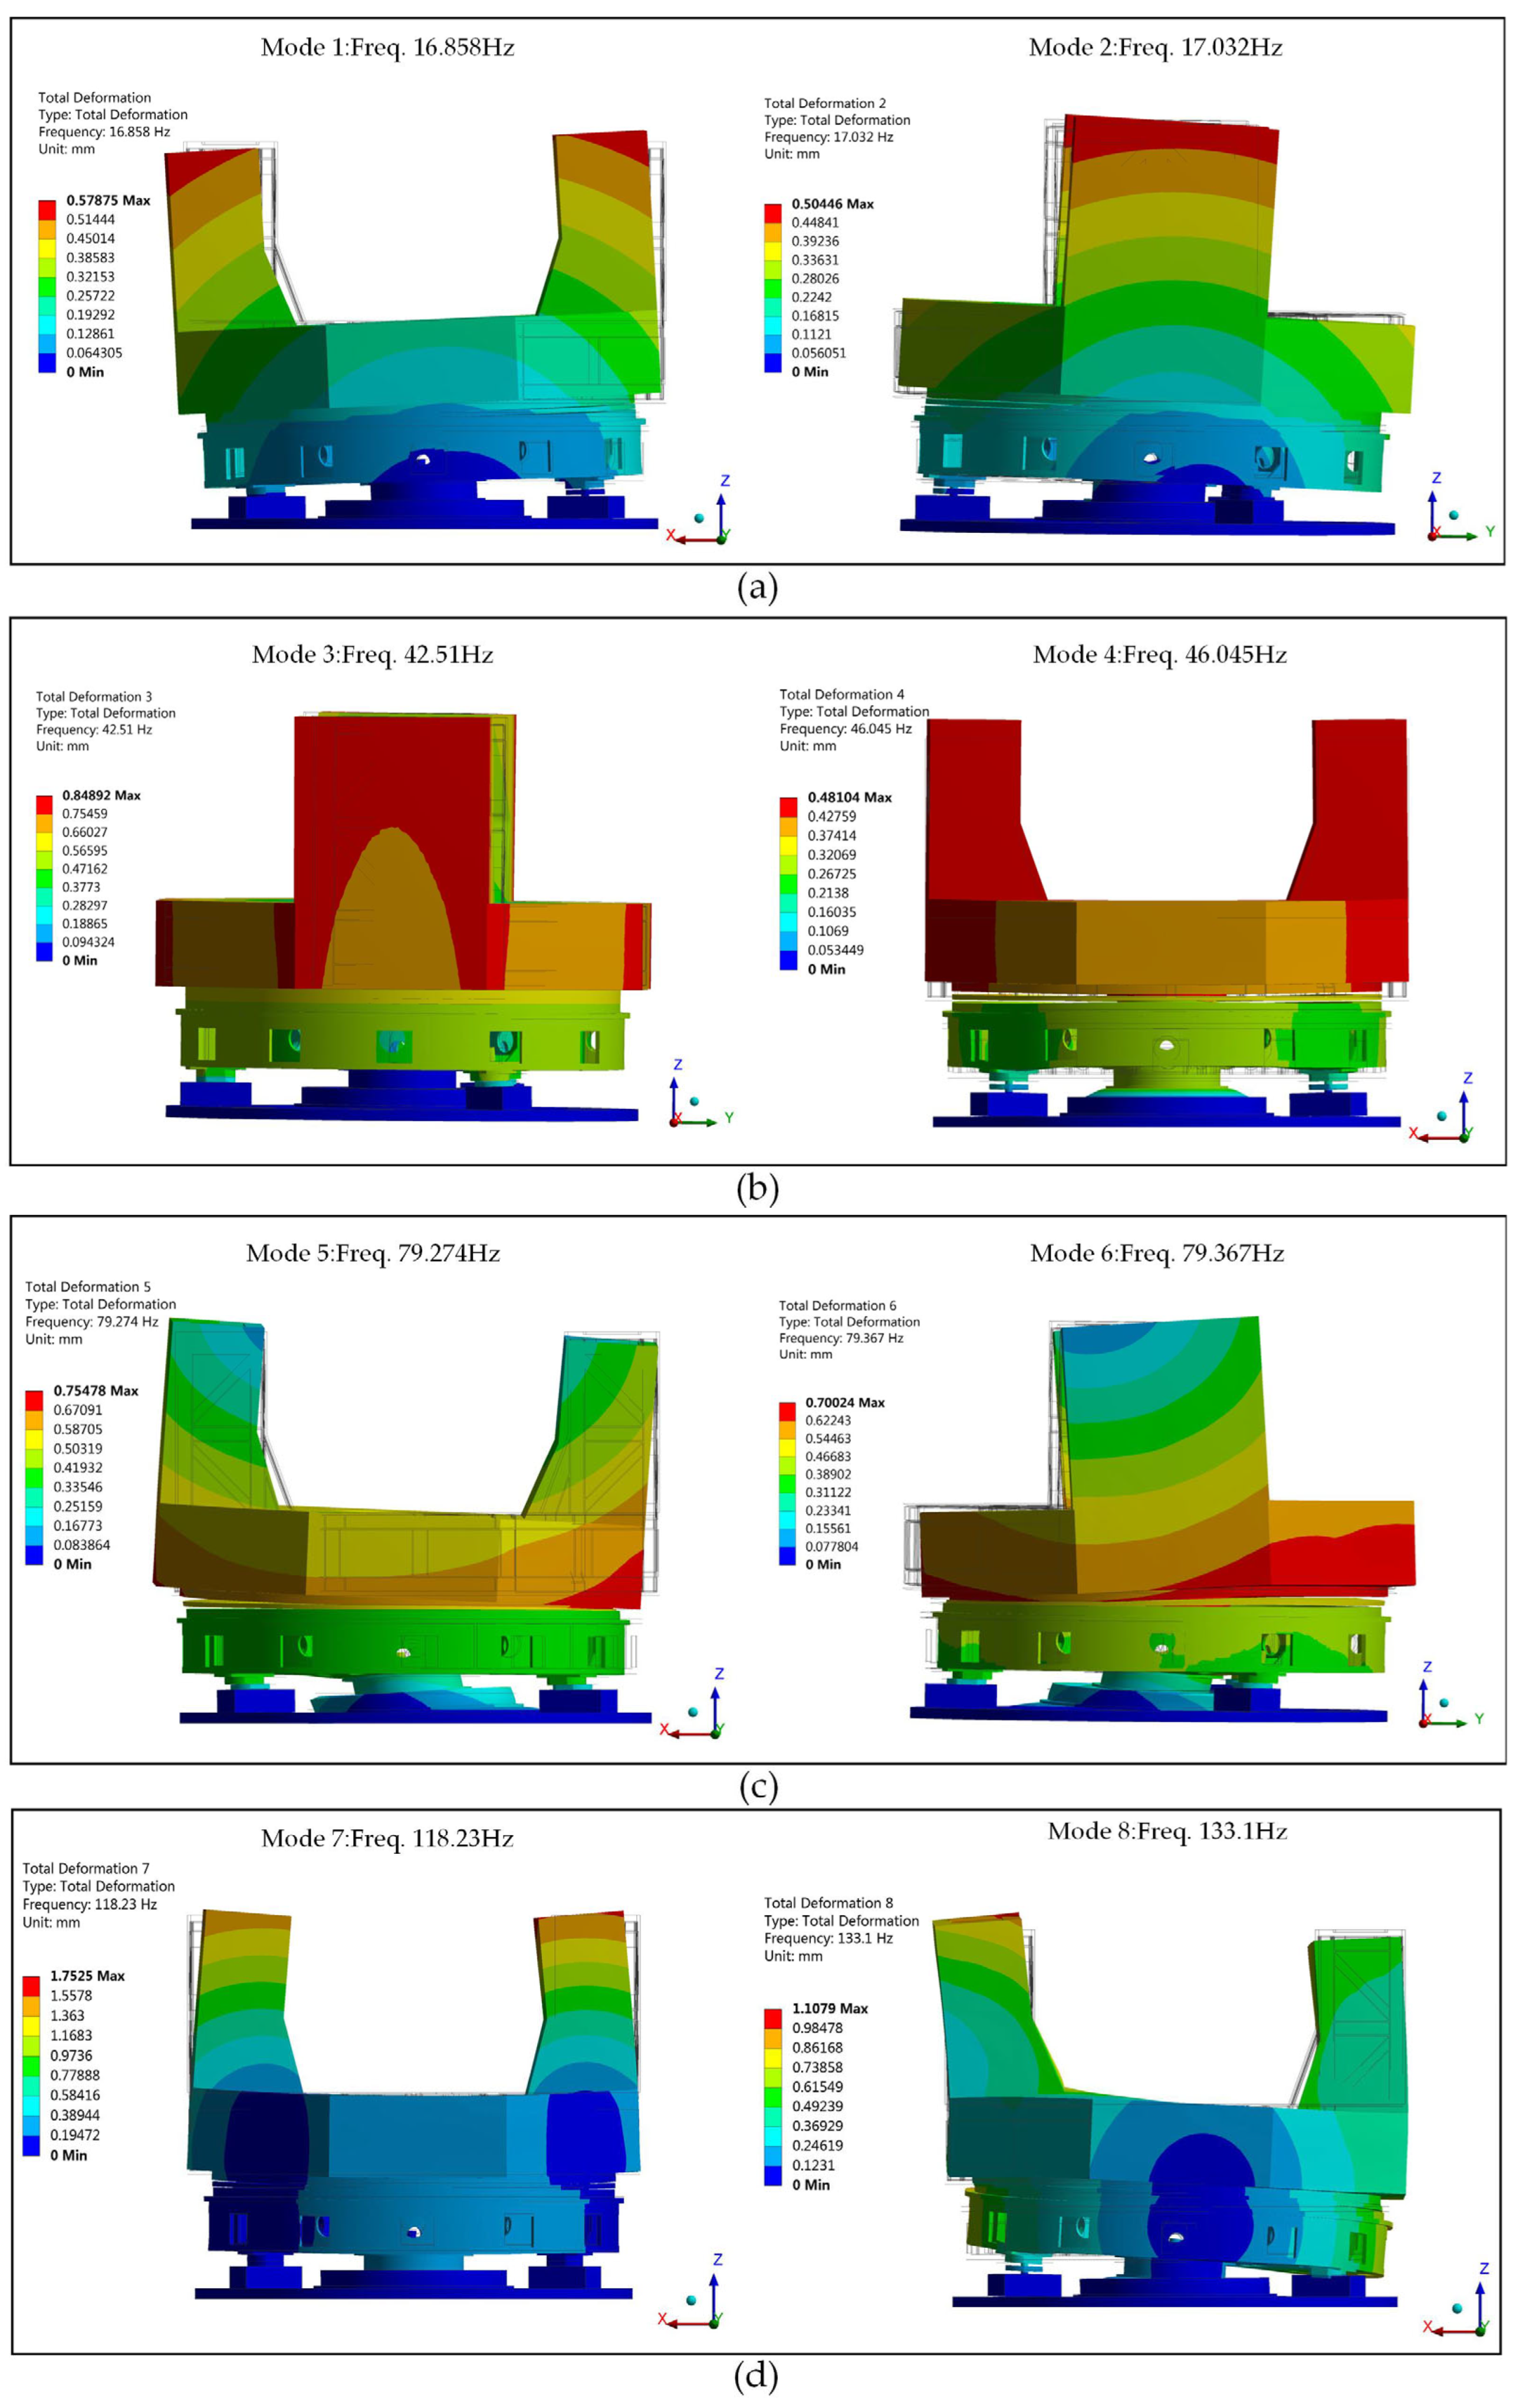
Following the parameter optimization calculation in Section 5.2, a set of parameter values satisfying the requirements is obtained, and these parameter values are substituted into the simulation model, after which the static calculation and the modal response calculation of prestress are performed using the above-mentioned calculation process. Figure 12 depicts the stress and deformation nephogram of the optimized model. The maximum equivalent stress of the model is 18.559 Mpa, and the maximum total deformation is 0.14425 mm. Figure 13 depicts the mode shapes corresponding to the numerical simulation results of the optimized model.
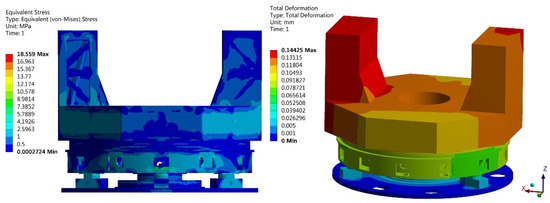
Figure 12.
Stress and deformation nephogram of the optimized model.
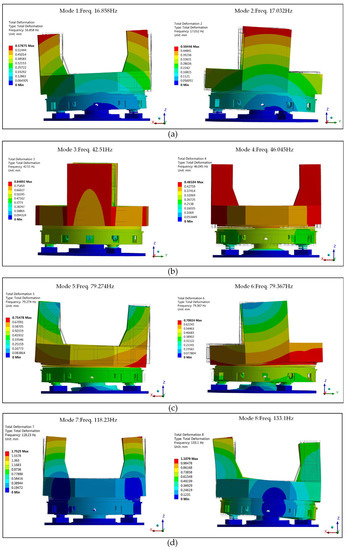
Figure 13.
Mode shape diagram of the optimized model. (a) The first and second order mode shapes. (b) The third and fourth order mode shapes. (c) The fifth and sixth order mode shapes. (d) The seventh and eighth order mode shapes.
5.4. Discussion and Analysis
Through modal testing and numerical simulation, the natural properties of the tracking frame were evaluated. Table 6 lists the experimental and simulation results.

Table 6.
Comparison of numerical simulation results and experimental data.
It can be seen that the maximum relative error of the first four-order natural frequencies is less than about 4.45%, and the first four-order mode shapes agree well with each other. The parametrically optimized simulation model accurately simulates the low-order modes of the tracking frame. For the theodolite tracking frame, a quasi-static structure with slow tracking speed, the application of a linear dynamic model to describe its nonlinear physical problems has a certain reference value.
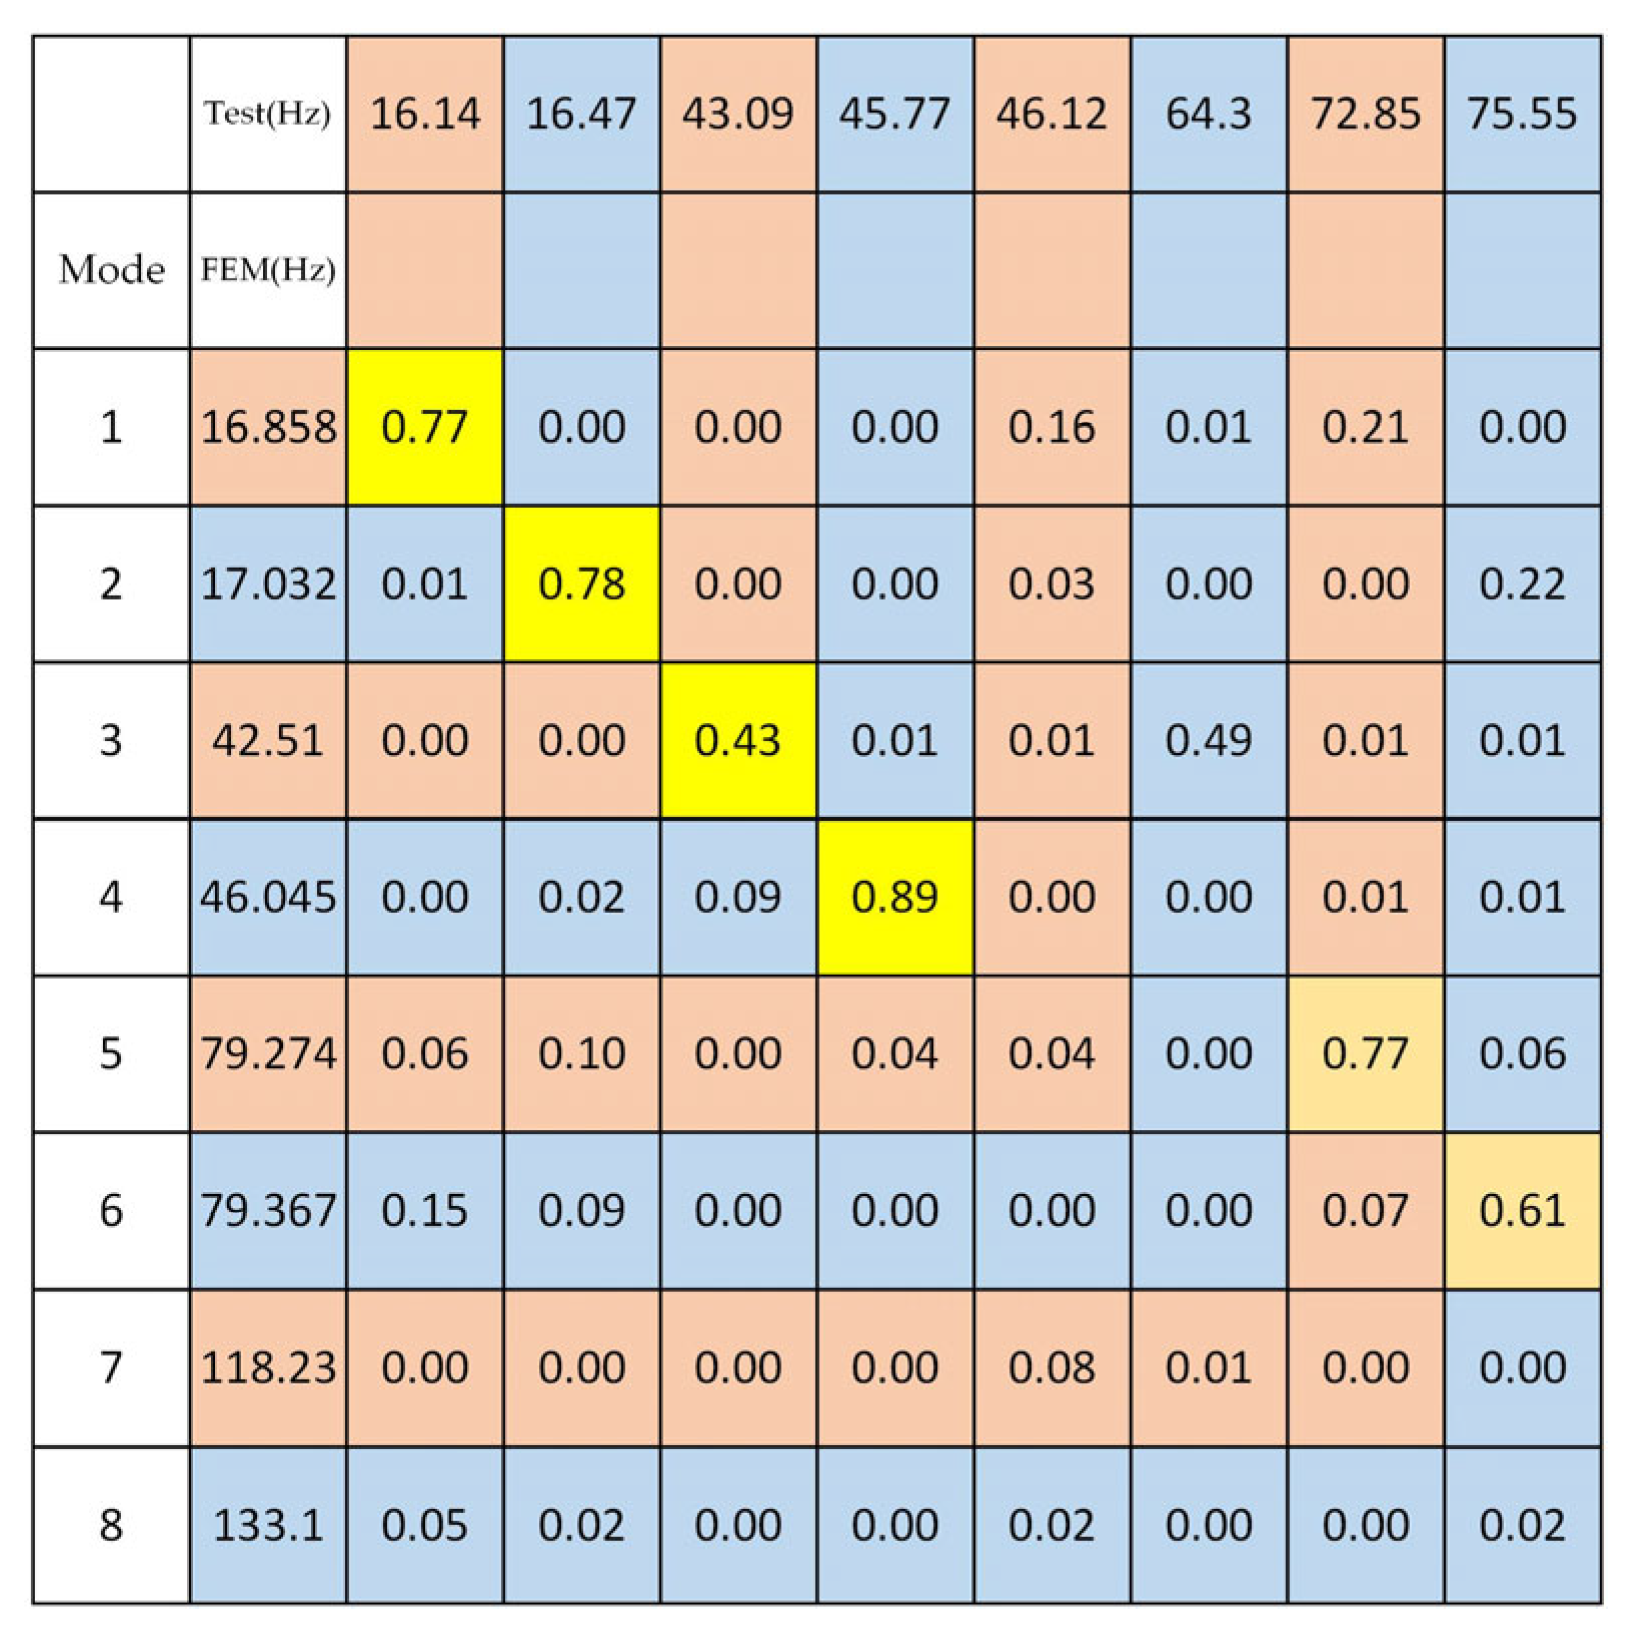
Figure 14 depicts the MAC diagram of mode shapes between the simulation and the experiment, allowing for a more direct comparison of mode shape orthogonality.
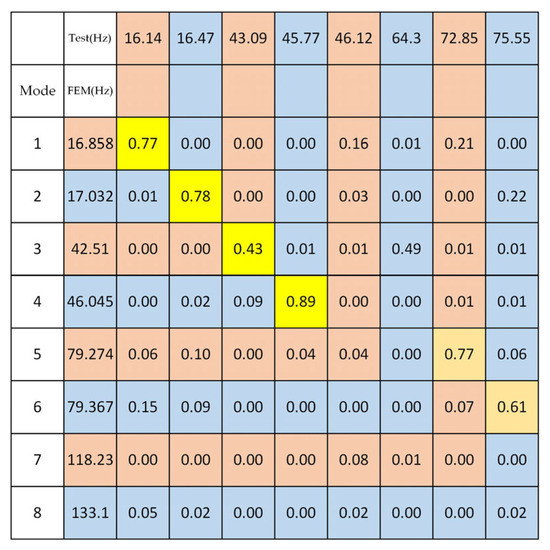
Figure 14.
MAC diagram of mode shapes between the simulation and the experiment.
On the high-order modes, the discrepancy between the numerical simulation and the experiment is significant. The simulation results show the phenomenon of mode shape dislocation: The modal information regarding the second-order bending of the entire machine, which should be located in the seventh and eighth order, appears in the fifth and sixth order; the modal information regarding the bending and torsion of columns, which should be located in the fifth and sixth order, appears in the seventh and eighth order. In addition, regarding the mode of column bending, simulation results indicate that both sides of the column are bent, as opposed to the one-sided column bending observed in the test. The main reasons for these phenomena are the following:
In the simulation model, the horizontal axis system and optical system above the upper end of the turntable are simplified by the addition of equivalent mass points, and the horizontal shafting is considered to be an entirely symmetrical structure. However, the experiment model’s horizontal axis system has the structural characteristics of fixed bearing at one end and floating bearing at the other end, resulting in the stiffness distribution being asymmetric. Therefore, in the course of simplification, the bending and torsion stiffness of the column are strengthened locally, causing the column’s bending and torsion modes to appear after the second bending modes of the entire machine.
In the process of model parameter optimization, the convergence criterion is defined in Inequation (2). Based on this optimization algorithm, it is challenging to achieve consistency between the simulation model and all experimental data.
For a large system with such complex factors, the cost of creating a model that can fully describe the experimental results is enormous: to obtain high-order modes, more response points must be set, more modal orders must be identified, and more computational resources must be devoted to simulation models. In actuality, the low-order frequencies of the tracking frame are given more consideration during the operation of the equipment, and the low-order modal characteristics can be accurately simulated using this simplified modeling method; the simplified model is also fully adequate for problem analysis.
In conclusion, the low-order modal characteristics of the tracking frame mainly include bending, torsion and heave of the entire machine around the leveling units, and the values of the first second-order natural frequencies are about 16 Hz. The results indicate that the three-point leveling unit is the weakest point of the tracking frame’s dynamic stiffness. Large photoelectric tracking equipment is susceptible to entire-machine resonance during service work and vehicle transportation, which impacts tracking accuracy. If the equipment’s dynamic stiffness must be enhanced, the first step is to optimize the design of leveling units.
6. Conclusions and Outlooks
In this paper, a modal test was carried out to obtain the vibration characteristics of the large-scale photoelectric theodolite tracking frame. During the modeling process, the bearing units, three-point leveling units, and other components of the tracking frame are appropriately simplified, and the optimized finite element model is obtained using a gradient-less optimization approach. By comparing the modal test and numerical simulation results, the dynamic characteristics of the large-scale photoelectric theodolite tracking frame are synthetically analyzed, and the calculation accuracy of the dynamic model is validated. For structures such as theodolite tracking frame, a quasi-static structure with slow tracking speed, it is sufficient to use a linear dynamic model to describe their nonlinear physical problems.
If the subsequent research focuses on the high-order frequencies and mode shapes of the tracking frame, it is necessary to develop a simulation model that accurately reflects the asymmetric stiffness of the horizontal axis system, as well as to set more response points in order to collect more comprehensive data.
Author Contributions
Conceptualization, R.L. and Q.W.; methodology, Q.W.; software, R.L. and Q.W.; validation, R.L., Q.W. and H.Z.; formal analysis, R.L.; investigation, R.L., Q.W. and H.Z.; resources, X.W., Q.W. and Z.L.; data curation, R.L. and Y.Y.; writing—original draft preparation, R.L. and Q.W.; writing—review and editing, R.L. and Q.W.; visualization, R.L. and Q.W.; supervision, Q.W., X.W., Z.L., Q.G. and Y.Y.; project administration, Q.W., X.W., Z.L., Q.G. and Y.Y.; funding acquisition, Y.Y. All authors have read and agreed to the published version of the manuscript.
Funding
This research received no external funding.
Data Availability Statement
Not applicable.
Acknowledgments
The authors are very grateful for help of editors and reviewers.
Conflicts of Interest
The authors declare no conflict of interest.
References
- Liu, J.; Zhang, X.; Liu, H.; Yuan, Y.; Zhu, Z.; Yu, Q. Correction method for non-landing measuring of vehicle-mounted theodolite based on static datum conversion. Technol. Sci. 2013, 56, 2268–2277. [Google Scholar] [CrossRef]
- Che, S.; Zhu, M. Study on dynamic structural property of electro-optical theodolite. Opt. Electron. Eng. 2004, 7, 15–17. (In Chinese) [Google Scholar]
- Li, H.; Shen, X. Electromechanical dynamic modeling and coupling for optoelectronic theodolite. Opt. Precis. Eng. 2007, 10, 1577–1582. (In Chinese) [Google Scholar]
- Li, Y.; Yu, H.; Wang, Q.; San, X.; Liu, Z.Y. Second super-harmonic resonance response of cantilever beam with bolt joint under low pretension. Opt. Precis. Eng. 2016, 11, 2769–2776. (In Chinese) [Google Scholar]
- Kim, J.; Yoon, J.C.; Kang, B.S. Finite element analysis and modeling of structure with bolted joints. Appl. Math. Model. 2007, 31, 895–911. [Google Scholar] [CrossRef]
- Han, D.; Bi, C.; Yang, J. Nonlinear dynamic behavior research on high-speed turbo-expander refrigerator rotor. Eng. Fail Anal. 2019, 96, 484–495. [Google Scholar] [CrossRef]
- Xu, K.; Wang, B.; Zhao, Z.; Zhao, F.; Kong, X.; Wen, B. The influence of rolling bearing parameters on the nonlinear dynamic response and cutting stability of high-speed spindle systems. Mech. Syst. Signal Process. 2020, 136, 106448. [Google Scholar] [CrossRef]
- Lu, K.; Jin, Y.L.; Chen, Y.S.; Yang, Y.F.; Hou, L.; Zhang, Z.Y.; Li, Z.G.; Fu, C. Review for order reduction based on proper orthogonal decomposition and outlooks of applications in mechanical systems. Mech. Syst. Signal Process. 2019, 123, 264–297. [Google Scholar] [CrossRef]
- Fu, C.; Zhu, W.D.; Zheng, Z.L.; Sun, C.Z.; Yang, Y.F.; Lu, K. Nonlinear responses of a dual-rotor system with rub-impact fault subject to interval uncertain parameters. Mech. Syst. Signal Process. 2022, 170, 108827. [Google Scholar] [CrossRef]
- Firouzi, J.; Ghassemi, H.; Shadmani, M. Analytical model for coupled torsional-longitudinal vibrations of marine propeller shafting system considering blade characteristics. Appl. Math. Model. 2021, 94, 737–756. [Google Scholar] [CrossRef]
- Yu, P.C.; Wang, C.; Hou, L.; Chen, G. Dynamic characteristics of an aeroengine dual-rotor system with inter-shaft rub-impact. Mech. Syst. Signal Process. 2022, 166, 108475. [Google Scholar] [CrossRef]
- Lu, K.; Jin, Y.L.; Huang, P.F.; Zhang, F.; Zhang, H.P.; Fu, C.; Chen, Y.S. The applications of POD method in dual rotor-bearing systems with coupling misalignment. Mech. Syst. Signal Process. 2021, 150, 107236. [Google Scholar] [CrossRef]
- Keas, P.; Brewster, R.; Guerra, J.; Lampater, U.; Kärcher, H.; Teufel, S.; Wagner, J. SOFIA telescope modal survey test and test-model correlation. In Proceedings of the Conference on Modeling, Systems Engineering and Project Management for Astronomy IV, San Diego, CA, USA, 27 June–1 July 2010. [Google Scholar]
- Dilworth, B.J. LLCD Experimental Line-of-Sight Jitter Testing. In Proceedings of the 33rd IMAC Conference and Exposition on Structural Dynamics, Orlando, FL, USA, 2–5 February 2015. [Google Scholar]
- Greiner, B.; Malicek, B.; Lachenmann, M.; Krabbe, A.; Wagner, J. A new finite element model of the SOFIA primary mirror cell to investigate dynamical behavior. In Proceedings of the Conference on Ground-based and Airborne Telescopes VII, Austin, TX, USA, 10–15 June 2018. [Google Scholar]
- Greiner, B.; Lammen, Y.; Reinacher, A.; Krabbe, A.; Wagner, J. Characterization of the mechanical properties of the SOFIA secondary mirror mechanism in a multi-stage approach. In Proceedings of the Conference on Ground-Based and Airborne Telescopes VI, Edinburgh, Scotland, 26 June–1 July 2016. [Google Scholar]
- Knight, J.B.; Stahl, H.P.; Tsai, F.; Burt, A.; Singleton, A.; Hunt, R.; Parks, R.; McCool, A.; Sontag, B. Advanced Mirror Technology Development (AMTD) II Modal Test of A 1.5 m Glass Slumped Mirror. In Proceedings of the Conference on Optical Manufacturing and Testing XII, San Diego, CA, USA, 20–22 August 2018. [Google Scholar]
- Marchiori, G.; Rampini, F.; Mian, S.; Ghedin, L.; Marcuzzi, E.; Bressan, R. ELT dome and telescope: Performance analysis overview. In Proceedings of the Conference on Modeling, Systems Engineering, and Project Management for Astronomy VIII, Austin, TX, USA, 10–12 June 2018. [Google Scholar]
- Soler, M.; Cozar-Castellano, J.; Mato, A.; Ferro, I.; Sanchez-Capuchino, J.; Nunez-Cagigal, M.; Barreto, M. Structural analysis for the EST preliminary design specifications. In Proceedings of the Conference on Modeling, Systems Engineering, and Project Management for Astronomy X, Montreal, QC, Canada, 17–20 July 2022. [Google Scholar]
- Islam, M.; Byrnes, P.W.G.; Robishaw, T.; Xin, H.Q. Reverse finite element modelling and verification testing of the John A. Galt 26 m radio telescope. In Proceedings of the Conference on Ground-based and Airborne Telescopes IX, Montreal, QC, Canada, 17–22 July 2022. [Google Scholar]
- Xie, J.; San, X.; Wang, J.; He, F.; Qiao, Y.; Cheng, K.; Liu, Z. Vibration characteristics analysis of theodolite tracking frame considering nonlinear contact. J. Vib. Eng. Technol. 2017, 5, 277–284. [Google Scholar]
- Avitabile, P. Modal Testing: A Practitioner’s Guide; John Wiley & Sons Ltd: The Society for Experimental Mechanics: Hoboken, NJ, USA, 2017; ISBN 9781119222897. [Google Scholar]
- Piersol, A.G.; Paez, T.L. Harris’ Shock and Vibrations Handbook; McGraw-Hill: New York, NY, USA, 2009; ISBN 9780071508193. [Google Scholar]
- Brehm, M.; Zabel, V.; Bucher, C. An automatic mode pairing strategy using an enhanced modal assurance criterion based on modal strain energies. J. Sound. Vib. 2010, 329, 5375–5392. [Google Scholar] [CrossRef]
Publisher’s Note: MDPI stays neutral with regard to jurisdictional claims in published maps and institutional affiliations. |
© 2022 by the authors. Licensee MDPI, Basel, Switzerland. This article is an open access article distributed under the terms and conditions of the Creative Commons Attribution (CC BY) license (https://creativecommons.org/licenses/by/4.0/).

