1. Introduction
Cyber-Physical Systems (CPSs) have been increasingly used in production as Industry 4.0 concepts become widespread. The significant economic impact CPSs can bring to manufacturing [
1] and their great potential in supporting reconfigurable manufacturing systems make them attractive for manufacturers [
2]. Emerging technologies in the fields such as “Big Data,” “IoT,” “Digitalization,” and “Cloud” facilitated hardware and software product development to generate and handle vast amounts of data in a manufacturing facility and disrupt conventional manufacturing systems. The need for a high level of automation and transitioning into autonomy have motivated engineers to computerize conventional manufacturing plans and programs such as maintenance. Customized CPS design for intelligent fault detection and classification (FDC) can be a critical safeguard minimizing downtime due to equipment breakdown and can significantly assist in planning maintenance orders for manufacturers. A PdM system can be formally described as a CPS where networked assets are equipped with the self-awareness to predict anomalies/faults, their root causes and automatically detect faulty events [
3]. Detecting equipment faults and maintenance needs in advance via data-driven Machine Learning (ML) algorithms has proven to have a significant Return on Investment (ROI) by increasing production capacity and cycle time. With zero defect and downtime missions in mind, determining the root causes of malfunctions and planning maintenance actions to prevent breakdowns have become essential issues [
4].
A CPS system’s scalability, modularity, and customization capabilities are critical in a CPS system design [
2]. As a customized CPS system, the design of a generic and scalable PdM system equipped with state-of-the-art technology solutions comes into play at this point to develop smart strategies and save maintenance costs.
In the literature, some predictive maintenance (PdM) papers focus on machine learning applications, while others focus on key performance indicators that evaluate system performance. Since the need for CPS architecture for predictive maintenance emerged with Industry 4.0, the work in this field has gained momentum.
Many studies in the literature show an increased investment in the use of PdM applications in many sectors. Compare et al. [
5] present comprehensive research to support the maturation of IoT-enabled PdM that becomes increasingly common in manufacturing industries and address its challenges, limitations, and opportunities. They have determined the advantages and disadvantages of data-driven and model-based prognostics and health management (PHM) algorithms in this context. Additionally, they have analyzed the economics of PdM to justify the significant investments in the IoT-enabled PdM approach as a favorable choice. Samatas et al. [
6] have examined in depth the artificial intelligence (AI) models and the data types used in predictive maintenance applications on a sectoral basis. Systematic analysis of 44 publications studying PdM applications using ML methods has shown that temperature, vibration, and noise/acoustic sensor data are the most preferred among the twelve sensor categories in ML-based PdM applications.
It has been observed that most of the publications in the literature offer a solution for either a PdM application by designing a novel ML algorithm or a comparison of an ML to other well-known models for data-driven solutions in a specific industrial use case. Studies that present a full-scale system design and its implementation are scarce. This paper also aims to fill this gap and raise awareness among system and field engineers for fundamental components in a PdM system design and its integration into a manufacturing environment. Yang and Lin [
7] present the design and development of a predictive maintenance platform based on the CPS. They have presented an offline predictive maintenance approach that pre-diagnosed process and product abnormalities with a mechanism based on big data analysis and cloud computing technologies. Another study by Niyonambaza et al. [
8] proposes a PdM framework using IoT to predict the possible failure of mechanical equipment used in hospitals. By utilizing Deep Learning-based data-driven models, up to 96% of prediction accuracies have been reported in real-time detection.
In addition to an effective CPS design, the necessity to define appropriate Key Performance Indicators (KPIs), health monitoring metrics, and business processes for CPSs is essential for PdM systems. As the CPSs become a part of manufacturing technologies in the rapidly developing manufacturing industry, performance measurement of CPSs has also become essential for businesses and management teams. Studies proposing KPIs for CPSs have started to take place in the literature. Aslanpour et al. [
9] review general performance metrics proposed for IoT, Cloud, Fog, and Edge computing on top of standardized general performance metrics. The defined metrics and the proposed taxonomy are mapped and analyzed with the existing literature. In a study by Pinceti et al. [
10], technical KPIs have been defined for an application domain in the energy sector called microgrids in three folds: power quality, energy efficiency, and conventional generator stress. Implementing the KPIs into an isolated microgrid application demonstrates a new efficient microgrid. In a recent study, Lamban et al. [
11] focus on applying Industry 4.0 technologies to perform predictive maintenance and present a CPS in five system architecture levels. Machine tool data not coming from a real case are monitored, and four KPIs are defined and implemented.
Our study proposes a novel CPS architecture for PdM applications with two real-life use-case scenarios and a set of KPIs for CPS components. The main motivation of this study is to present to the reader a modular, scalable, open-source-based, PdM system design as a Platform as a Service (PaaS). Furthermore, we offer KPIs, system metrics, and exemplary business processes so that each system stakeholder can cover its integration into a full-scale production environment.
To the best of our knowledge, this paper is the first in a context that addresses fundamental components in a full-scale PdM system design and implementation, considering different stakeholders with KPIs and business processes. The system’s effectiveness is verified in two independent use cases in a condition monitoring application. The main contributions of the paper are:
A new CPS design for PdM has been introduced, and a system has been implemented
A set of Key Performance Indicators and business processes for the new PdM system have been designed and implemented
The effectiveness of the system has been experimentally shown in two real-time use cases
The rest of the paper is organized as follows.
Section 2 presents the proposed CPS architecture for PdM applications in detail with real-life use-case scenarios.
Section 3 details the designed predictive maintenance system’s business process and decision-making strategy for fault prediction and maintenance applications with proposed system metrics and KPIs. Lastly,
Section 4 presents our conclusions.
2. Cyber Physical System Architecture for Predictive Maintenance
Predictive maintenance emphasizes monitoring equipment performance during normal operations to detect incipient failures and estimate the remaining useful life. This way, the number of unexpected failures is minimized, the time and cost allocated for maintenance, that is, equipment downtime, are reduced, cycle time is minimized, and consequently, production capacity is improved. Essential components of an effective PdM platform include big data storage and analytics technologies. These components allow for storing sensor data and running the PdM detection and prediction models by processing big data streams from multiple sources in real-time [
12]. CPSs for PdM continuously monitor a machine or process integrity and perform maintenance only when needed [
13]. It is necessary to design a general architecture to implement PdM applications that can manage big industrial data in CPSs [
14].
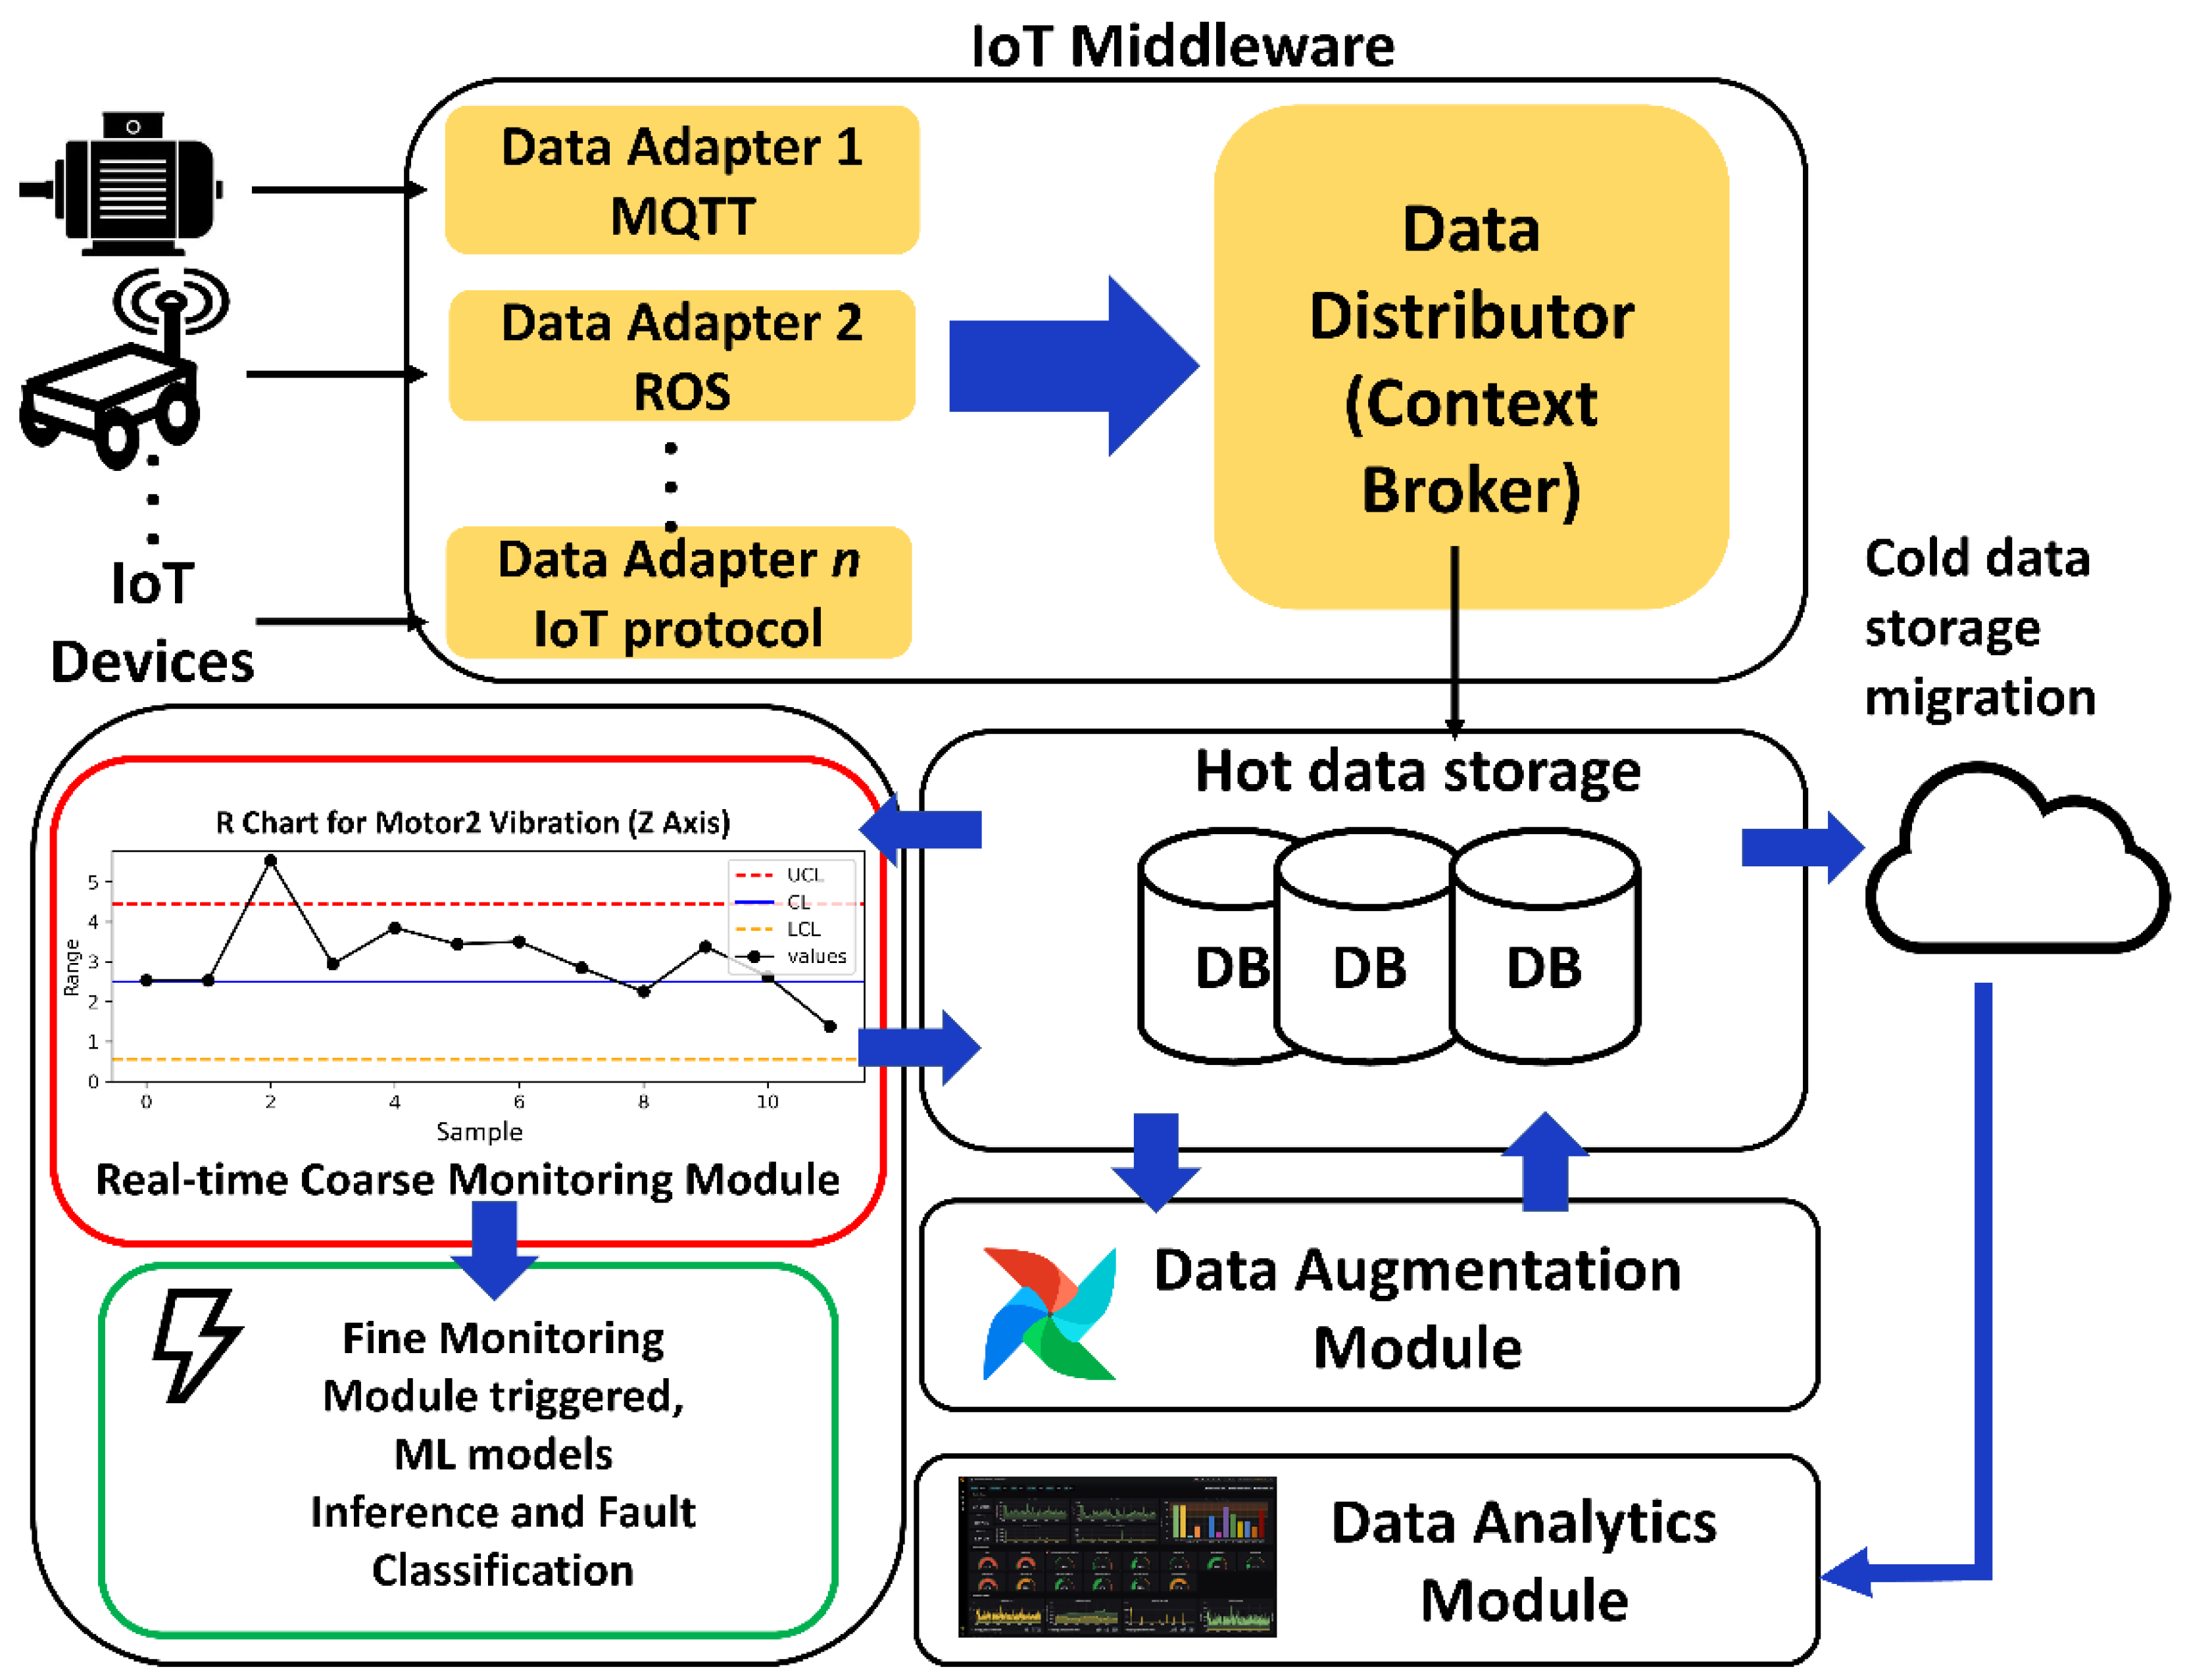
In PdM platforms, IoT middleware provides real-time communication and data distribution between monitored equipment and the system, eliminating technological infrastructure differences via various communication protocols and interfaces. The proposed platform’s operational validation is performed with custom-designed use cases with a motivation to collect uninterrupted sensor data from manufacturing devices in a smart factory. A high-level CPS design architecture for predictive maintenance is shown in detail in
Figure 1.
The platform supports the most frequently used IoT communication protocols in the field, such as MQTT lightweight communication protocol, which is verified in our electric motors use-case, ROS (Robot Operating System) for any data collection from robotics equipment, OPC/UA (Open Platform Communications/Unified Architecture) for industrial automation systems such as Programmable Logic Controllers (PLC). The platform can collect and monitor most of the equipment through these data adapters in an intelligent factory environment with many processes and equipment fleets during uptime. The system is designed as a platform where a scalable data distributor component called the context broker acts as a middleware with standardized data models for each piece of equipment. It can forward many IoT sensor data to other service components connected to it, such as big data persistence software.
2.1. Real-Life Use-Cases
Two industrial use-cases have been implemented to test the effectiveness of the designed PdM system in robust data collection and effective fault detection and diagnosis in a laboratory environment. Functional and stress testing of the software platform is performed against artificially induced fault detection scenarios and real-time sensor data collection with load tests for a prolonged time.
The first use-case relates to equipment condition monitoring of induction motors which are widely used in many industrial settings. A custom-made test rig is designed to generate artificial motor faults, and real-time sensor data collection is performed with online data collection scenarios.
Figure 2 demonstrates a detailed image of the test bed mainly used for testing healthy and faulty induction motors together with their online data collection use-case scenarios. The most widely used equipment monitoring sensors such as vibration, current, and torque signals are collected via MQTT adapters established in the platform software stack. The system is also tested to ensure a full-scale scenario, including a fleet of equipment that can be handled for condition monitoring applications.
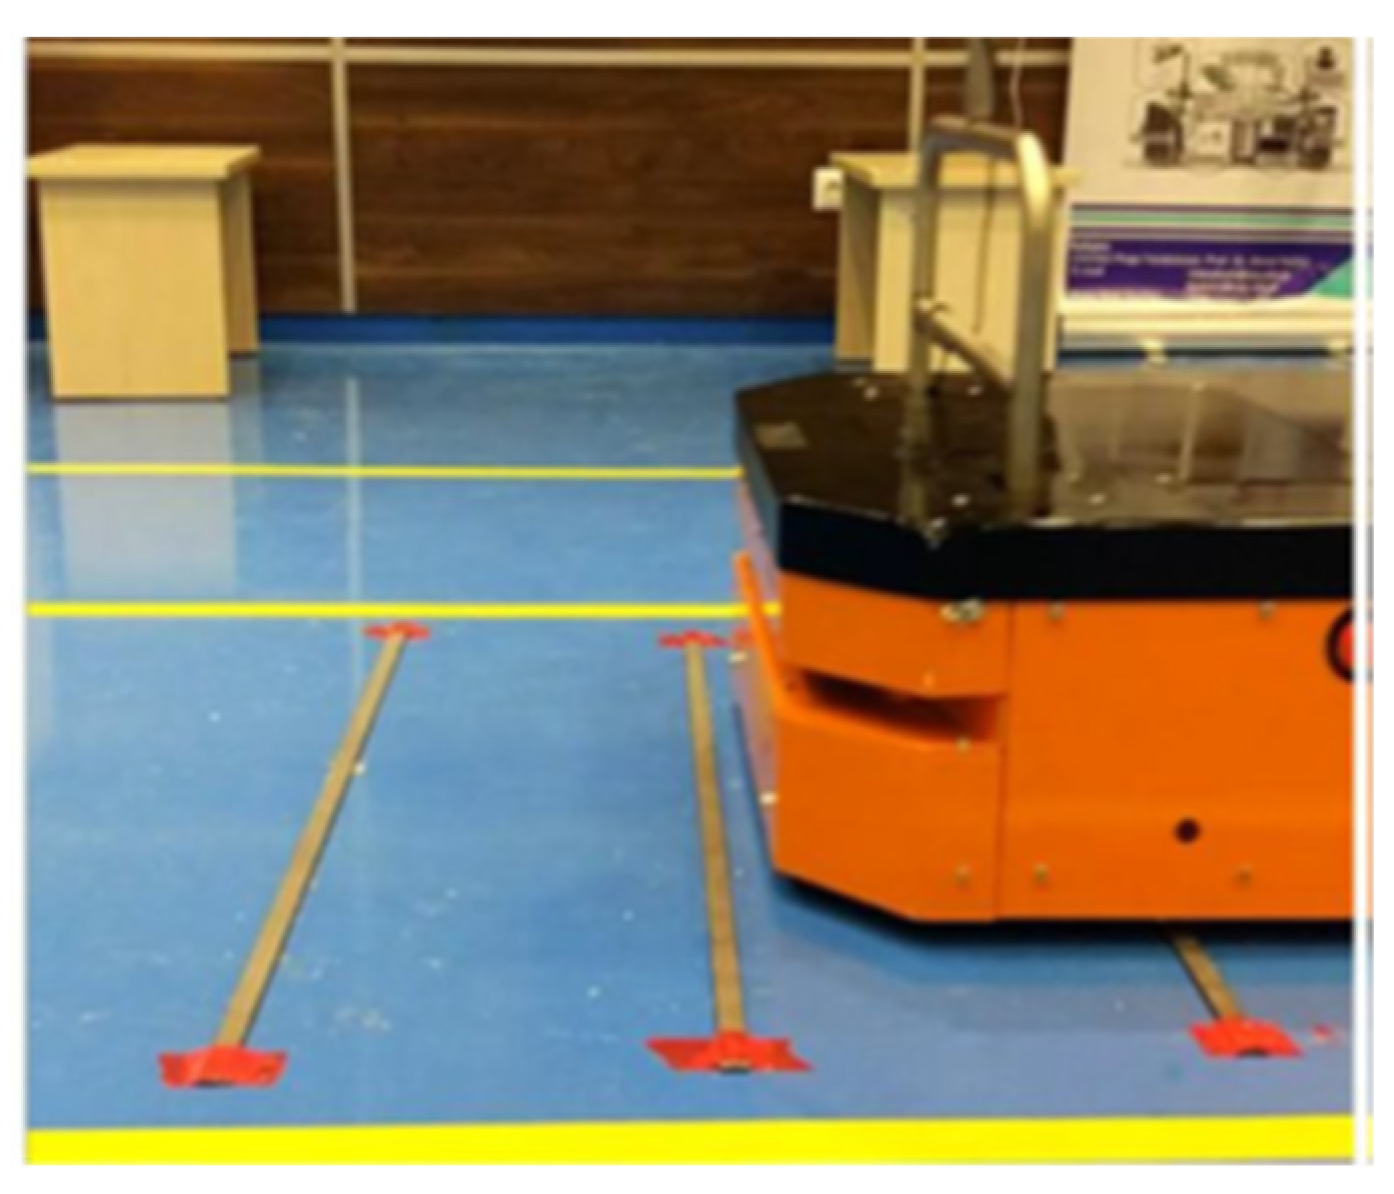
The second use-case included condition monitoring and prognosis applications of autonomous transfer vehicles deployed to a smart manufacturing setting, as shown in
Figure 3. Several fault and anomaly conditions are generated to test real-time fault detection and classification scenarios and data collection performance from Robot Operating System (ROS) adapters into the implemented system platform.
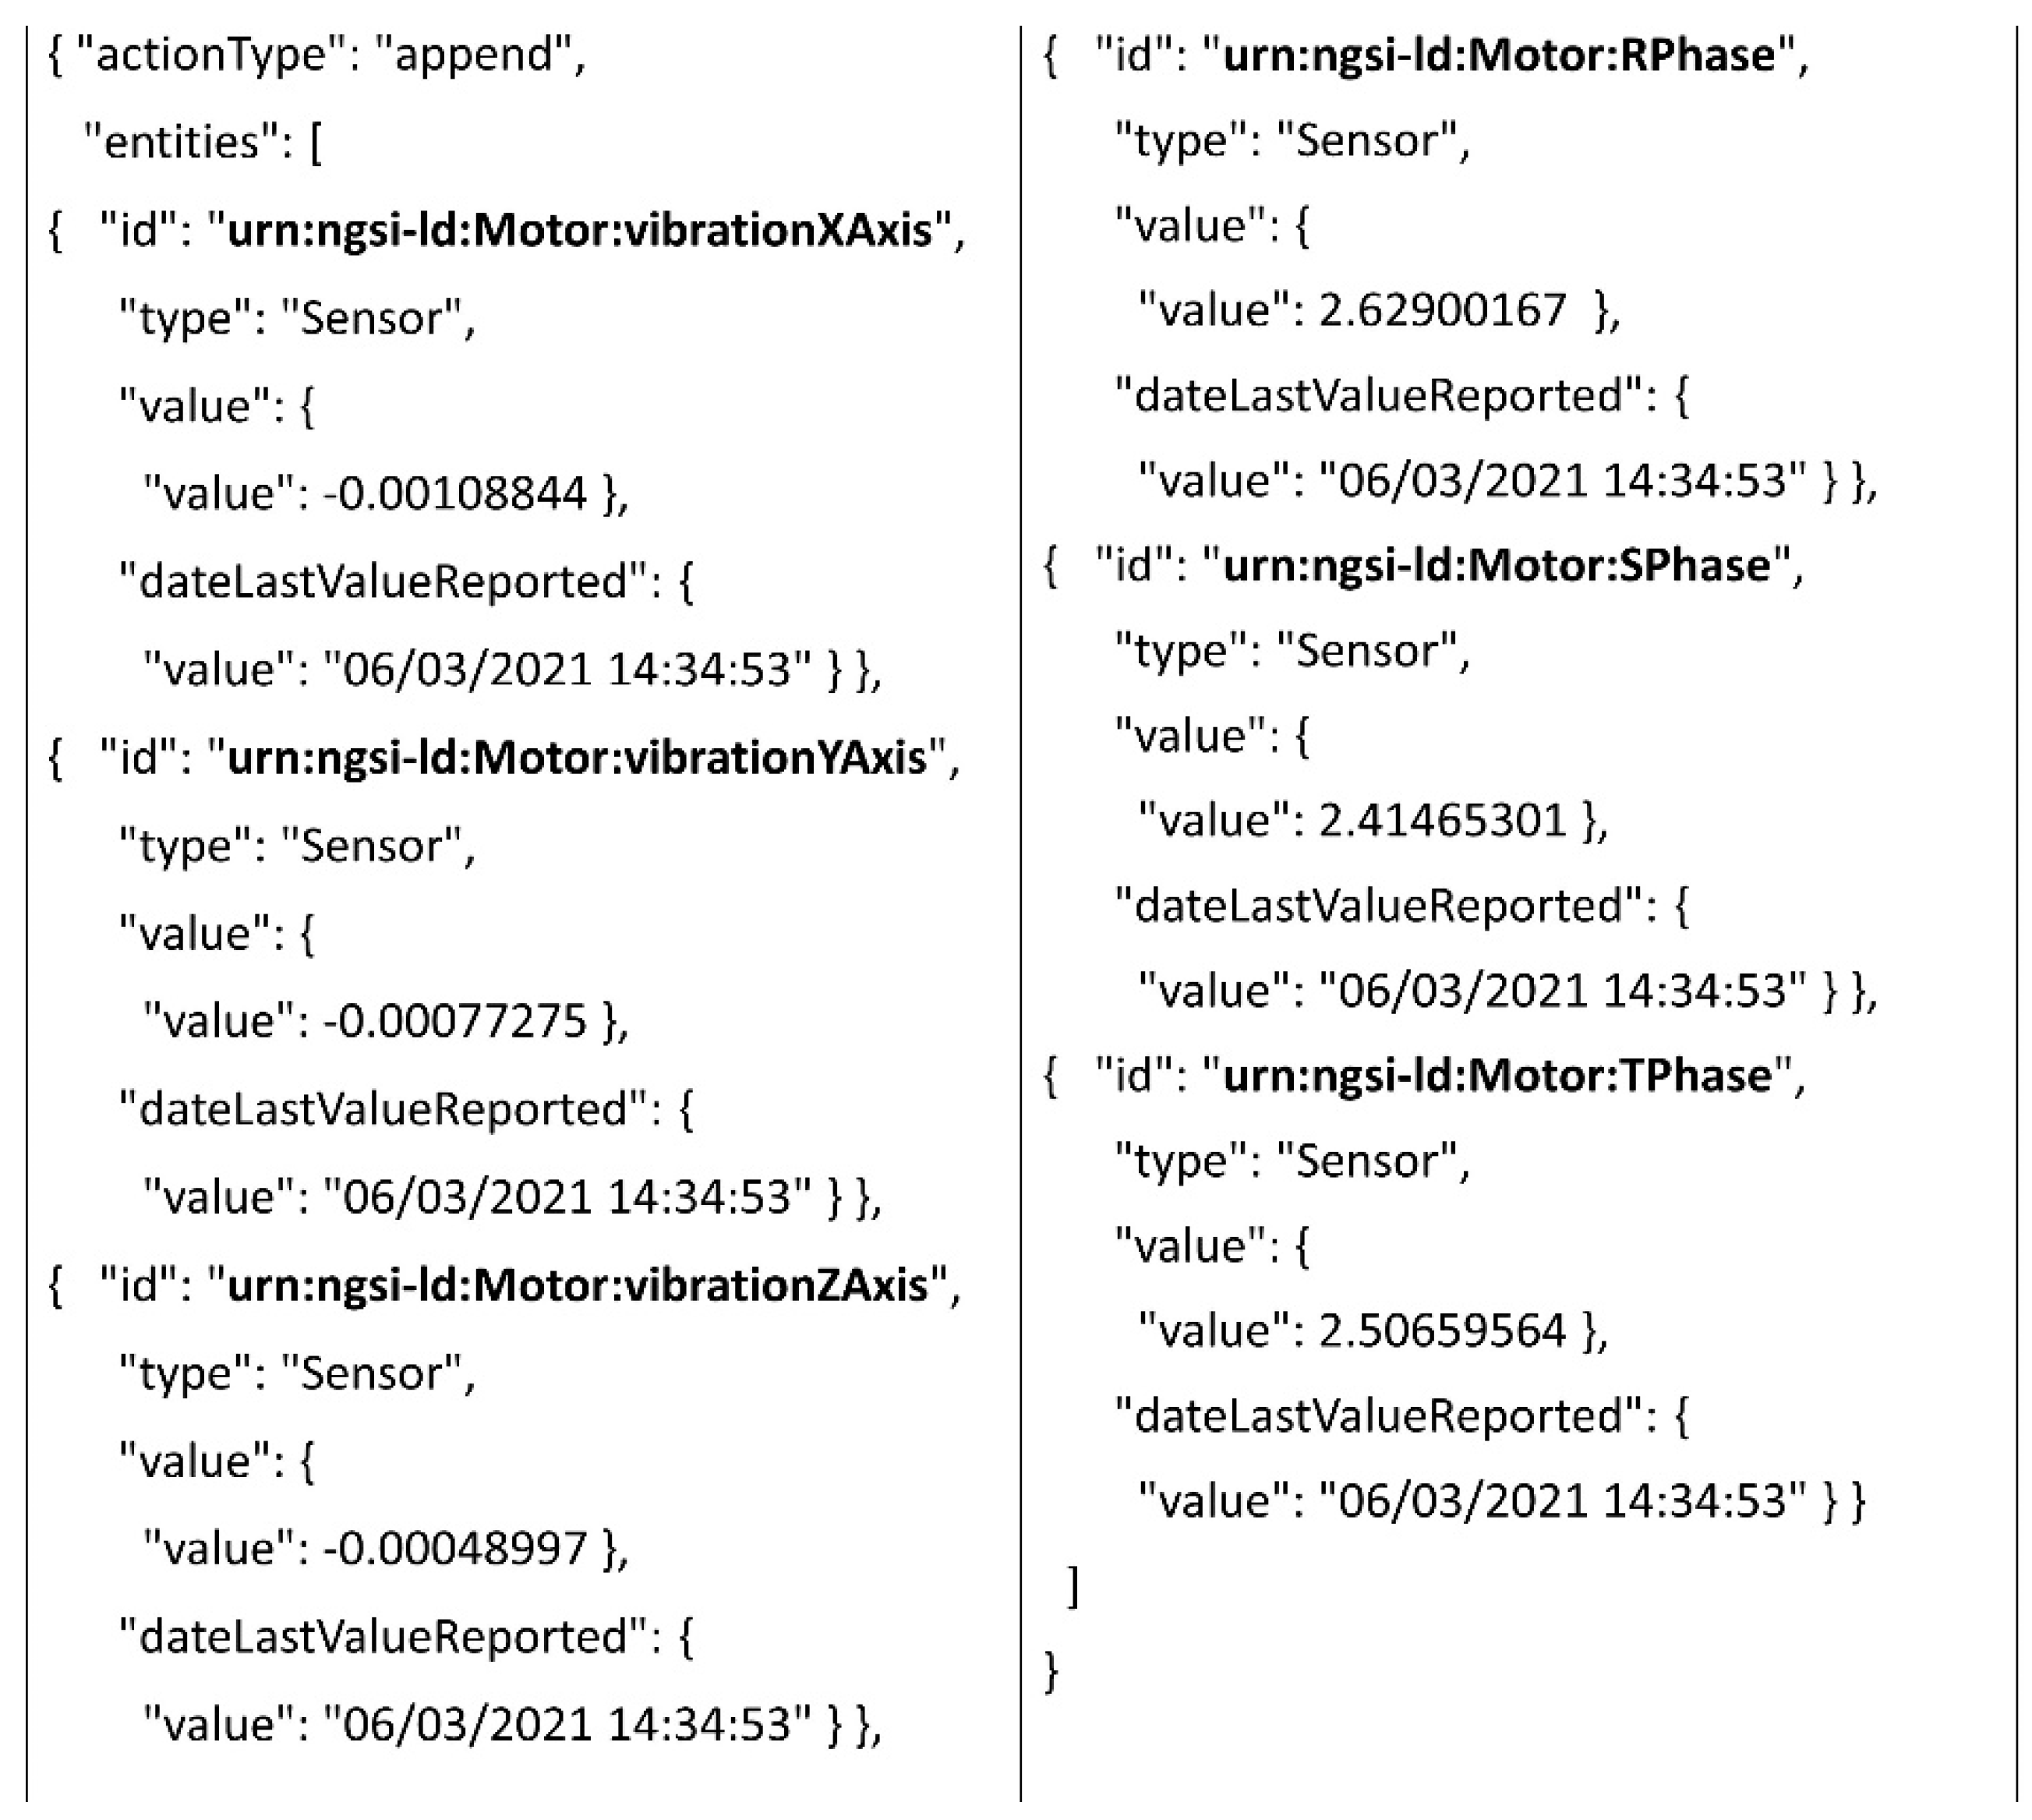
This study incorporates an open-source framework called Fiware as the middleware backbone, and the software stack is customized according to our needs for the proposed new PdM system. Fiware offers a baseline platform called context broker (CB) that acts as a data distributor between subscribed microservices. Its application programming interface (API) can be programmed with representational state transfer (REST) APIs. The requests made with HTTP protocol through CB encapsulate a standardized messaging format called Next-Generation-Service-Interface Linked-Data (NGSI-LD) [
15]. Specialized data models according to the application needs can be created in the NGSI-LD format and included in JSON-like message packets through the middleware.
Figure 4 demonstrates the sensor NGSI-LD data model format for the electrical motor condition monitoring use-case. The main construct of the data model includes an entity with a unique ID, an entity type, and the entity’s related properties, such as value. For example,
x-axis vibrational data from an electrical motor has a unique ID as urn:ngsi-ld:Motor: vibrationXAxis, and a type as Sensor. The remaining properties may include either the current value or an array of sensor values with corresponding timestamps.
Multiple data adapters are utilized in the middleware stack to convert messages to the standardized NGSI-LD data model. For example, an in-house developed microservice is utilized to listen to MQTT messages from a broker and convert MQTT sensor topic messages into NGSI. When the data distributor receives a request, it handles the rest of the traffic through the database server based on the configuration settings. In the case of an electrical motor sensor data collection, the data is forwarded to a Postgresql-based time-series database. The database layer consists of SQL and No-SQL type databases which can be configured easily according to the end-users need. The historical data collection can be performed continuously. Another in-house developed client software program is utilized to back-up sensor data from hot-data storage (on-premise server) to the cloud in batches for long-term storage (cold-data storage). The end-user can adjust the data retention period as the number of days according to needs. Any data older than this threshold is purged after being transferred to the cloud.
2.2. Real-Time Monitoring and Data Analytics Modules
The real-time data monitoring modules include coarse and fine monitoring for constantly monitoring equipment state and detecting possible fault events. These modules also include Machine Learning (ML) and Deep Learning (DL)-based model libraries for accurate fault classification customized for each use-case/equipment type. The data augmentation module ensures data quality for ML/DL-based models. They are designed to monitor the data for any missing values and utilize AutoML tools to impute the missing data due to extraordinary circumstances, e.g., network packet loss. The data analytics module includes software programs to visualize data, create dashboards and generate alarm rules for platform stakeholders (
Figure 5). All the modules consume or update the historical data from the databases and execute decision-making business processes.
Data such as system KPIs and metrics, visualization of raw data, or communication of classified faults are demonstrated in interactive charts and dashboards (
Figure 6). In the data analytics module, a multi-platform open-sourced software called Grafana [
16] is integrated into the platform.
The user is provided with the opportunity to instantly monitor, access, and work with the collected equipment sensor data and system metrics. The components in this module in the system constantly interact with the database layer and pull data for continuous monitoring and predictions. The data analytics module includes Statistical Process Control (SPC) charts for analyzing the sensor and processing data for outlier events. Instead of constantly invoking our custom-designed DL-based models against sensor stream data [
17,
18], the first response layer for equipment anomaly detection is satisfied via SPC charting and the rules generated for out-of-control alarm conditions utilizing raw sensor data. This part is called coarse monitoring modules of real-time monitoring. Any outlier events detected utilizing SPC charts trigger the fine monitoring modules where the corresponding ML model is invoked from the library for further fault classification.
The flowchart in
Figure 7 demonstrates the details of the DL-based condition monitoring model algorithm and the sequence of the events to detect faults for an autonomous transfer vehicle use case [
17,
18].
The coarse monitoring module triggered the first outlier event, and the corresponding fine control modules were activated for DL-model-based operational fault classification. Consequently, a novel multisensory-based Deep Learning model trained and deployed in the system for robot use-case is run for inference to classify the faults as high or low-level operational anomalies.
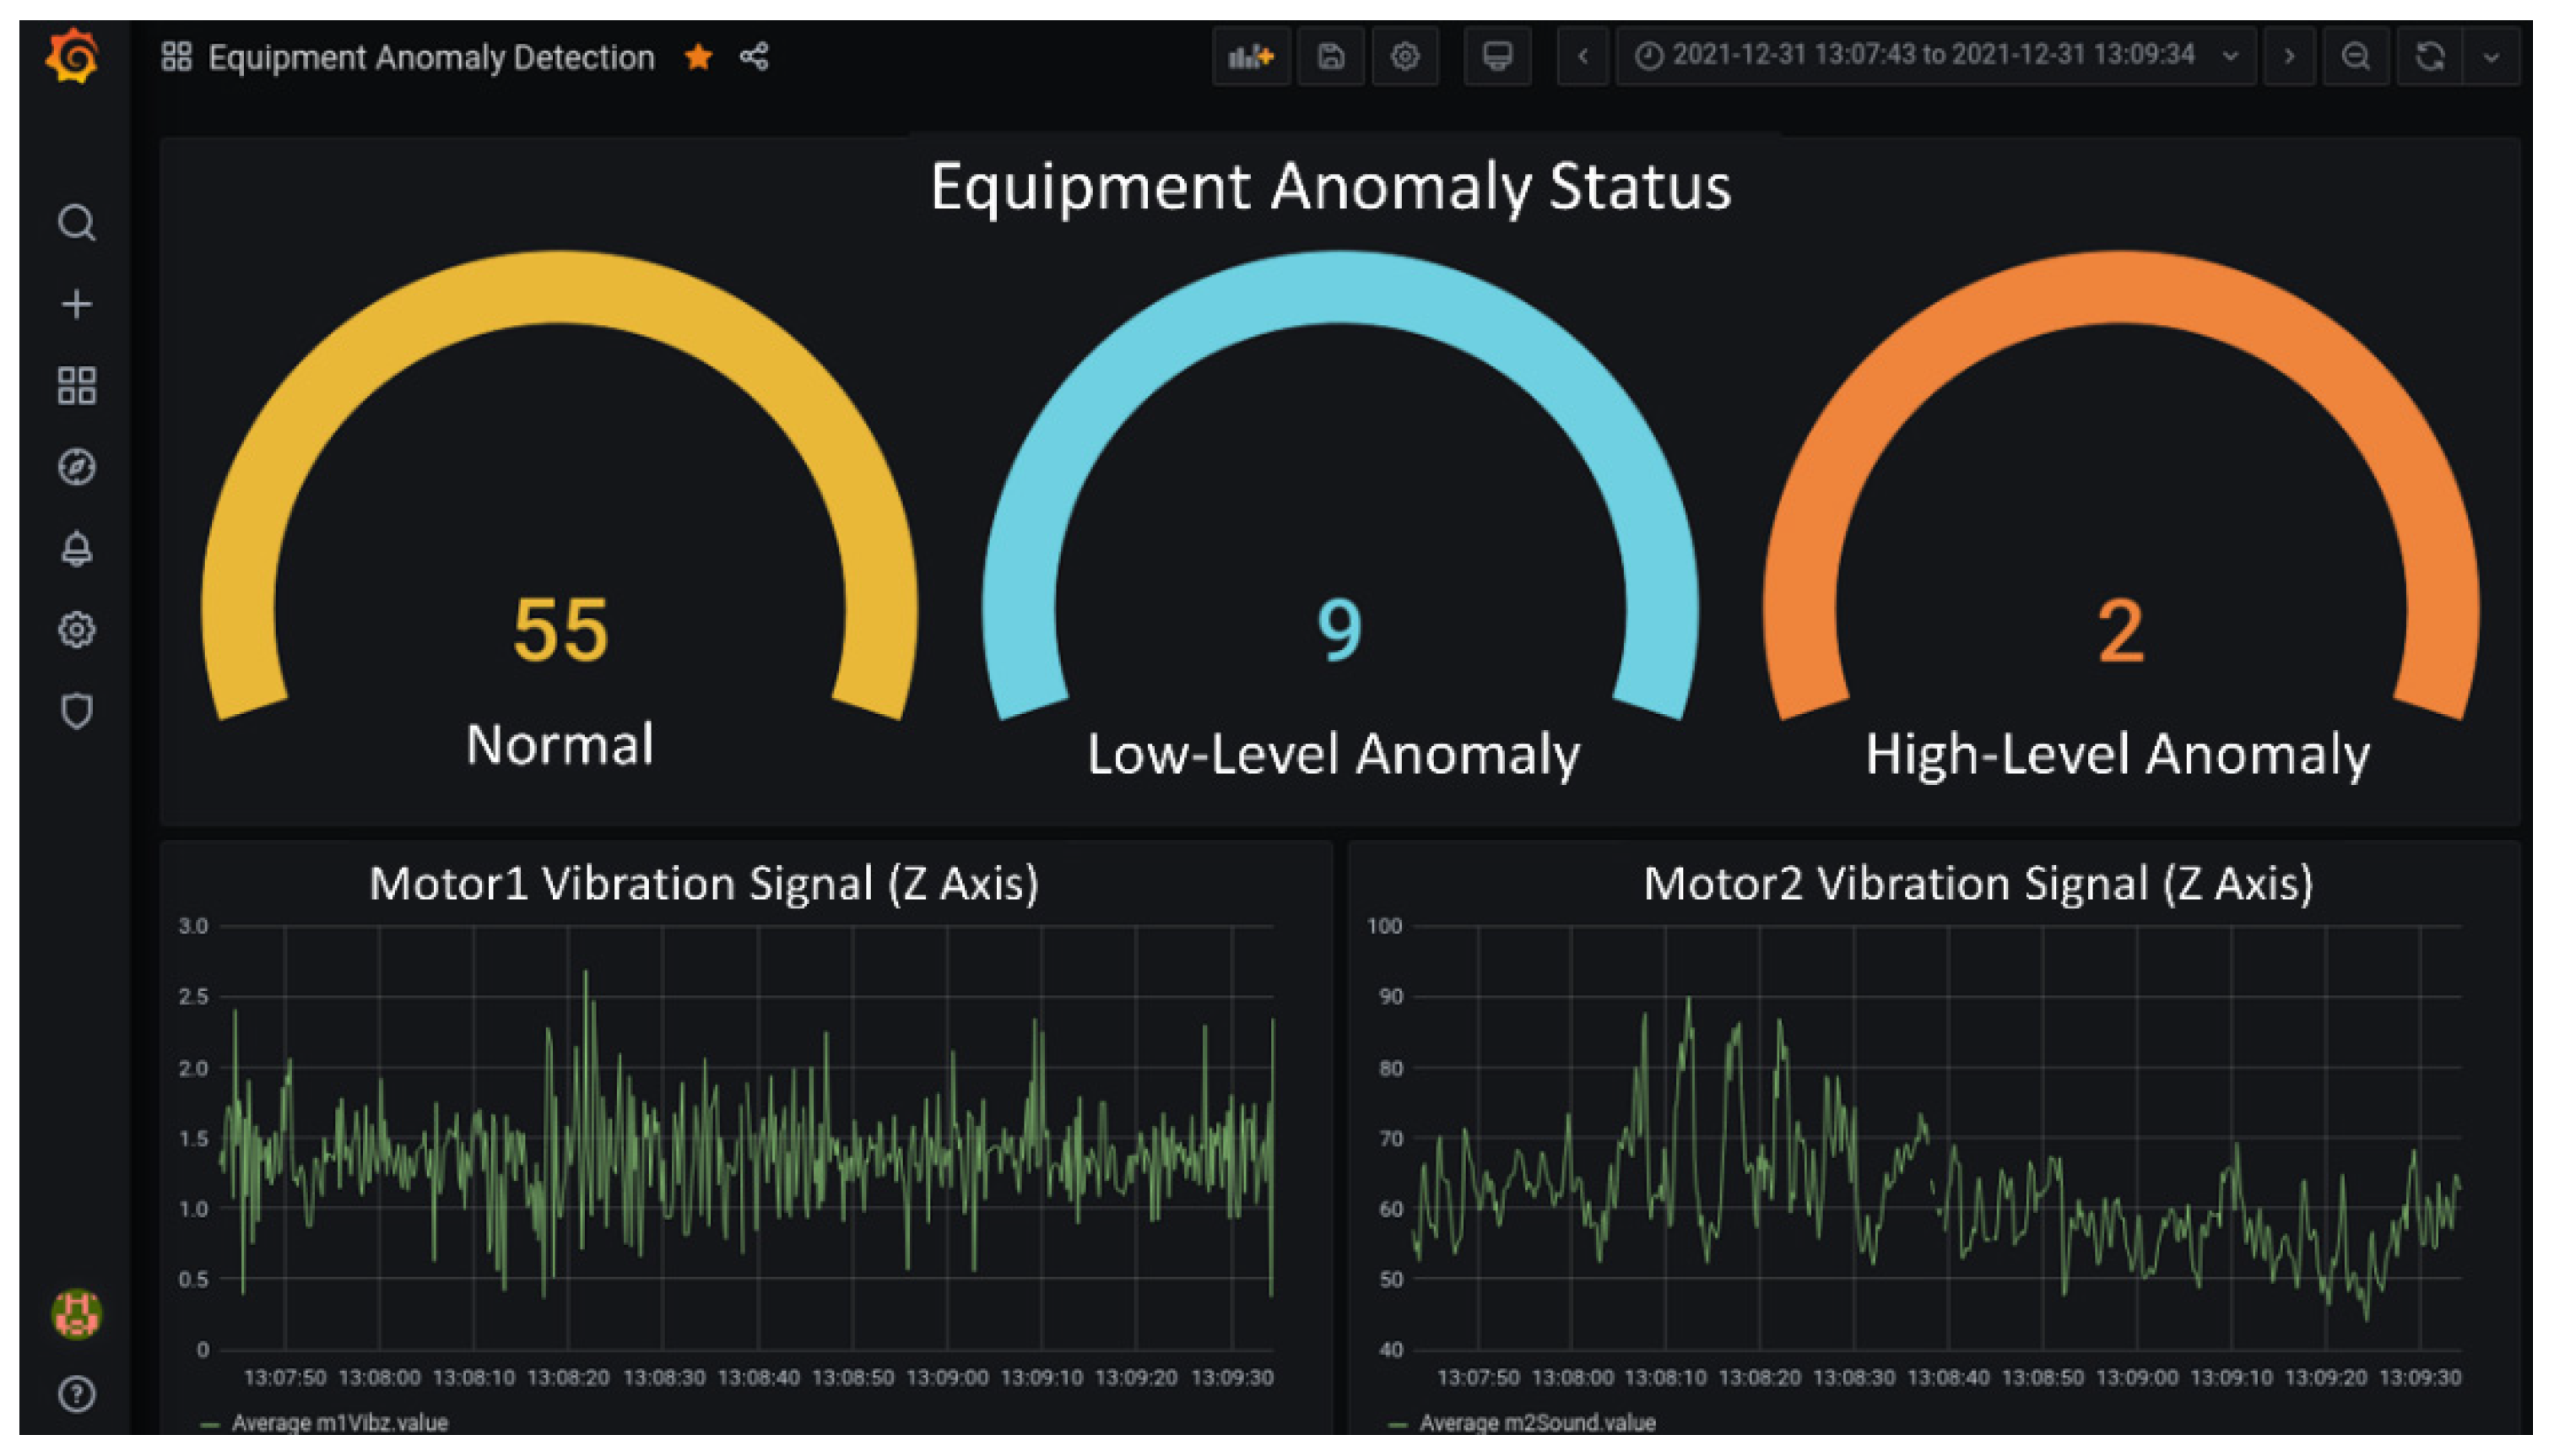
The data analytics module allows users to set up notification rules via various alerting mechanisms. According to these rules, the system can send e-mail notifications or mobile text messages to the users for detected equipment faults with reasons of triggers. The presence of system or equipment anomaly is communicated to the end users via these notification channels. The module utilizes database connectors to query data from the databases in the platform. Custom dashboards such as those given in
Figure 8 are created to communicate condition monitoring results to the system stakeholders.
In
Figure 8, the circle charts in the upper section display a dashboard chart where one of the motor equipment in an autonomous transfer vehicle robot faults are flagged first with peak z-vibration axis values in control charts.
2.3. Data Augmentation Module
A high volume of data can be collected from monitored equipment via attached IoT sensors and edge data acquisition devices. The persisted data in the databases can be used in fault/anomaly detection and maintenance planning processes. Due to unexpected circumstances such as network congestion, rarely, packet drops can occur. These might yield discontinuities in time-series data which consequently generate unexpected alarms. Furthermore, for data-driven fault detection models, gaps in raw sensor data can yield erroneous classification results for decision-makers and reduce the reliability and consistency of the results. The noise in the data, such as missing sensor data, should be handled for appropriate statistical analysis.
The designed data augmentation module interacts with the database where the hot data collected from IoT devices are persisted on an on-premise database and automatically monitors data for missing data issues. When a data gap is detected, the data window segment is imputed as close to its original value utilizing ML-based data imputation algorithms. An open-source workflow management platform, Apache Airflow [
19], is customized and integrated into the system stack to automate the workflow and orchestrate a scheduled data monitoring task. The module’s scheduled workflows are designed using directed acyclic graph (DAG) structures.
Figure 9 shows an example DAG representing the data imputation processes that occur on a scheduled basis inside the PdM platform. Each node corresponds to the sequence of actions the tool will take if a missing data event is triggered. If there is no missing value in the examined batch data and there is no need for data imputation, no action is taken until the next scheduled run for the selected set of sensor entities.
The sensor data in the hot data storage are read in batches at certain periods, and the presence of missing data is checked according to the specified parameters to flag the window for missing data issues. In the presence of missing data, a specified amount of specific sensor trace closest to the missing data event is queried and split into train and validation. The main purpose is to use the existing data for training the ML model and impute the null/nan values with the trained ML model within close timestamp proximity of the sensor trace data. TPOT AutoML libraries [
20] are integrated into the code baseline to determine the most suitable algorithm from a collection of ML algorithms for imputation. During automatic trials of ML models, different combinations of hyperparameters belonging to the models are tried, and the model with the highest accuracy value is selected for imputation on the missing data-trace segment. The tool determines the ML algorithm to ensure the closest imputation of the missing data to the original and fills in the missing data with the best algorithm. Final imputation data is updated in the database for the flagged sensor trace. In this way, the data augmentation module ensures sensor data integrity. It reduces the inference side effects of ML models in case of incomplete trace data encountered for training or model inference cases.
3. Proposed Decision-Making Process in the PdM System
3.1. Implemented System Metrics and KPIs
In this study, System KPIs and metrics are also proposed to measure the CPS’s performance for PdM. The main KPIs designed to increase traceability in our system are listed in
Table 1. The KPI data are also logged continuously, similar to the sensor data. The proposed KPIs contain important information about IoT systems performance components such as MQTT broker, context broker, and a database for traceability. The user can monitor the sensor data, metrics, and KPIs in real-time with various dashboards and keep the system performance under control.
Each proposed KPI in
Table 1 is described with their detailed technical explanations below:
TBA (sec., min., hours): stands for the group of time between alerts. The indicator represents the frequency of related sensor data, e.g., vibration (TB_VA) and current (TB_CA), which goes out of the expected control limit range. An alert occurs when the threshold value is exceeded in the control charts. The time between these alerts is measured, and the value is expected to be high. The gradual decrease in this value may mean a malfunction.
TB_RobR (sec., min., hours): for the robotics hardware data collection, a watchdog microservice agent checks the status of the robot and the connection to the ROS data adapter. The watchdog attempts to reset the connection if there is an unexpected problem and a component is disconnected. TB_RobR measures the time between these reset commands. A progressive decrease in this value indicates that robot equipment is unstable and has connectivity issues.
TB_RobRC (sec., min., hours): if there is an error with the robot, the ROS data connector watchdog tries reconnecting to the robot. The watchdog will notify the middleware system if it fails to reconnect to the robot. This KPI measures the time between these reconnection commands. The gradual decrease in this value indicates that the robot has frequent connection problems, which generally indicates a malfunction.
TB_RobESC (sec., min., hours): if the ROS data adapter reconnection attempt is over a threshold, the watchdog sends an emergency stop command and notifies the middleware system. TB_RobESC defines the time between these emergency-stop commands. A progressive decrease in this value indicates an anomaly connection in a robot.
ITE_15 min (#number/15 min): it represents the number of incoming transactions into the data distributor context broker component resulting in error averaged over 15 min in the system. A low value indicates that requests are forwarded to the data distributor agent without problems.
OTE_15 min (#number/15 min): it represents the number of outgoing transactions resulting in error averaged over 15 min from the data distributor. High values mean that requests and notifications sent by the broker are not forwarded and should be checked for service malfunctions.
Th_DB (bit/sec.): throughput to the database metric represents the amount of data read and written in the database layer per unit of time. If a significant drop is detected in this value, it indicates database or network malfunctioning.
P_Loss (%): packet loss represents the ratio of packets lost or dropped in a data packet shipment. The occurrence of packet loss causes a loss of information. This value is expected to be low. An increasing value may imply network congestion or over-utilized hardware resources in the platform.
MQTT_ QM (#number): number of messages waiting in the queue of MQTT Broker. The KPI represents the number of pending, inactive messages in the queue. This value is obtained by the difference between the sent (outgoing) numbers and received (incoming) messages through the MQTT data adapter. This KPI is expected to be as low as possible.
MQTT_ DM_15 min (#number/15 min): number of dropped messages over 15 min in MQTT Broker. The KPI represents the average number of published messages dropped by the broker in 15-min intervals. It shows the rate at which durable clients that are disconnected are losing messages. This value is expected to be low.
QL_M (sec.): the query latency metric defines the time taken to execute a query and get the response. Increased query latency indicates a congested database hardware/software layer and a data persistence issue. These metrics are expected to be as low as possible.
Although these are the fundamental system KPIs designed and implemented initially for the platform, it is possible to expand the metrics according to the user’s needs either at the server level or at the edge data acquisition device level.
3.2. Proposed PdM System
A CPS-based PdM system requires the following characteristics: high-level connectivity with real-time data collection and monitoring, interoperability with various types of machines and data adapters, integration of advanced data analytics modules, and effective decision-making strategy [
21]. In this section, we present the details of our decision-making strategy, in other words, our operational business process that is found to be the most effective and robust in predicting faults from the use-cases.
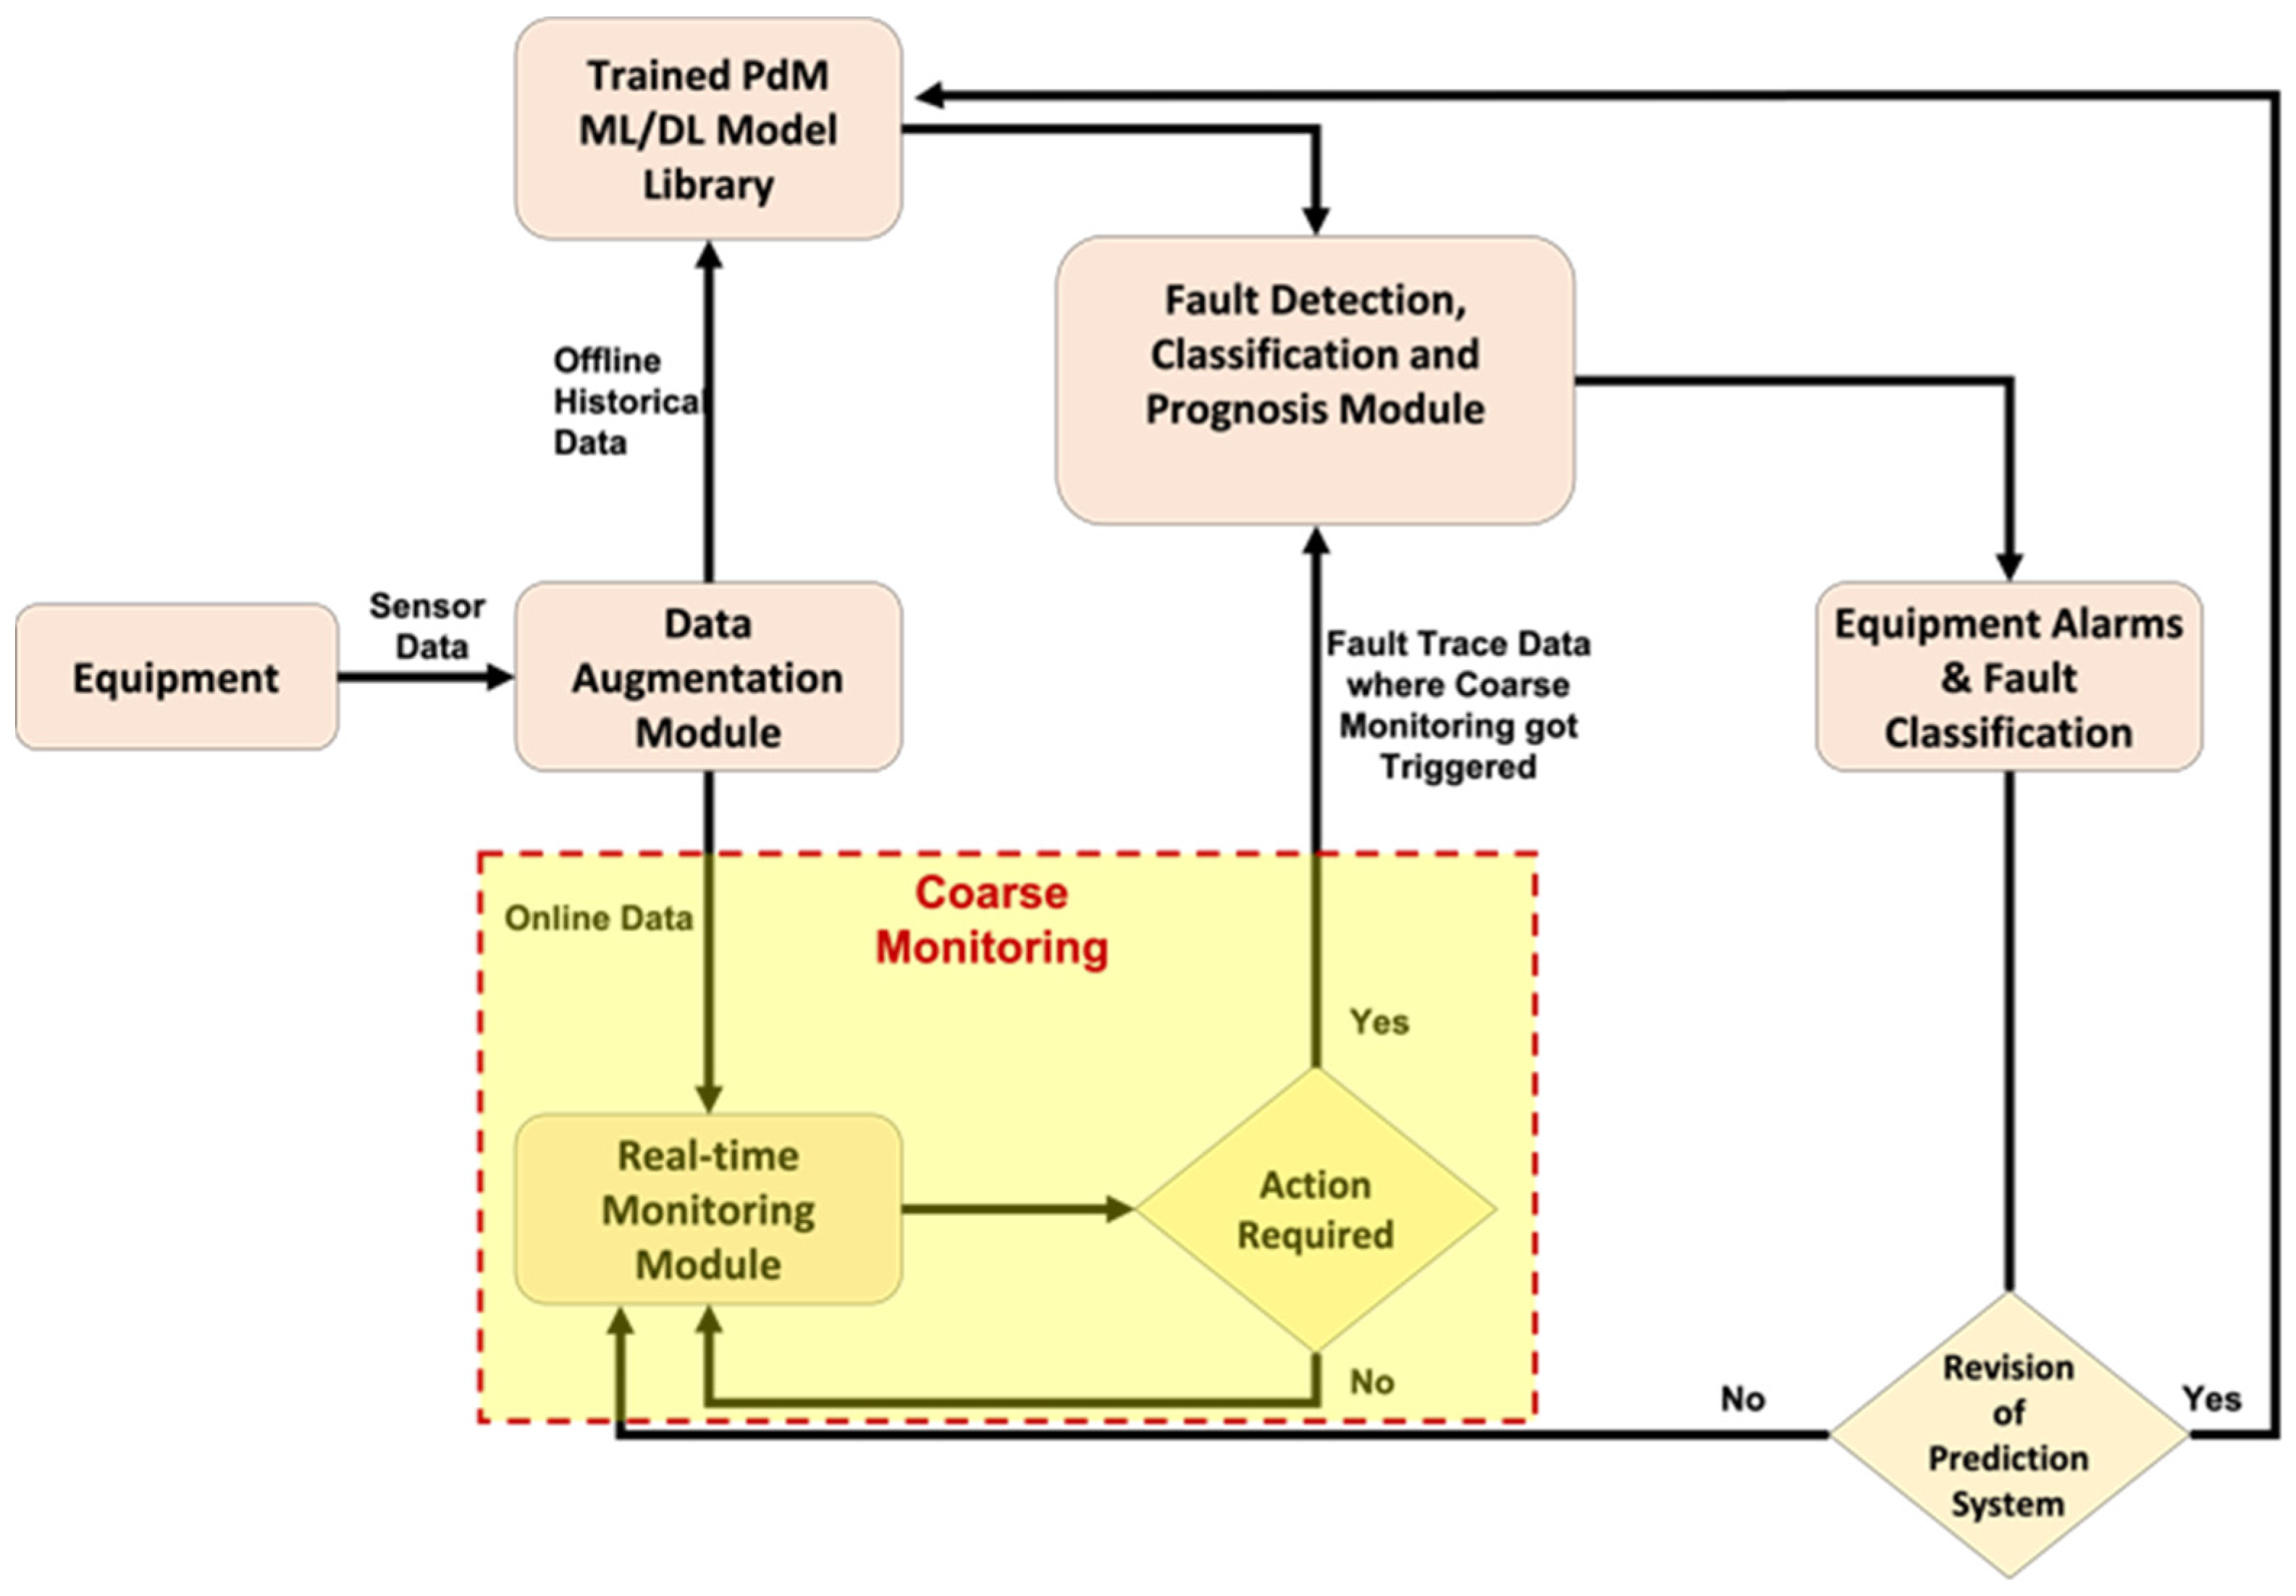
Predictive maintenance systems can collect data at the edge via IoT sensors and data acquisition hardware. It is necessary to design generic systems that can be easily adapted to different use-cases to achieve zero downtime with equipment and machine processes in different phases of manufacturing steps. The data pipeline systems monitoring equipment collect data and transfer it to data persistence layers such as databases. The data can be analyzed according to programmed business processes at central servers, and one can utilize data-driven AI models to predict equipment faults. The proposed system’s implemented decision-making strategy and data journey is illustrated in a flowchart in
Figure 10.
The sensor streams data collected and stored into databases from technical equipment are in parallel monitored for any missing data problem. The scheduled jobs continuously monitor the sensor data with tumbling windows for any missing data and flag the timestamp interval where discontinuities are found for fixing. For the flagged missing data segments, the AutoML component triggers the best ML algorithm for data generation utilizing model inference. While these tasks are continuously repeated behind the scenes periodically, the sensor streams data are processed with the coarse monitoring module in parallel. In this module, data is monitored with Statistical Process Control (SPC) charts for outlier detection and equipment data monitoring. Based on the alarm conditions obtained from SPC charts, the actions are forwarded to ML-based condition monitoring and prognostic modules. Previously trained and validated Deep Learning models are called from the ML/DL model library for testing to classify incipient equipment faults in the system. Field operators can generate custom-made maintenance rules and work orders by utilizing the maintenance planning module based on the fault types classified by the ML models, the fault’s frequency, and severity. This module can also trigger maintenance requests working in tandem with a factory’s Computerized Maintenance Management System (CMMS) software.
Shewhart Control Charts are the most used Statistical Process Control (SPC) tool. In the coarse monitoring module, X-bar and R charts are used for detecting mean and variance shifts in the observed characteristics of the equipment data. The control charts used for coarse monitoring prevent the ML-based maintenance prediction module from constantly processing large amounts of data and making predictions. The out-of-control warning of control charts triggers the system’s DL models for fault prediction.
According to the threshold/alert mechanisms obtained from the charts and dashboards, the performance of the equipment is obtained. If the performance is stable, the KPIs and metrics are continued to be monitored. However, if there is a decrease in performance, action should be taken. The maintenance prediction system is triggered, and the corresponding DL model in the model library that is previously trained with offline data is utilized for testing with real-time data. If configured on a scheduled time basis on top of the condition monitoring actions, prognostic models can be employed for RUL estimation. Maintenance alarm rules are created based on fault detection and classification as well as prognostic predictions, incorporating the estimated RUL. In the maintenance planning process, attention is also paid to the accuracy of the DL models. If the prediction system’s ability to predict is quite strong, maintenance plans will also be appropriate, and KPIs will continue to be monitored without any changes. On the other hand, if the prediction system cannot predict accurately enough and revision is required, system updates are made to the DL models.
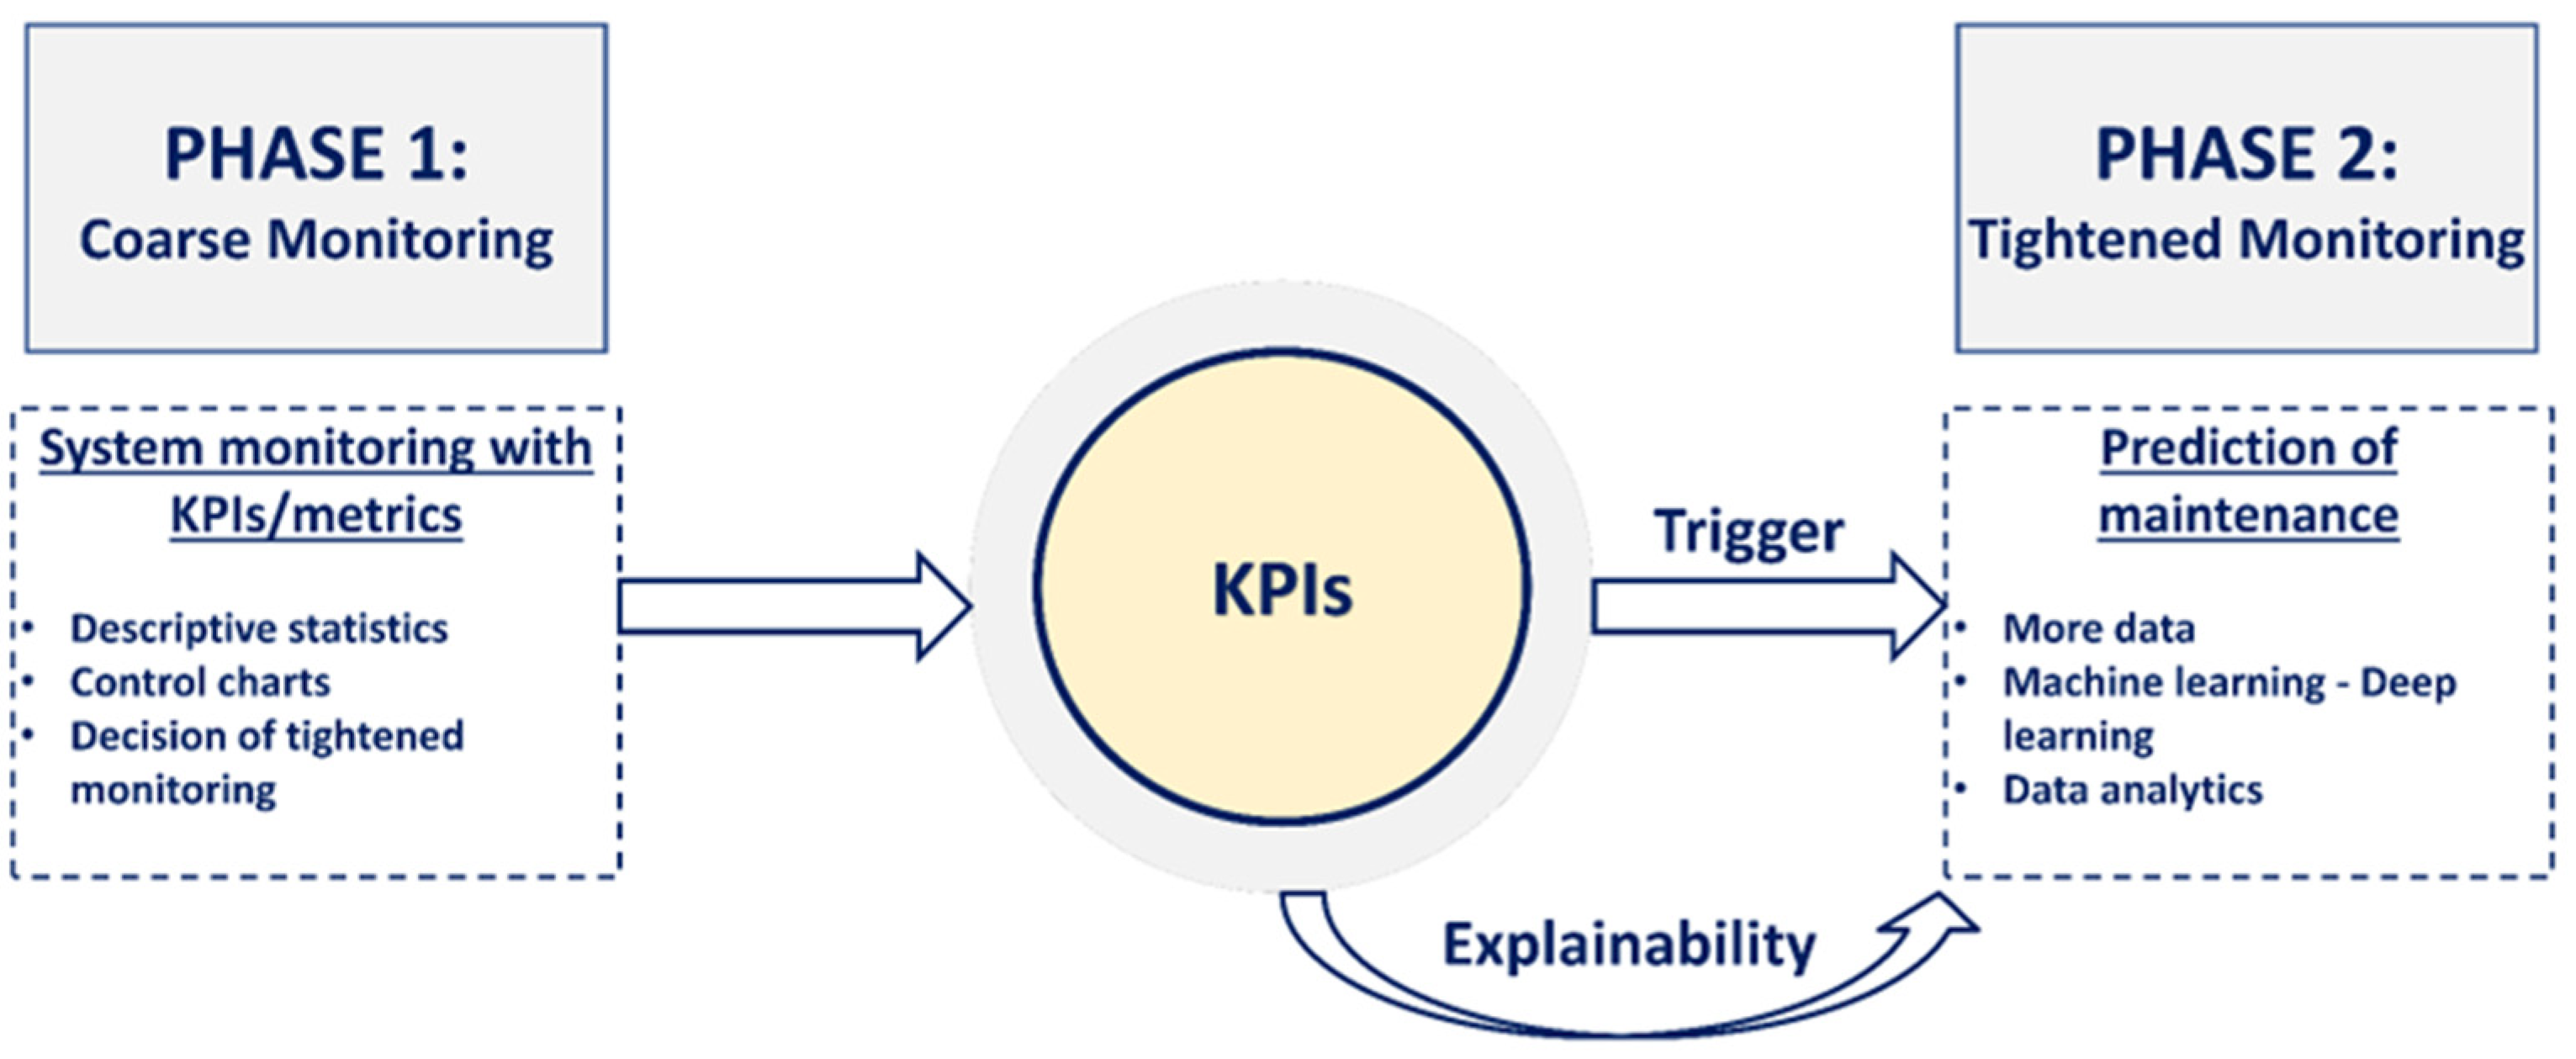
The two-stage monitoring process designed and implemented in our proposed system is depicted in detail in
Figure 11 for further clarification. The first phase that is coarse monitoring acts as a supervisory system monitoring. The coarse monitoring utilizes various statistical descriptors to track the DL model triggering mechanisms. These descriptors are monitored by utilizing SPC charts. Various alert conditions are implemented based on chart limits that trigger phase 2 of the monitoring system, which is also called tightened monitoring. In the second phase of the monitoring process, DL models are utilized to predict the actual root cause of the maintenance problems.
The coarse monitoring phase also includes the proposed system KPIs and metrics. The characteristic of KPI data is analyzed with various statistical descriptors. With the Shewhart Control Charts created for each KPI, it is checked whether the IoT system continues as usual.
The variability in the operational process in normal and abnormal situations is monitored with the obtained X-bar and R control charts. The X-bar control chart shows how the KPI averages change over time. The R chart plots the ranges of KPIs that express the difference between the maximum value and minimum value of KPI in a sample.
The process is expected to proceed randomly between the upper control limit (UCL) and lower control limit (LCL) lines. The relevant KPI data exceeding the UCL or LCL of the X-bar and R chart can represent an unusual situation. An alert is generated when the control limits are exceeded in the maintenance system. These generated alerts inform decision-makers that the process is not under control. The maintenance prediction system is triggered only when the coarse monitoring indicates an abnormal condition. The system does not need to predict system maintenance during coarse monitoring constantly; thus, this can bring operational cost savings.
Note that monitoring the time between alerts when lower or upper control limits are exceeded is also critical. The time between alerts is recommended as a KPI and is monitored through dashboards. A shorter time between alerts also indicates system malfunctions and the need for a careful look for maintenance or adjustment/correction.
Figure 12 illustrates a case where the time variability between vibration alerts (TB_VA) has exceeded the upper control limit and indicates that the process is out of control.
Process variability is always monitored in coarse monitoring with real-time streaming data. The coarse monitoring phase triggers the second phase to trigger a data-driven fault detection model when the variability increases. The tightened monitoring in the second phase covers analyzing more data in detail and activating the designed novel sets of DL models for this PdM framework. The charts and alerts in the coarse monitoring phase explain the reasons for triggering for prediction system to the users and decision-makers. Thus, the root cause of the system failure/anomaly is explained to the user with KPIs. The user can quickly establish the relationship between the system maintenance predicted by the DL model and the system state, consequently reducing false alarm rates.
4. Conclusions
This study proposed not only a design and implementation of a novel cyber-physical system architecture for PdM but also a decision-making strategy for fault prediction and maintenance applications with proposed system metrics and KPIs. The implemented system is tested in two separate real-life use-cases, including monitoring autonomous transfer vehicles and electric motor equipment for a smart manufacturing setting. Furthermore, KPIs and system metrics are defined to reveal the end-users performance and maintenance requirements in CPSs. The proposed system demonstrates how CPSs can be applied to predictive maintenance systems to integrate intelligent fault detection systems for smart manufacturing settings. The presented highly generic and modular CPS architecture makes it possible to integrate different software stacks into the proposed PdM system easily.
The designed CPS architecture for PdM includes several modules working in tandem. The data augmentation module completes missing data with AutoML technologies on the Apache Airflow platform periodically to help enhance data quality. Simultaneously, data from sensors are analyzed in two separate phases as coarse and tightened monitoring in determining the equipment’s maintenance needs to be monitored by CPS. The raw sensor data and KPIs/metrics representing system health are monitored to detect outlier events with the real-time coarse monitoring module utilizing SPC charts. Out-of-control data point events help trigger fine control modules. This hierarchical mechanism helps reduce unnecessary DL model triggers for more accurate predictions instead of constantly processing too much data and yielding too many false positives. The proposed system further increases the transparency and user confidence in DL-based models for PdM systems by using KPIs and system metrics for performance monitoring.
In future studies, KPIs needed for other components in a CPS can be defined and integrated into the PdM system. Different use-cases and operational scenarios can be integrated to demonstrate the power advantage of the PdM system as a generic platform. Lastly, integration of the designed system across a factory floor for fleets of equipment monitoring is also planned.
