Article

Optimization of Hammer Peening Process for Gas Turbine Rotor Straightening

1
Department of Mechanical Design Engineering, Tech University of Korea, Siheung-si 15073, Gyeonggi-do, Korea
2
Department of Aeronautical and Mechanical Engineering, Cheongju University, Cheongju-si 28503, Chungcheongbuk-do, Korea
*
Author to whom correspondence should be addressed.
Machines 2022, 10(10), 950; https://doi.org/10.3390/machines10100950
Submission received: 4 September 2022 / Revised: 8 October 2022 / Accepted: 17 October 2022 / Published: 19 October 2022
(This article belongs to the Special Issue Diagnostics and Optimization of Gas Turbine)

Abstract

:
Some rotors are bent permanently due to high operating temperatures, repeated transition periods, and so on. Rotors with large deformations often require straightening processes. The goal of this study is to develop a method to determine the optimal locations and strengths of hammer peening for straightening gas turbine rotors. A set of parametric hammer peening simulations were performed for various dimensions of straight rotors and peening locations. The deformed geometries of the rotor from the parametric simulations were presented as curvature vectors. These curvature vectors were fitted using an empirical function. For a given initial geometry of the rotor and hammer peening plans, the post-peening geometry of the rotor was predicted by superimposing the initial curvature and newly induced curvature. An optimization statement was defined to determine a set of hammer peening locations and strengths. Constraints were imposed to exclude areas where hammer peening could not be performed such as locations for bearings. The proposed method provides an optimal hammer peening plan for the given runout data. The proposed method was validated against a series of hammer peening test results for a simple shaft. The developed method can be applied to other types of rotor straightening methods such as hot spotting.

1. Introduction

Rotors can be permanently bent due to various causes such as rubbing between moving and stationary parts, cracking, loss of clearance, and so on [1,2]. When a rotor is bent permanently more than the tolerance set by its manufacturer, a careful inspection needs to be performed to identify the leading causes of the bending of the rotor and solutions for the bending [3]. Straightening processes are often needed to reduce permanent bending within the tolerance either as an emergency measure or as a permanent fix. In general, the straightening process is effective if the bending has occurred during operation (such as rubbing between parts, misalignment, etc.) rather than during the manufacturing process, because of improper forging, rolling, heat treatment, and so on.
Various types of straightening methods (such as cold mechanical straightening, hammer peening, hot spotting, etc.) have been developed to restore the balance of the rotor [4,5]. The straightening method is selected considering the size of the rotor, the degree of the deformation, the location of the deformation, and so on. While a complete review of rotor straightening methods can be found in the above-mentioned literature, some of them are briefly reviewed here. In a cold mechanical straightening process, a hydraulic jack and two-end support can impose a three-point bending loading condition on the rotor. The jack is usually positioned at the convex side where the largest deformation occurs. The jack applies the load very slowly to the rotor while the deflection is carefully monitored using indicators. The cold mechanical straightening method is known to be suitable for rotors with small diameters of 100 mm or less [6]. The hammer peening method is another cold work-based straightening method. The rotor is placed on two end supports, facing downward at the maximum bending location. Additional support is then placed at the bottom of the maximum deflection location. The concave side of the maximum deflection location is then impacted using a round-shaped metal hammer. While this method is known to be effective for rotors with diameters of 100 mm or less, this method has also been used for larger rotors with deflection of less than 0.5 mm [5,6]. The hot spotting or heating and cooling methods are employed to correct rotors with larger diameters of 100 mm or more or large deformations of 0.5 mm or more [6,7]. In the hot spotting method, the convex side of the bent rotor is rapidly heated using a torch so that the heated region experiences compression from its surrounding materials. The correcting moment is produced after cooling down due to the compressive residual stress in the heated area. The heat and cooling method is used for large shafts that cannot be supported to get the necessary compressive stresses at the location of the bending deformation. This method consists of applying extreme cold on the convex side of the bend and then quickly heating the concave side of the bend. This method can be used to straighten shaft ends beyond journals or large vertical shafts bent anywhere.
Although heating-based methods can handle larger shafts and deformations than the hammer-peening method, the hammer-peening method has a few advantages over heating-based methods. It is known that heating-based straightening can change the mechanical properties of steel [8]. The yield stress and ultimate tensile strength can increase by around 20%, while the percent elongation and modulus of elasticity may decrease by about 33% and 25%, respectively. Kim et al. [9] showed the degradation of the Cr-Mo-V steel after heat treatment at 600 and 650 °C for 1–2000 h via nondestructive evaluation. In contrast, peening at an appropriate strength is beneficial for the wear/abrasion resistance of metal parts because it produces compressive residual stress in the peening area [10,11]. Therefore, it would be beneficial to use hammer peening to correct a bent rotor if the method is applicable.
The challenge is that there is only rough guidance, such as a diameter of less than 100 mm and a maximum deflection of less than 0.5 mm, regarding whether the hammer peening method is suitable or not. A systematic approach based on quantitative analyses such as the finite element method and analytical solution can be employed to determine whether hammer peening can be used for a given rotor deformation. Many studies have investigated the effects of peening on the deformation of a specimen and induced residual stresses. Xiao et al. [12] have shown that the curvature of metal strips after a set of peening could be predicted using finite element analysis. Xiao et al. [13] have demonstrated that 3D finite element analysis could predict the sensitivity of the residual stress distribution from shot peening with respect to peening patterns and peening coverage. Gariépy et al. [14] have used finite element analysis to investigate peening parameters on the final material state and predict deformed shapes. Although there has been a body of work to quantify the effect of peening on the geometry of various specimens, attempts to predict the geometry of rotors after a set of hammer peening have not been reported to be the best of our knowledge. In addition, there is a paucity of systematic methods for determining the locations and strengths of hammer peening. Instead, skilled workers have determined the locations and strengths of hammer peening based on their experience. A suboptimal peening plan causes unnecessary cost and time by increasing the number of peening trials and post-surface treatments for dents on the rotor. Kim and Chung [15] and Pei et al. [16] have developed a multi-step straightness control system for the shaft straightening process using the cold mechanical straightening method. While the shape of the specimen was sheet metal instead of the rotor shape, Xiao et al. [12] and Hacini et al. [17] showed that the final geometry of the specimen after shot peening could be predicted by analytical and numerical analysis. Similarly, a systematic approach can be developed to determine an optimal set of peening locations and the strength of peening trials. Such a method can also be used to determine whether a bent rotor can be corrected by the hammer peening method or not.
Thus, the aim of this study is to develop a method to determine the optimal locations and strengths of hammer peening for straightening gas turbine rotors. First, a set of parametric hammer peening simulations were performed for various dimensions of straight rotors and peening locations. Second, the centerlines of each deformed rotor from parametric simulations were presented as curvature vectors along the length of the rotors. The induced curvature profile of the rotor from each simulation was fitted using a five-parameter empirical function. Third, for a given initial geometry of the rotor and hammer peening plans, the post-peening geometry of the rotor was predicted by superimposing induced curvatures to the initial curvature of the rotor. An optimization problem was defined to minimize bending deformation of the rotor considering multiple trials of hammer peening. The optimization method was then applied to the runout data. Lastly, the proposed method was used to predict the deformed geometry of the rotor from an experiment.

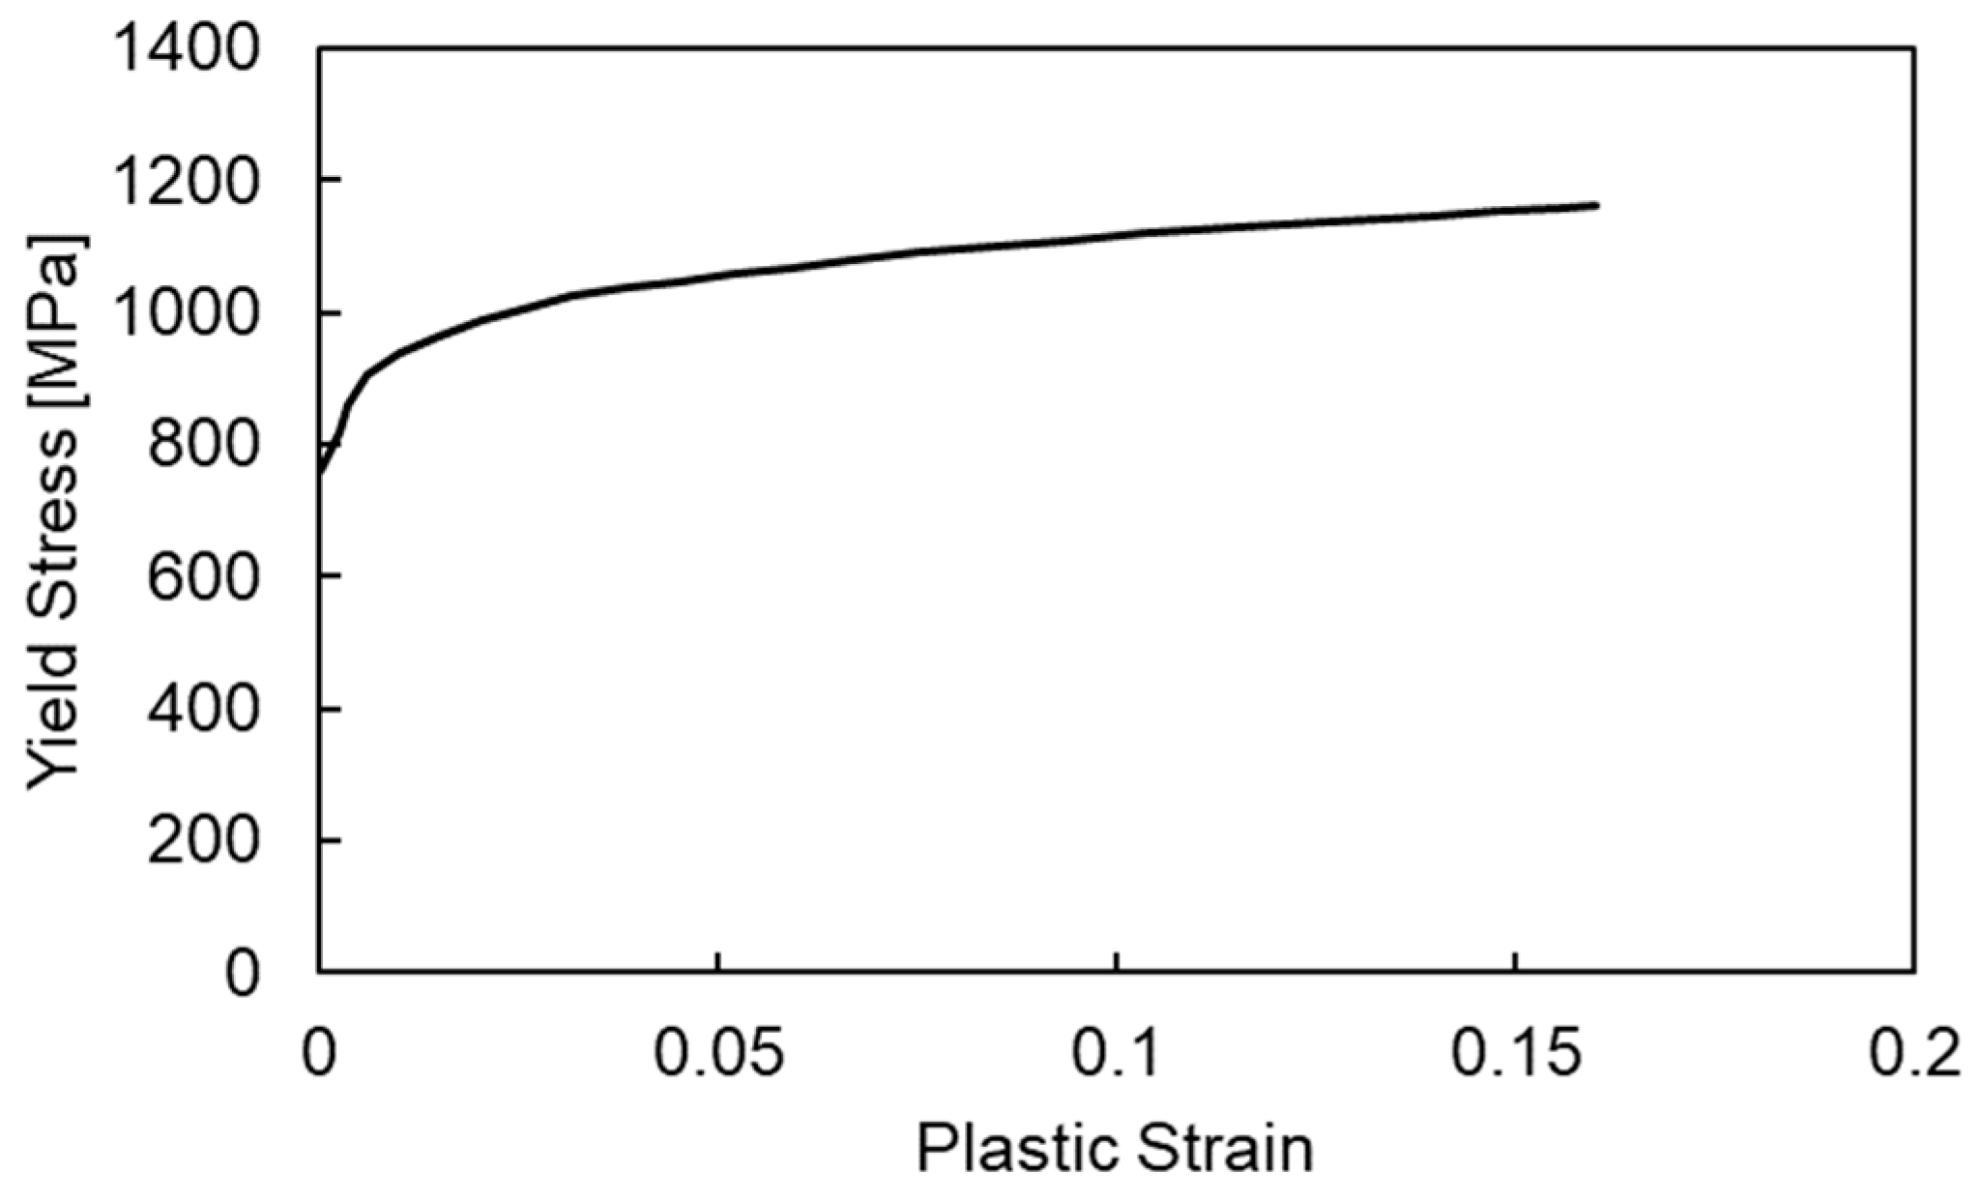
2. Materials and Methods

2.1. Repeatable Hammer Peening Machine

A repeatable hammer peening machine (Figure 1) for blasting a hammer in a linear motion along a cylinder using a preset initial pneumatic pressure was developed. This hammer can be rotated up to ±18 degrees along the perimeter of the cross-section of the rotor. Its repeatability was examined by comparing the sizes of dents from multiple sets of hammer peening without overlaps on a simple rotor. Thus, it can perform hammer peening in multiple locations without rotating the rotor. This entire machine can also be shifted along the axis of the rotor. For a repeatable hammer peening procedure, a controlled hammer peening machine was developed. Similarly, Bleicher et al. [18] presented a controlled hammer peening machine for the surface modification of mechanical parts. Hacini et al. [17] also developed a robotized hammer peening machine to relieve high-tensile residual stress in welded components.

2.2. Parametric Simulations of Hammer Peening Process

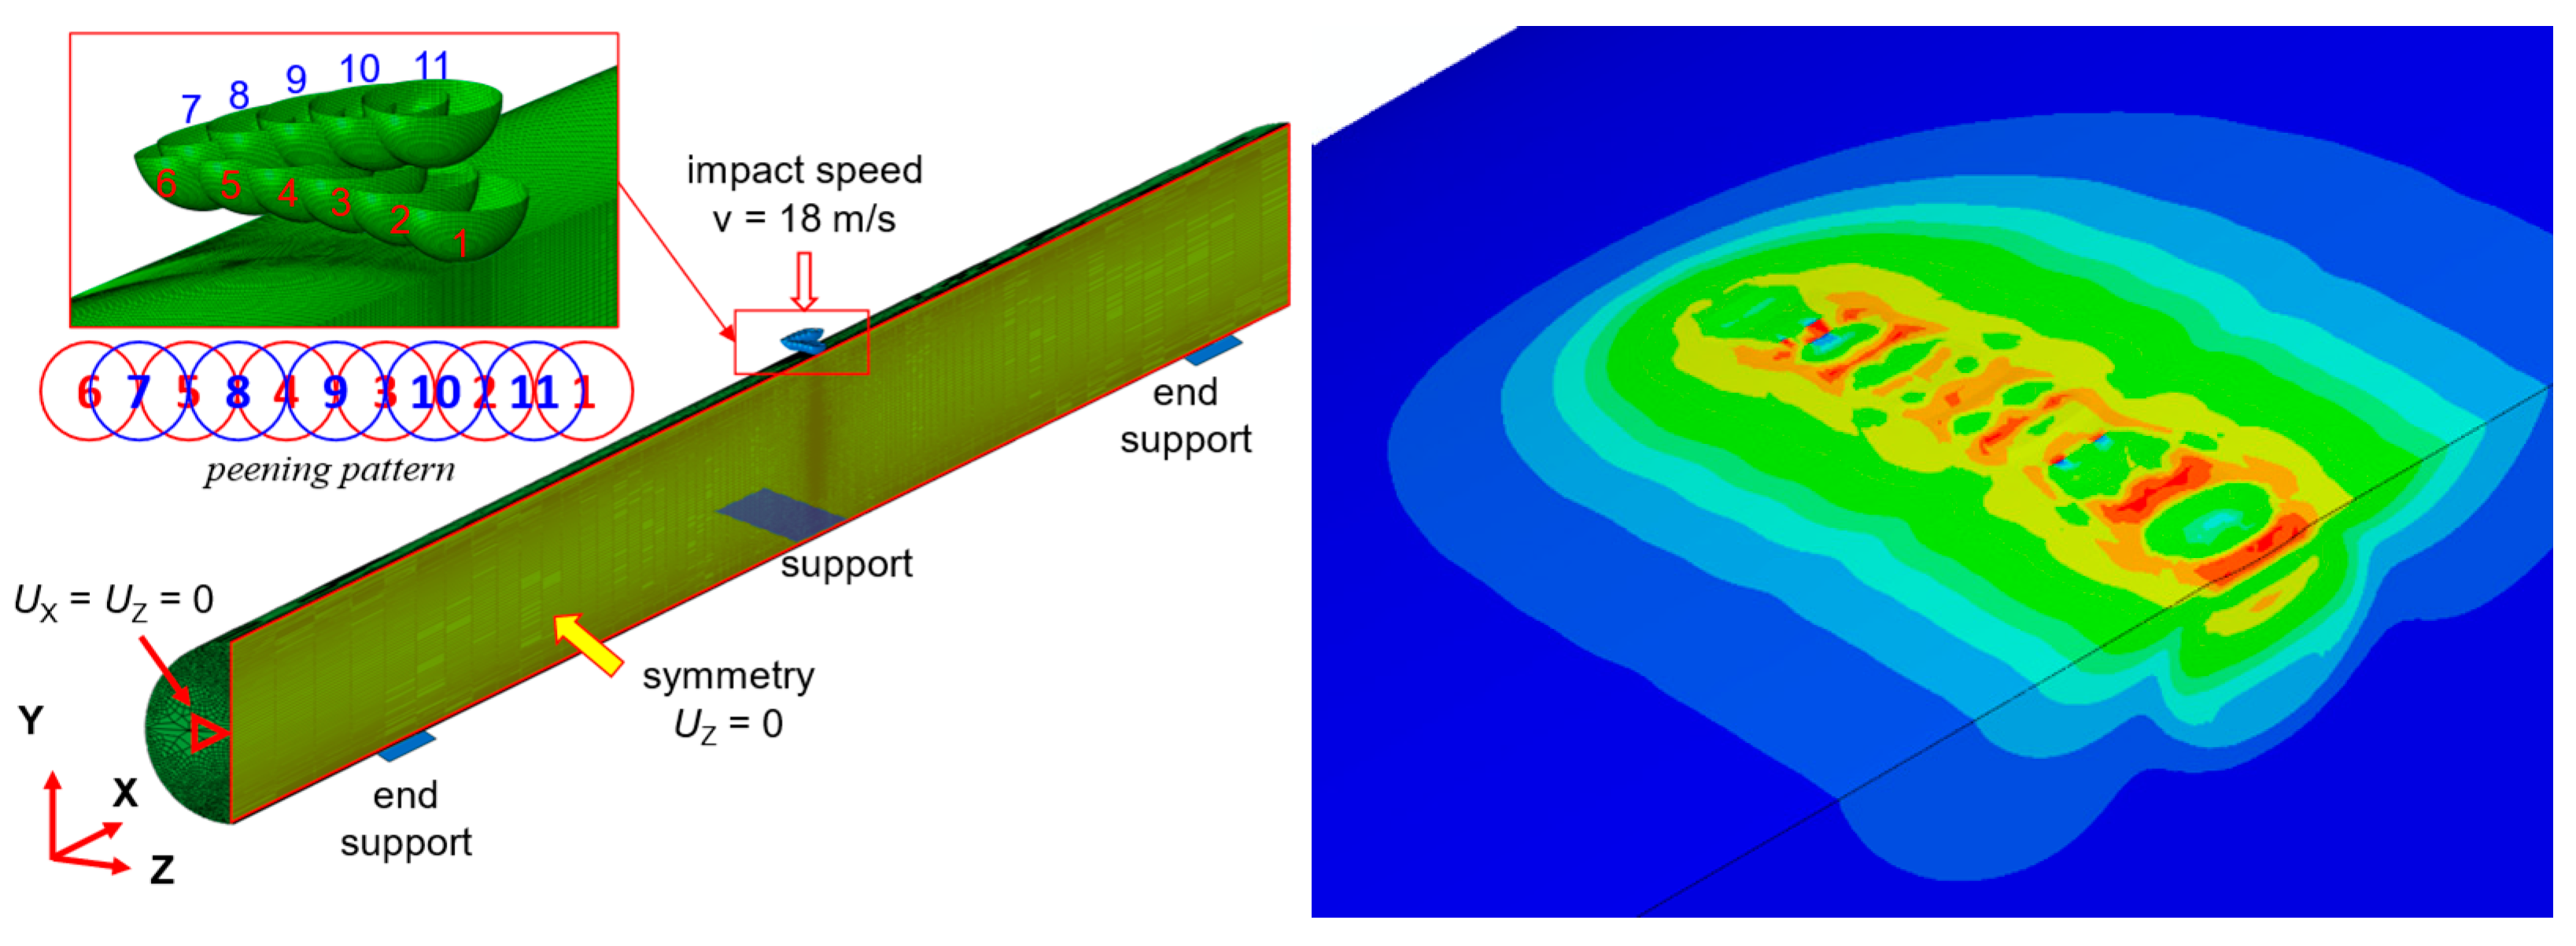
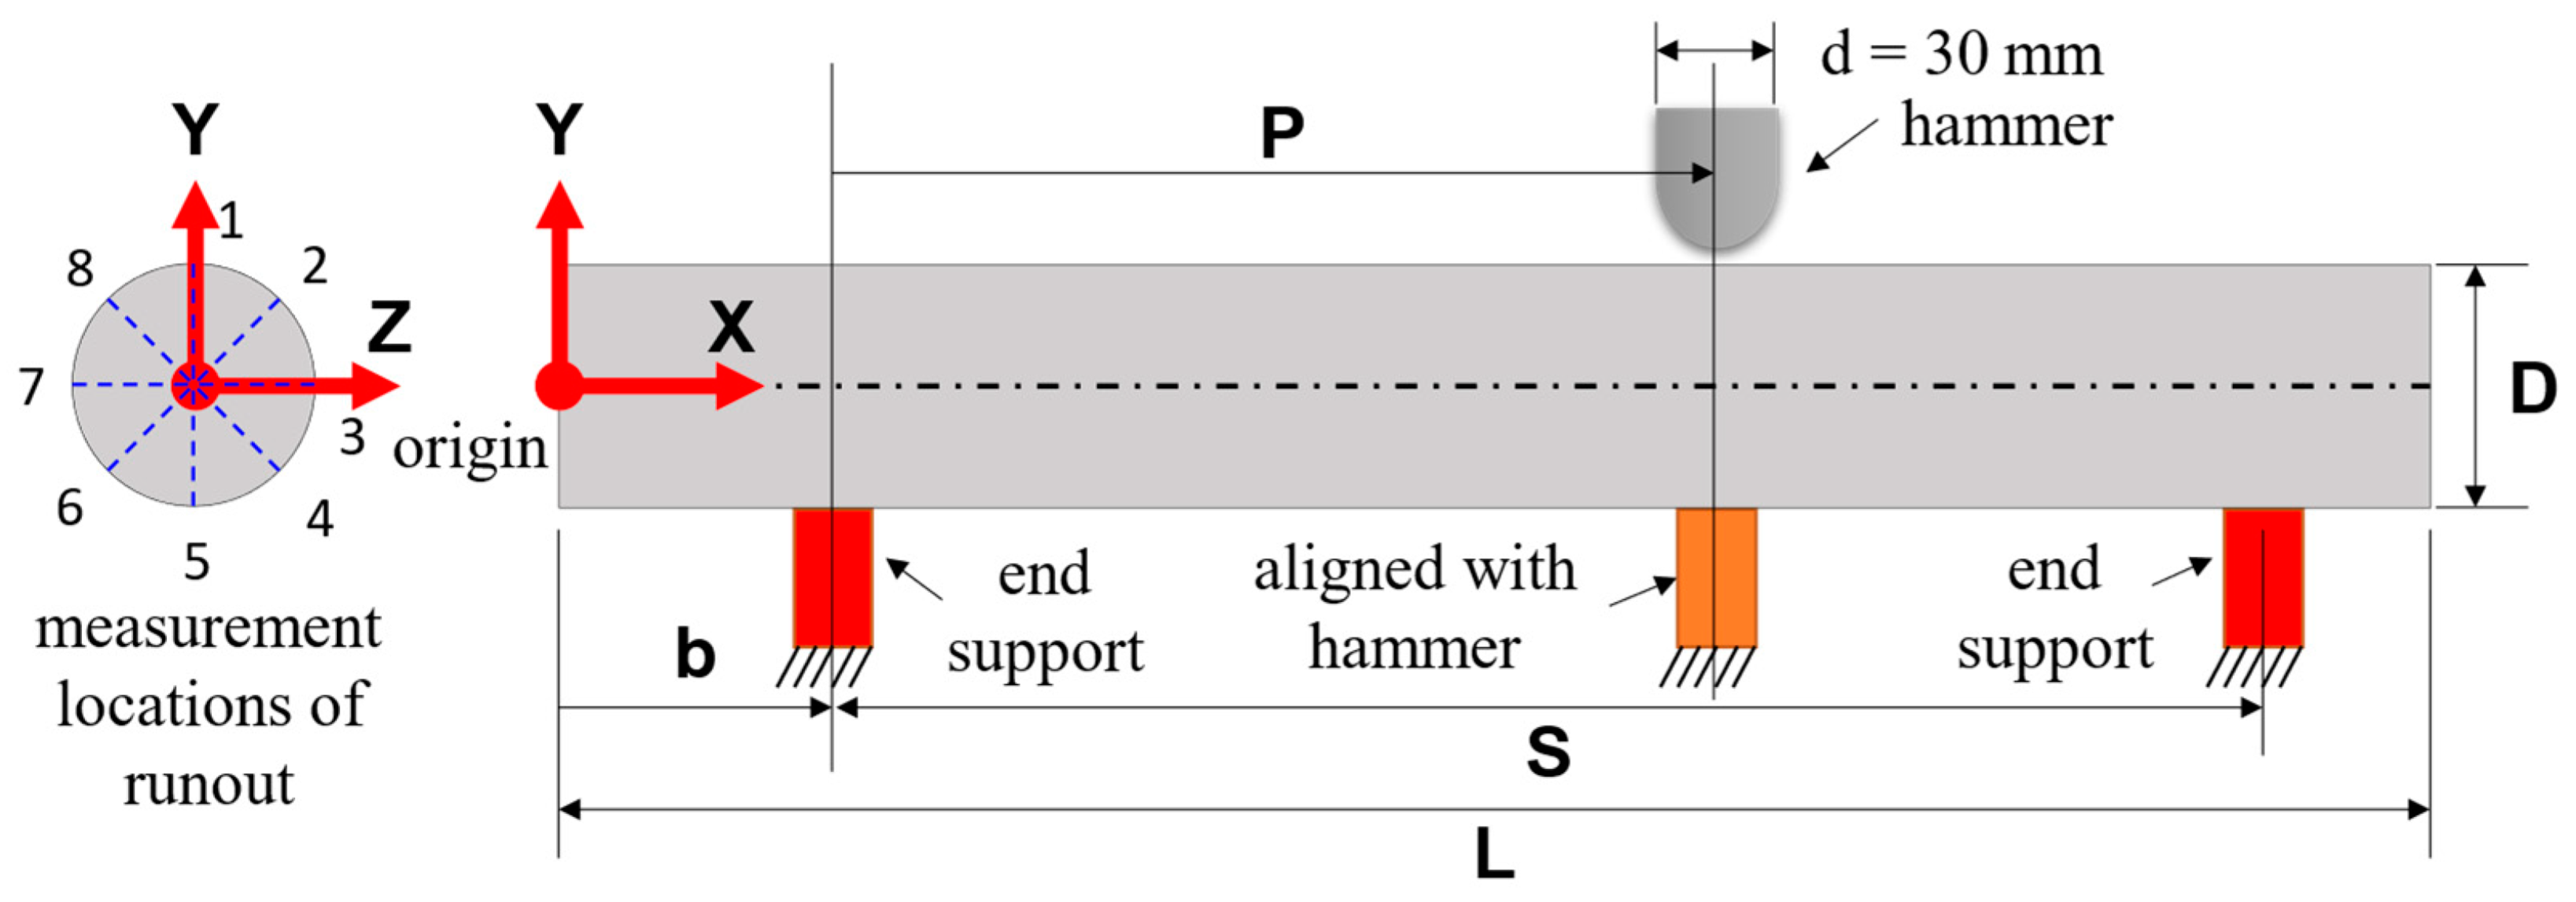
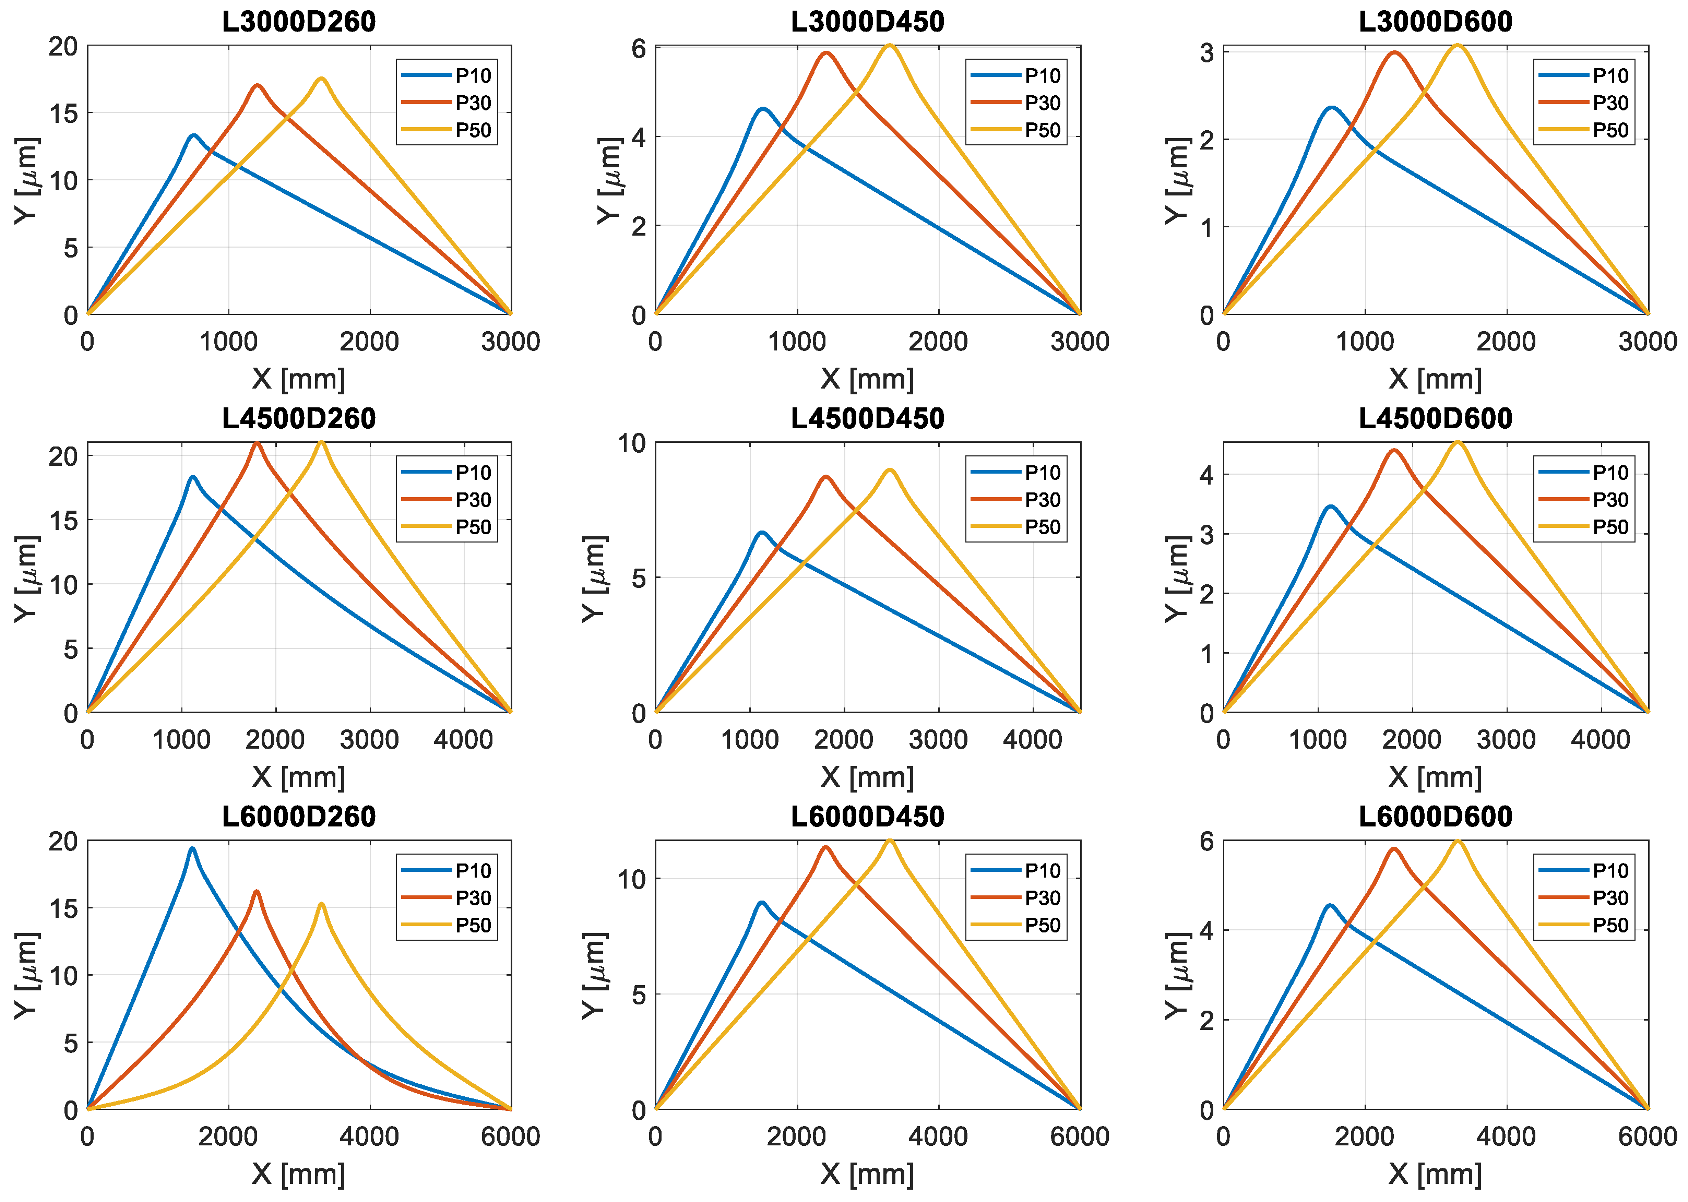
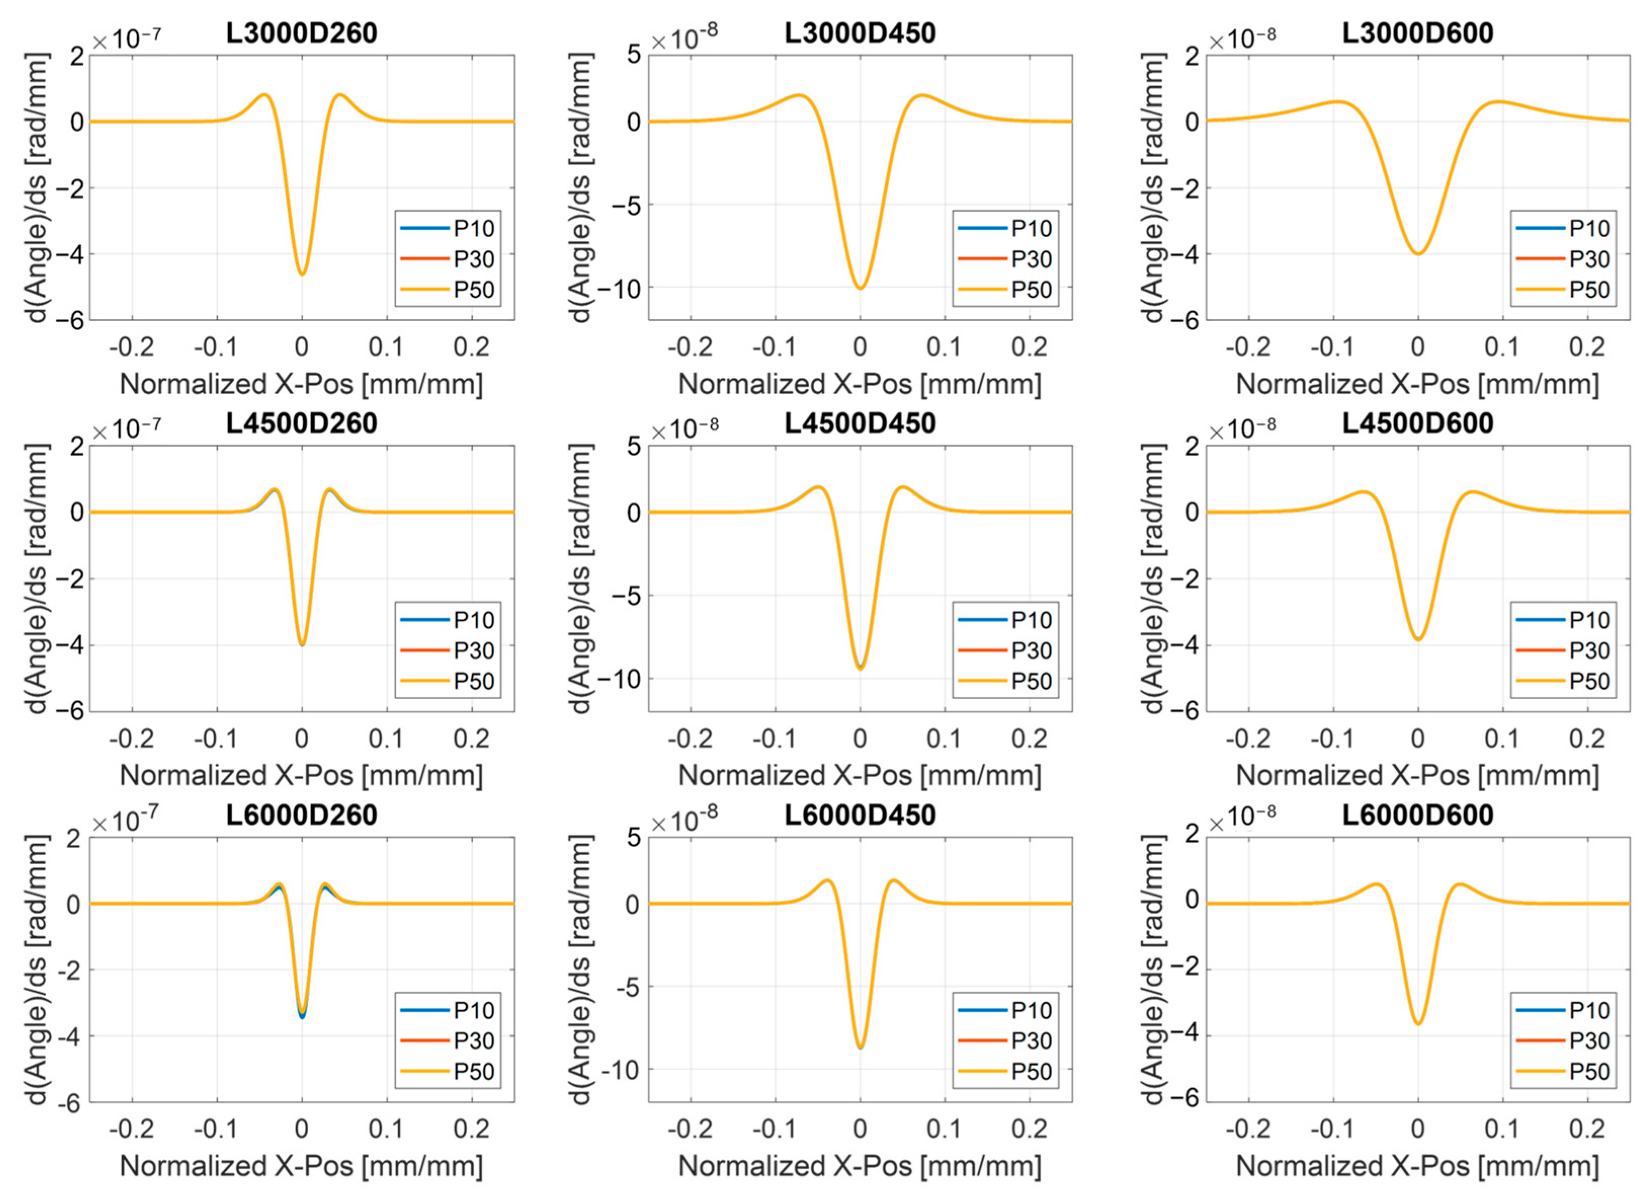
2.2.1. Single-Line Impact Simulation

A set of parametric hammer peening simulations were performed with the ABAQUS/Explicit solver using *DYNAMIC keyword, mimicking the repeatable hammer peening machine using a commercial finite element analysis software, ABAQUS 2018 (Dassault Systèmes Simulia Corp, Providence, RI, USA). The rotor was modeled as a half simple straight shaft with symmetry conditions on the XY-plane (Figure 2). The rotor was supported by two V-shaped supports around both ends and one bottom support at the impact location. Eleven rigid hammers, equivalent to 21 hammers considering the symmetry condition, were modeled as an analytical surface of a half-sphere with a diameter of 30 mm, adding a point mass at its center of gravity. Note that the hammers were numbered according to the order of impacts. The mass of hammer 1 was defined as 131 g and the mass of the rest of the hammers was defined as 262 g. The angle between the impact directions of the adjacent hammers, e.g., hammers 1 and 11, was 1.5 degrees. Each hammer impacted the rotor with an initial speed of 18 m/s, which was determined by matching the size of the dent from the experiment and that from the simulation. Figure 3 compares the diameter of the dent from the experiment and the hammer peening simulation with a single hammer. The rotational inertia of each hammer was ignored since its rotational degrees of freedom were constrained. The rotor was made of elastoplastic hardening materials determined from tensile tests (Table 1). The rotor was modeled as isotropic hardening material using the *PLASTIC keyword in Abaqus without any rate dependence (Figure 4). The stress-strain curve was obtained from uniaxial coupon tests. The simulation was performed in two steps. The 11 hammers sequentially hit the rotor at the initial velocity and on the initial positions during the first 0.03 s. No mass scaling methods were utilized so that the impact energy was not altered during this time. During the next 0.97 s when the rotor was allowed to freely deform, mass scaling was utilized to limit the minimum time step to 1 µs to save computation time. A penalty contact method was used to model the interaction between the hammer and the rotor. The friction coefficient between the hammer and the rotor was set to 0.3. In addition, Rayleigh mass proportional material damping was used with a damping ratio of 0.5 based on the study of Kim et al. (2011) [19].
For the parametric simulations, the ranges of the dimensions for the parametric rotors, such as lengths and diameters, were determined based on the gas turbine rotors commonly used in power plants (Table 2). A total of 27 hammer peening simulations were performed for the three parameters at three levels (Figure 5). For each simulation, the deformed coordinates of the rotor axis were obtained.

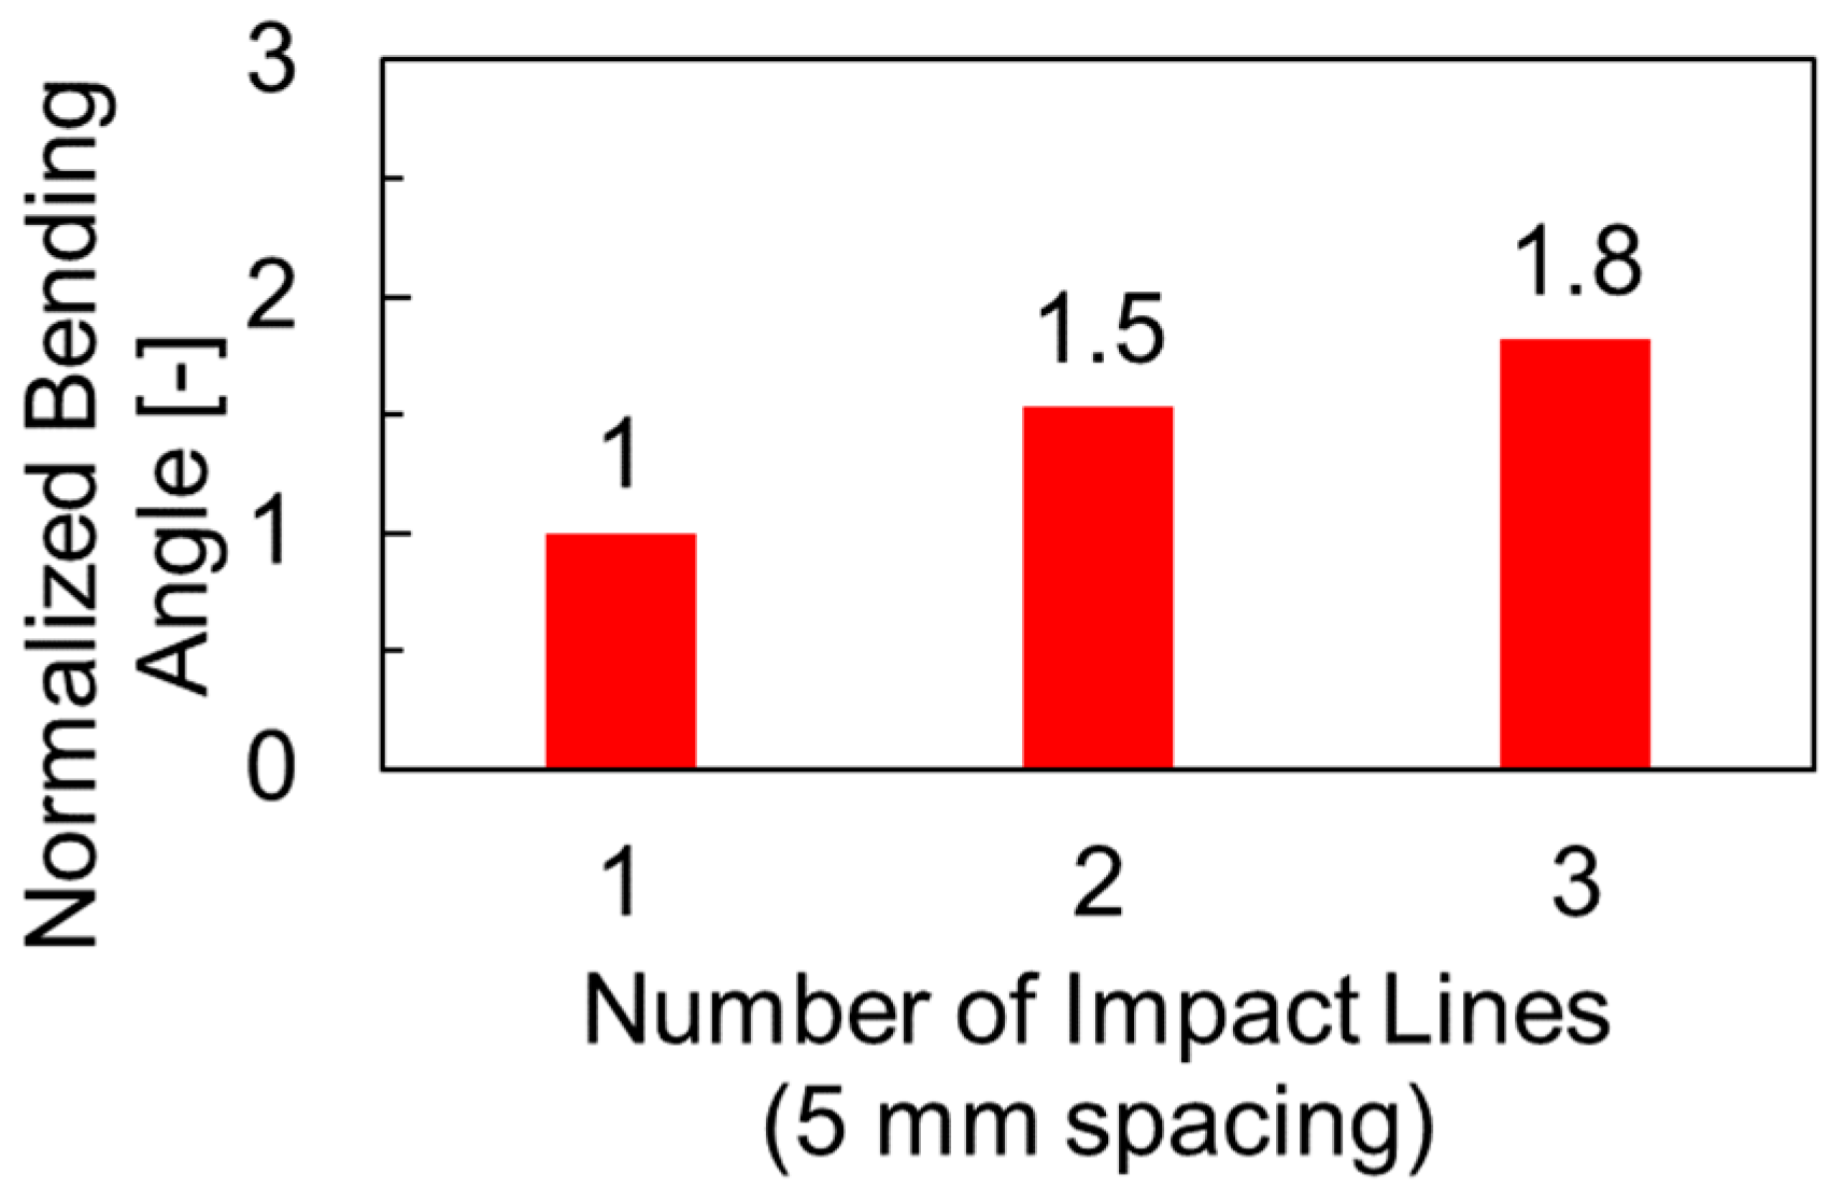
2.2.2. Multiple-Line Impacts

A set of multiple-line impact simulations were performed using the same method for the single-line impact to assess the effect of residual stress on the induced curvature during subsequent hammer peening (Table 3). The effect of residual stress on the curvature was evaluated by comparing angle changes between both ends of the rotor (also called a bending angle).

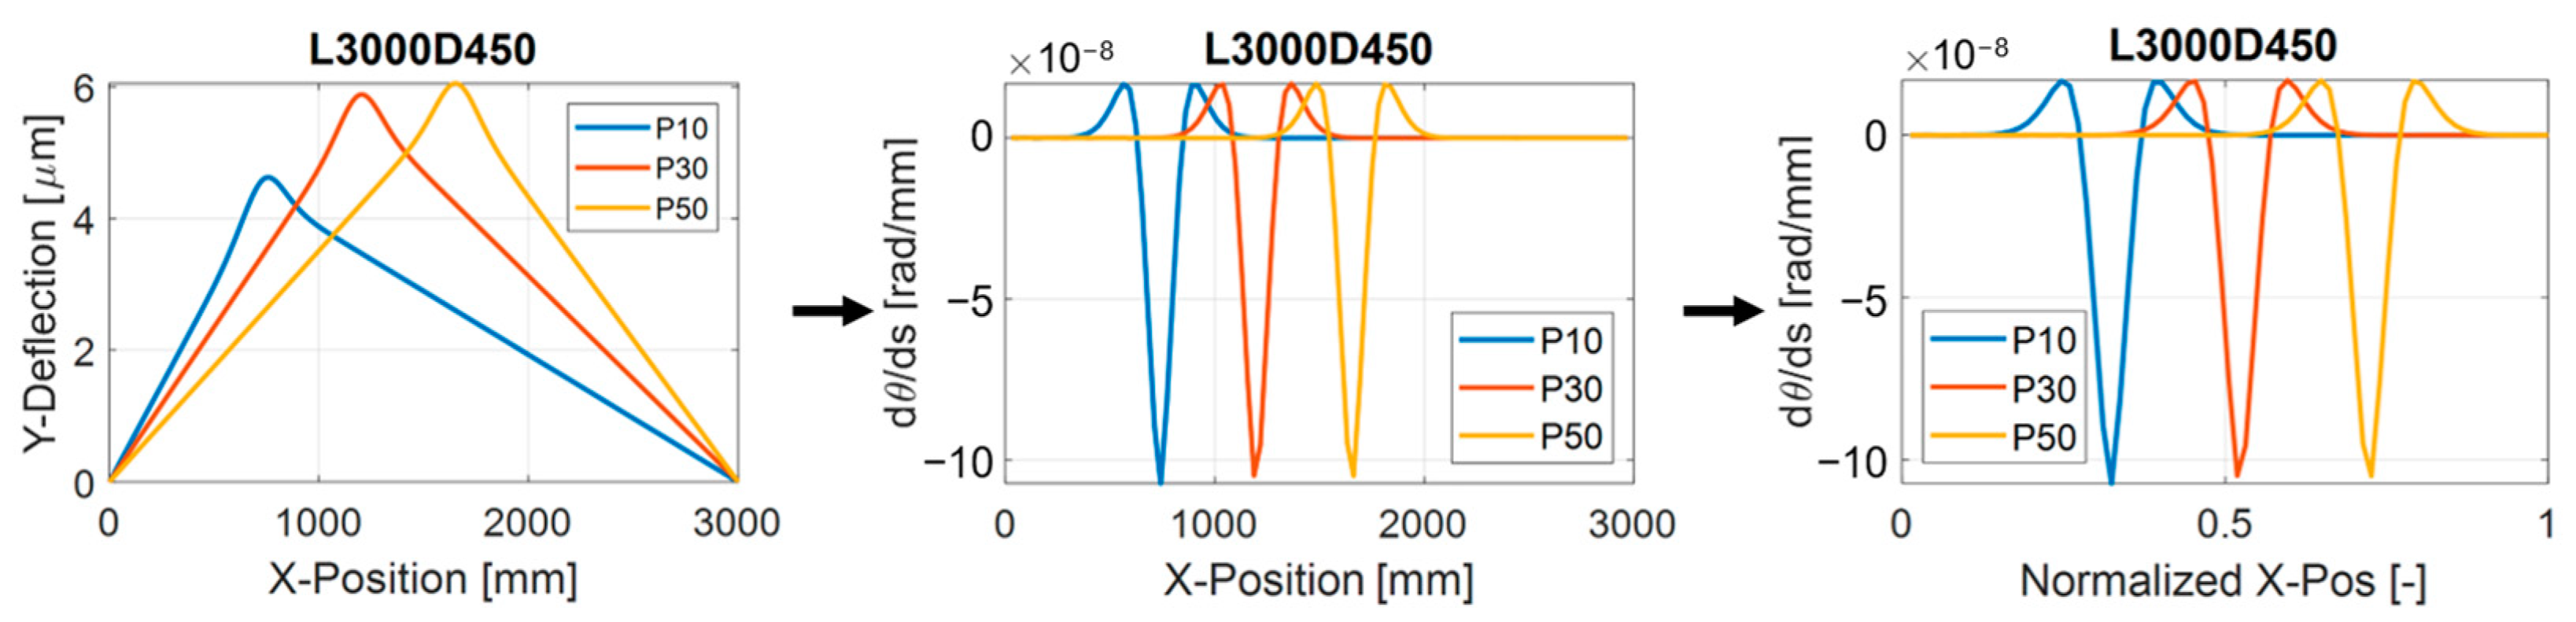
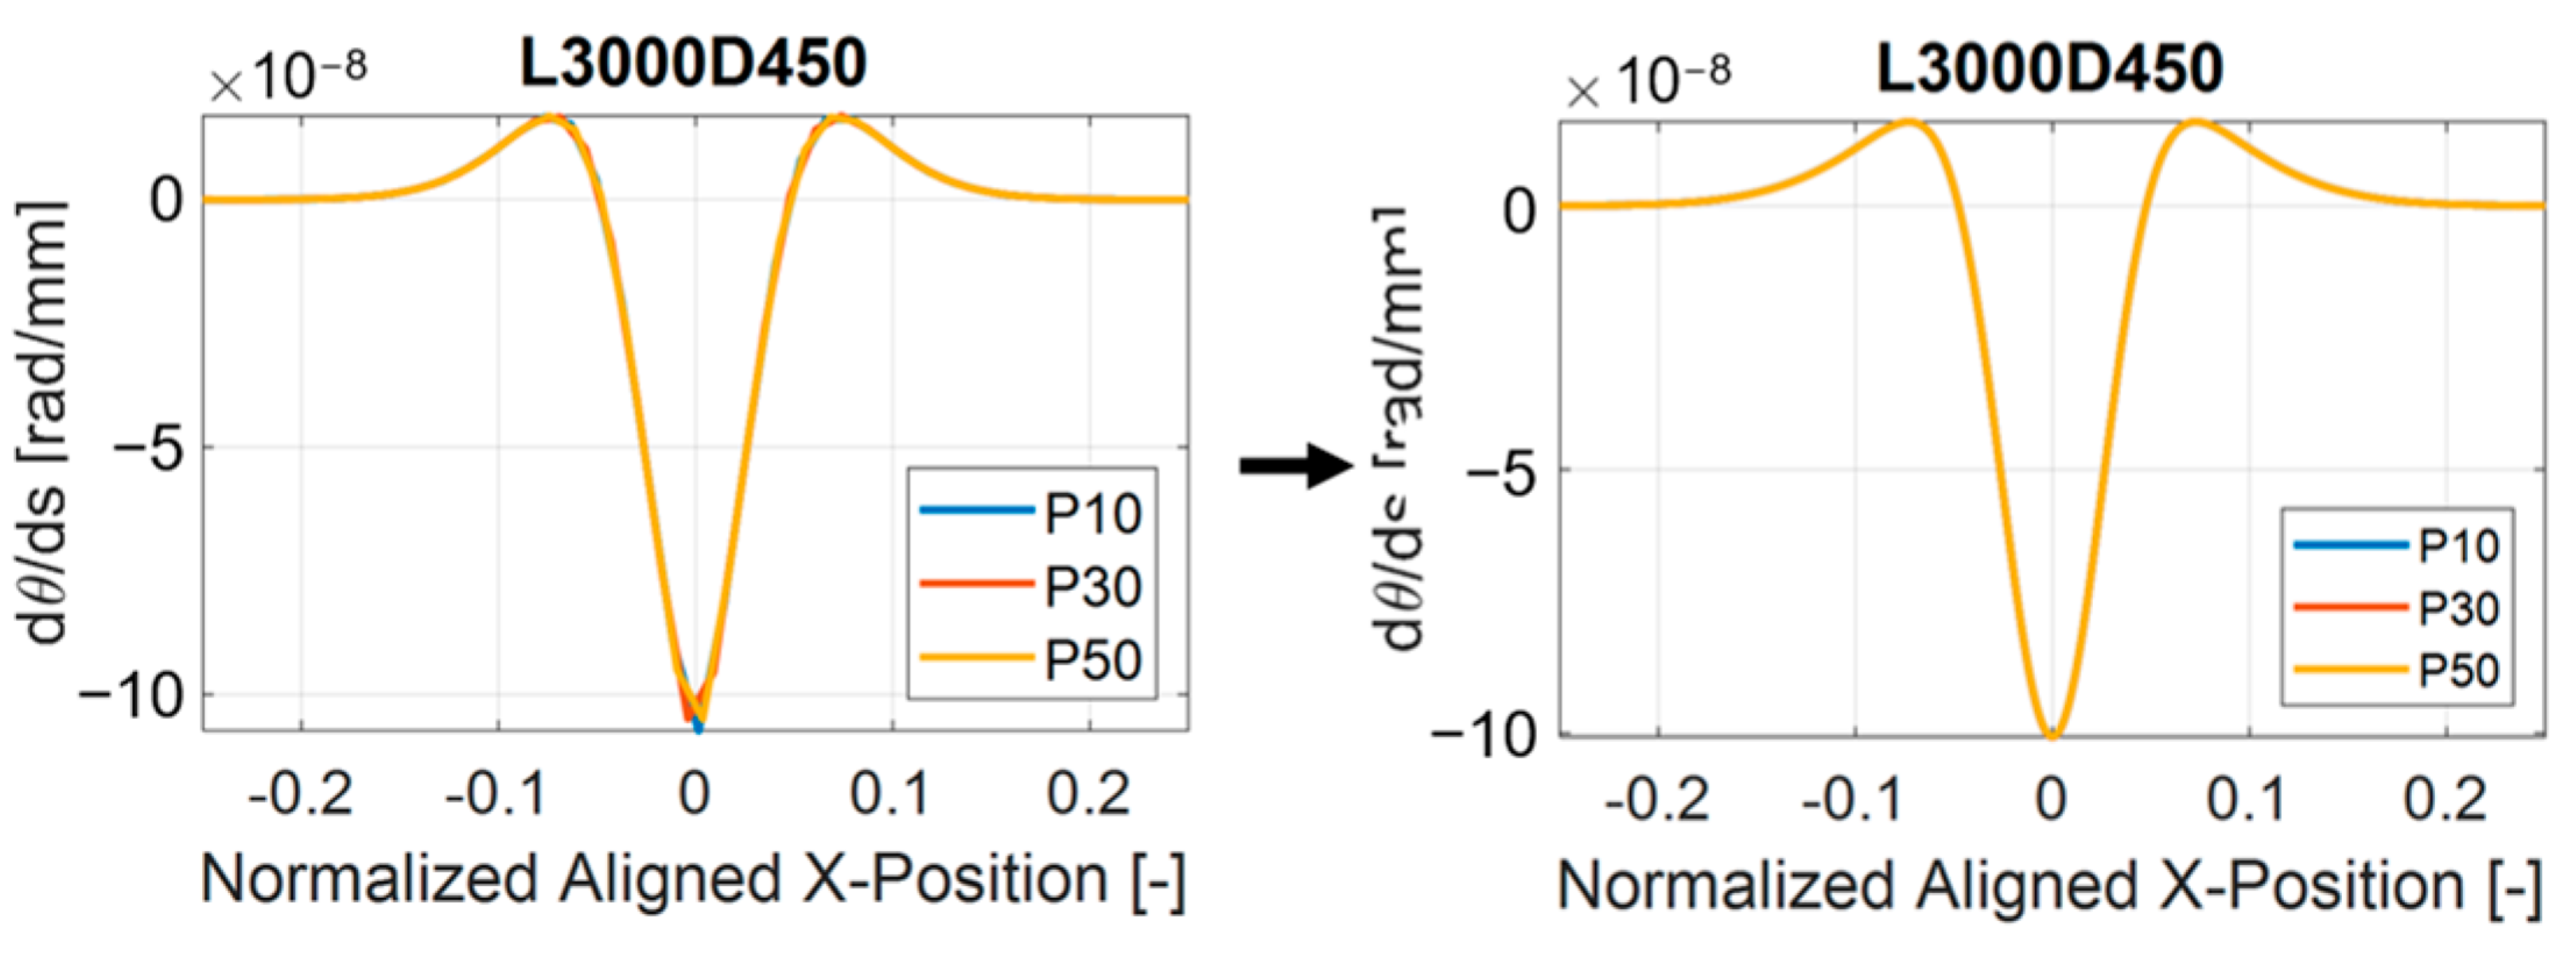
2.3. Representation of Rotor Geometry Using Curvature Vector along the Centerline of Rotor

Deformation of the rotor centerline was presented using a curvature vector in the local coordinate systems of each point along the centerline (Figure 6). Note that the torsional deformation of the rotor was ignored. First, two relative position vectors, v i 1 and v i , between adjacent points were calculated for three consecutive points, Pi−1, Pi, and Pi+1. Note that the coordinates of these three points were in the global coordinate system. Second, the bending angle was calculated as the angle between v i 1 and v i . Third, the unit curvature vector representing the direction of the bending of the rotor at P i was calculated using the cross product and its Euclidean norm. Lastly, the local coordinate system of Pi was rotated from that of Pi−1 based on the bending angle, θ , and the unit curvature vector, n k , i . The bending angle was normalized by the distance between Pi−1 and Pi. The representation of the unit curvature vector with respect to the local coordinate systems of each point was performed for interpolation purposes in the later optimization step. For superimposition purposes, the unit curvature vector was transformed into the local coordinate system of Pi, and the bending angle was normalized by the interval length. Seong and Na [20] have also presented the deformation of a plate using a method that is similar to that used in the current study.
The curvature vectors along the length of the rotor were parameterized for interpolation purposes during optimization (Figure 7 and Figure 8). The length information in curvature vectors was normalized by the length of the rotor so that it ranged from 0 to 1. The curvature with respect to the normalized length was then shifted in the x-axis so that the impacted location (P in Figure 5) lay at zero on the x-axis. Lastly, the curvature was fitted using a parameterized empirical function consisting of two gaussian function terms (Equation (1)). Note that the rotor model bent only along the z-axis because of the symmetry condition. However, the initial curvature of a given rotor would have both y and z components.
y = A e α ( x x s ) 2 + B e β ( x x s ) 2  
where
A , B :   scale   factors
α , β :   shape   factors
x s :   shift   factor

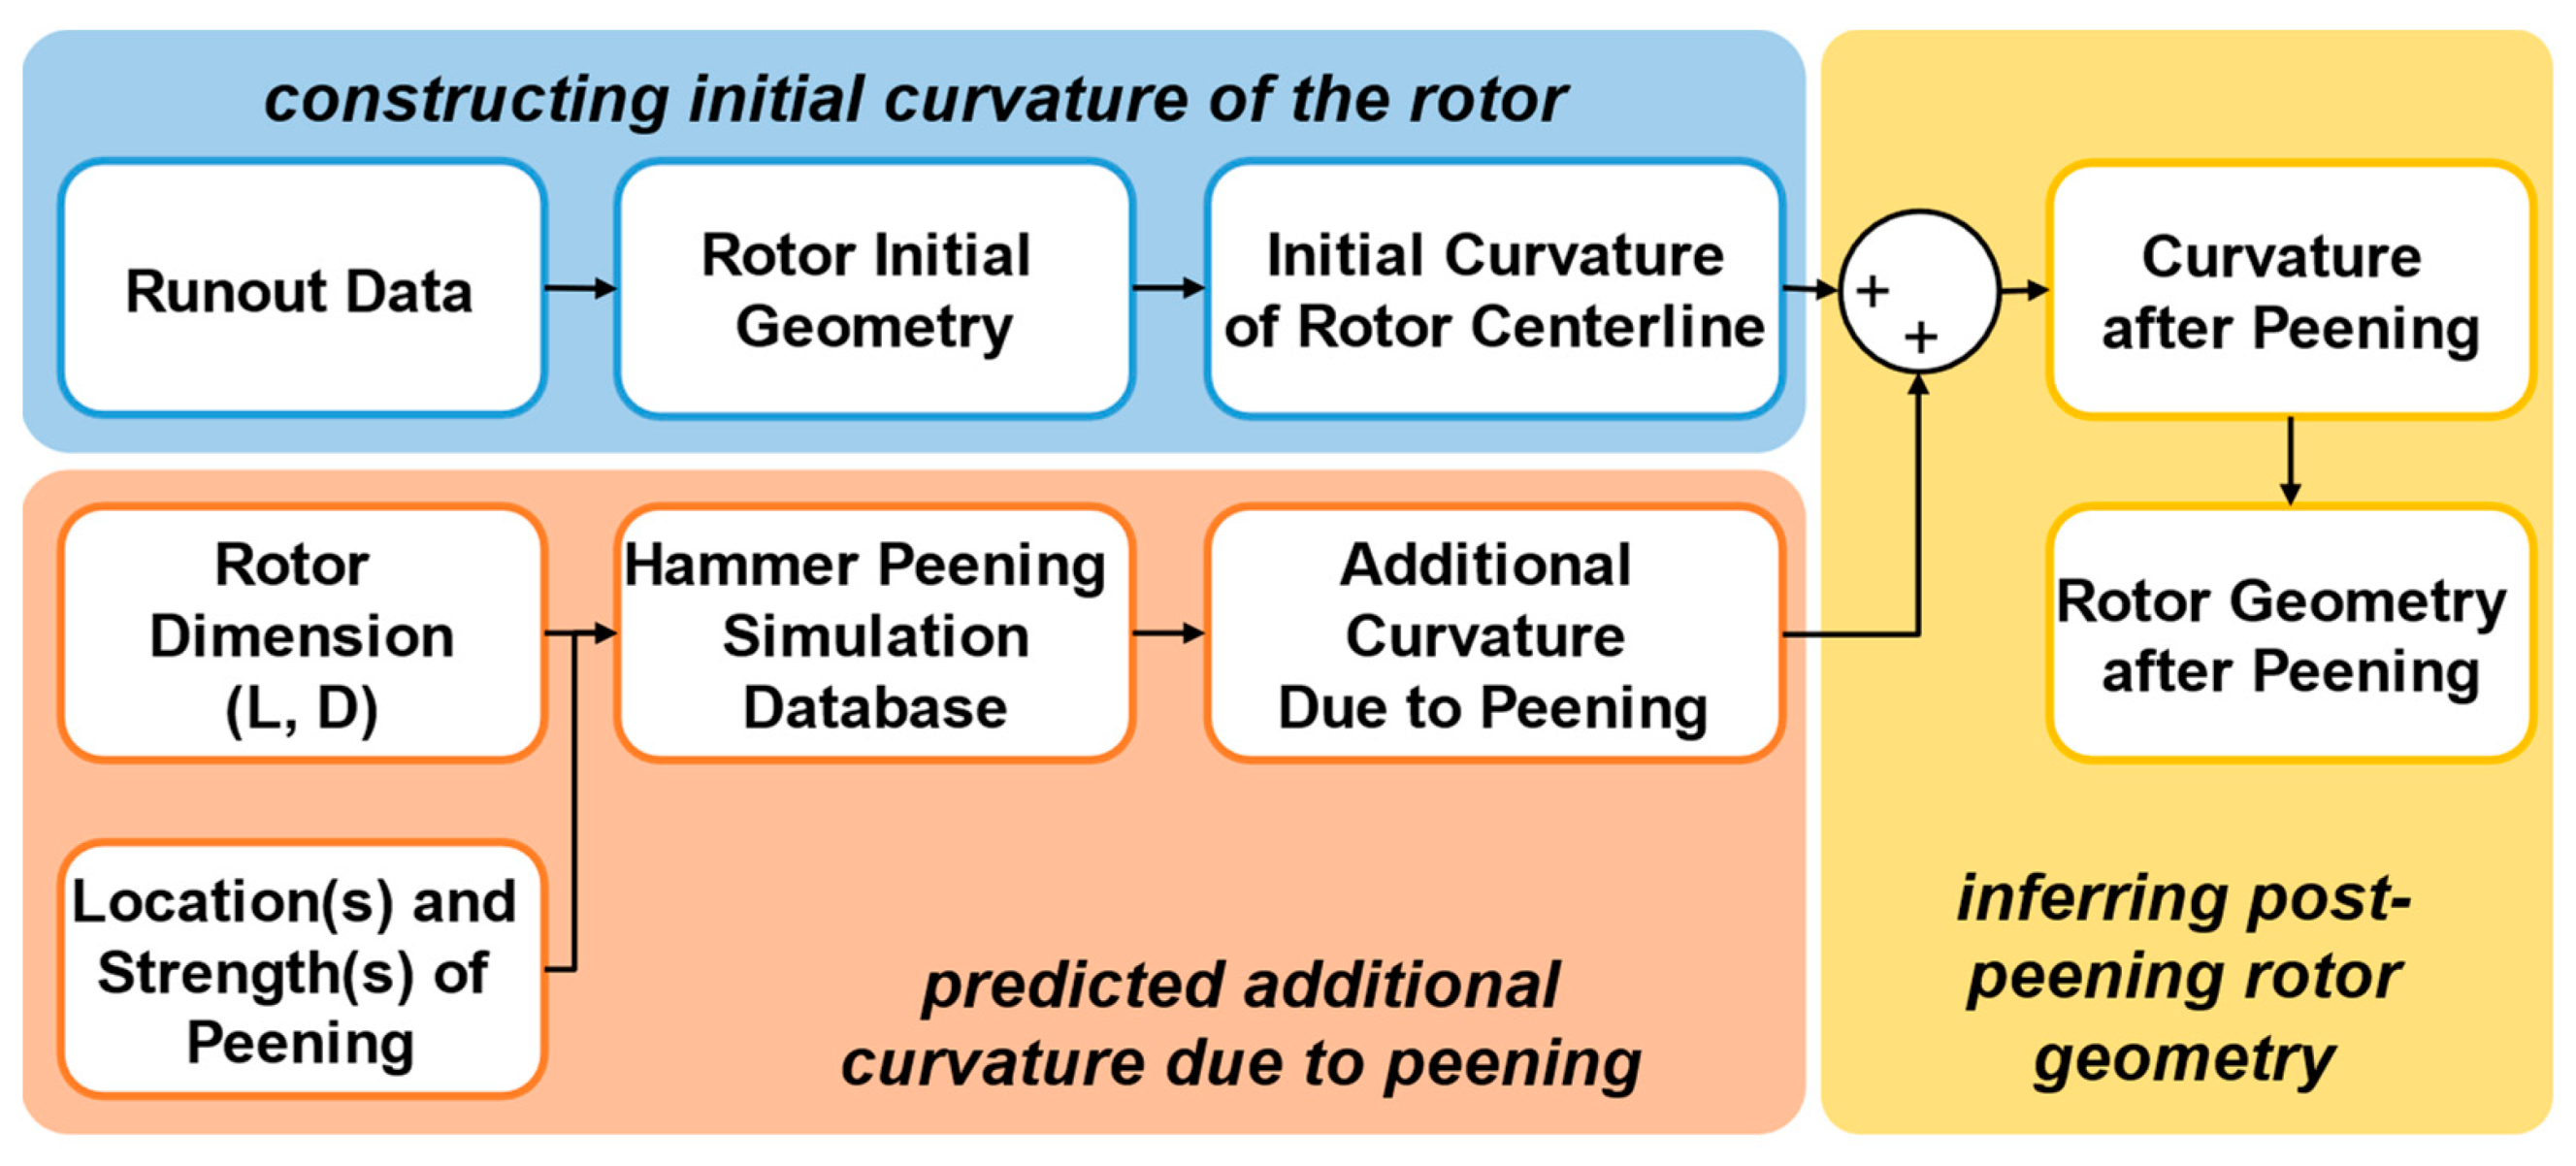
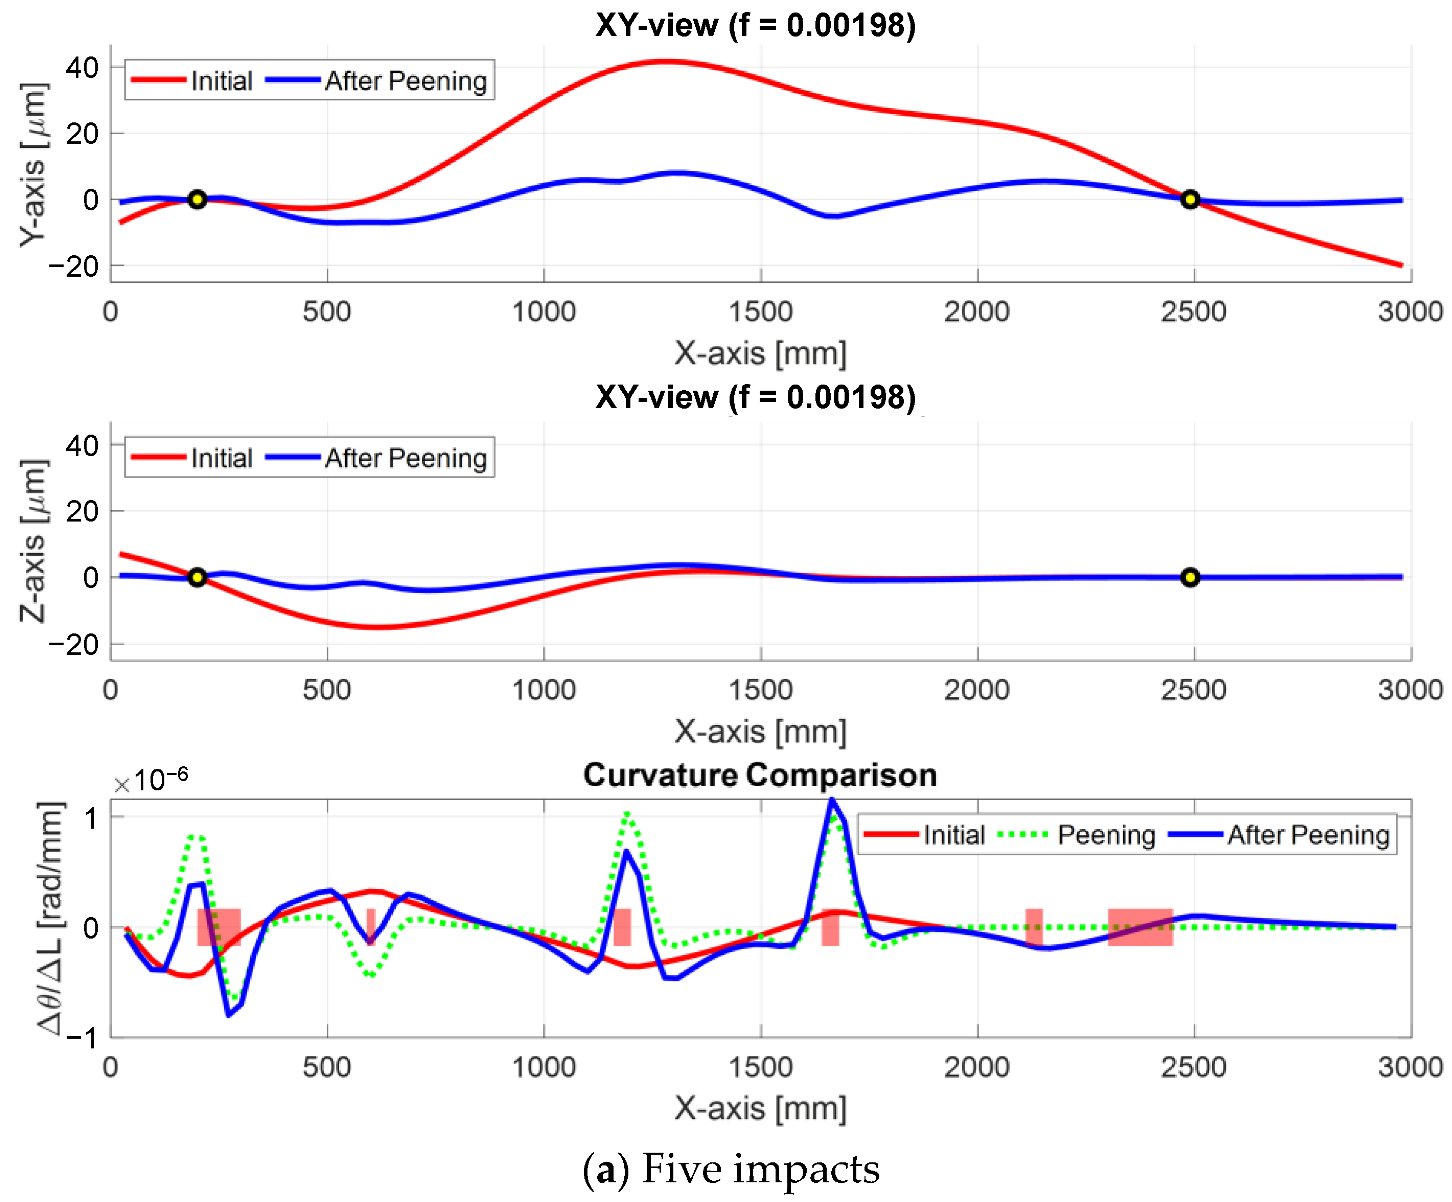
2.4. Prediction of Rotor Geometry after Hammer Peening

The prediction of the post-peening rotor geometry consists of three parts: constructing the initial curvature of the rotor, predicting additional curvature of the rotor due to peening, and inferring rotor geometry after peening (Figure 9). First, the initial geometry of a rotor was constructed based on the runout data (Figure 10). The center location of the rotor was approximated from eight measurement data per cross-section. The centerline of the rotor was interpolated using the interp1 function in Matlab R2018b (The MathWorks, Inc., Natick, MA, USA) with a spline option, which guaranteed C2 continuity. The initial curvature was calculated with respect to the local coordinate system at each point of the fitted centerline. Second, baseline curvature vectors, which corresponded to the impact strength of one, were predicted by interpolating parameters of empirical functions for the given rotor dimensions and hammer peening locations along the centerline (Figure 8 and Equation (2)). The baseline curvature vectors were rotated along the x-axis for the impact direction. Additionally, induced curvatures, which are represented as the dotted lines in Figure 10, were predicted by scaling the rotated baseline curvature according to the peening strength. A strength of less than one represented a single-line impact and a strength greater than one represented a multiple-line impact (Equation (1)). Third, the post-peening geometry of the rotor was predicted by superimposing the initial curvatures and additionally induced curvatures. Based on the superimposed curvatures, the three-dimensional geometry of the centerline of the rotor was reconstructed. Lastly, the post-peening geometry in 3D coordinates was obtained from the post-peening curvatures.
w = { S 1 + 0.5 ( S 1 ) 1.5 + 0.3 ( S 2 ) i f   0 S < 1 i f   1 S < 2 i f   2 S < 3

2.5. Statement of Optimization Problem

Based on the framework for predicting the post-peening geometry of the rotor, an optimization problem was constructed considering the limitations of the impactable areas on the rotor (Table 4). The cost function was the mean square error of the deviation of the rotor centerline from the x-axis after a given hammer peening plan. The domain for the impact location was reduced to the impactable location. The minimum distance between any two adjacent impacting locations was set to be greater than 30 mm. The maximum strength of the hammer peening was limited to three. The MultiStart function provided by Matlab R2018b (MathWorks, Natick, MA, USA) was used to avoid local minimum problems [21]. The MultiStart method considers multiple starting points for the fmincon function, which is a gradient-based search algorithm for a constrained optimization problem provided by Matlab. In the current study, ten starting points were used.

2.6. Application of the Proposed Method
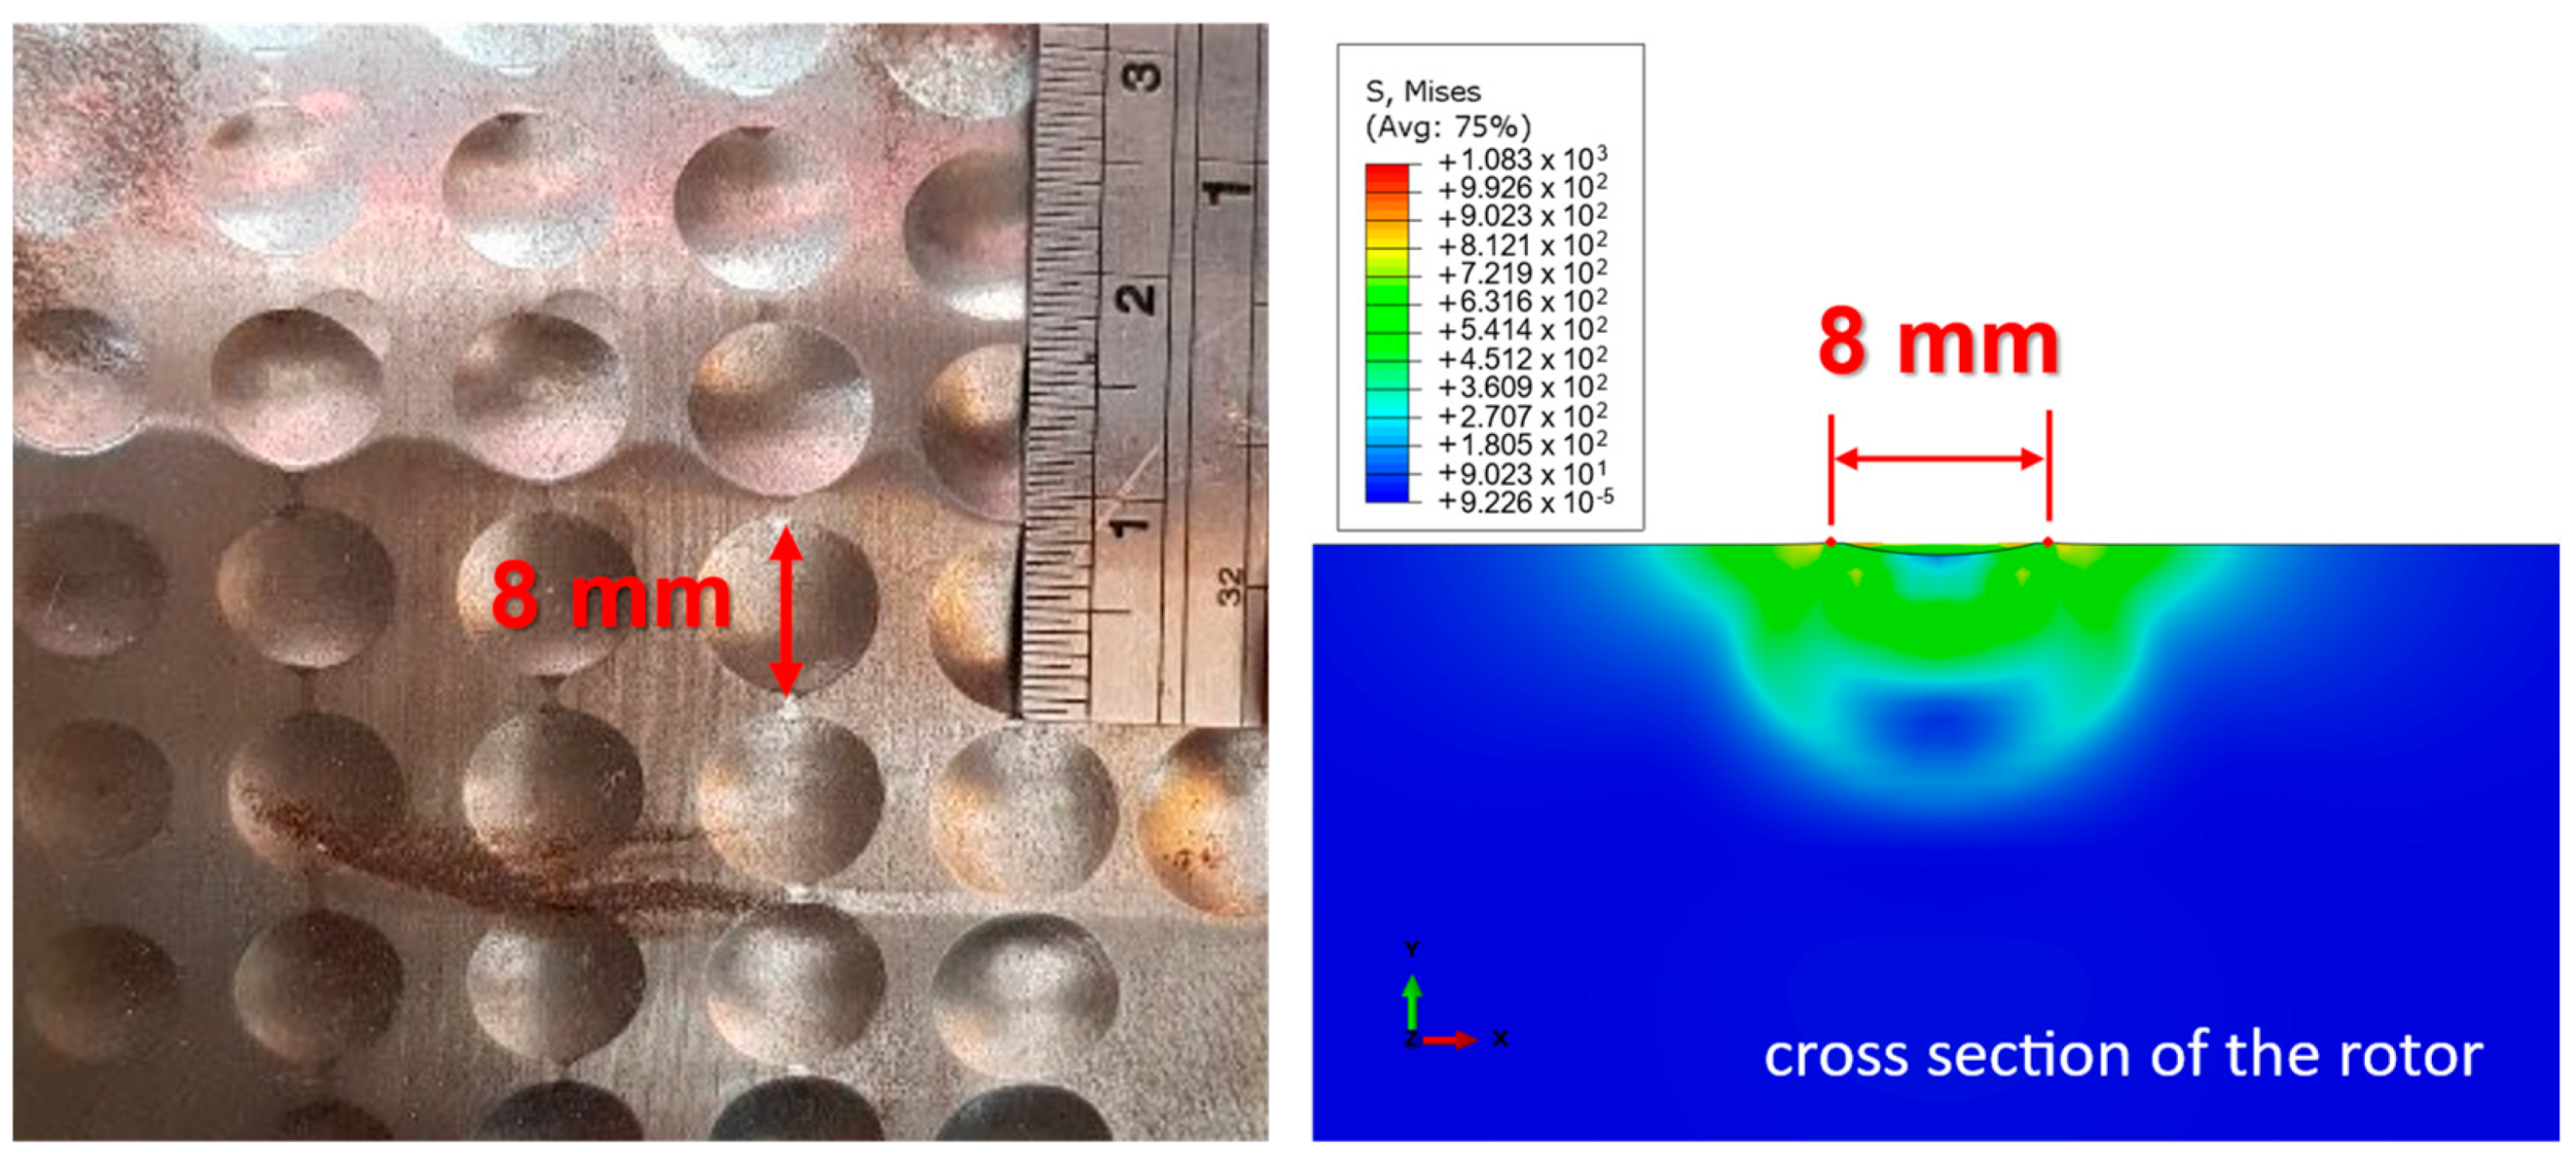
The proposed optimization framework was applied to runout data from a simple shaft with a length of 3000 mm and a diameter of 260 mm (Figure 6). Note that it was assumed that end supports were located at 200 mm and 2450 mm. Two impacting locations (M in Table 4), which were five and ten, were used to compare the effect of the number of hammer peening trials on the expected degrees of corrections. Although there were non-impactable areas such as blades, six intervals were defined as impactable areas to be more realistic. The maximum strength of the hammer peening (Smax) of each location was limited to three, representing three lines of hammer peening for 15 degrees along the perimeters.

2.7. Validation

The proposed optimization algorithm was validated against a series of hammer peening tests. The hammer peening plan was obtained using the same runout data used to demonstrate the optimized algorithm. At this time, the impactable area was defined as the interval between the two end supports (Figure 5) instead of the six intervals (Table 5). The predicted post-peening geometries from the optimization algorithm were compared to the measured post-peening geometries from three trials.

3. Results

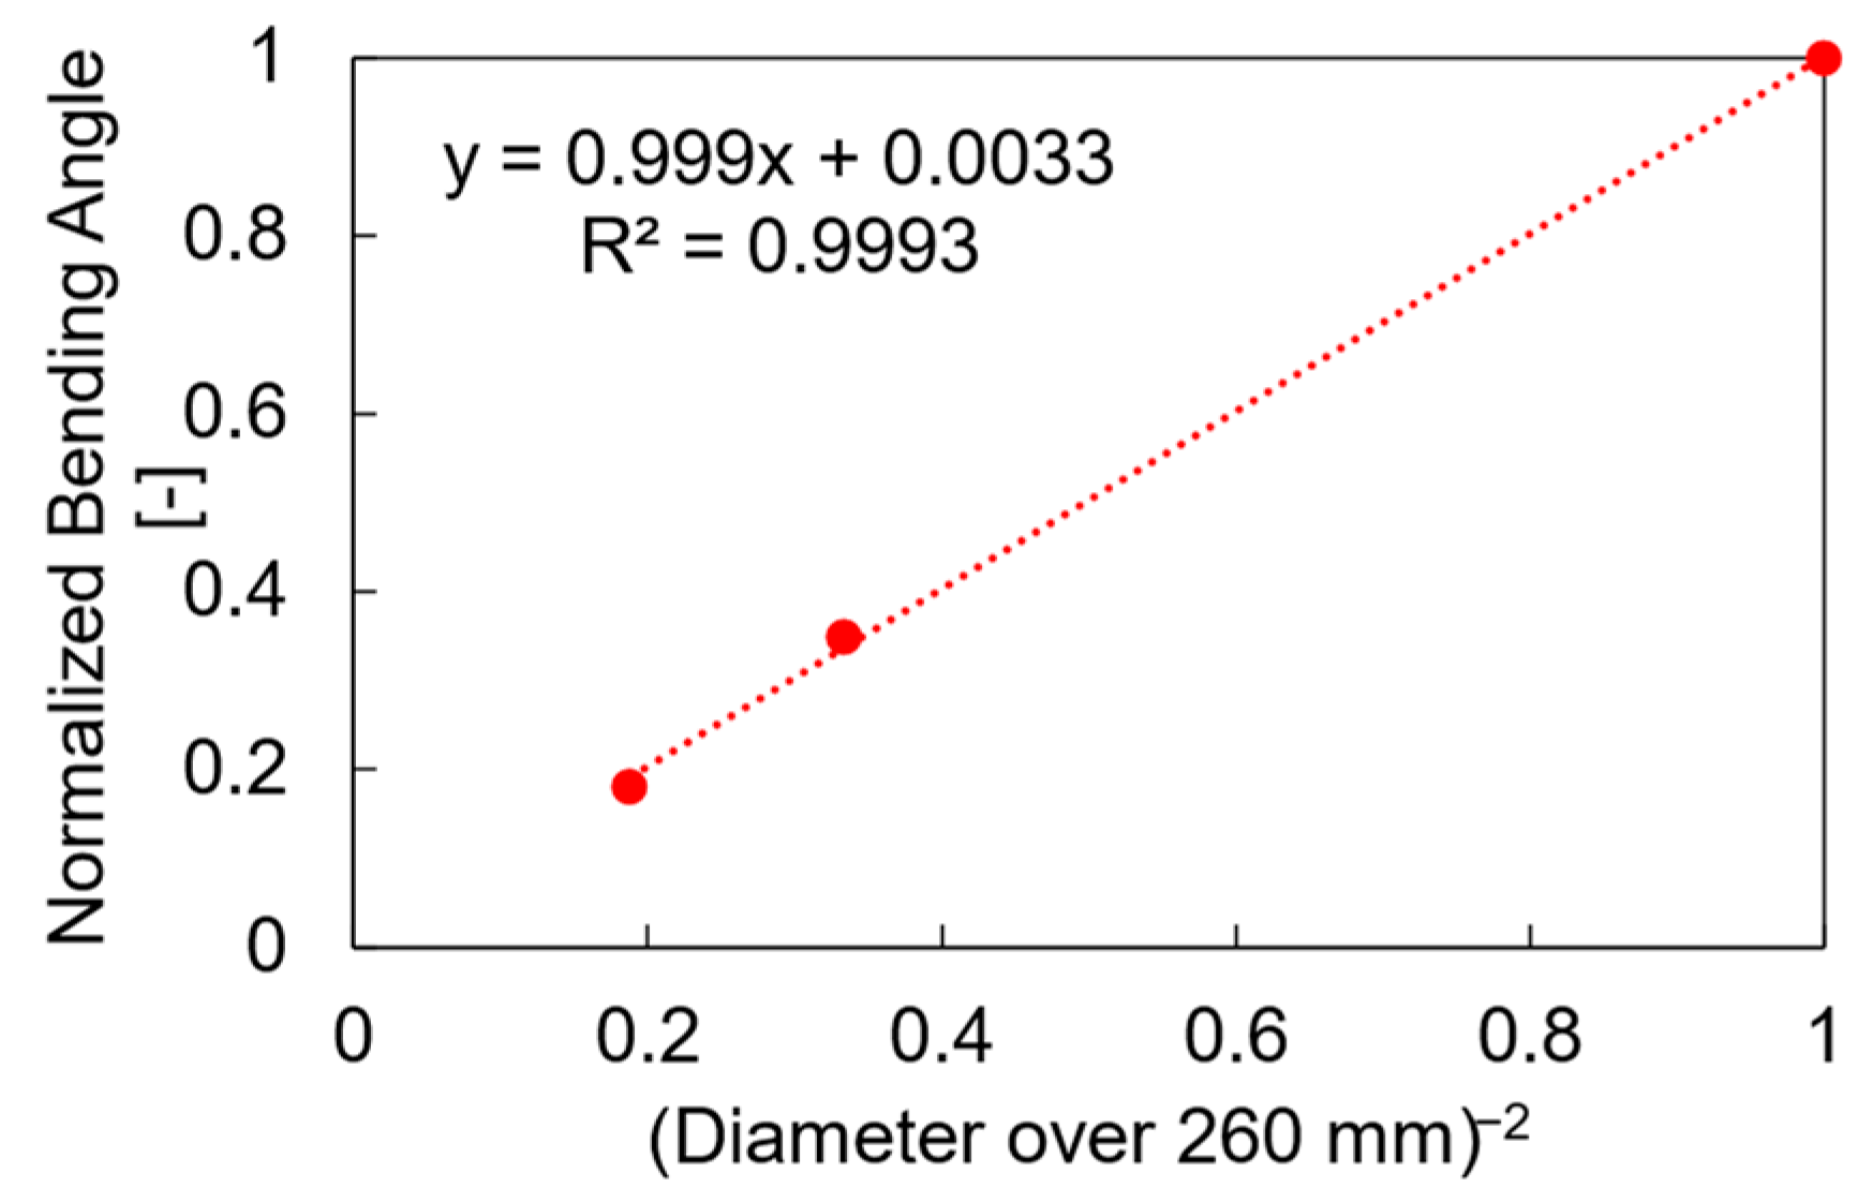
3.1. Parametric Hammer Peening Simulation

Twenty-seven deformed geometries of the rotor centerline were obtained from parametric hammer peening simulations (Figure 11). The normalized and shifted parametric curvature vectors of the rotors were obtained from the geometry information (Equation (1) and Figure 12). Although the maximum deflections differed depending on impact locations (P10, P30, and P50) for a given rotor length with a given diameter, the curvature was insensitive to impact locations.
From the two-line impact simulations, bending angles normalized by that from a single-line impact increased from 1.65 to 1.95 compared to the single-line impact when the spacing increased from 3 mm to 20 mm. The normalized bending angle was insensitive to spacing farther than 20 mm apart (Figure 13). Note that the denominator of the normalized bending angle was the bending angle of a single-line impact. For example, 1.65 meant that there was a 65% increase in the bending angle from a second-line impact compared to that from a single-line impact. For multiple-line impact simulations with 3 mm spacing, second- and third-line impacts induced 50% and 30% of the additional bending angles, respectively, compared to that of a single-line impact. This trend was considered when estimating the additionally induced curvature due to peening (Equation (2)). The normalized angle changes from multiple-line impacts showed that the additional bending angle decreased with an increasing number of lines of impact at adjacent locations (Figure 14).

3.2. Demonstration of the Optimization Algorithm

The proposed optimization problem with five impact locations converged for the given runout data, decreasing the rotor centerline’s maximum deformation from 40 μm to 10 μm (Figure 15). The hatched regions in the curvature comparison represent impactable areas. Note that the algorithm reduced the maximum deviation not only in the XY-plane, but also in the XZ-plane. When the number of impact locations was increased from five to ten, the optimization algorithm predicted improvements in straightening the rotor.

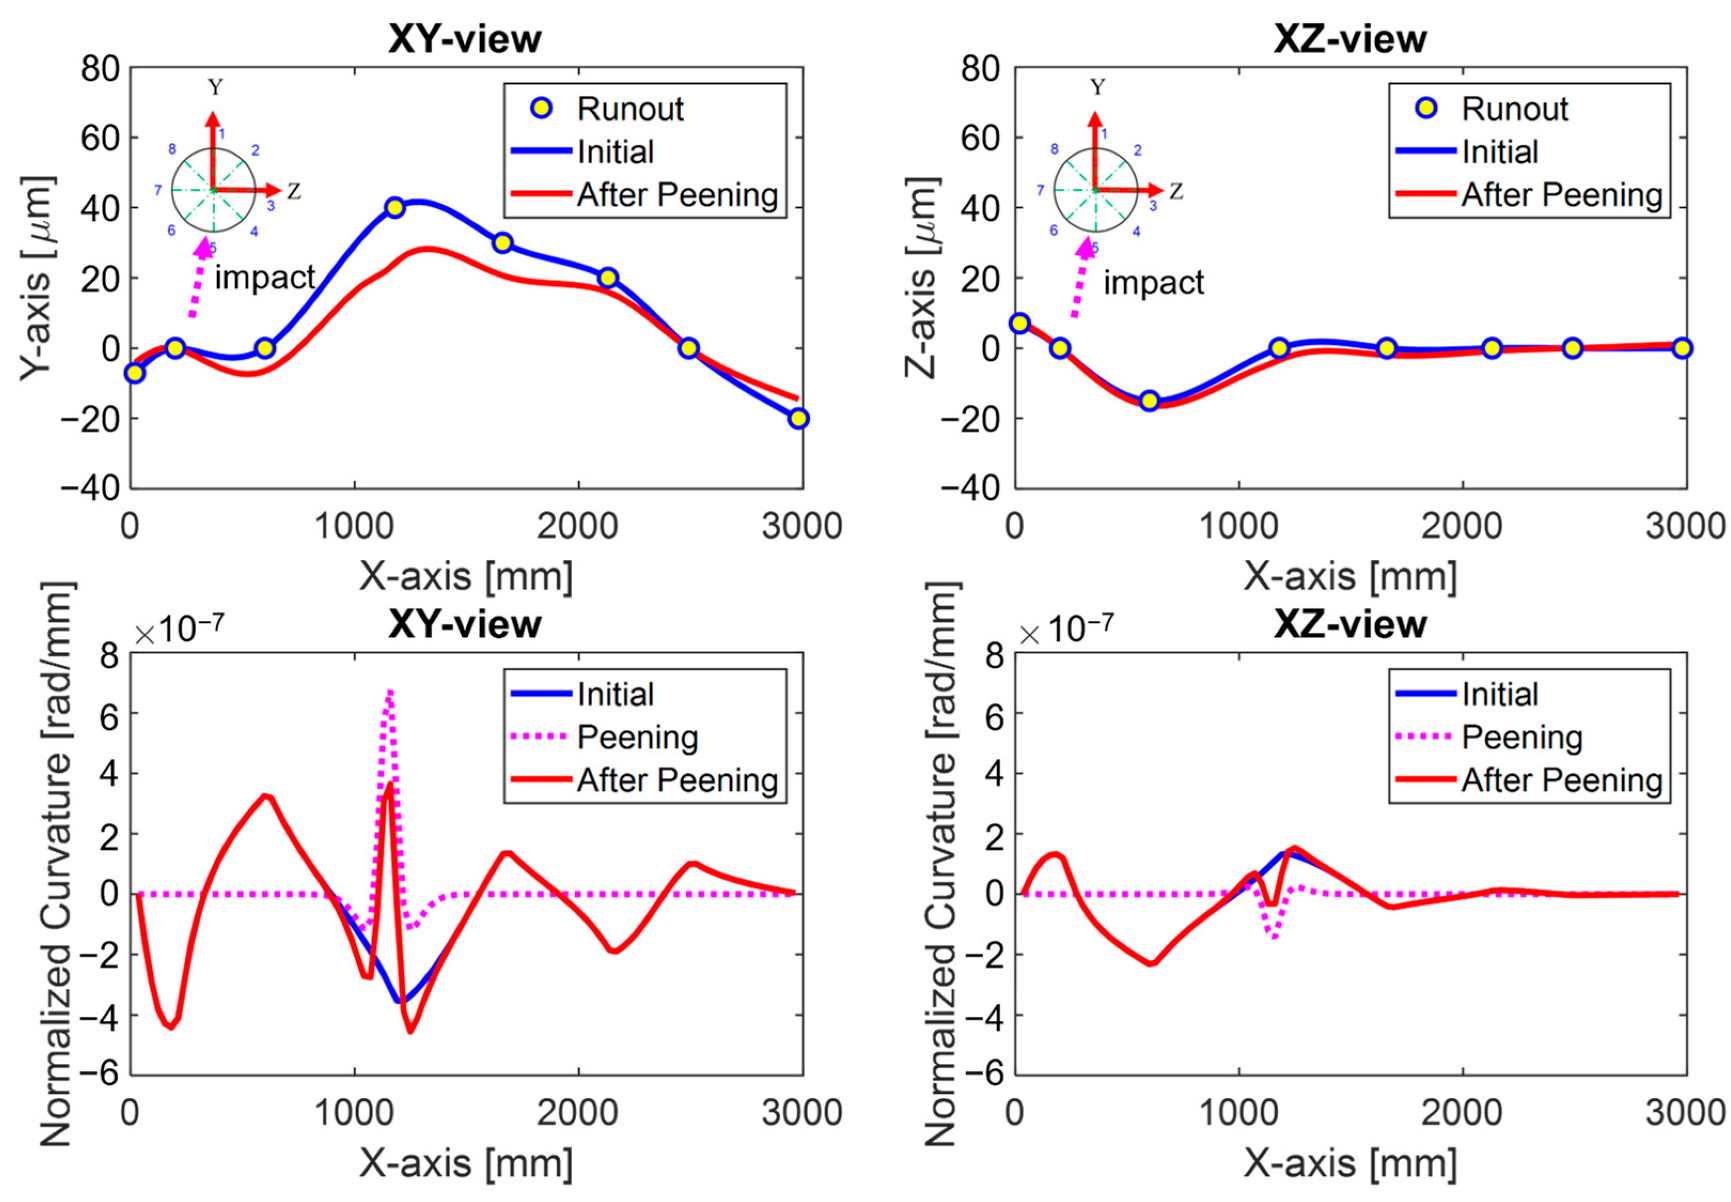
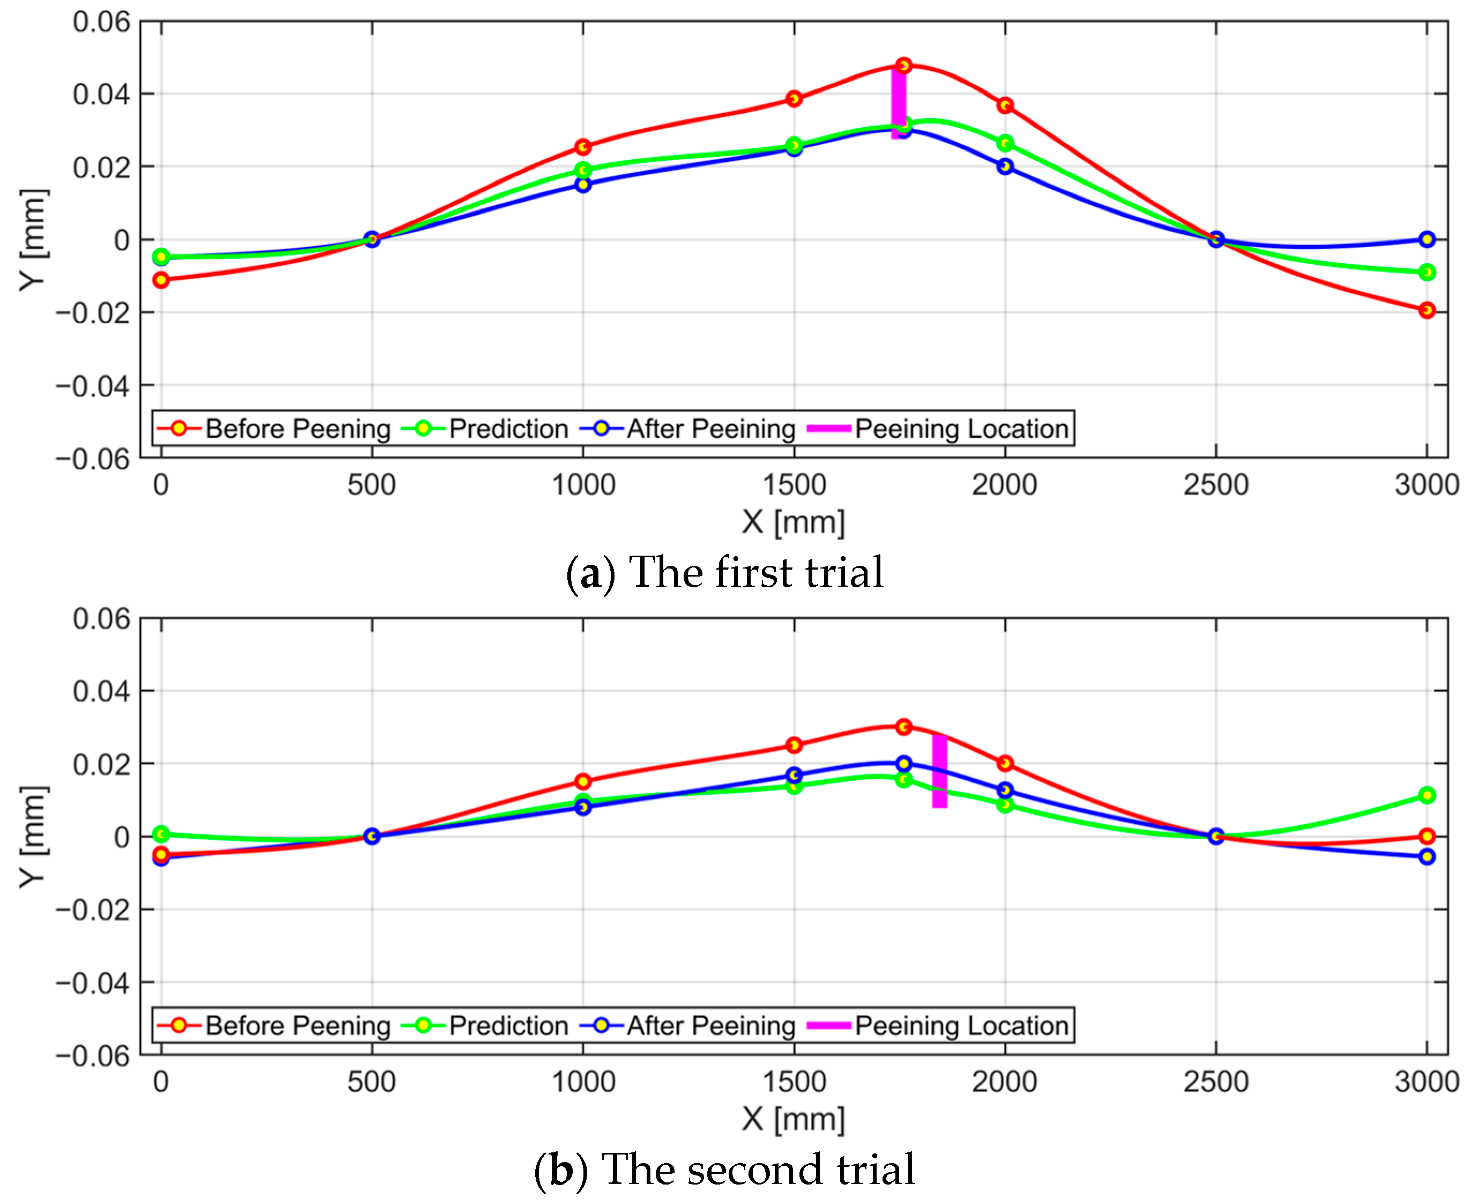
3.3. Validation of the Proposed Algorithm

Figure 16 shows side views of the initial, predicted, and actual post-peening geometries. Vertical lines indicate locations and directions of the hammer peening for each trial. In general, the predicted geometry of the rotor showed a good correlation with measurement data (Figure 16). The largest discrepancy occurred at the end of the rotor, where an additional mass was installed (Figure 1). Except for the end of the rotor, the error between the prediction and measurement was within 0.01 mm, which was the resolution of the runout measurement.

4. Discussion

The current study proposed an optimization method to determine a hammer peening plan for bent gas turbine rotors using parametric hammer peening simulation results and a repeatable hammer peening machine. The rotor correction optimization problem was solved using a global optimization algorithm [21] provided by the MultiStart function in Matlab to avoid the local minimum issue. Researchers often utilize the global optimization method to avoid the local minimum issue for potentially highly nonlinear problems. Lopez et al. [22] have used a global search algorithm to find the values of a set of parameters for the natural frequencies of rotor-bearing systems. Sainvitu et al. [23] have proposed a surrogate-based optimization method to handle the increased computational time to perform global optimization and found that the proposed method could avoid the local minimum issue for a highly non-linear optimization problem. Please note that the parametric hammer peening simulations do not need to be rerun for either different runout data or different rotors. The 27 hammer peening simulation results can be used for any rotors that have dimensions within the ranges of parameters shown in Table 2. The proposed optimization problem with five impacts resulted in much-improved results, reducing the maximum deflection from 40 μm to 10 μm while satisfying the constraints for the impactable area (Figure 15). The runout was improved not only in the XY-plane, but also in the XZ-plane. When the number of hammer peening trials was increased from five to ten, there was a slight reduction in the maximum deflection. These results imply that the proposed method can determine an optimal number of impacts and estimate the expected improvement of the rotor geometry after hammer peening. This prediction will allow engineers to improve the efficiency of hammer peening trials.
Representation of the rotor geometry using the curvature vector enabled the prediction of the post-peening rotor geometry by performing the superimposition of the initial and newly induced curvature vectors of the rotor. Although curvature has been widely used to describe the bending deformation of a beam, most previous studies on straightening rotors have only focused on the geometries of rotors [6,7]. In the simulation results, the curvature induced by hammer peening was insensitive to either the impact location or the length of the rotor. In contrast, the maximum deflection was sensitive to the impact location (Figure 11). The insensitivity of the newly induced curvature against hammer peening to the impact location or the length of the rotor indicates that the curvature is a better measure than the maximum deflection for understanding the effect of hammer peening on the straightening of the rotor. This result also supports the idea of predicting the newly induced curvature from peening by interpolating the parameters of the empirical functions that fit the curvature of the rotor (Equation (1)).
The validity of the superimposition depends on the effect of the residual stress on the newly induced curvature after multiple peening trials. The effect of the residual stress around the peening area on the additional curvatures was evaluated by performing second- and third-line peening simulations adjacent to the first peening areas. First, the effect of the residual stress was evaluated by performing hammer peening at two locations with varying distances between them. The effect of residual stress on the additional bending angle from the second-line impact almost vanished as the spacing between the two locations became farther apart than 30 mm (Figure 13). From this spacing distance, the second line impact resulted in the same amount of bending angle as the first line impact. Therefore, the minimum distance between adjacent impact locations was set to be 30 mm (Table 4). In the field of rotor straightening, multiple lines of hammer peening with spacing less than 5 mm are often performed to maximize the bending angle by utilizing minimal impacting areas (Figure 1). For spacing less than 20 mm, the additional bending angle from the second line impacts decreased as the spacing distance decreased (Figure 13). For 3 mm of spacing, the decrease in the additional normalized bending angle with the increasing number of lines of impact indicated the effect of residual stress (Figure 14). The effect of residual stress after multiple lines impact in a small area was identified by scaling the additional curvature with respect to the impact strength (Equation (2)). Xiao et al. [12] and Hacini et al. [17] have also performed superimposition to predict the final curvatures of specimens.
The prediction results from the superimposition of initial and additional curvatures showed a good correlation with the test data from the three trials except for one of the ends of the rotor where an additional cylindrical block was installed (Figure 16). The maximum error between the prediction and the experiment was 0.01 mm from the third trial considering the locations between the two end supports. This result also supports the validity of superimposing two curvatures to predict the post-peening rotor geometry. It was believed that the runout data measurement of the end block was unreliable because it kept changing curvature without any peening performed in its adjacent area. Since this validation was performed for a simple shaft, it is necessary to further investigate the effect of variation in the diameter of a rotor along its axis on the prediction of the geometry after a hammer peening.
Erb [3] has mentioned that hammer peening is preferred for rotors with relatively small diameters (<100 mm). This relationship between the bending angle and the radius of the rotor was found in the simulation (Figure 17). In the hammer peening simulation, the normalized bending angle due to the hammer peening was inversely proportional to the square of the rotor diameter (Figure 12). The x-axis represents the normalized radius by 260 mm to the power of −2. The y-axis represents the bending angle divided by that of the 260 mm rotor. Note that the number of peening impacts was the same regardless of the diameter of the rotor because the spacing between adjacent hammer peening locations along the perimeter was controlled by the angle, which was 1.5 degrees. Similarly, Zhang et al. [24] have shown that the induced curvature of the plate by shot peening is inversely proportional to the square of the thickness of the plate. If we perform hammer peening while offsetting the same amount of perimeter, the number of hammer peening impacts will be proportional to the diameter. If we take this into account, the bending angle induced by hammer peening will be inversely proportional to less than the second power of the radius of the rotor. Lastly, the maximum induced residual stress was around 1 GPa, which was similar to the value reported by Jawahir et al. [10] (Figure 3).
While the current study showed that the post-peening geometry of the rotor could be predicted, it is necessary to investigate the optimal hammer peening parameters such as the diameter of the hammer head, stepover distance, contact energy, and so on, not only for correcting the geometry, but also for improving the fatigue life of the rotor [25]. Schulze et al. (2016) have presented that excessive burnishing force can cause severe plastic deformation, which is detrimental due to the initiation of below-surface microcracks. The authors also showed that various peening processes with appropriate strength could improve the fatigue life of a specimen. The proposed optimization framework for straightening a bent rotor can be applied to other types of rotor straightening methods such as the hot spotting method. Ferreño et al. [26] have demonstrated that the end results of the flaming of a steel beam can be predicted using finite element analysis. Chavoshi et al. [27] have demonstrated that the end results of the hot spotting of a hollow shaft can be predicted using finite element analysis. Hu et al. [28] have shown that the effect of laser peening on the geometry and residual stresses of specimens can be predicted. If the proposed method can be applied to the hot spotting method, the hot spotting process can be conducted in a more efficient way instead of making the hammer peening method useless.

5. Conclusions

The current study proposed an optimization method by superimposing the initial and newly induced curvature for determining a hammer peening plan to straighten a bent gas turbine rotor. This method also considered the decreasing effect of hammer peening due to multiple-line impacts. The proposed method provided an optimal hammer peening plan for a given runout data. The proposed method was validated against a series of hammer peening results for a simple rotor. The predicted geometry of the rotor showed a good correlation with the three trials of hammer peening test data. The proposed method can guide engineers on whether hammer peening, which is an irreversible process, would work or not by providing a prediction of the post-peening geometry of the rotor. In addition, the proposed method can reduce the number of hammer peening trials needed by providing an optimal hammer peening plan. A similar approach can be used for other types of rotor straightening methods, such as hot spotting. Lastly, the proposed method needs to be validated for an actual gas turbine rotor with variations in diameters along its length.

Author Contributions

Conceptualization, T.K. (Taewung Kim); methodology, T.K. (Taewung Kim) and T.K. (Taehyung Kim); software, T.K. (Taewung Kim); validation, T.K. (Taewung Kim) and T.K. (Taehyung Kim); formal analysis, T.K. (Taewung Kim); investigation, T.K. (Taewung Kim); resources, T.K. (Taewung Kim); data curation, T.K. (Taewung Kim); writing—original draft preparation, T.K. (Taewung Kim); writing—review and editing, T.K. (Taehyung Kim); visualization, T.K. (Taewung Kim); supervision, T.K. (Taehyung Kim); project administration, T.K. (Taewung Kim); funding acquisition, T.K. (Taewung Kim). All authors have read and agreed to the published version of the manuscript.

Funding

This work was supported by Korea Agency for Infrastructure Technology Advancement (KAIA) grant (No. 22ABCD-CC164547-02, Development of Self-Powered and Wireless Safety Monitoring Technology for Railway Power Supply Systems) funded by the Korea government (MOLIT).

Data Availability Statement

Not applicable.

Acknowledgments

Special thanks to KEPCO Plant Service Center for their valuable comments on the hammer peening process of gas turbine rotors and supports for the experiment.

Conflicts of Interest

The authors declare no conflict of interest.

References

  1. Poursaeidi, E.; Yazdi, M.K. Causes of rotor distortions and applicable common straightening methods for turbine rotors and shafts. World Acad. Sci. Technol. 2011, 55, 213–218. [Google Scholar]
  2. Baldassarre, L.; Michel, F. Modeling of Rotor Bow during Hot Restart in Centrifugal Compressors; Turbomachinery Laboratories, Texas A&M University: College Station, TX, USA, 2010; Available online: https://hdl.handle.net/1969.1/163042 (accessed on 3 September 2022).
  3. Erb, H. Repair Techniques for Rotor and Case Damage; Gas Turbine Laboratories, Texas A&M University: College Station, TX, USA, 1973; Available online: https://hdl.handle.net /1969.1/163859 (accessed on 3 September 2022).
  4. Poursaeidi, E.; Razavi, A.R. An investigation on the causes of a rotor bending and its thermal straightening (technical note). Int. J. Eng. 2008, 21, 281–290. Available online: https://www.sid.ir/en/journal/ViewPaper.aspx?id=122082 (accessed on 3 September 2022).
  5. Burhani, A.; Rozaq, F.; Supriyanto, E. Case study application of cold peening in combination with thermal stress relieving as effective method for straightening large turbine rotor. In Proceedings of the International Conference on Power, Energy, Control and Transmission Systems (ICPECTS), Chennai, India, 10–11 December 2020; pp. 1–6. [Google Scholar] [CrossRef]
  6. Yasfi; Nasruddin, M.; Artady, H. Case study of straightening methods for bent shaft 1.25 mm on hip turbine rotor pacitan steam power plant#1. In Proceedings of the 2019 International Conference on Technologies and Policies in Electric Power & Energy, Yogyakarta, Indonesia, 21–22 October 2019; pp. 1–5. [Google Scholar]
  7. Poursaeidi, E.; Yazdi, M.K. Application of the hot spotting method for the straightening of a large turbine rotor. Int. J. Eng. (IJE) 2018, 31, 110–119. [Google Scholar]
  8. Avent, R.R.; Mukai, D.J.; Robinson, P.F. Effect of heat straightening on material properties of steel. J. Mater. Civ. Eng. 2000, 12, 188–195. [Google Scholar] [CrossRef]
  9. Kim, J.-Y.; Lee, J.-J.; Lee, K.-W.; Kwon, D. Nondestructive evaluation of flow properties in thermally aged Cr–Mo–V steel using instrumented indentation tests. J. Mater. Sci. 2009, 44, 3561–3565. [Google Scholar] [CrossRef]
  10. Diepart, C.P. Shot Peening for the Prevention of Stress Corrosion and Fatigue Cracking of Heat Exchangers and Feedwater Heaters; No. EPRI-TR-105876; CONF-9509192-; Electric Power Research Inst.: Palo Alto, CA, USA, 1995. [Google Scholar]
  11. Jawahir, I.; Brinksmeier, E.; M’Saoubi, R.; Aspinwall, D.; Outeiro, J.; Meyer, D.; Umbrello, D.; Jayal, A. Surface integrity in material removal processes: Recent advances. CIRP Ann. 2011, 60, 603–626. [Google Scholar] [CrossRef]
  12. Xiao, X.D.; Wang, Y.J.; Zhang, W.; Wang, J.B.; Wei, S.M. Numerical research on stress peen forming with prestressed regular model. J. Mater. Process. Technol. 2016, 229, 501–513. [Google Scholar] [CrossRef]
  13. Xiao, X.; Tong, X.; Gao, G.; Zhao, R.; Liu, Y.; Li, Y. Estimation of peening effects of random and regular peening patterns. J. Mater. Process. Technol. 2018, 254, 13–24. [Google Scholar] [CrossRef]
  14. Gariépy, A.; Larose, S.; Perron, C.; Lévesque, M. Shot peening and peen forming finite element modelling–Towards a quantitative method. Int. J. Solids Struct. 2011, 48, 2859–2877. [Google Scholar] [CrossRef]
  15. Kim, S.-C.; Chung, S.-C. Synthesis of the multi-step straightness control system for shaft straightening processes. Mechatronics 2002, 12, 139–156. [Google Scholar] [CrossRef]
  16. Pei, Y.C.; Wang, J.W.; Tan, Q.C.; Yuan, D.Z.; Zhang, F. An investigation on the bending straightening process of D-type cross section shaft. Int. J. Mech. Sci. 2017, 131–132, 1082–1091. [Google Scholar] [CrossRef]
  17. Hacini, L.; Van Le, N.; Bocher, P. Evaluation of residual stresses induced by robotized hammer peening by the contour method. Exp. Mech. 2009, 49, 775–783. [Google Scholar] [CrossRef]
  18. Bleicher, F.; Lechner, C.; Habersohn, C.; Kozeschnik, E.; Adjassoho, B.; Kaminski, H. Mechanism of surface modification using machine hammer peening technology. CIRP Ann. 2012, 61, 375–378. [Google Scholar] [CrossRef]
  19. Kim, T.; Lee, H.; Hyun, H.C.; Jung, S. A simple but effective FE model with plastic shot for evaluation of peening residual stress and its experimental validation. Mater. Sci. Eng. A 2011, 528, 5945–5954. [Google Scholar] [CrossRef]
  20. Seong, W.-J.; Na, S.-J. Systematization of heat straightening process of stiffened plate by surface flattening. J. Mater. Process. Technol. 2022, 299, 117333. [Google Scholar] [CrossRef]
  21. Ugray, Z.; Lasdon, L.; Plummer, J.; Glover, F.; Kelly, J.; Martí, R. Scatter Search and Local NLP Solvers: A Multistart Framework for Global Optimization. INFORMS J. Comput. 2007, 19, 328–340. [Google Scholar] [CrossRef]
  22. Lopez, R.H.; Ritto, T.G.; Sampaio, R.; De Cursi, J.S. A new algorithm for the robust optimization of rotor-bearing systems. Eng. Optim. 2014, 46, 1123–1138. [Google Scholar] [CrossRef]
  23. Sainvitu, C.; Iliopoulou, V.; Lepot, I. Global optimization with expensive functions-sample turbomachinery design application. In Recent Advances in Optimization and Its Applications in Engineering; Springer: Berlin/Heidelberg, Germany, 2010; pp. 499–509. [Google Scholar]
  24. Zhang, J.; Lu, S.; Zhou, Z.; Wu, T.; Xu, G. Modeling of multiple shots for analyzing shot peening controlled parameters on formed curvature radius. Int. J. Adv. Manuf. Technol. 2017, 93, 1867–1876. [Google Scholar] [CrossRef]
  25. Schulze, V.; Bleicher, F.; Groche, P.; Guo, Y.B.; Pyun, Y.S. Surface modification by machine hammer peening and burnishing. Cirp Ann. 2016, 65, 809–832. [Google Scholar] [CrossRef]
  26. Ferreño, D.; Carral, J.P.; Calderón, R.L.; Álvarez, J.A.; Gutiérrez-Solana, F. Development and experimental validation of a simplified finite element methodology to simulate the response of steel beams subjected to flame straightening. Constr. Build. Mater. 2017, 137, 535–547. [Google Scholar] [CrossRef]
  27. Chavoshi, S.E.; Torshizi, S.E.M. Bending improvement in spot heating of pipes in comparison with line heating method. Mech. Ind. 2019, 20, 405. [Google Scholar] [CrossRef]
  28. Hu, Y.; Li, Z.; Yu, X.; Yao, Z. Effect of elastic prestress on the laser peen forming of aluminum alloy 2024-T351: Experiments and eigenstrain-based modeling. J. Mater. Process. Technol. 2015, 221, 214–224. [Google Scholar] [CrossRef]
Figure 1. A repeatable hammer peening machine (left) and an example of its capable hammer peening pattern (right).
Machines 10 00950 g001
Figure 2. (left) Loading conditions for hammer peening simulation. (right) Exemplar simulation results.
Machines 10 00950 g002
Figure 3. Comparison of sizes of dents from the experiment (left) and simulation (right).
Machines 10 00950 g003
Figure 4. Yield stress vs. plastic strain for the rotor material.
Machines 10 00950 g004
Figure 5. Description of parameters for hammer peening simulations.
Machines 10 00950 g005
Figure 6. Curvature vector of the centerline of the rotor.
Machines 10 00950 g006
Figure 7. Example of representation of curvature of the rotor normalized by its length (L: 3000 mm, D: 450 mm).
Machines 10 00950 g007
Figure 8. Representation of the curvature of the rotor using empirical function (Equation (1)).
Machines 10 00950 g008
Figure 9. Prediction of a rotor geometry after hammer peening.
Machines 10 00950 g009
Figure 10. An example of predicting the geometry of the rotor after hammer peening based on the superposition of curvature vectors (impact location: 1160 mm, impact direction: 190 deg, impact strength: 1.7).
Machines 10 00950 g010
Figure 11. Deformed geometry of rotors from hammer peening simulations.
Machines 10 00950 g011
Figure 12. Aligned curvature of deformed rotor from hammer peening simulations.
Machines 10 00950 g012
Figure 13. Normalized bending angle with respect to spacing between two-line impacts.
Machines 10 00950 g013
Figure 14. Normalized bending angles with respect to the number of impact lines.
Machines 10 00950 g014
Figure 15. Converged solution for hammer peening plan for a given runout data.
Machines 10 00950 g015aMachines 10 00950 g015b
Figure 16. Comparison of rotor geometries from prediction and hammer peening.
Machines 10 00950 g016aMachines 10 00950 g016b
Figure 17. Relationship between a normalized diameter and a normalized bending angle.
Machines 10 00950 g017
Table 1. Material properties for hammer peening simulations.
Material PropertiesYoung’s Modulus [GPa]Poisson’s RatioDensity [ton/mm3]Yield Strength [MPa]
CrMo Steel2000.297.8 × 10−9762
Table 2. Parameters for single-line hammer peening simulations.
ParametersValues
Rotor Length [mm]3000, 4500, 6000
Rotor Diameter [mm]260, 450, 600
Impact Location (P over S in Figure 5)10%, 30%, 50%
Table 3. Parameters for multiple-line hammer peening simulations.
ParametersValues
Number of lines of impacts2 and 3 lines
Spacing between adjacent lines of impacts0, 3, 5, 10, 20, and 40 mm
Table 4. Statement of optimization problem for determining hammer peening plan for M trials.
Minimize f ( x ^ , θ , S ) = i = 1 N y i 2 + z i 2
where
x ^ : domain   of   impactable   locations
θ : impacting   directions   ( 0 θ < 2 π )
S : impacting   strength   ( 0 S < S m a x )
N : the   number   of   fitted   centerline   points
with respect to x ^ , θ , S R M
where
M :   the   number   of   hammer   peening   locations
subject to f o r   i m p a c t i n g   l o c a t i o n { 0 x ^ 1 < x ^ 2 c x ^ 2 < x ^ 3 c x ^ M < L ^ m a x
where
c : minimum   distance   between   adjacent   impacting   locations
Table 5. Impactable areas.
Interval (ID)123456
Diameter [mm]260260260260260260
Start [mm]2005901160164021102300
End [mm]3006101200168021502450
Impactable domain ( x ^ ) [mm][0,100][100,120][120,160][160,200][200,240][240,290]
Publisher’s Note: MDPI stays neutral with regard to jurisdictional claims in published maps and institutional affiliations.

