Article

Data Analysis for Trajectory Generation for a Robot Manipulator Using Data from a 2D Industrial Laser

1
FEUP—Faculty of Engineering, University of Porto, Rua Dr. Roberto Frias, 4200-465 Porto, Portugal
2
CeDRI—Research Centre in Digitalization and Intelligent Robotics, School of Technology and Management, Polytechnic Institute of Bragança, Santa Apolónia Campus, 5300-253 Bragança, Portugal
3
GRESTEL—Produtos Cerâmicos, S.A., 3840-385 Aveiro, Portugal
4
SYSTEC (DIGI2)—Research Center for Systems and Technologies (Digital and Intelligent Industry Lab), 4200-465 Porto, Portugal
5
INESC TEC—Institute for Systems and Computer Engineering, Technology and Science, CRIIS—Centrefor Robotics in Industry and Intelligent Systems, Campus of FEUP, Rua Dr. Roberto Frias, 4200-465 Porto, Portugal
*
Author to whom correspondence should be addressed.
Machines 2022, 10(10), 907; https://doi.org/10.3390/machines10100907
Submission received: 20 July 2022 / Revised: 17 September 2022 / Accepted: 20 September 2022 / Published: 8 October 2022

Abstract

:
Nowadays, the automation of factory floors is necessary for extensive manufacturing processes to meet the ever-increasing competitiveness of current markets. The technological advances applied to the digital platforms have led many businesses to automate their manufacturing processes, introducing robotic manipulators collaborating with human operators to achieve new productivity, manufacturing quality, and safety levels. However, regardless of the amount of optimization implemented, some quality problems may be introduced in production lines with many products being designed and produced. This project proposes a solution for feature extraction that can be applied to automatic shape- and position-detection using a 2-dimension (2D) industrial laser to extract 3-dimension (3D) data where the movement of the item adds the third dimension through the laser’s beam. The main goal is data acquisition and analysis. This analysis will later lead to the generation of trajectories for a robotic manipulator. The results of this application proved reliable given their small measurement error values of a maximum of 2 mm.

1. Introduction

In modern industry, feature extraction and data processing are major issues since these highly influencial product prices, their detection, and their correction have become a necessary subject to consider when providing a service or designing and creating a product. However, these tasks usually require very specialized and skilled operators, thus making it difficult to automate processes.
In the ceramic industry, after production, the products have small amounts of excess material on the edges due to molding and casting, which require polishing. This operation is performed using a cleaning system consisting of a rotating sponge, and the process is done automatically in a machine if the plates are circular but must be done manually if the shape is not circular. This happens because the sponge is static, and the dishes are rotated and moved towards it. For non-circular parts, this process cannot be used. The circular products are processed due to their shape, and the distance to the sponge is always known due to its constant radius. However, to improve and grow as a business and introduce a variety of new Stoneware Tableware, it is necessary to implement an automatic robotic solution to account for more possible product shapes.
The main novelty presented in this document is object data acquisition for the generations of a robot trajectory. This trajectory differs from other approaches due to the dynamic positioning of the manipulator’s end tool. The polishing tool is also dynamically placed to allow the piece to finish correctly.
Nowadays, 2D or 3D datasets can be analyzed through prevalent technology such as a point cloud, a data set representing objects, shapes, or spaces. Each point represents the sampled surface’s X, Y, and Z geometric coordinates. Point clouds are collections of individual points plotted in 3D space. These points allow for the reconstruction of the sampled surface in a digital environment.
According to the information in [1], this approach is used in several different applications and categories, for example, in the construction industry, such as 3D model reconstruction and geometry quality inspection.
Point clouds are present in several industrial applications with different goals, but one of the biggest is focused on increased accuracy and is obtained using several other methods. The study presented by the authors of [2] provides a set of possibilities for point-cloud data acquisition, which includes:
  • 3D Laser Scanning and LiDAR
    Data points are collected using laser beams that allow one to measure the distance of the point to the scanner by detecting the reflected beam from the object to be scanned.
    3D Laser scanning is a non-contact technology that captures the shape and surfaces of physical objects or spaces using linear laser light [3].
    Using a data-processing software associated with the laser scanner, the user is presented with a point cloud created from datasets of the detected surface. The scanner works with pulses of light sent to the object’s surface. The object reflects the light back to the scanner, which is captured by its built-in camera after a specific time. The time measured between sending and receiving allows the scanner to map the points in 3D space.
  • Photogrammetry
    According to the American Society for Photogrammetry and Remote Sensing (ASPRS), photogrammetry is a method of obtaining trustworthy information regarding physical objects and their surrounding environment using photographic images [4]. This technique uses multiple photographs taken from different angles of the target object. Later, these photos are overlapped, and already developed algorithms can estimate the relative locations of these images. The final result is a 3D point cloud of the object.
  • Videogrammetry
    Videogrammetry is similar to photogrammetry, but instead of using several photos to generate the point cloud, it uses video streams as input. This method is also capable of a progressive reconstruction of the point cloud due to the sequential nature of the video frames. According to [5], there are several advantages to using this method in certain situations, which include:
    -
    3D and non-contact measurements;
    -
    Large number of objects (targets);
    -
    Moving objects;
    -
    Good temporal resolution requirements;
    -
    Precise and reliable results requirements;
    -
    Fast recording and processing requirements (on-line solutions).
  • RGB-D Camera
    An RGB-D camera is an RGB (red, blue, and green) camera equipped with a depth sensor. The generated point cloud is colored with XYZ coordinates and RGB values.
  • Stereo Camera
    A stereo camera has two or more lenses and a separate image sensor. 2D images of each lens obtain the 3D point cloud since one lens’s relative position, and orientation to the other, is known beforehand.
The analyzed alternatives provide a better understanding of the acquisition and processing of point-cloud data. It becomes clear that 3D laser scanning technology is one of the best choices for implementations that require high levels of precision, and the preprocessing of the points data may be a necessary step to remove undesired values from the datasets and make the overall system more stable and capable of performing its designated tasks. A comparison between these methods is also performed in [2], and it is concluded that 3D laser scanning has higher accuracy and a higher measurement range than the other mentioned technologies.
Robot paths and trajectories are widely studied subjects. While these subjects share the same goal, which is the correct movement of the manipulator, there are some essential distinctions.
Path planning is introduced in [6] as a purely geometric matter and defined as the generation of a geometric path, with no mention of any specified time law. The goal is to find a collision-free motion between the starting and final positions. There are several different kinds of possible paths, which can be simply geometrical or more dynamic, including obstacle avoidance or simultaneous work with other robots with significant degrees of freedom or with humans.
The work presented in [7] exposes some ideas that can be implemented, such as the use of an offline programming platform, the simulation of the robot’s trajectory before programming the actual system, and the use of OPEN CASCADE open-source libraries as a way to analyze and use the CAD model. Part of the process is presented in Figure 1.
The work presented in [8] uses a method that creates a path for 3D grinding using online measurement data of workpieces with complex surfaces. This approach uses a 3D laser scanner and point-cloud data. Since the point-cloud data is of very high density, the author proposed two different topologies:
  • Octree
    A fast and convergent method in which each node has eight children [9]. If every internal node of the Octree contains exactly eight children, it is called a full Octree.
  • K-d tree
    A binary search tree, also known as a K-Dimensional tree, defines nodes as a K-Dimensional point in space [10]. It is a data structure capable of organizing points in a K-Dimensional space.
This data goes through pre-processing methods, such as filtering and smoothing. Later, the path is calculated using a series of planes intersecting with the target’s surface. The lines formed by the intersection of the planes are used to define the robot tool’s path. The path is composed of a series of contact points that are then generated, and the posture of the tool is calculated for each point using the surface’s normal vectors. This study provides several alternatives to the previous approach by not using Octree or K-d tree topologies instead of a CAD model, allowing for fast pre-processing of the point-cloud data.
Ref. [11] presents an acquisition and analysis of a conveyor’s belt geometrical surface used in the mining industry. This approach aims to detect defects in the belt and further evaluate the overall condition of the conveyor. Laser scanning is used to acquire point-cloud data, from which the irregularities of the item are extracted, proving an adequate choice of technology.
Ref. [12] presents an interactive programming method for using robots in the ceramic industry. This work aims to develop a robotic solution to finish ceramic tableware parts per the quality requirements. One of the requirements was to have fully customizable trajectories, not only those dependent on the object’s shape. This work uses a vacuum grip to pick up the ceramic piece. The process is divided into five stages: part pick-up, grind, fettle vertically, fettle horizontally, and unload. Similar to this dissertation’s focus, the product is picked up and released to the top of a conveyor belt. The robot’s path for each part was achieved using a programming table and augmented reality (AR). AR is a technology in which virtual elements are added to a natural scene. The table is equipped with an infrared vision system that detects an LED pen and a projector for the augmented scene and allows the definition of trajectories by the user. The working process allows one to replicate the current polishing of the piece in the user’s application using AR. The final solution provides an application capable of highly flexible programming. One important aspect is its outperformance of offline programming in terms of programming time and system tuning.
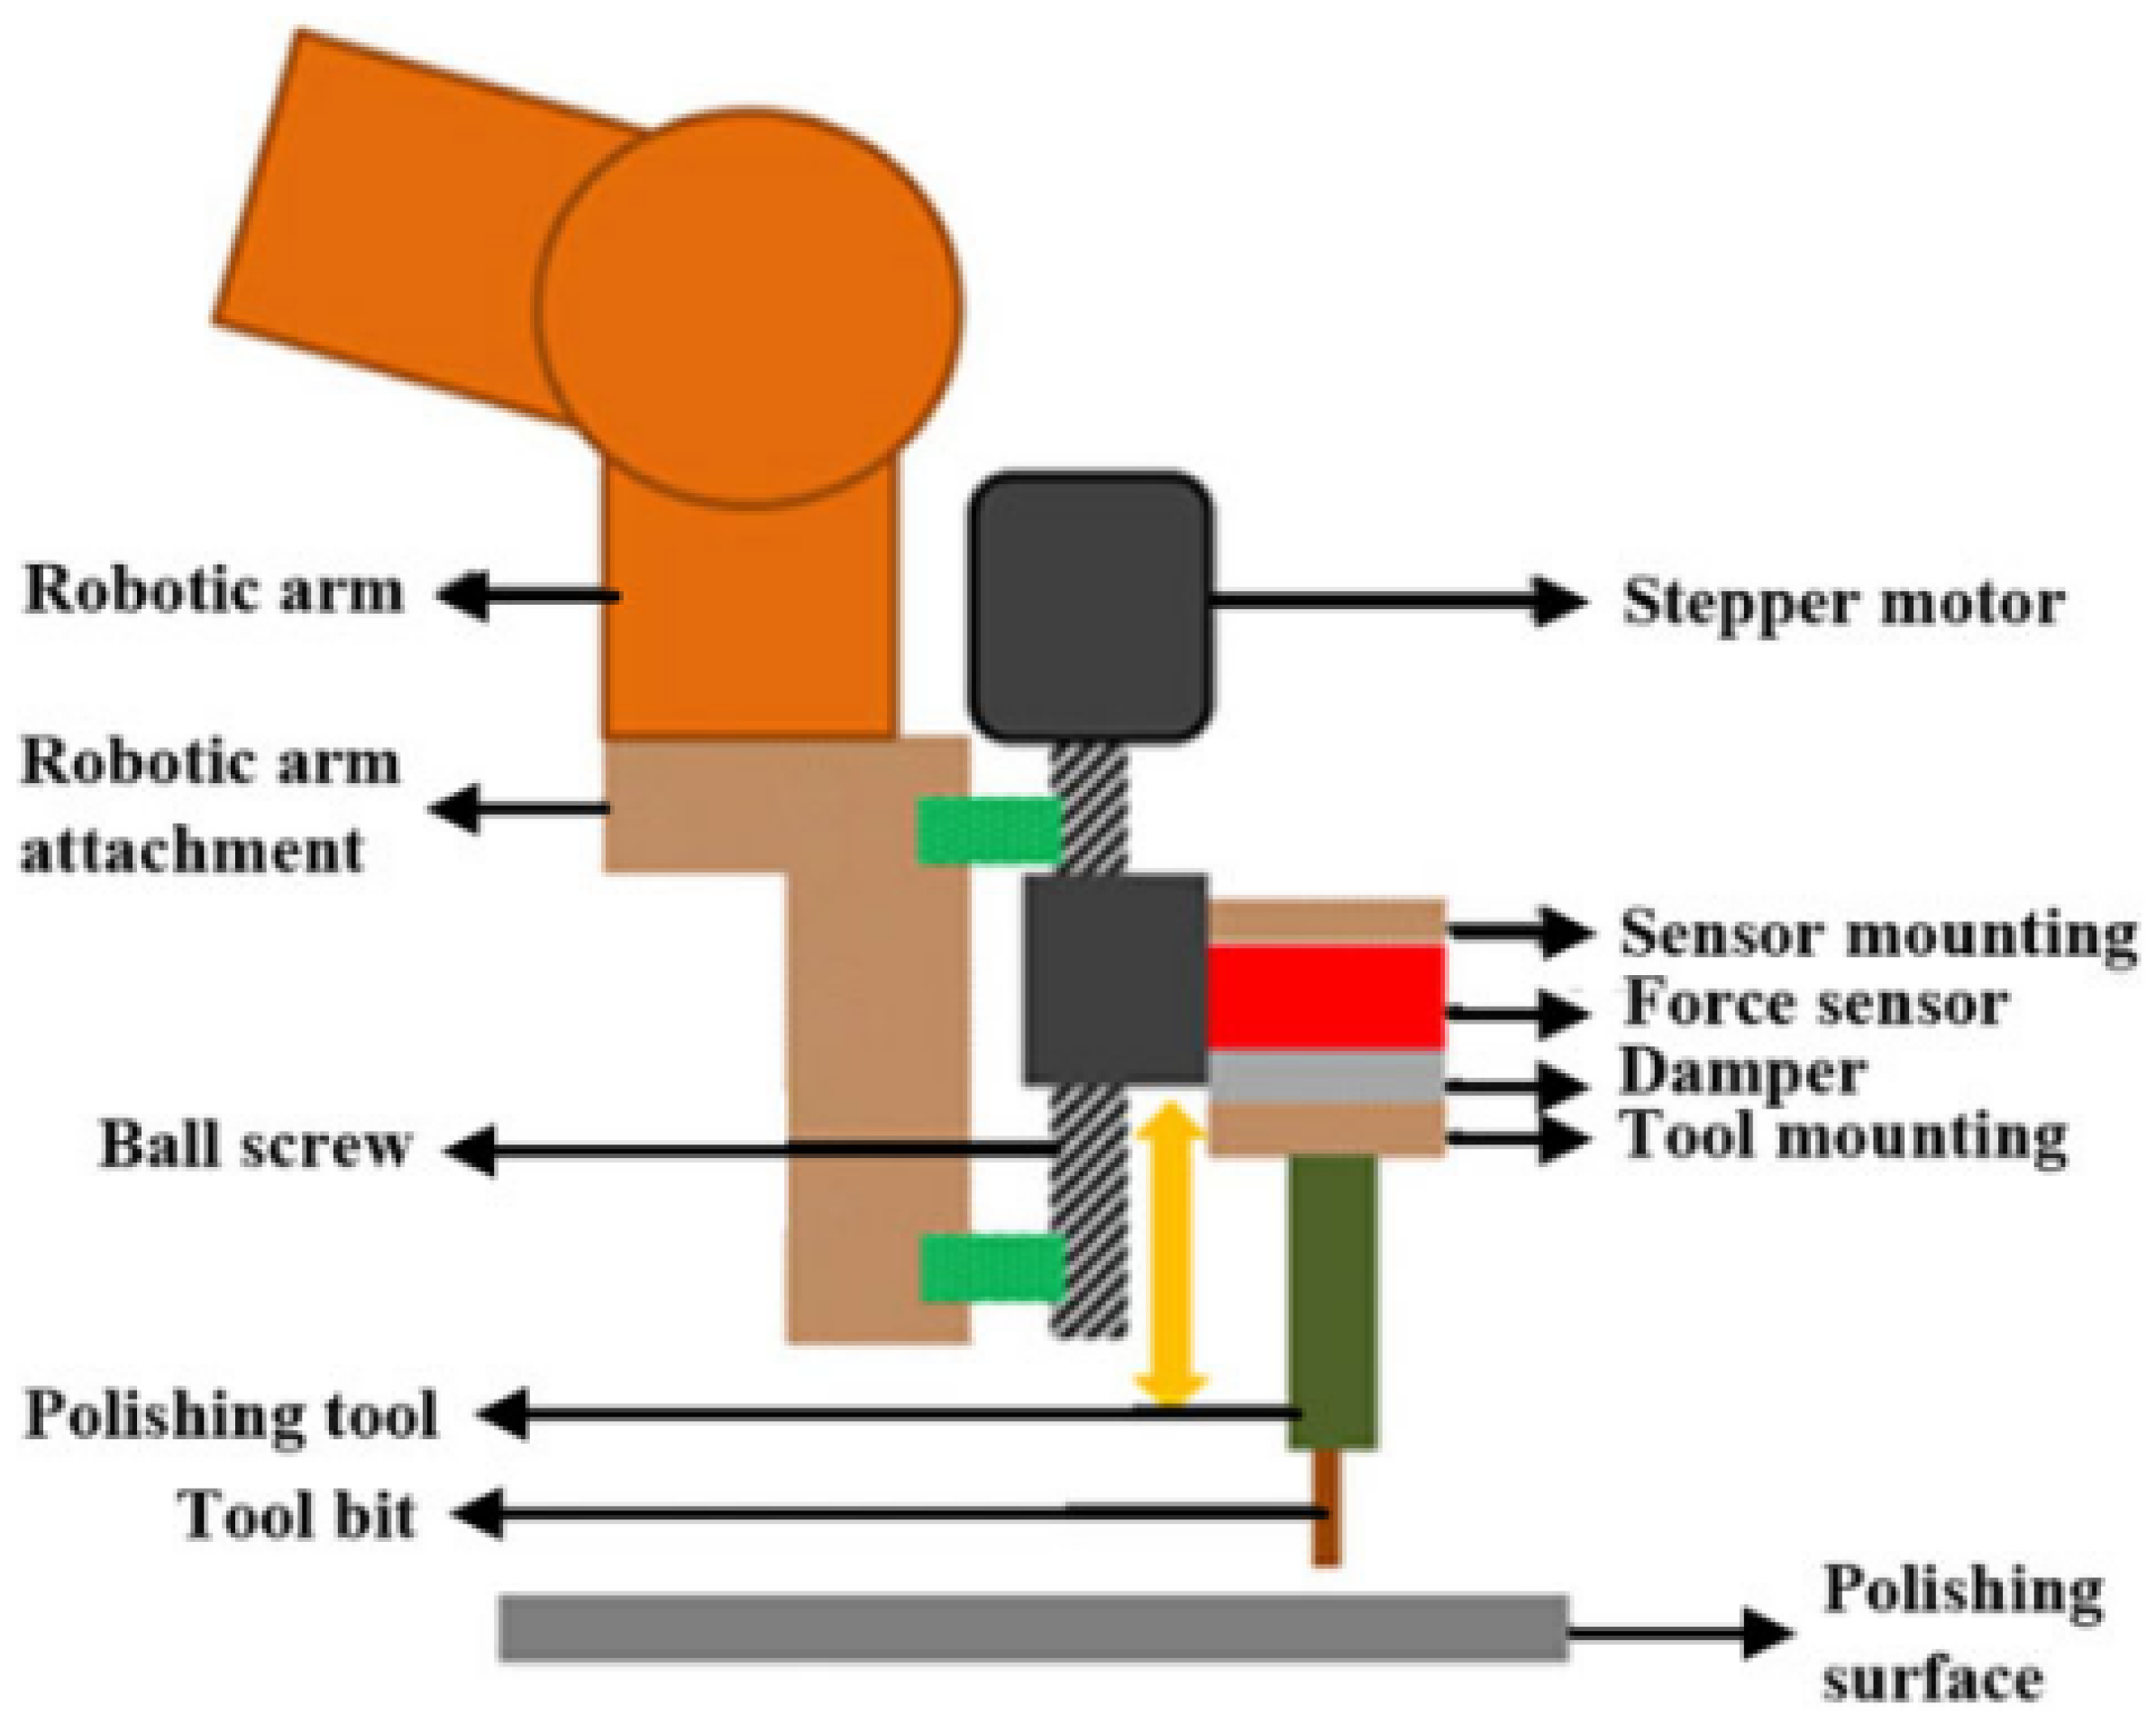
Ref. [13] describes a technique used for polishing/fettling ceramic pot handles using a robot system with a stepper motor, a ball screw, and a force sensor. As opposed to the previous example of the work presented in [12], the polishing tool is placed at the end of the robotic arm and is not an external system. The force actuation is controlled with a fuzzy PID (proportional integral derivative) controller instead of a regular PID to achieve a better response. The setup is shown in Figure 2.
The polishing trajectories can be generated using CAD or computer-aided manufacturing data. The CAD files corresponding to each object are imported, and the polishing is controlled by a position and force control system. The main downside of this approach is the limitation to only objects with CAD files. Trajectory points are acquired with cameras, which are used in different ways, such as extracting the features from a polished surface or recording the path of the tool in a manual process and replicating it later on. The latter demands that the camera is fixed to register the tool’s angles in the same plane.
This system was validated using a six-degrees-of-freedom Staubli TX 40 L robotic arm. The polishing results were validated using a microscope to verify the molding defects of the ceramic pot, which achieved suitable and desired outcomes.
Ref. [14] exposes a surface-polishing solution with a force-controlled end effector and multi-step planning. For this application, the selected robot is an ABB IRB 1200 with a 7 kg payload and 900 mm reach. The manipulator is equipped with a rotary gripper, and the polishing tool is stationary. Workpieces are picked and pushed against the abrasive tool. The force at which it is pushed against the polishing tool is determined by a force controller using a force sensor equipped on the manipulator. The final system was tested by polishing a watch bezel with curved surfaces resembling a ring’s shape.
The force-controlled system is designed per the following requirements ([14]):
  • Fast and reliable;
  • Able to compensate against gravitational and polishing forces;
  • Low-weight and compact;
  • Capable of supporting different tool weights.
The end tools path is planned per the previously selected shape and size of the workpiece, not dynamically. Given the ring shape of the object, the authors chose to divide the process into two different steps: the interior ring and the outer surface. The final polishing process produced satisfactory results compared to the polishing performed by factory workers.
Given the different strategies used in each of the previous works, the proposed approach focuses on using laser-scanning technology to ensure the correct and reliable acquisition of point cloud, which provides a small error. Such data is afterward processed and analyzed to generate the trajectory of a robot manipulator.

2. Prototype Description

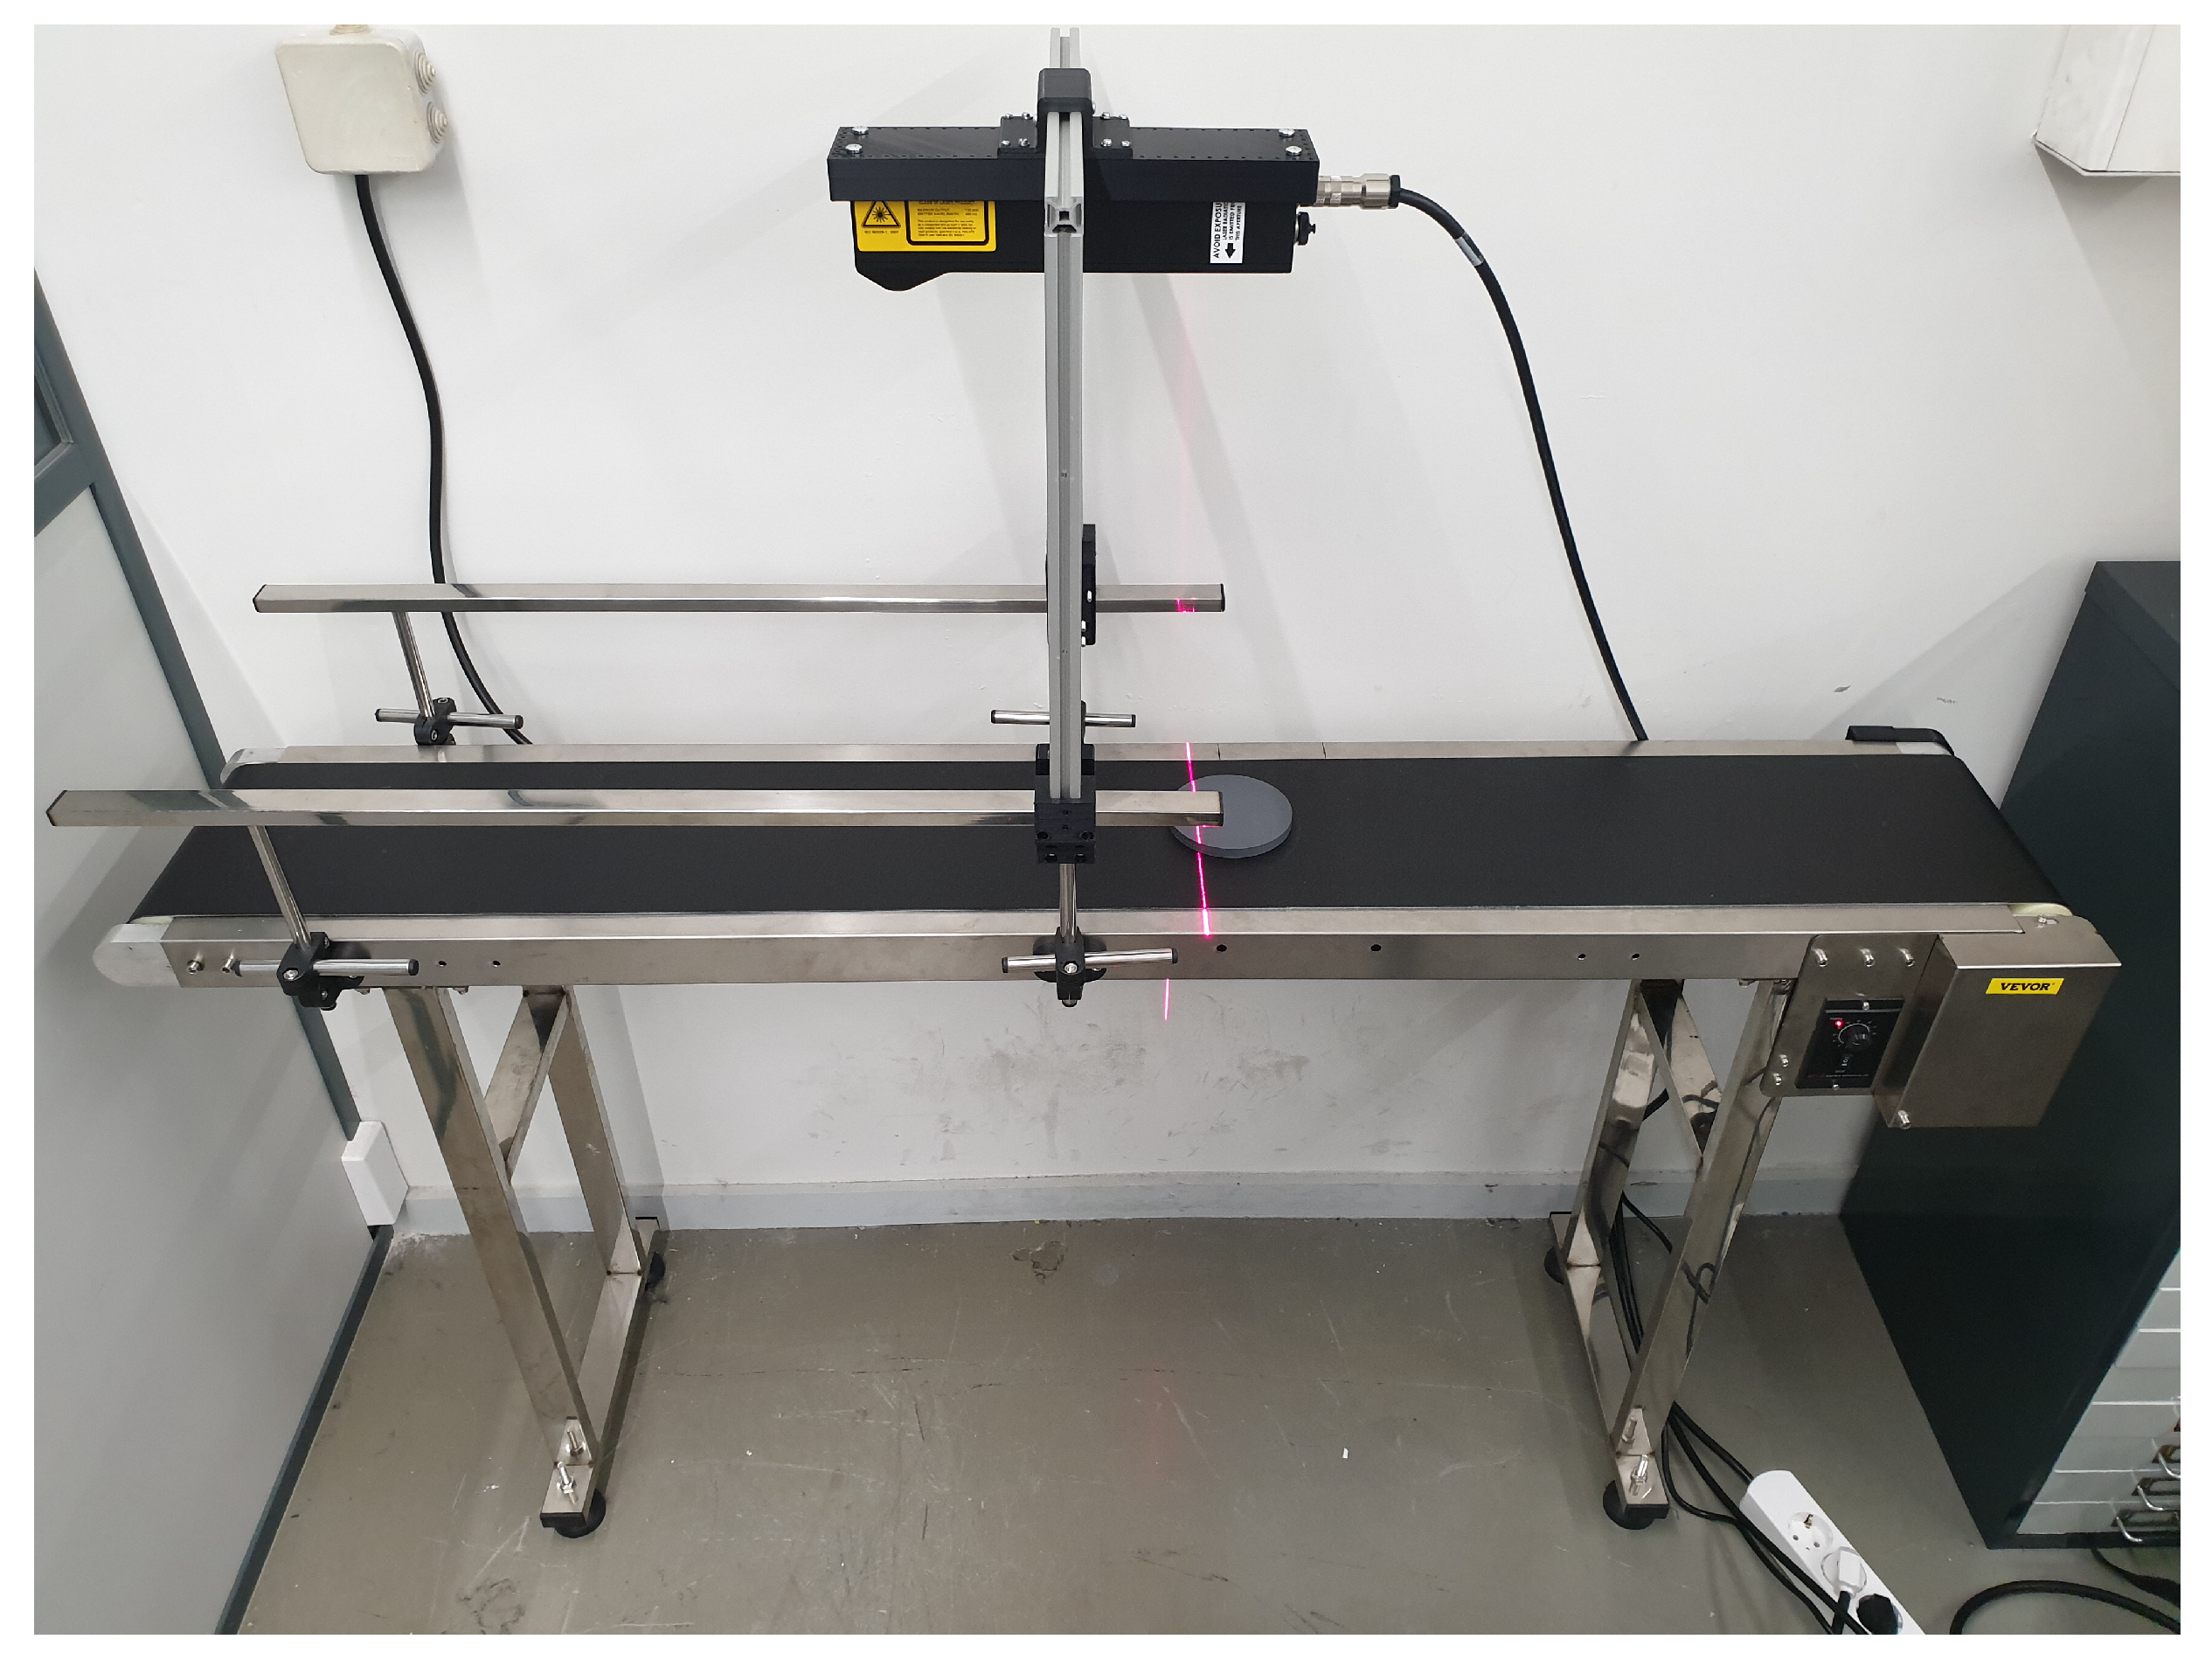
The setup built using the previously mentioned components shown in Figure 3. The system was mounted at FEUP installations in the Department of Electrical and Computer Engineering and comprises all the components except the robotic manipulator, which is currently placed at the Instituto Politécnico de Bragança’s facilities.

3. Experimental Setup

The proposed experimental setup is presented in Figure 4.

3.1. Connection

During the development of this project, the Ethernet option was used due to an official Gocator GoSDK library provided by the manufacturer, LMI Technologies Inc., Burnaby, BC, Canada. It can be used by an application written in C, C++, C#, or VB.NET. This library offers many functions for the user to communicate and retrieve information from the laser.
The developed application is programmed in C++ using the provided GoSDK C library with Microsoft Visual Studio.

3.2. Speed Acquisition

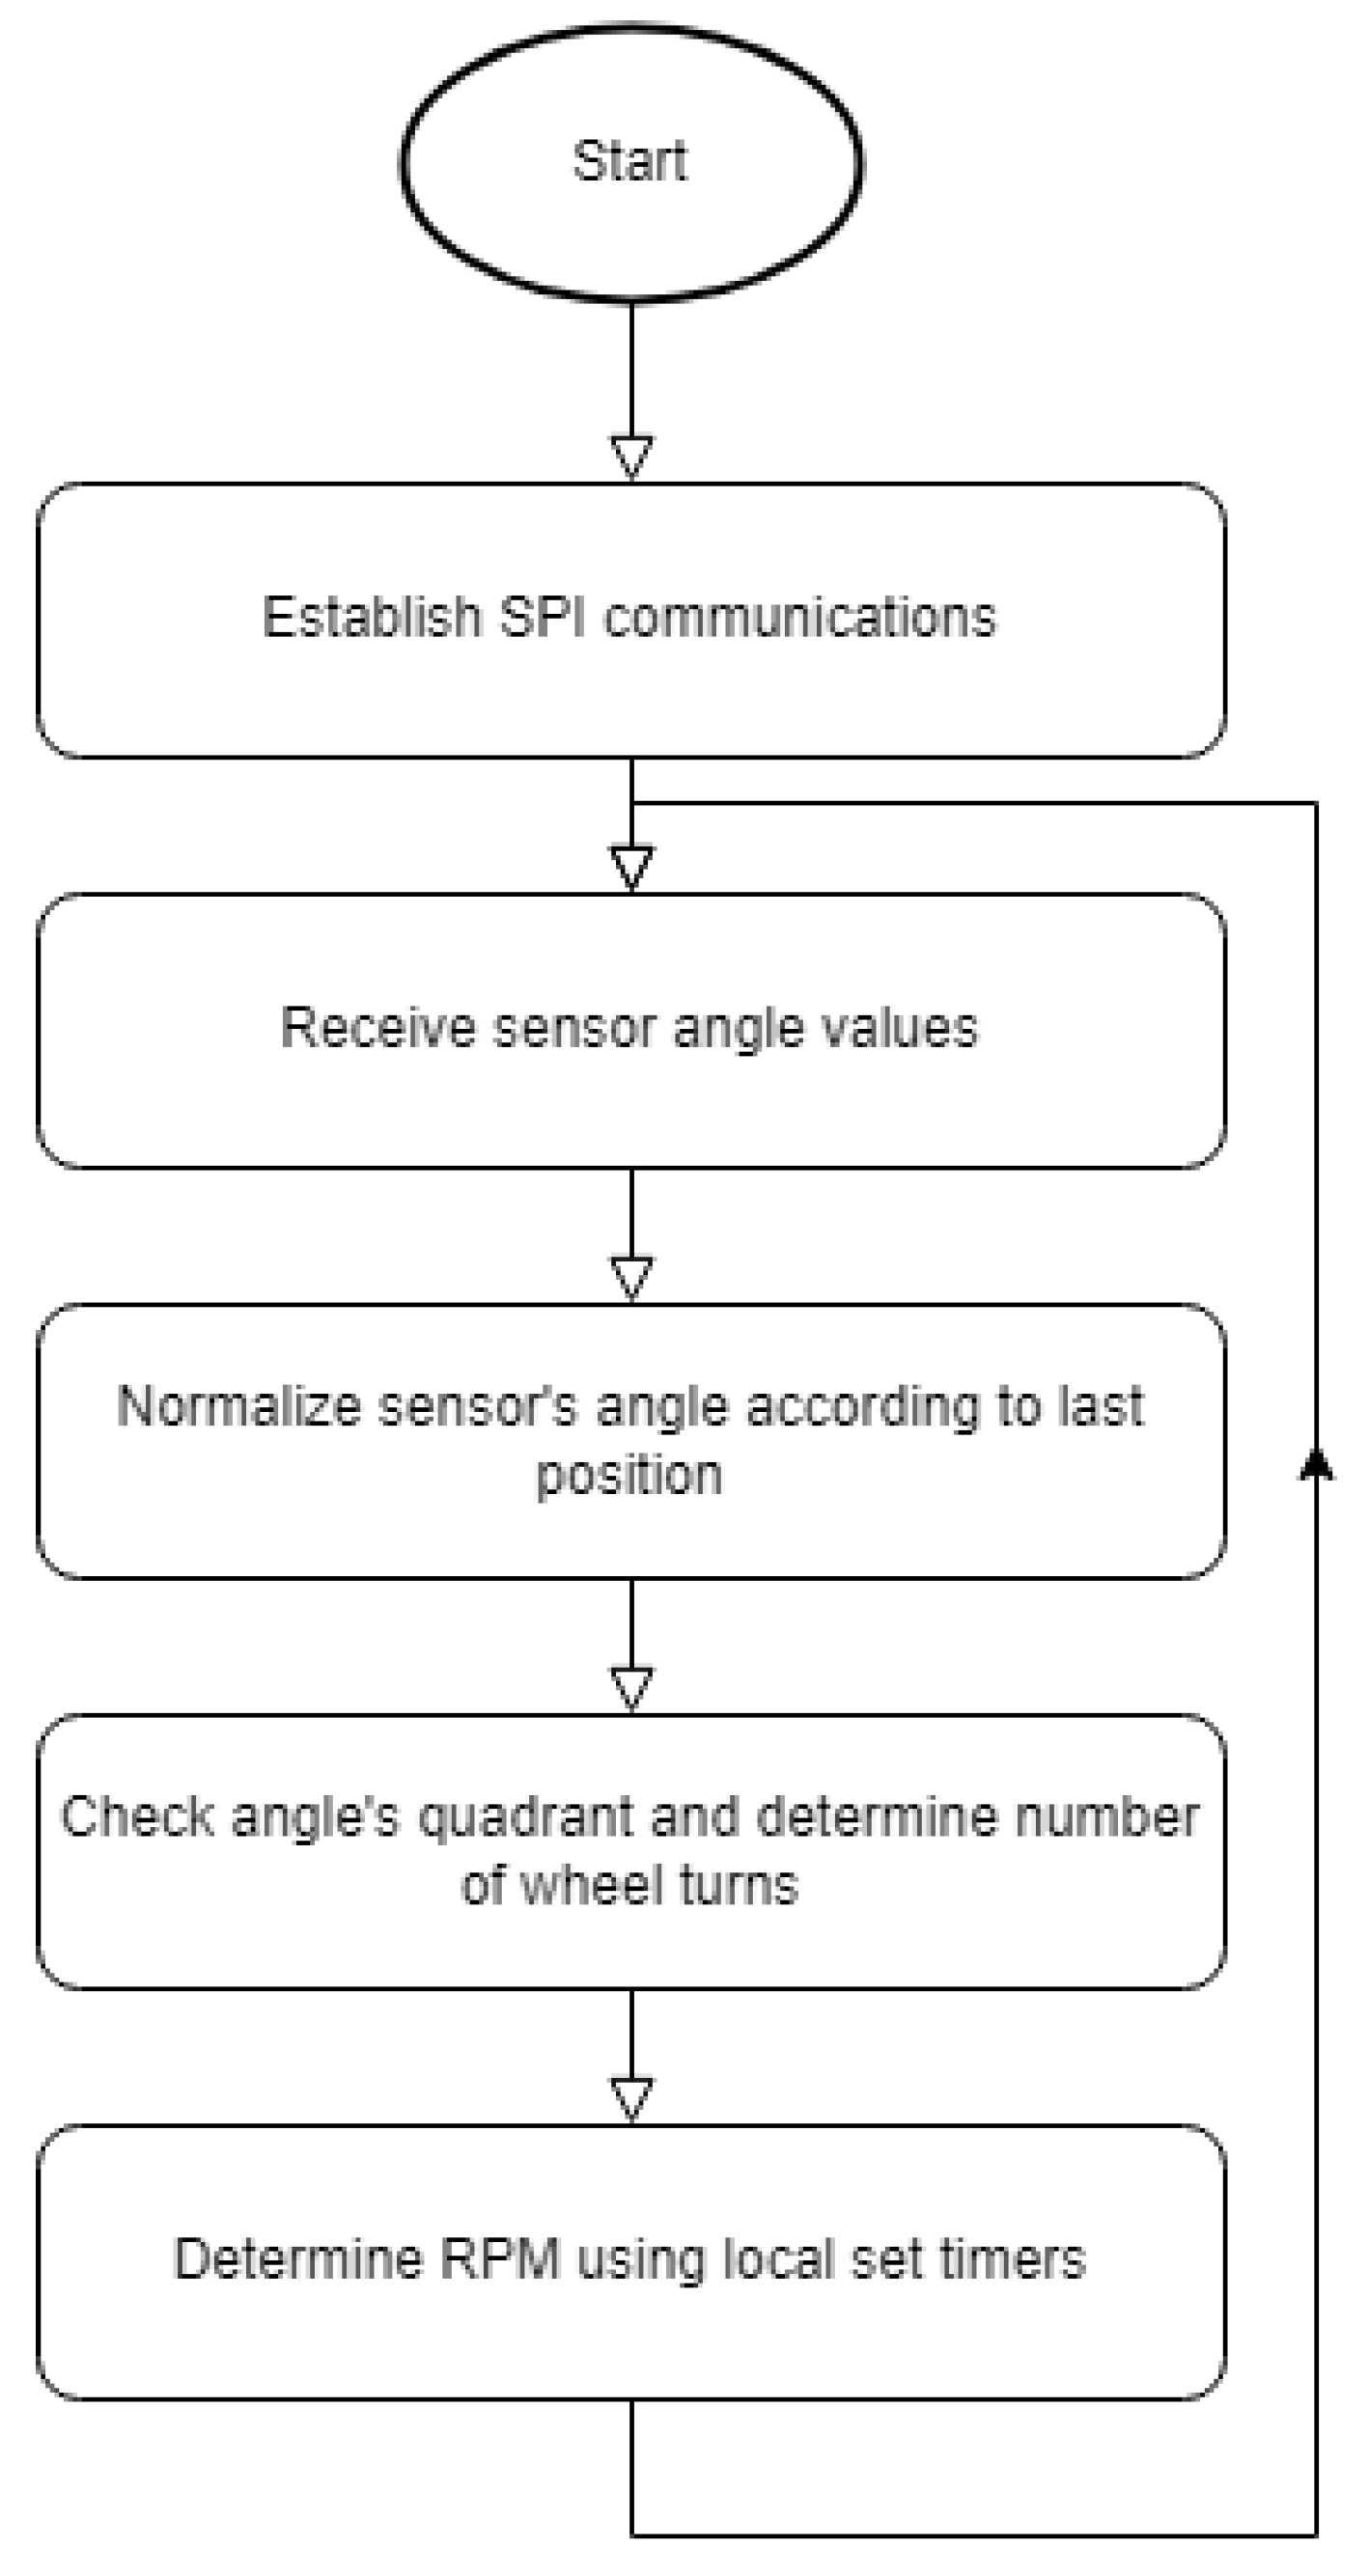
As a first approach, a magnetic rotary encoder was used combined with a PLC based on Arduino technology meant for professional industrial use. Magnetic encoders use a small, diametrically magnetized (two-pole) standard magnet to provide the angular position. Using SPI communication protocol, an application was implemented capable of receiving the magnet’s position in degrees and determining the amount turns of the conveyor wheel based on the last read value. The conveyor’s belt speed in rotations per minute can be calculated using local program timers and a count of revolution turns in each time frame. The process’s diagram of Figure 5 presents the used implementation’s algorithm.
After calculating the speed in rotations per minute, the conversion to mm/s can be performed using the radius of the conveyor wheel, and the value is sent to the laser sensor using the function GoTransform_SetSpeed(). However, this approach is not feasible because the value is sent to the laser and written in its flash memory. The problem is that the memory can only undergo a limited number of writes. As such, given that the primary use for this feature is the nearly constant update of the conveyor’s travel speed to ensure the correct precision, we cannot use this algorithm in the final implementation and require an alternative.
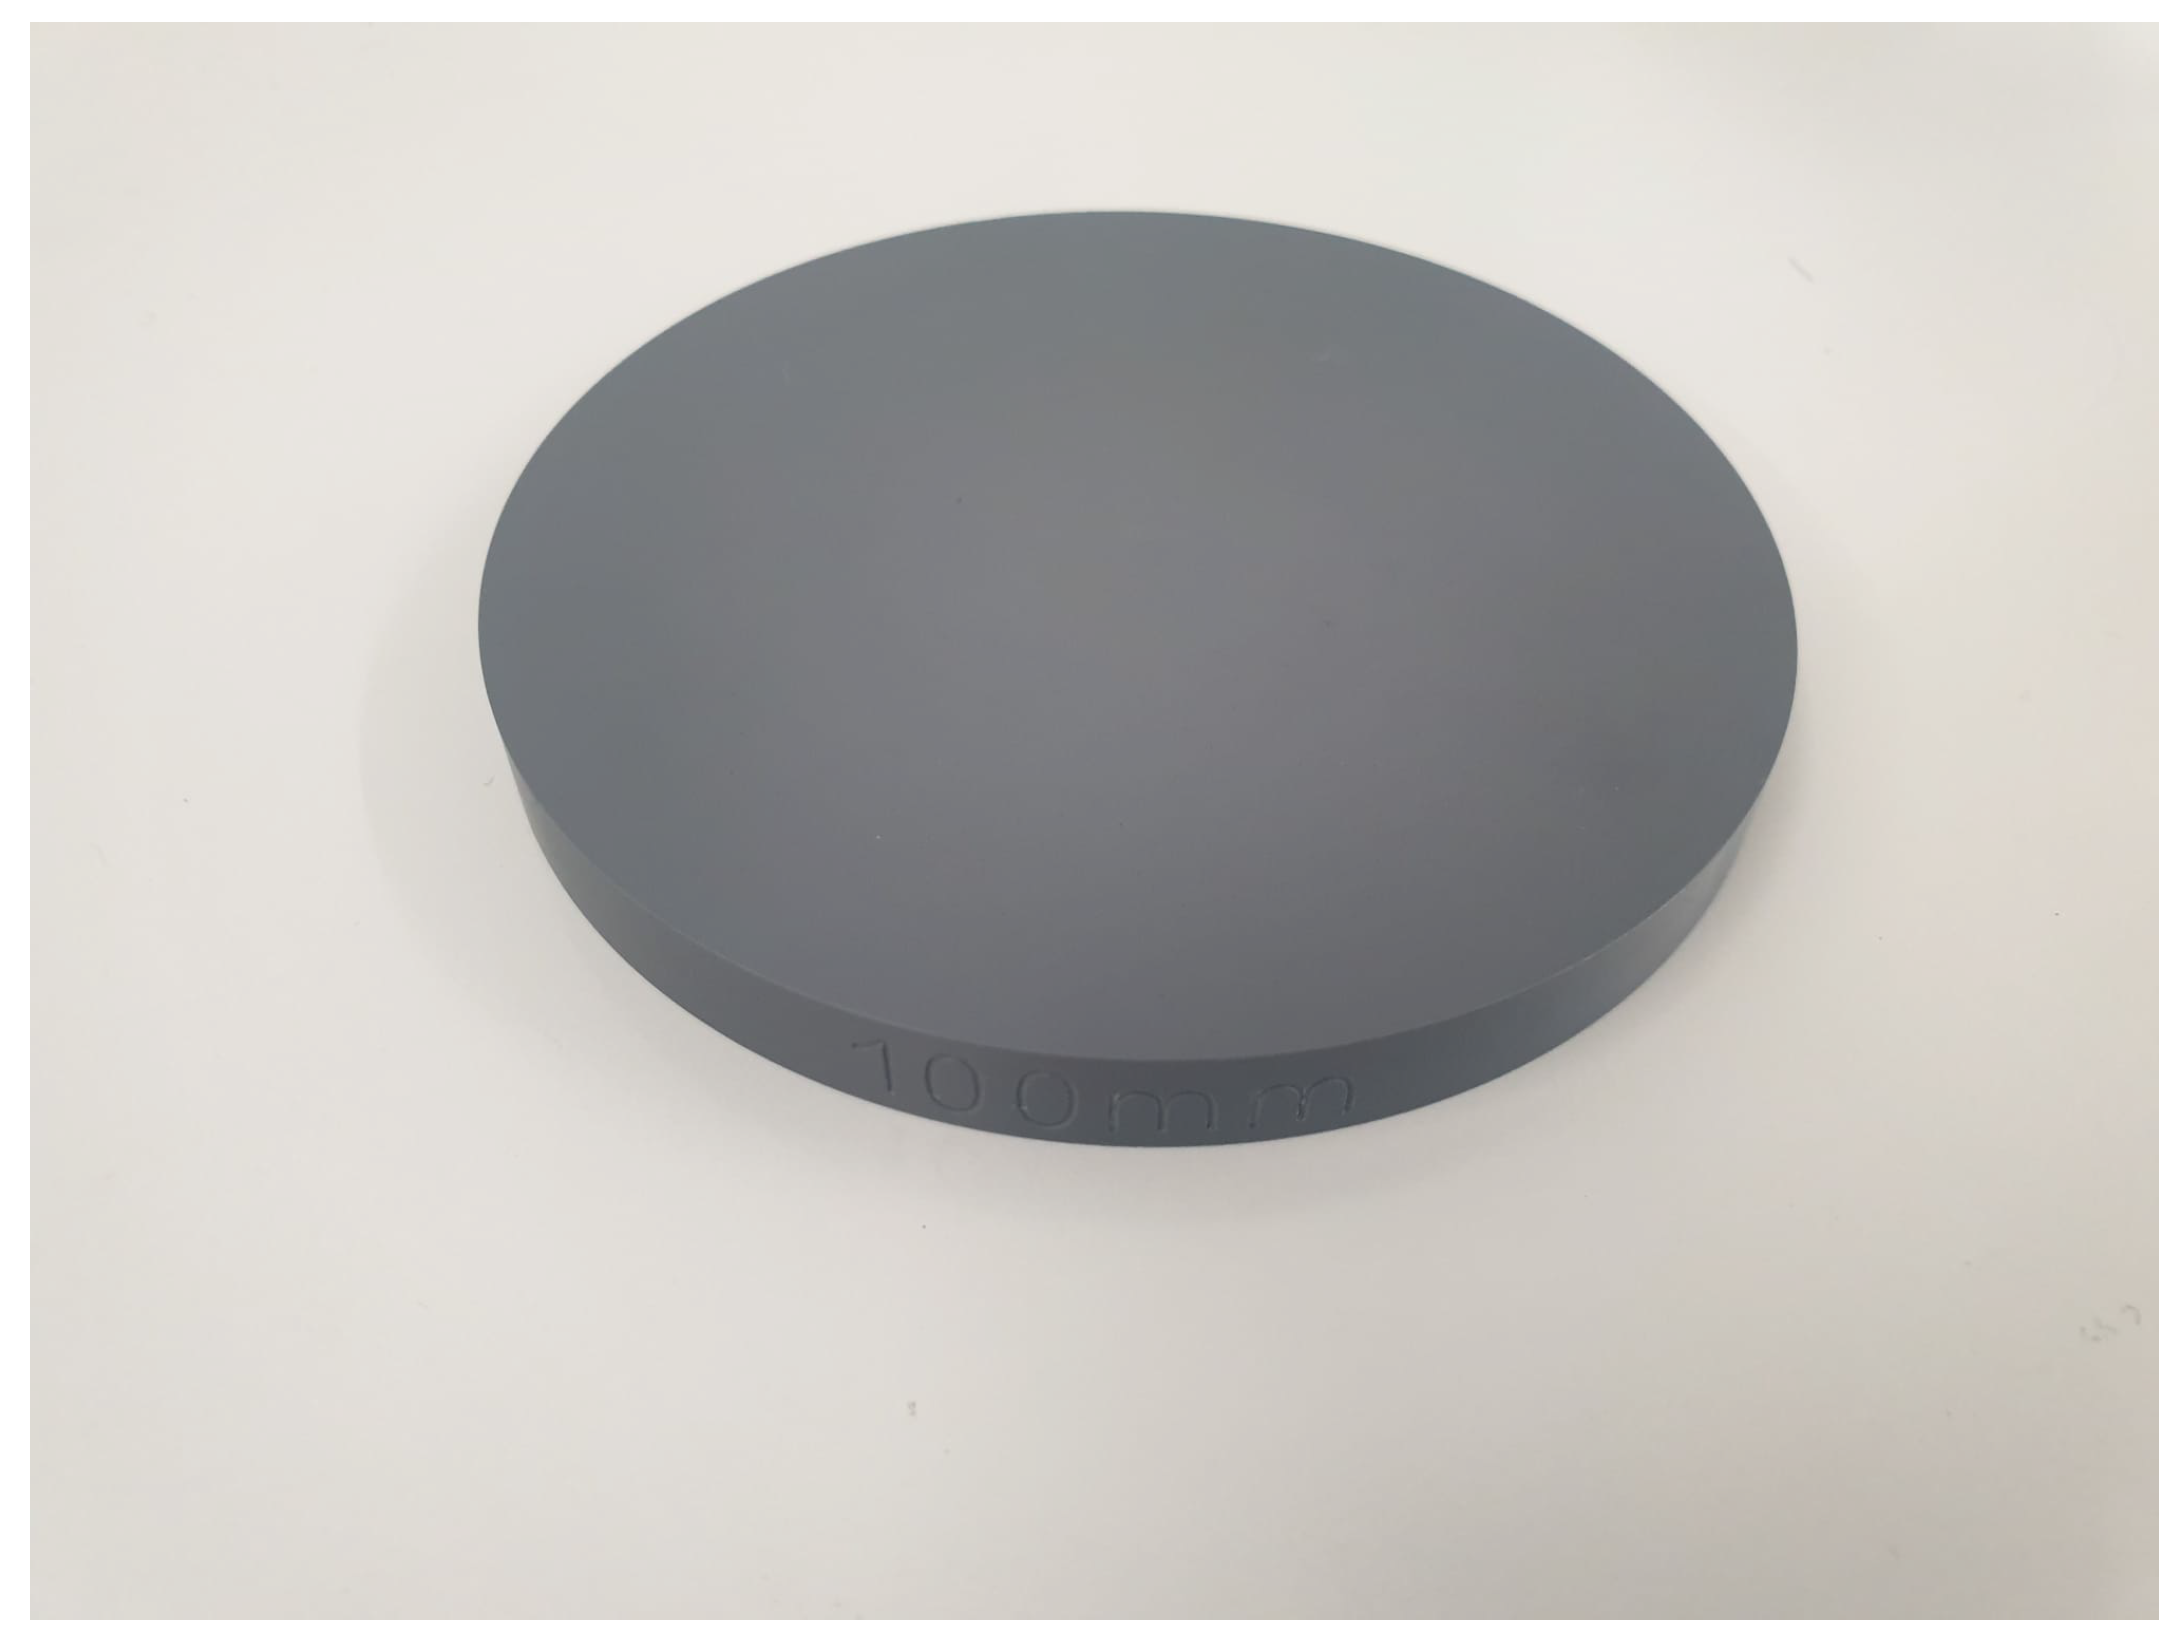
A possible alternative is calibrating the travel speed using the calibration disk provided by LMI. The assembled conveyor and the mounted laser allow for suitable data acquisition. The user can manually control the conveyors’ motor speed so the object can be transported through the laser beam at a constant rate. This feature allows for the correct calibration of the sensor using a calibration disk, shown in Figure 6, or using the built-in capabilities of the encoder connection.

3.3. Acquisition

By analyzing the features present in the laser, there are different possible operation modes:
  • Video
    Outputs video images captured by the sensor.
  • Profile
    Outputs profiles and profile measurements. These profiles are produced by processing video images captured by the sensor.
  • Surface
    Outputs 3D point clouds and performs surface measurements.
Both the profile and surface modes can output a height map of the analyzed object. The height map is output through the laser with the object data read through the sensor. Each profile is read, and the whole surface is reconstructed according to the object’s current moving speed.
The surface mode can generate a CSV file containing the object’s data. On a first approach, it is possible to try and receive the complete object data set.
However, it was considered more suitable to individually receive the object’s profiles and later reconstruct the entire object surface, thus leading to the use of profile mode. This method provides a more feasible approach due to possible reading errors in the surface mode. It is possible to filter or discard incoming data by receiving each profile individually, and there is no need to rely on the CSV file generated by the sensor’s software. Another reason for choosing the profile over the surface mode is the increase in the sensor’s CPU usage. These high levels can cause delays in the sensor’s communications system, specifically, a reduction in the ethernet output rates.
The developed application processes the received profiles, and the final result is a 2D depth matrix containing the x, y, and z values of each data point captured and filtered by the scanner, as shown in Figure 7.
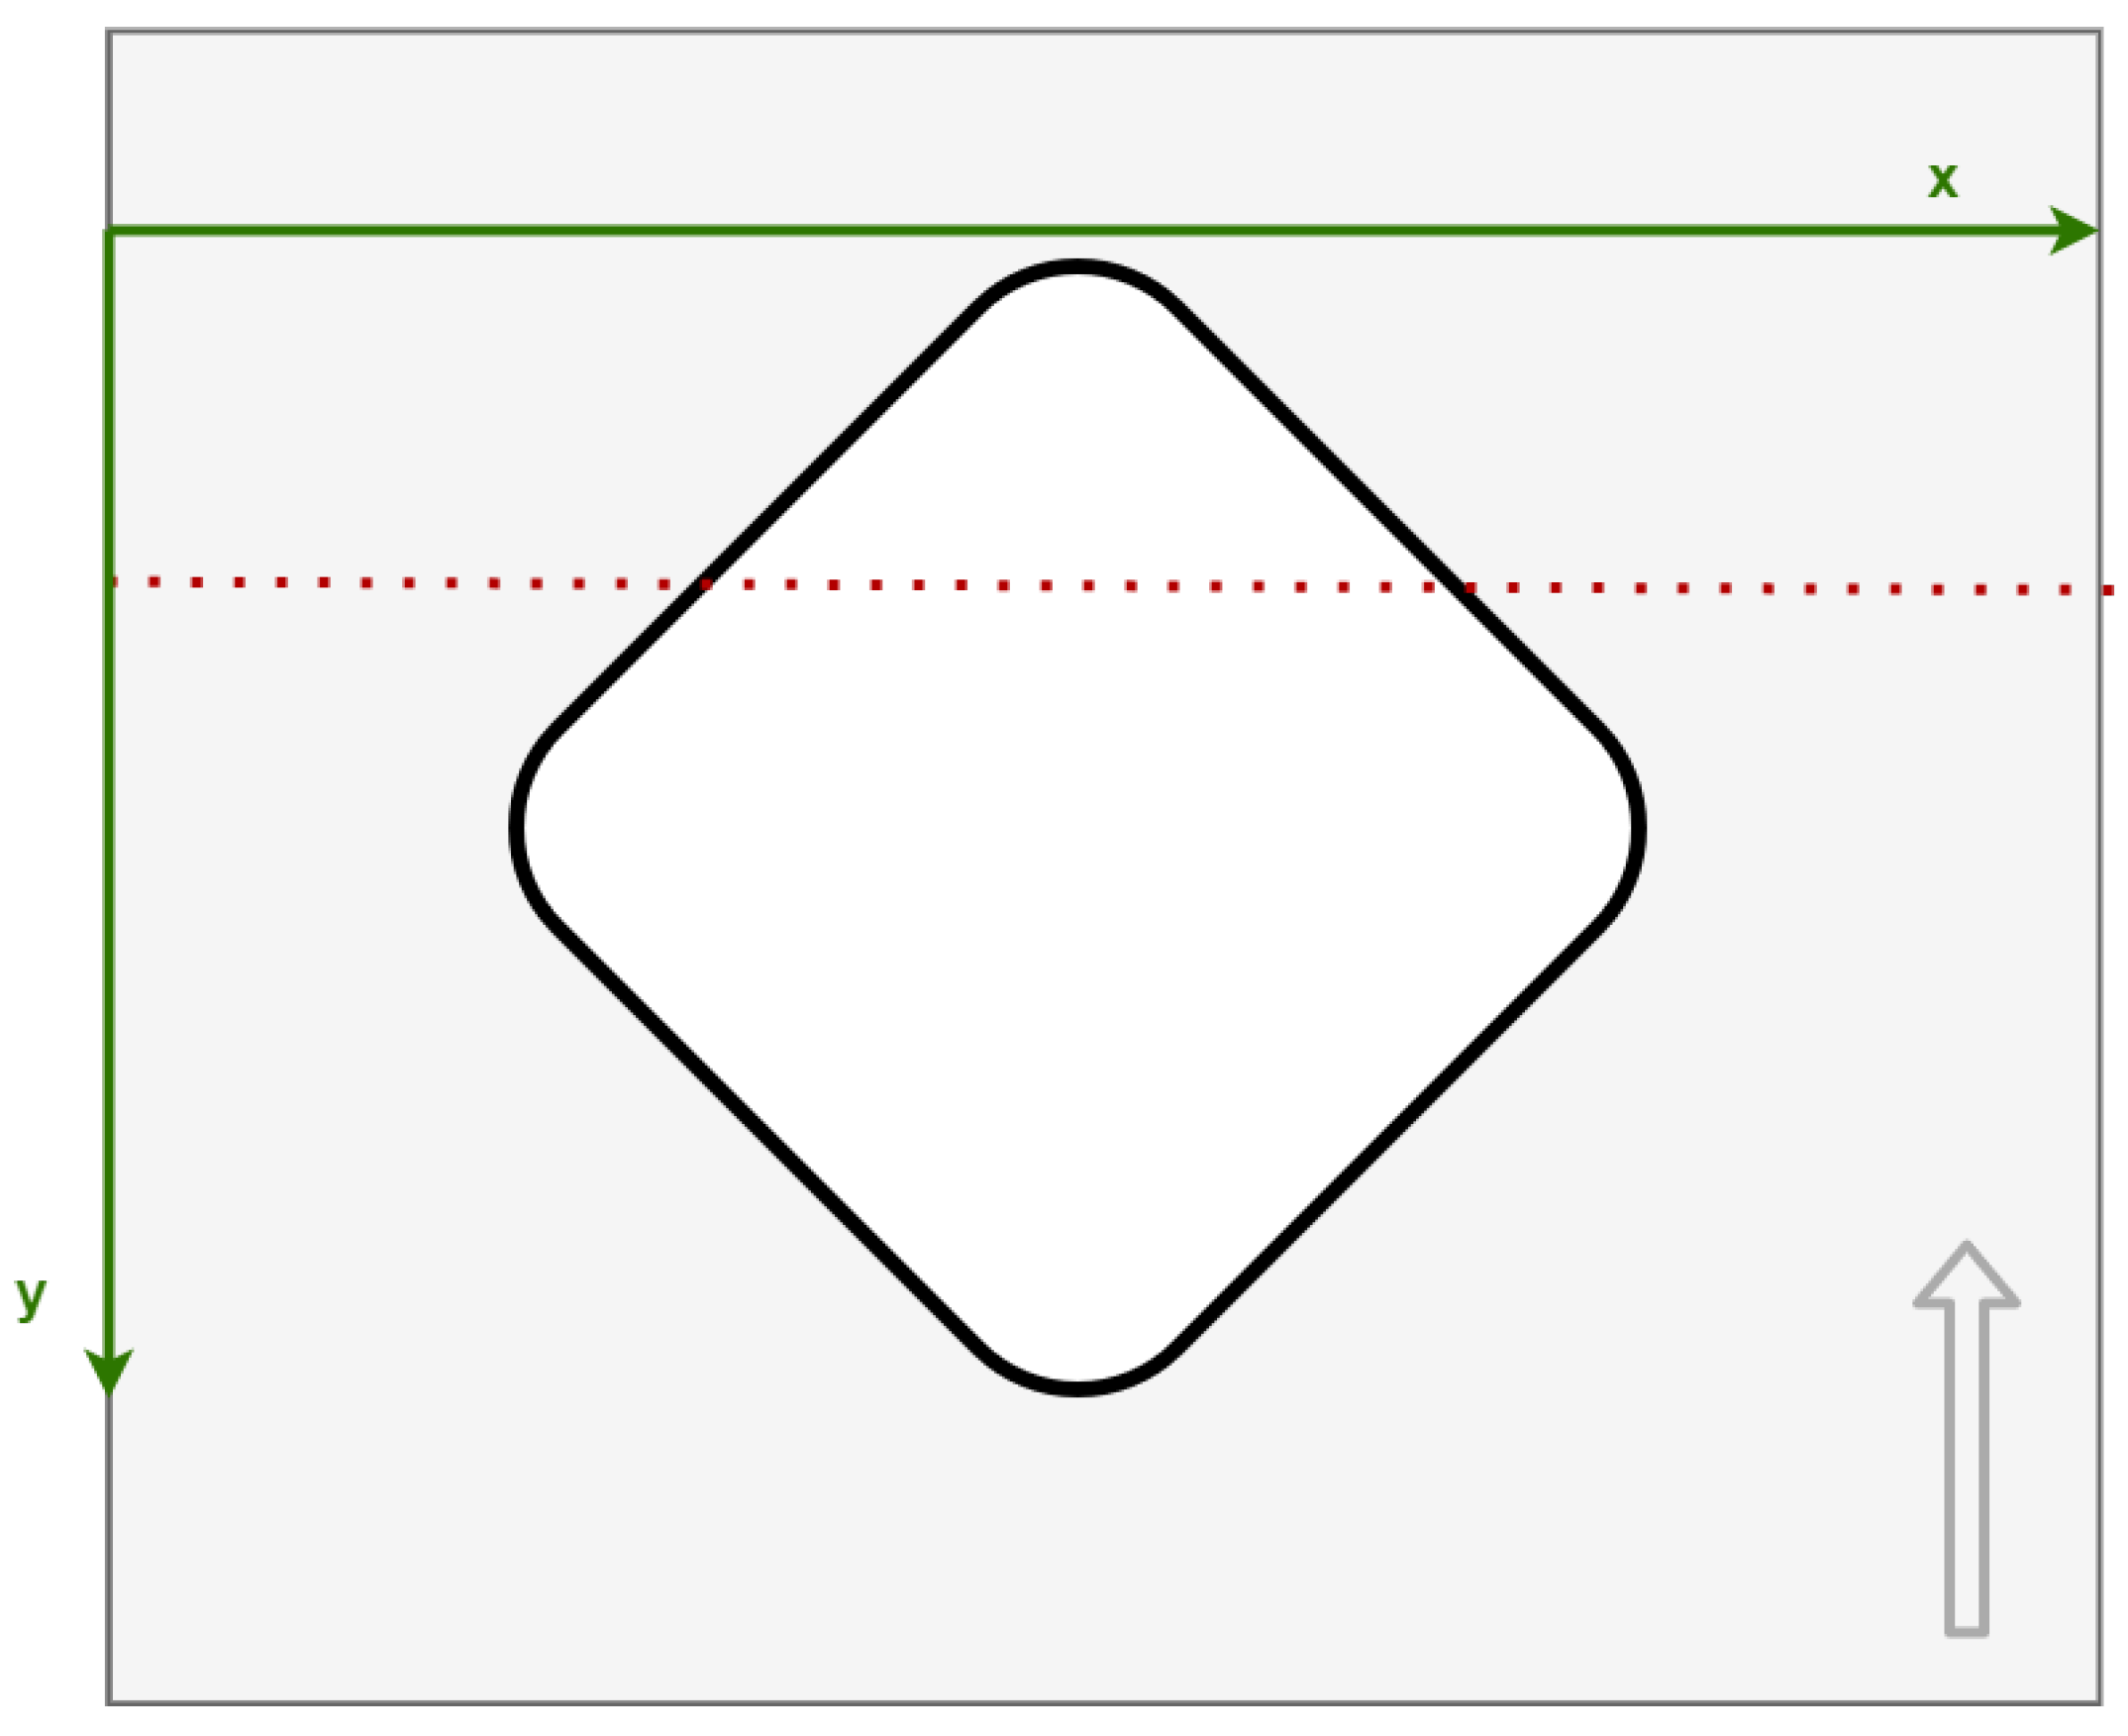
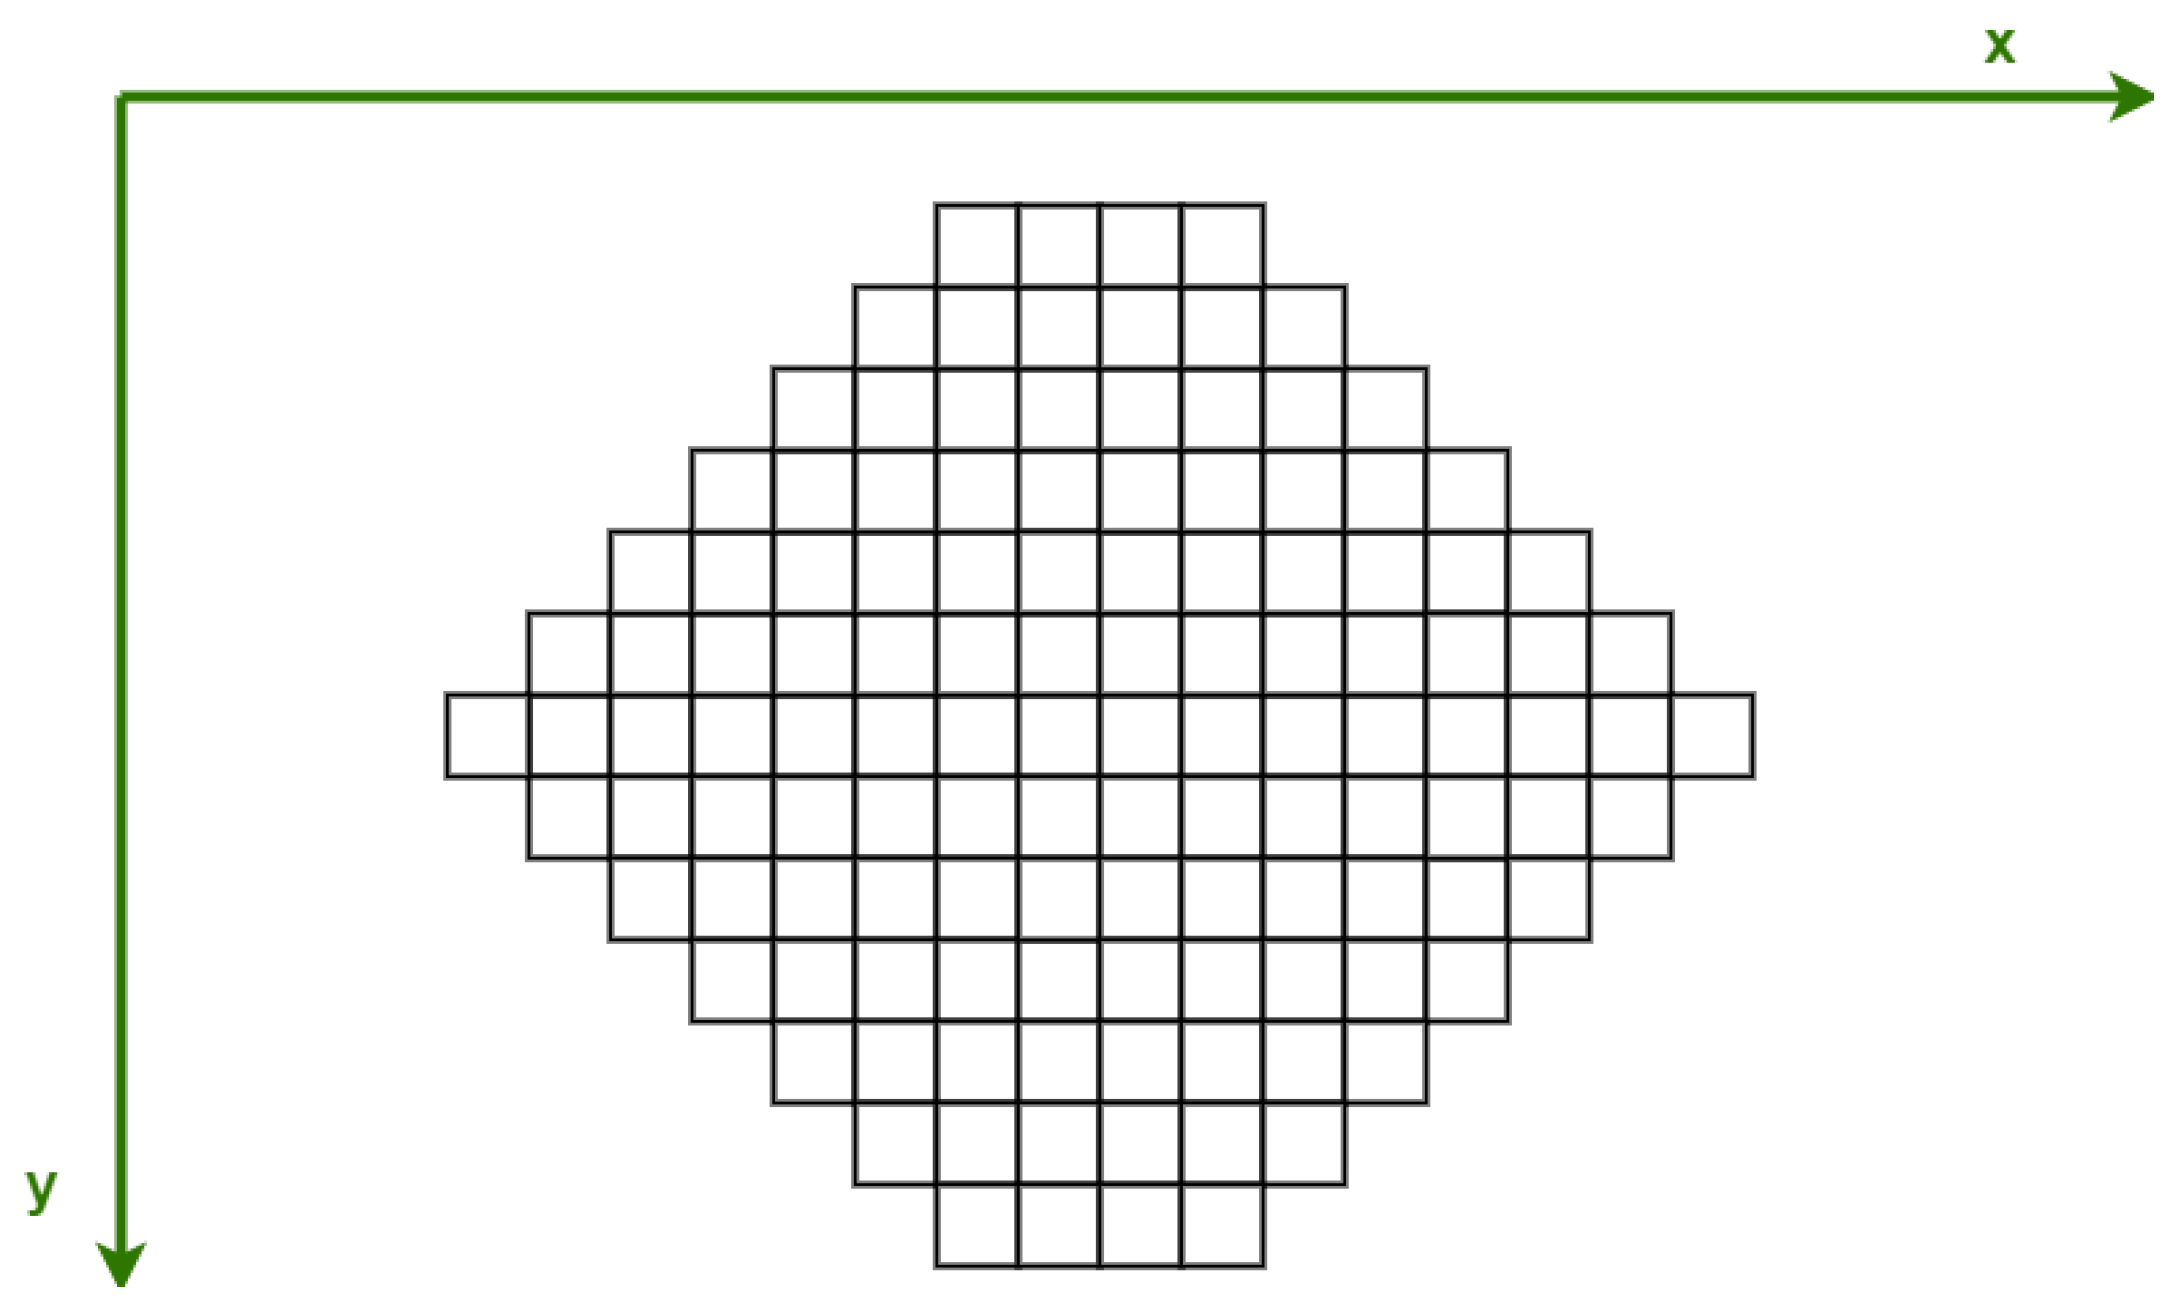
Given that the profiles sent through the sensor contain the object and its surrounding, it is essential to isolate the piece’s point cloud. This process is performed using a height threshold defined by the user regarding the minimum height of the ceramic pieces. In the studied scenarios, the minimum height of the items was 10 mm. As such, 9 mm was chosen as the threshold height value for this application. The final result is a 2D depth matrix filled with zeros except for the points belonging to the object’s surface, as shown in Figure 8.

4. Data Processing

4.1. Used Functions

The system’s overall logic is presented in Figure 9.

4.2. Library Function

The logic and used function to enable the device’s communications are presented in Figure 10.
The official Gocator GoSDK C language library provides the necessary functions for ethernet communication. The list of used functions is presented in Table 1.

4.3. Developed Algorithms

Firstly, the functions presented in Section 4.2 were used to establish communications with the laser. Secondly, it is necessary to analyze and process the acquired data for several objectives, including determining the object’s center, the distance to its boundaries, and the height of its border, which proved more complex due to the possible varying value of the border distance to its center point. The value is ideally constant only for circular shapes. However, the application is meant to calculate several distances in rotational order even if the object’s shape is non-circular.

4.4. Center Point

4.4.1. Algorithm

One of the objectives of this project is to determine the value of the center point of the ceramic piece. After acquiring the point cloud as a 2D depth matrix, the data model can be analyzed to obtain the required values.
A height threshold is used to remove profile outliers, resulting in a point cloud filled with zeros except for the scan of the object above the height threshold, thus isolating the object in the model.
The usual method for finding the center of mass of an object uses the weighted values of each point of the point cloud model, which in this case is the object’s height at each captured point. For a global scenario, the center of mass of an object can be calculated as shown in Equation (1).
X = i x i z i M
For this approach, the test pieces are considered uniform. The 3D scan is projected onto a 2D plane, and each point’s height is considered a unitary value for the calculations. The total projection of the object allows for the correct identification of the center point while not being interfered with by the possibly different heights of each point. As such, the following equations are used for the final calculations:
X = i x i M
Y = i y i M
where:
  • x i : x coordinate of the point i;
  • y i : y coordinate of the point i;
  • z i : z coordinate of the point i;
  • X: center value in the x-axis;
  • Y: center value in the y-axis;
  • M: number of points in the point cloud where the height is above the predefined threshold, i.e., the number of points where the z value is different than zero.
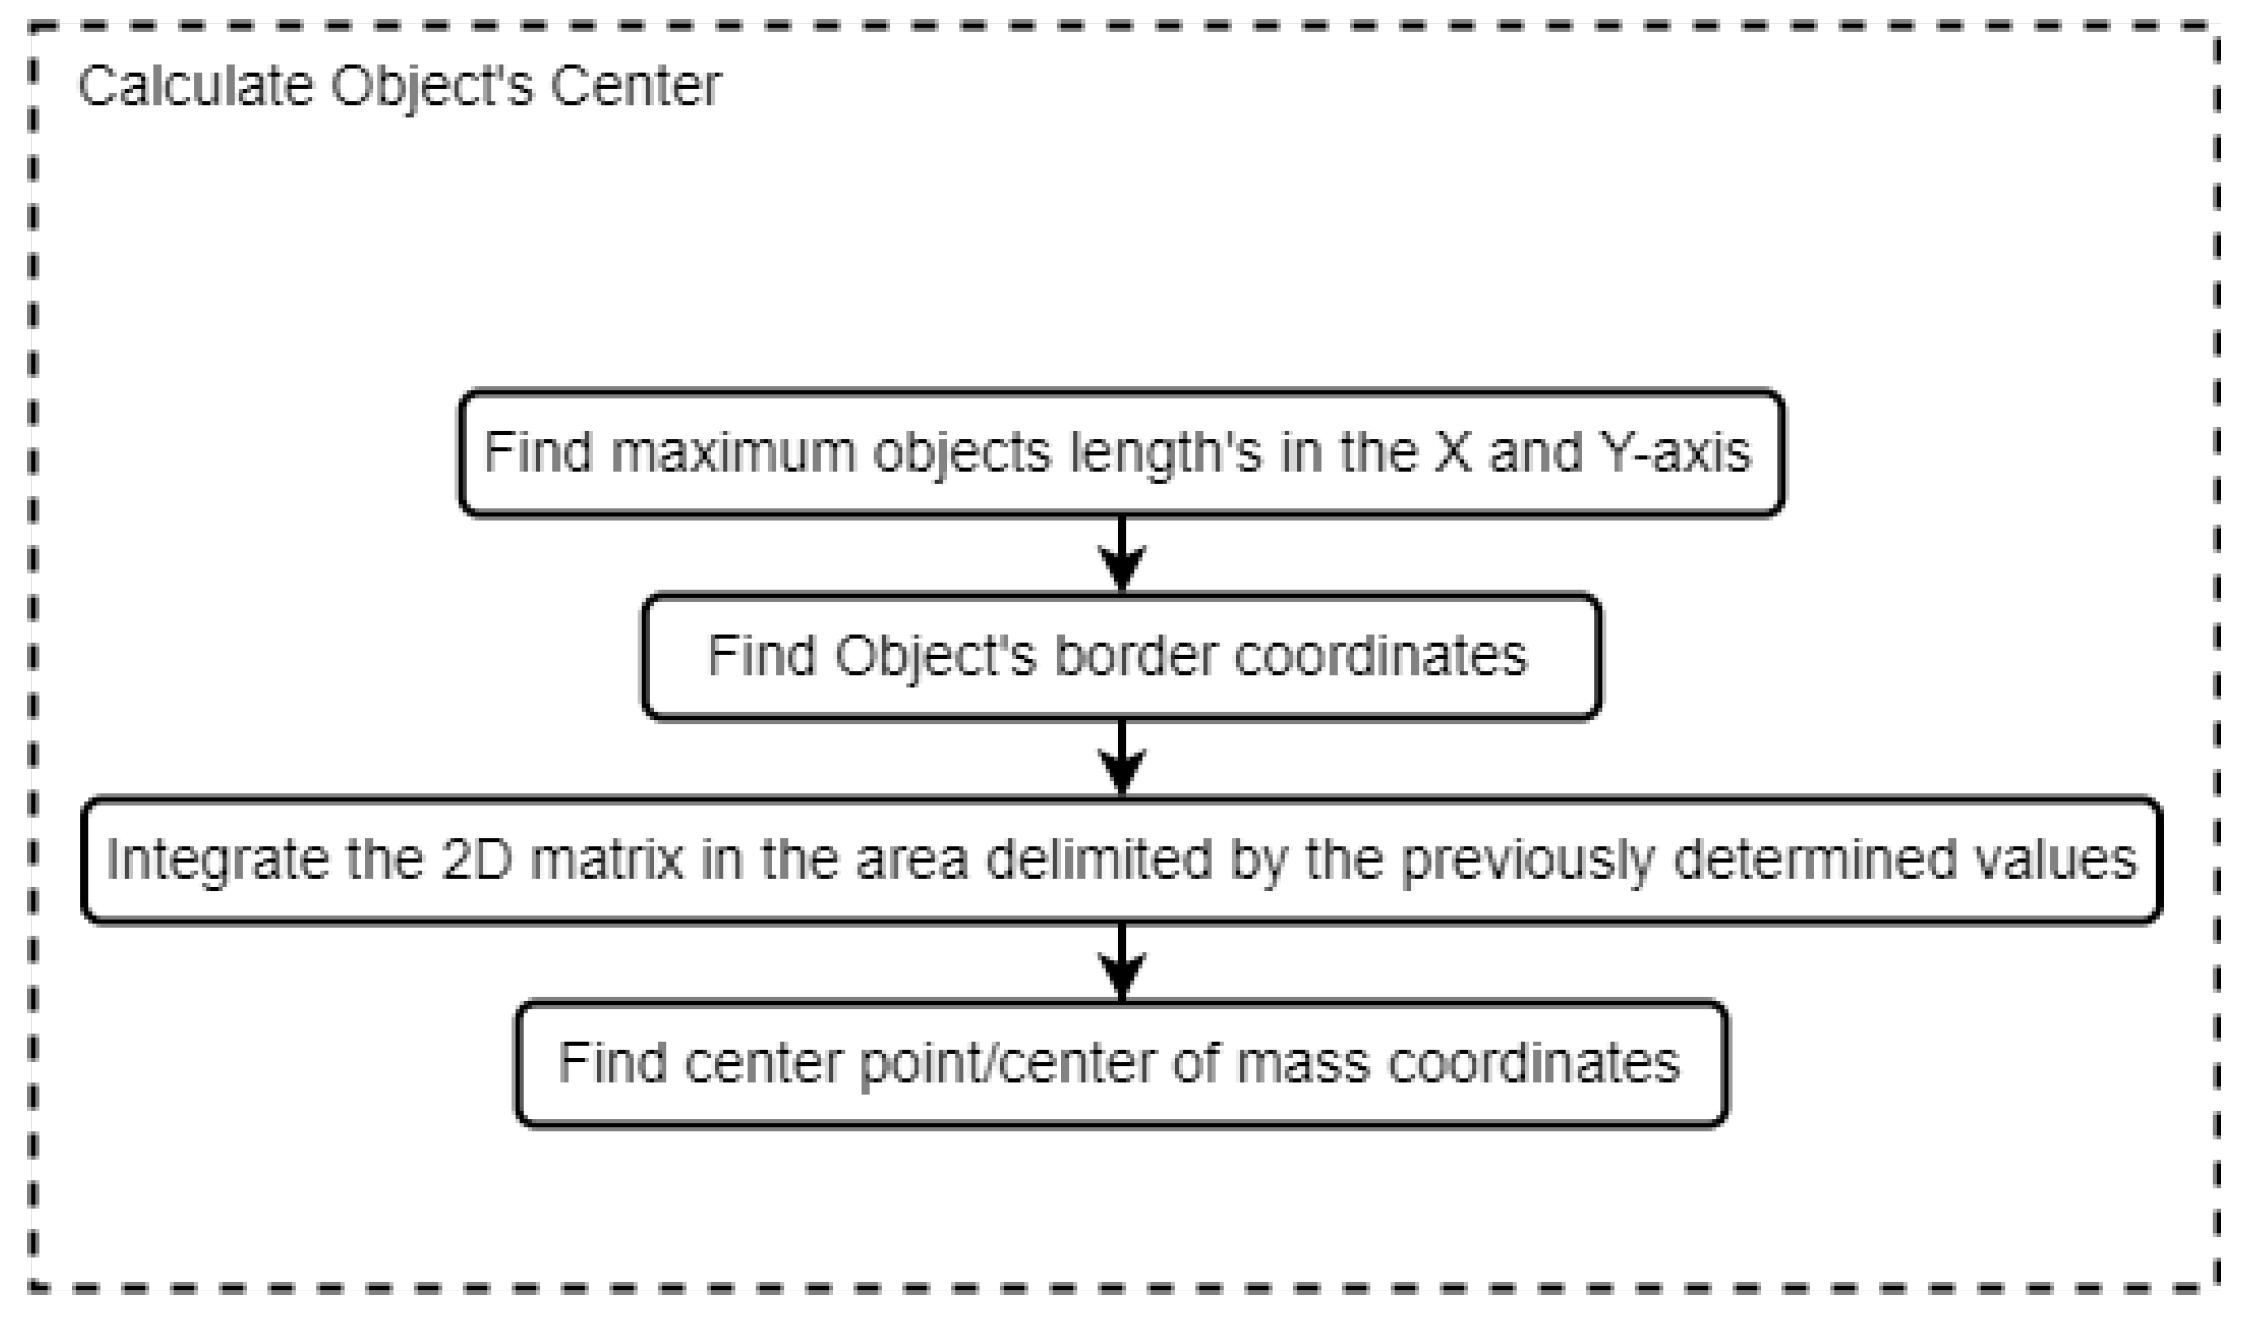
The overall process is describe in Figure 11.

4.4.2. Results

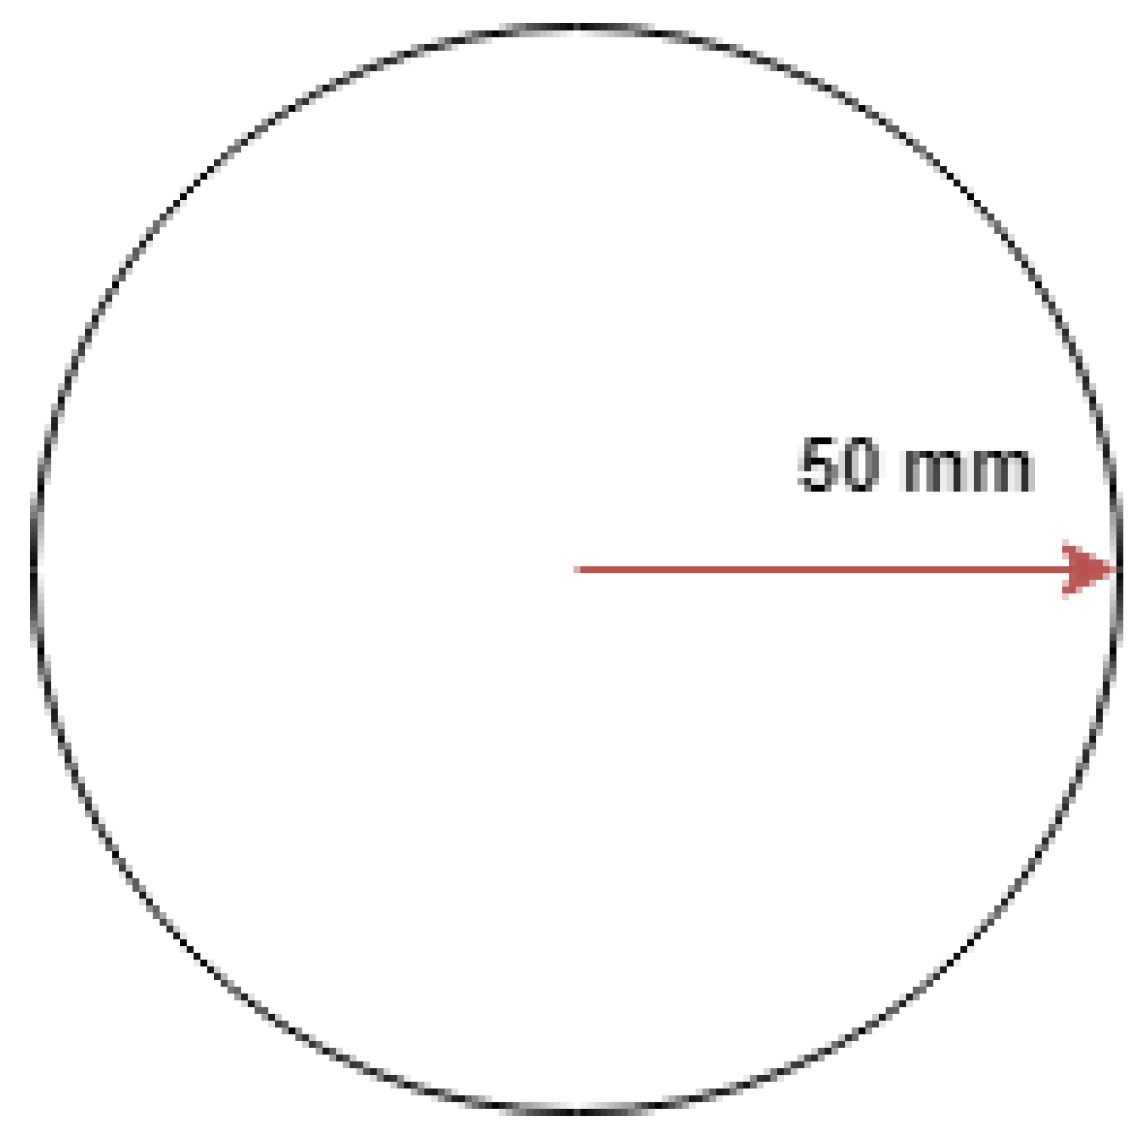
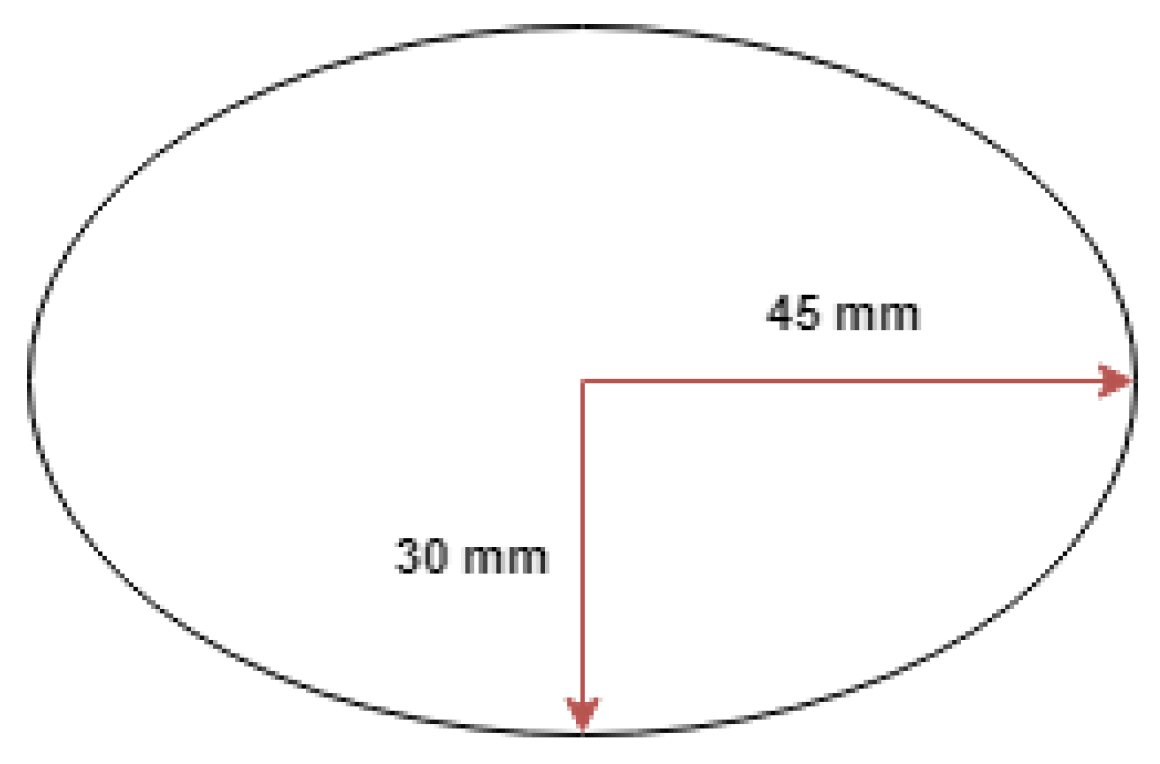
Different-shaped objects were tested to better understand the influence of the object’s shape with the proposed algorithms. These were designed to test the algorithms’ accuracy and precision in multiple situations and object orientation. Figure 12 represents a circular item in which the distance of the border to the center is constant. Opposite the circular object, Figure 13 and Figure 14 represent test items with varying distances from the border to the center point.
Fifty experiments were performed to read each object’s shape and consequent calculations to achieve a reliable average result. Each experiment passed the item through the laser beam at a constant speed of approximately 150 mm/s.
The average errors for each of the X and Y-axis and each shape are presented in Table 2.
An analysis of Table 2 shows a higher level of uncertainty in the values captured in the Y-axis. The most significant cause of this problem is the correct calibration of the profile reads. As locally set timers and time intervals are currently being used for accounting for new profile reads and have no precise way to control the conveyor’s speed except for its manual dial, higher error values may occur. One possible solution, which has not yet been implemented, is incorporating the rotary encoder, which provides a higher precision of the traveled distance of an object in the conveyor belt. This value allows for the precise Y-axis mapping and achieves lesser error values.

4.5. Distance to Center

4.5.1. Algorithm

Another requirement is to determine the distance of the farthest points to its center point. These values are used to assist in the item’s rotation against the polishing tool. The distance can be constant in the case of circular pieces but may also vary, for example, a square-shaped plate.
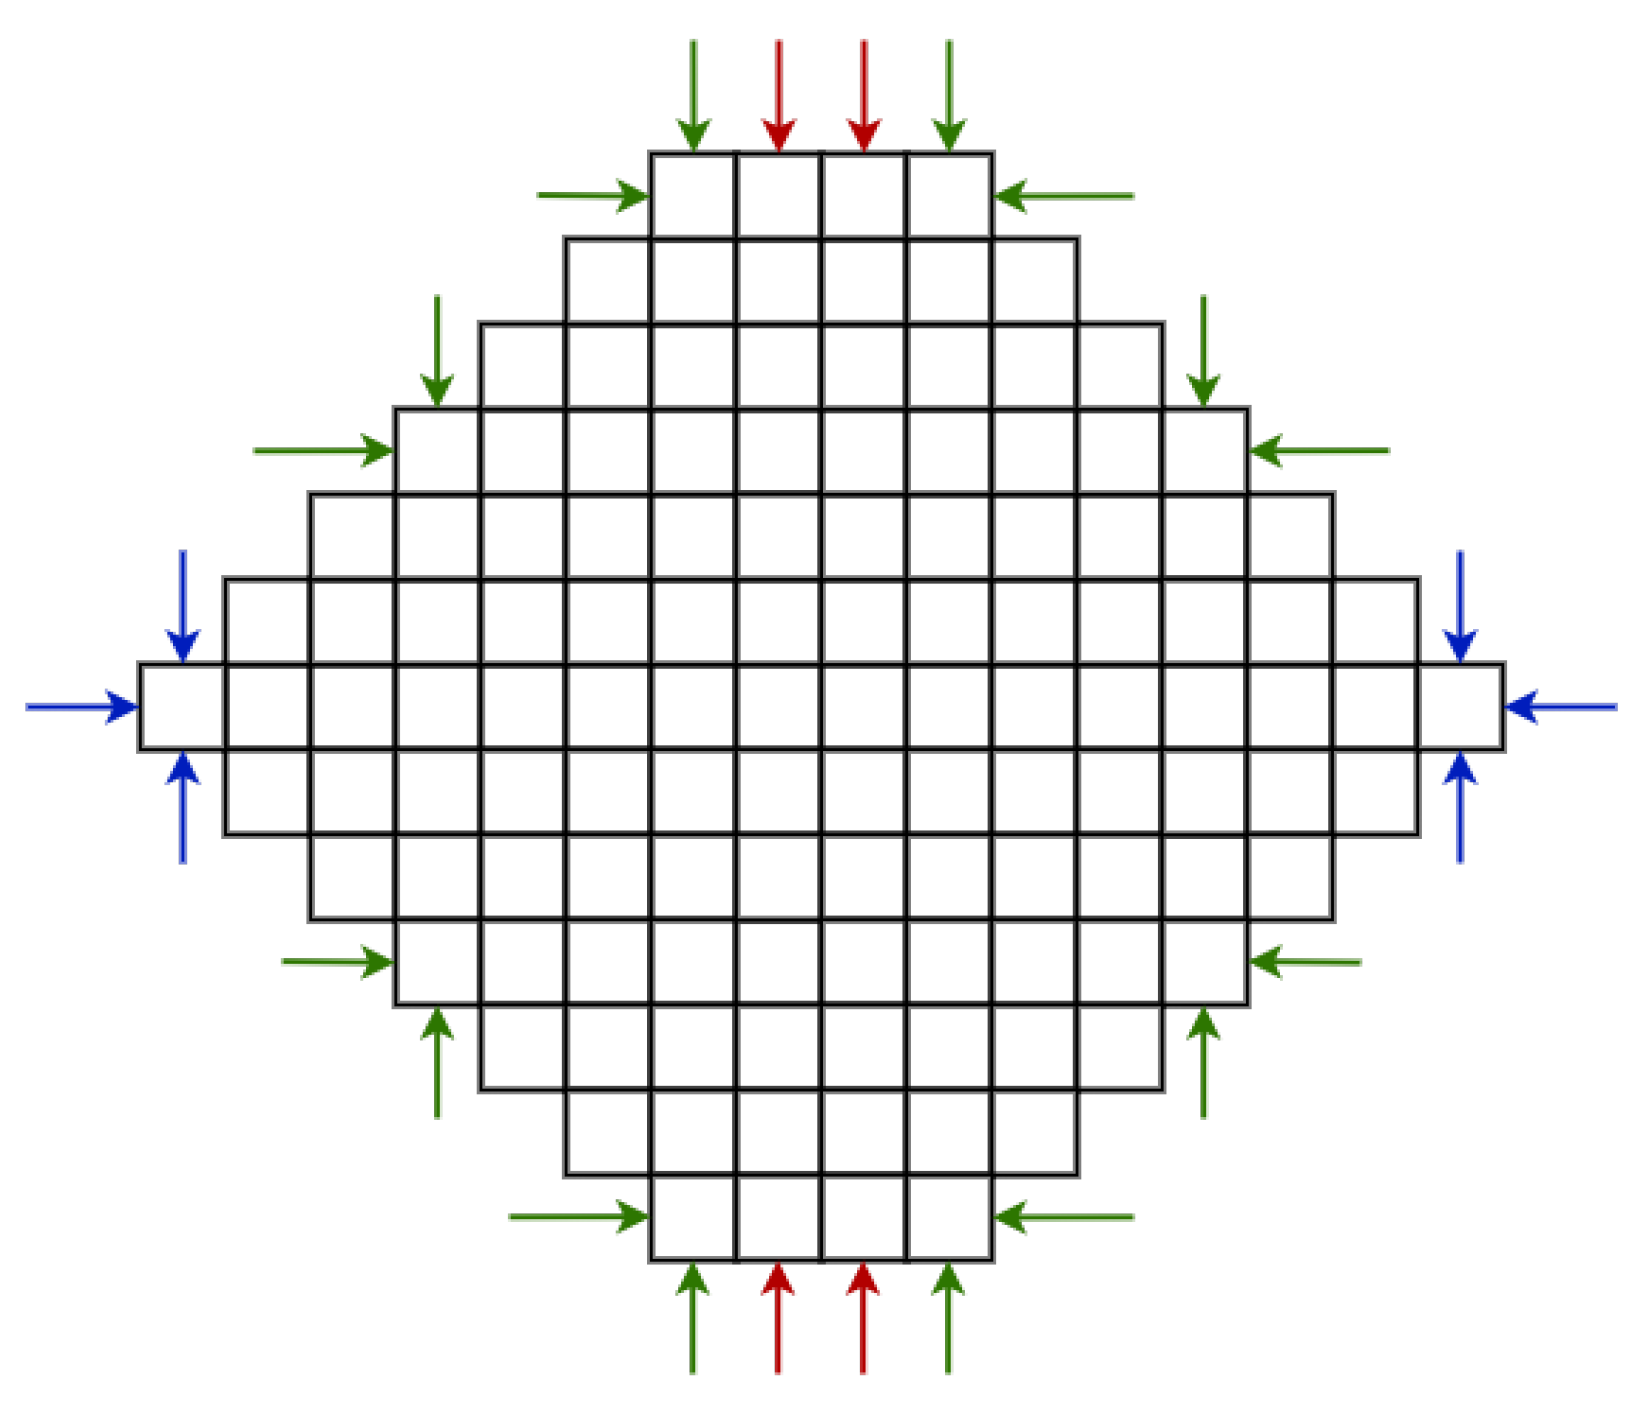
The process starts by analyzing the 2D depth matrix and finding the object’s border points of the top and bottom rows and the limits on the right and left sides. This sequential analysis of the model provides an array of points. However, some edges of the model may be subject to two or three analyses and are repeatedly considered as border values, as shown in Figure 15. As such, the array is filtered to delete duplicate values.
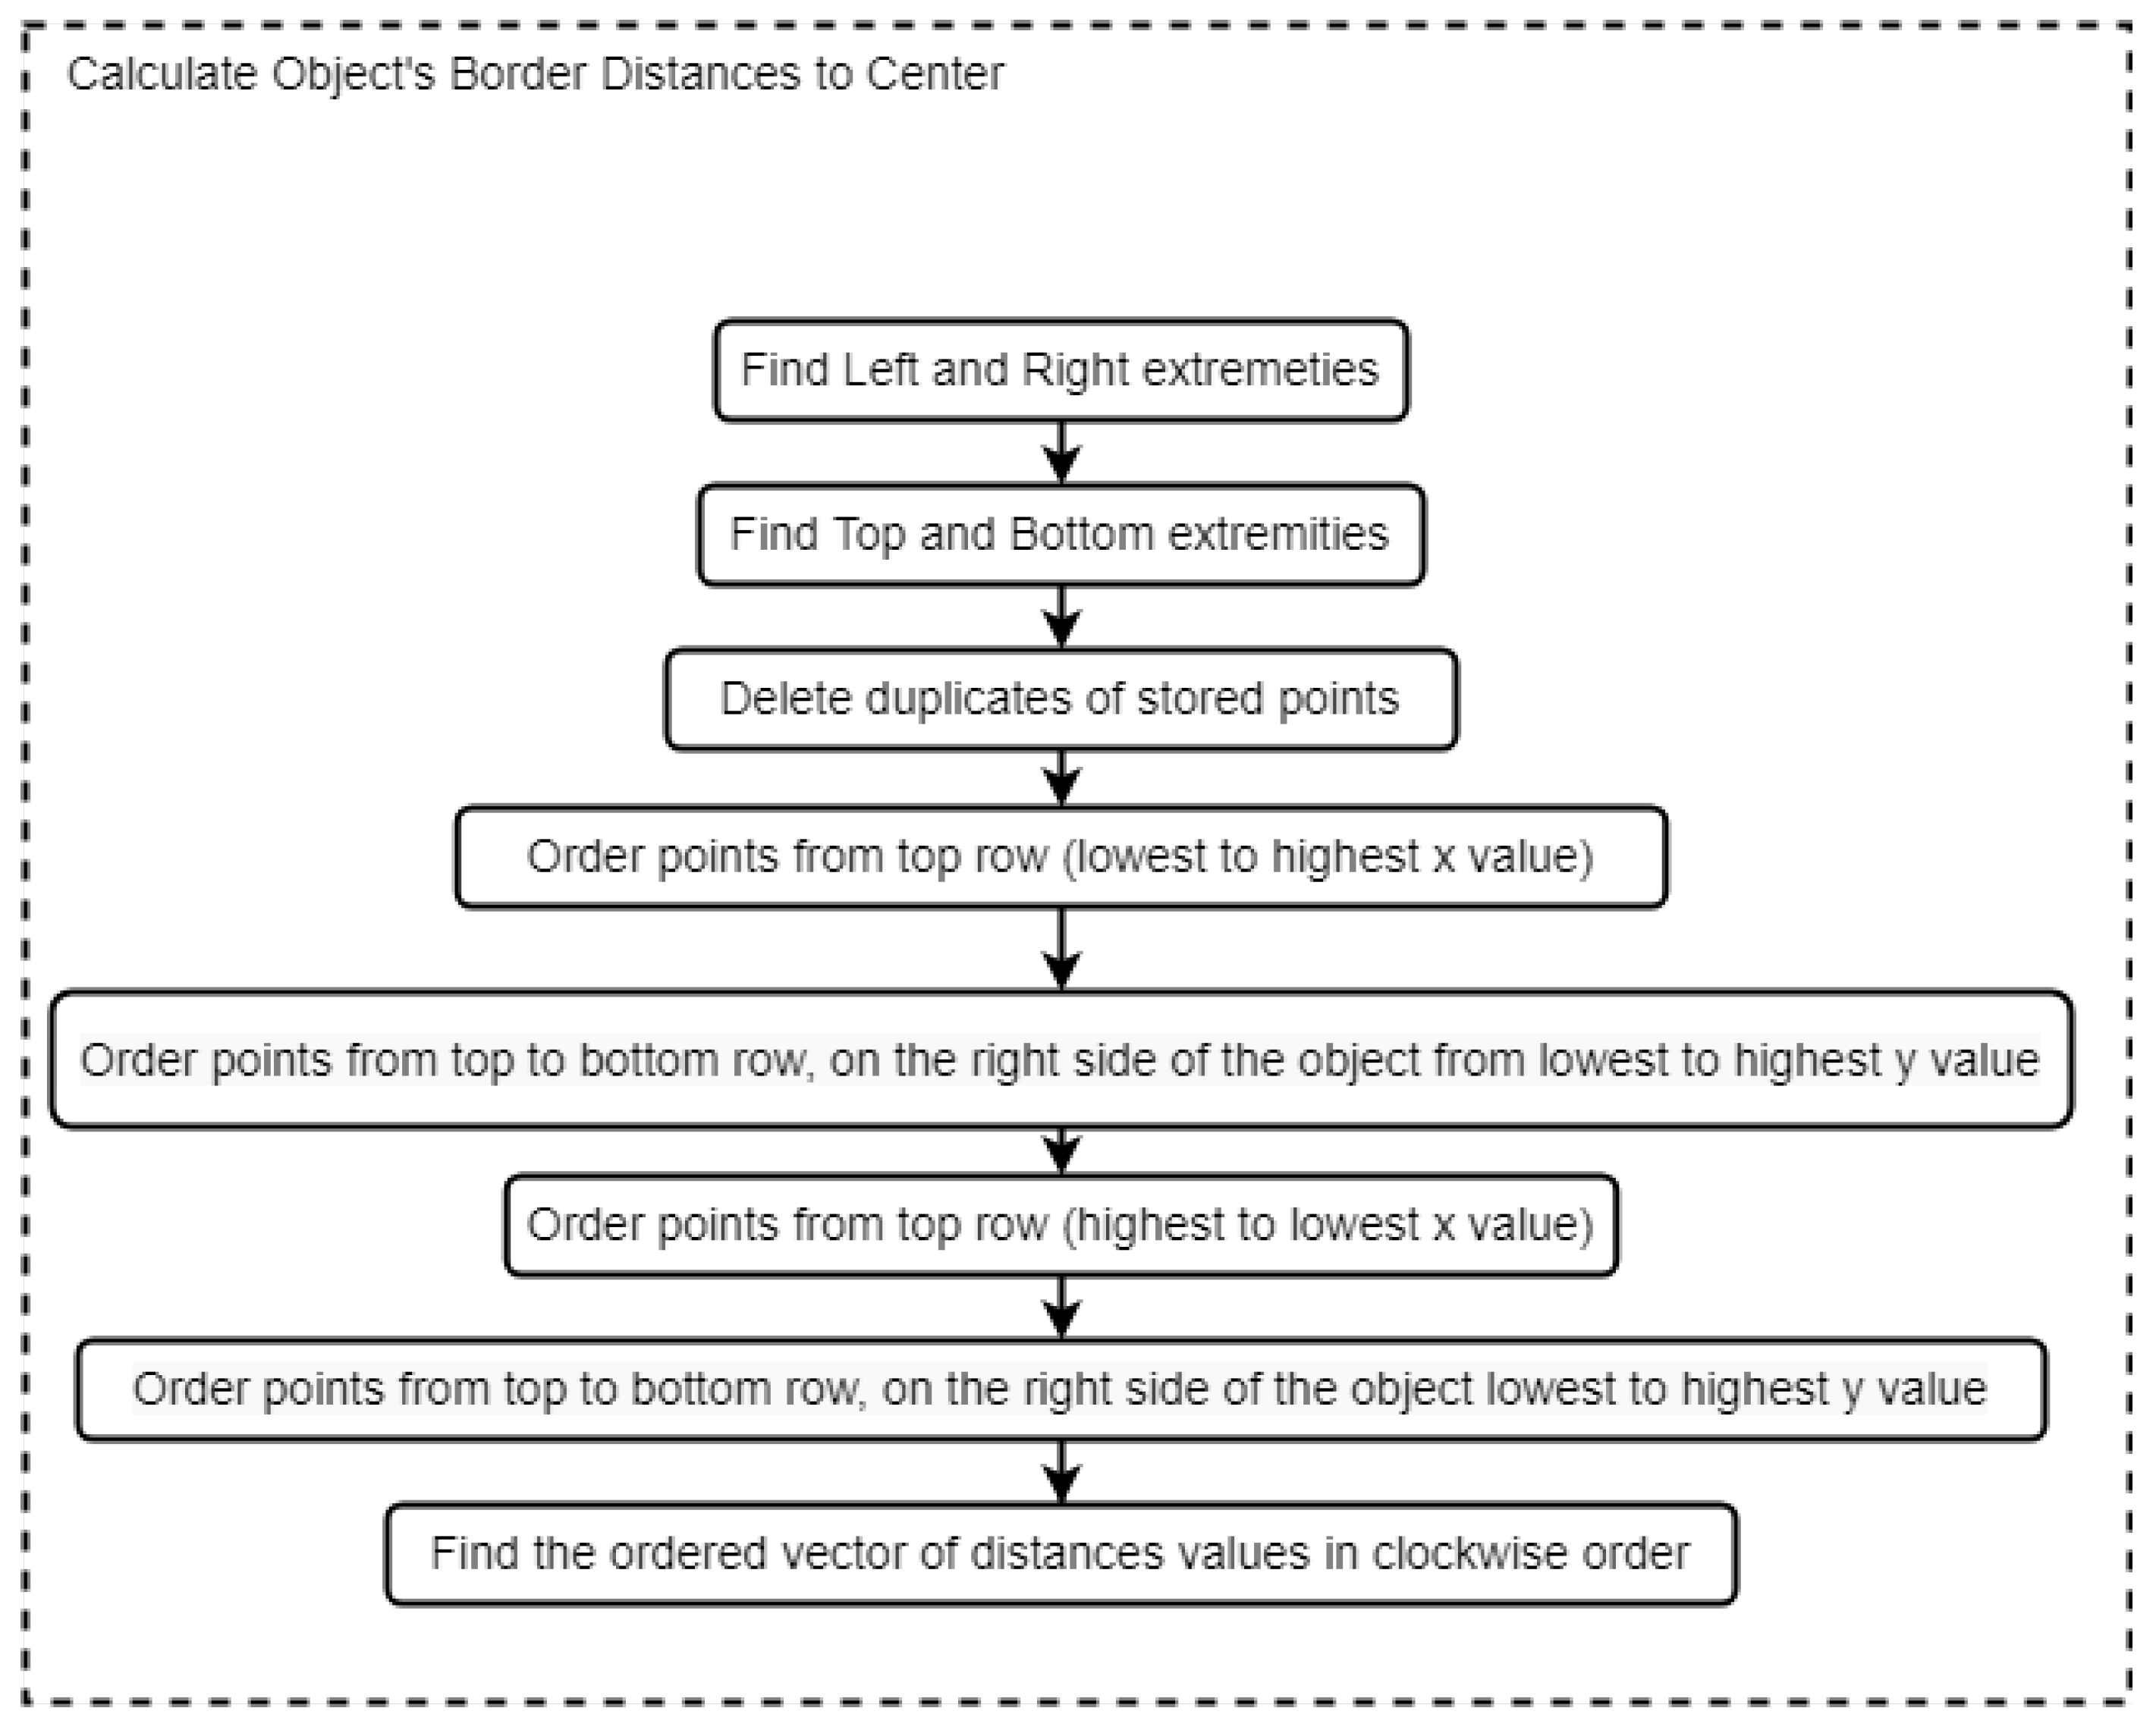
A crucial aspect of these values is the necessity for them to be in the order of rotation to obtain the correct rotation of the ceramic piece. The array is ordered in a clockwise method, as shown in the steps of Figure 16:
  • Step 1
    Analyze the first row and store the distance values from the lowest to the highest values of x.
  • Step 2
    Find the greatest value of x, line by line, until reaching the bottom row and store the distance values in order.
  • Step 3
    Analyze the bottom row and store the distance values from the greatest to the lowest values of x.
  • Step 4
    Find the lowest value of x, line by line, until reaching the top row and store the distance values in order.
The overall process is described in Figure 17.

4.5.2. Results

Similar to the process in Section 4.4.2, a set of different-shaped pieces was considered for testing, and a dataset of 50 experiments was acquired for each different shape.
To test the algorithm proposed in Section 4.5.1, it was considered adequate to evaluate the application’s performance regarding the maximum and minimum expected values, which correspond to the top and bottom distances scheduled from the center of each object to its outer rim. For example, regarding the oval shape of Figure 13, the minimum and maximum distances to the center are ideally 30 mm and 45 mm, respectively. Each top, bottom, and corresponding error is presented in Table 3.
The results show a maximum error of 2.241 mm, which is considered as a relatively low value due to the dimensions of the pieces. However, as mentioned in Section 4.4.2, these results can be improved if provided the necessary implementation of the rotary encoder.

4.6. Border Height

4.6.1. Algorithm

The third requirement for this application is to determine the height of the object’s outer borders to allow for the correct positioning of the robotic manipulator when next to the polishing tool.
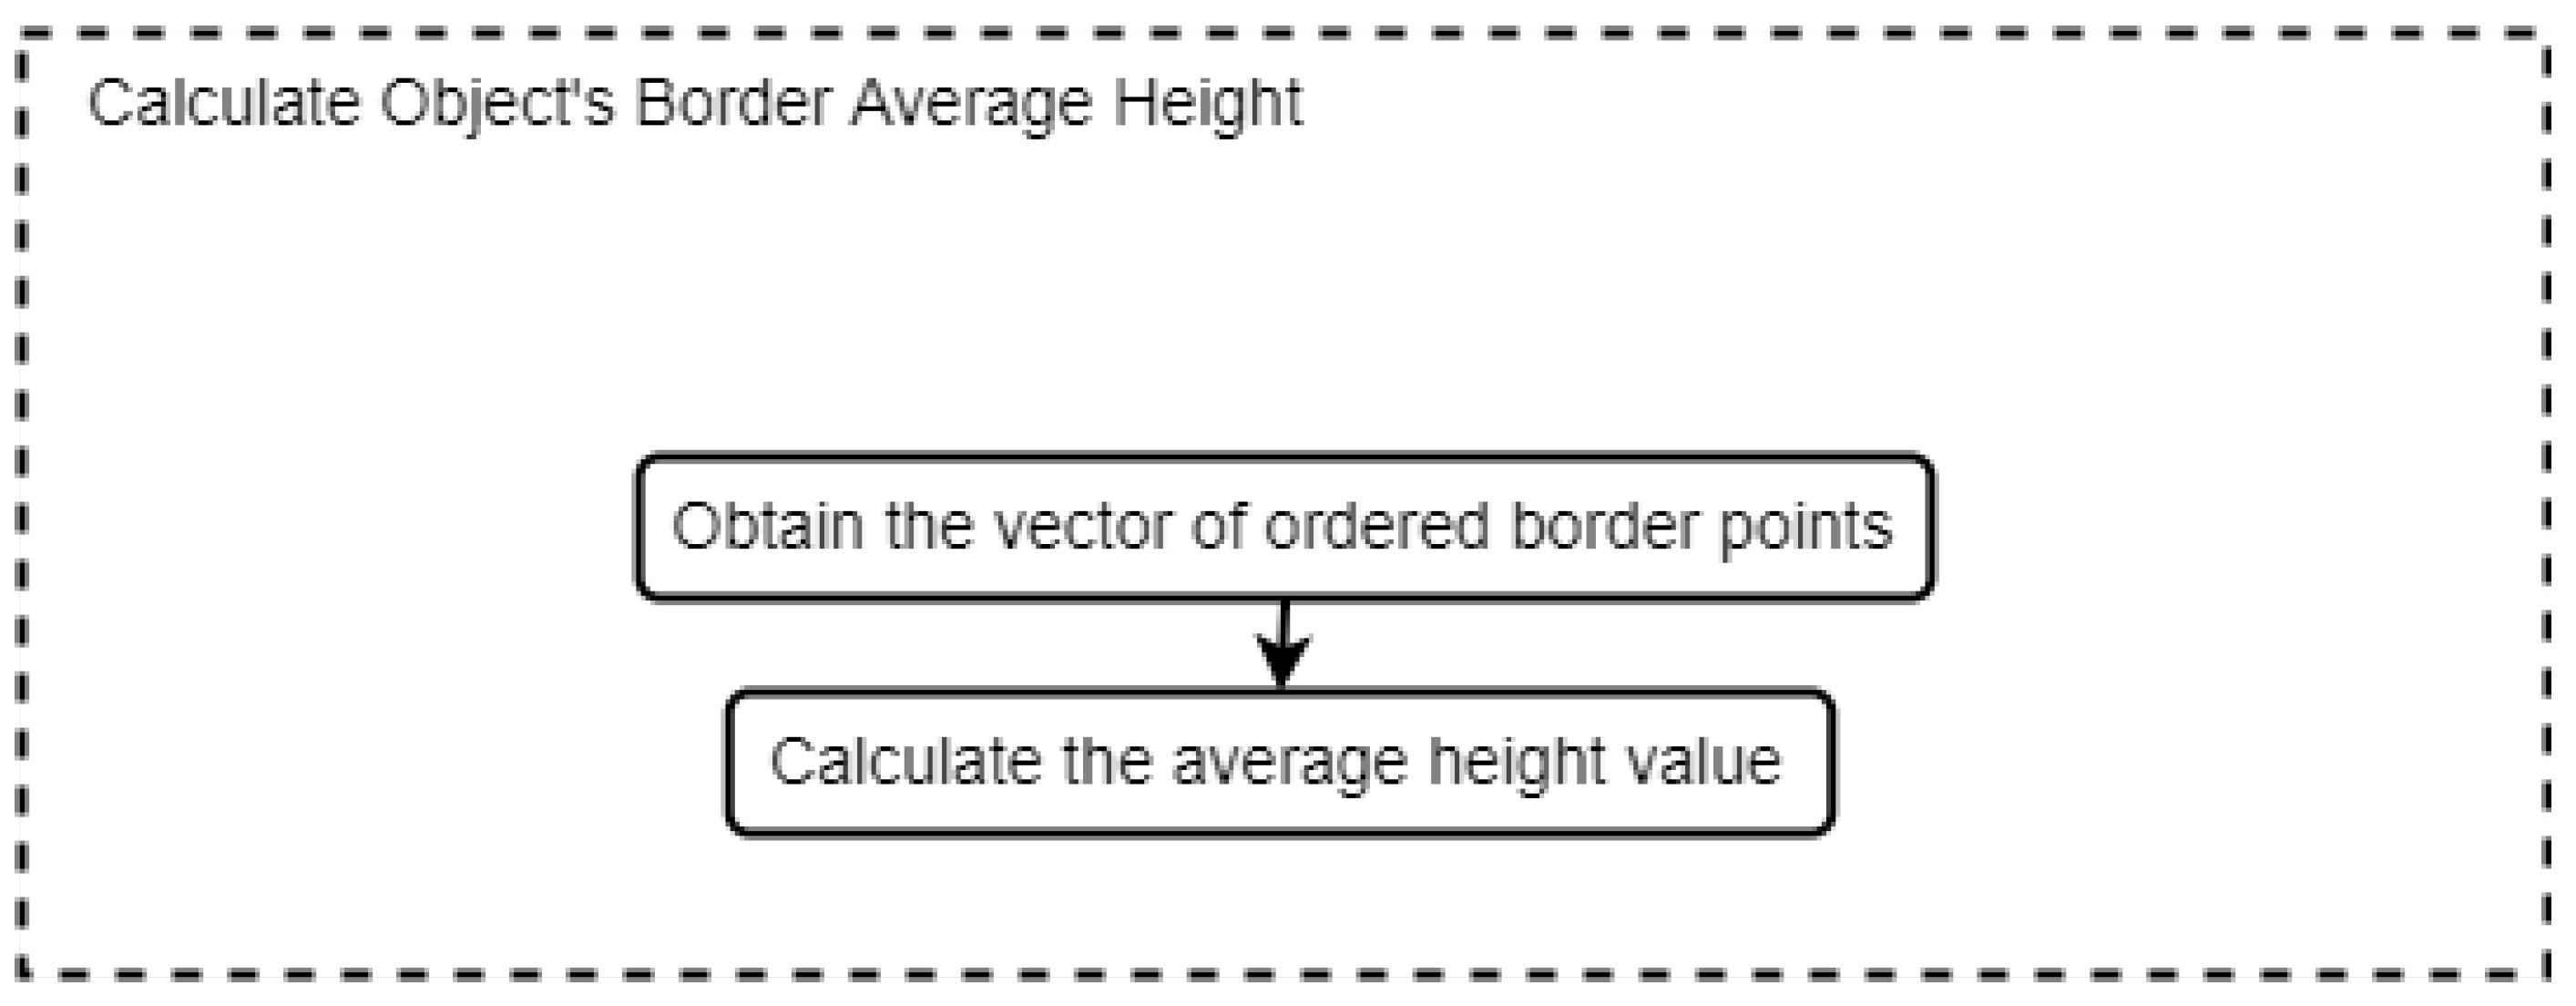
The height value of each captured point is stored in the application. As such, the only necessary tasks to perform are to average the already filtered array of obtained values, explained in Section 4.5.1, and transmit the values to the robot for placement of the end tool. The overall process is described in Figure 18.

4.6.2. Results

After applying the process of Section 4.4.2, the heights expected and measured are presented in Table 4, as well as the error of the values.
Similar to the other algorithms, the proposed approach presents a relatively small error value, reaching maximum errors of approximately 1 mm, which is a very positive factor for the development of this work.

5. Trajectory Generation

5.1. Environment Conditions

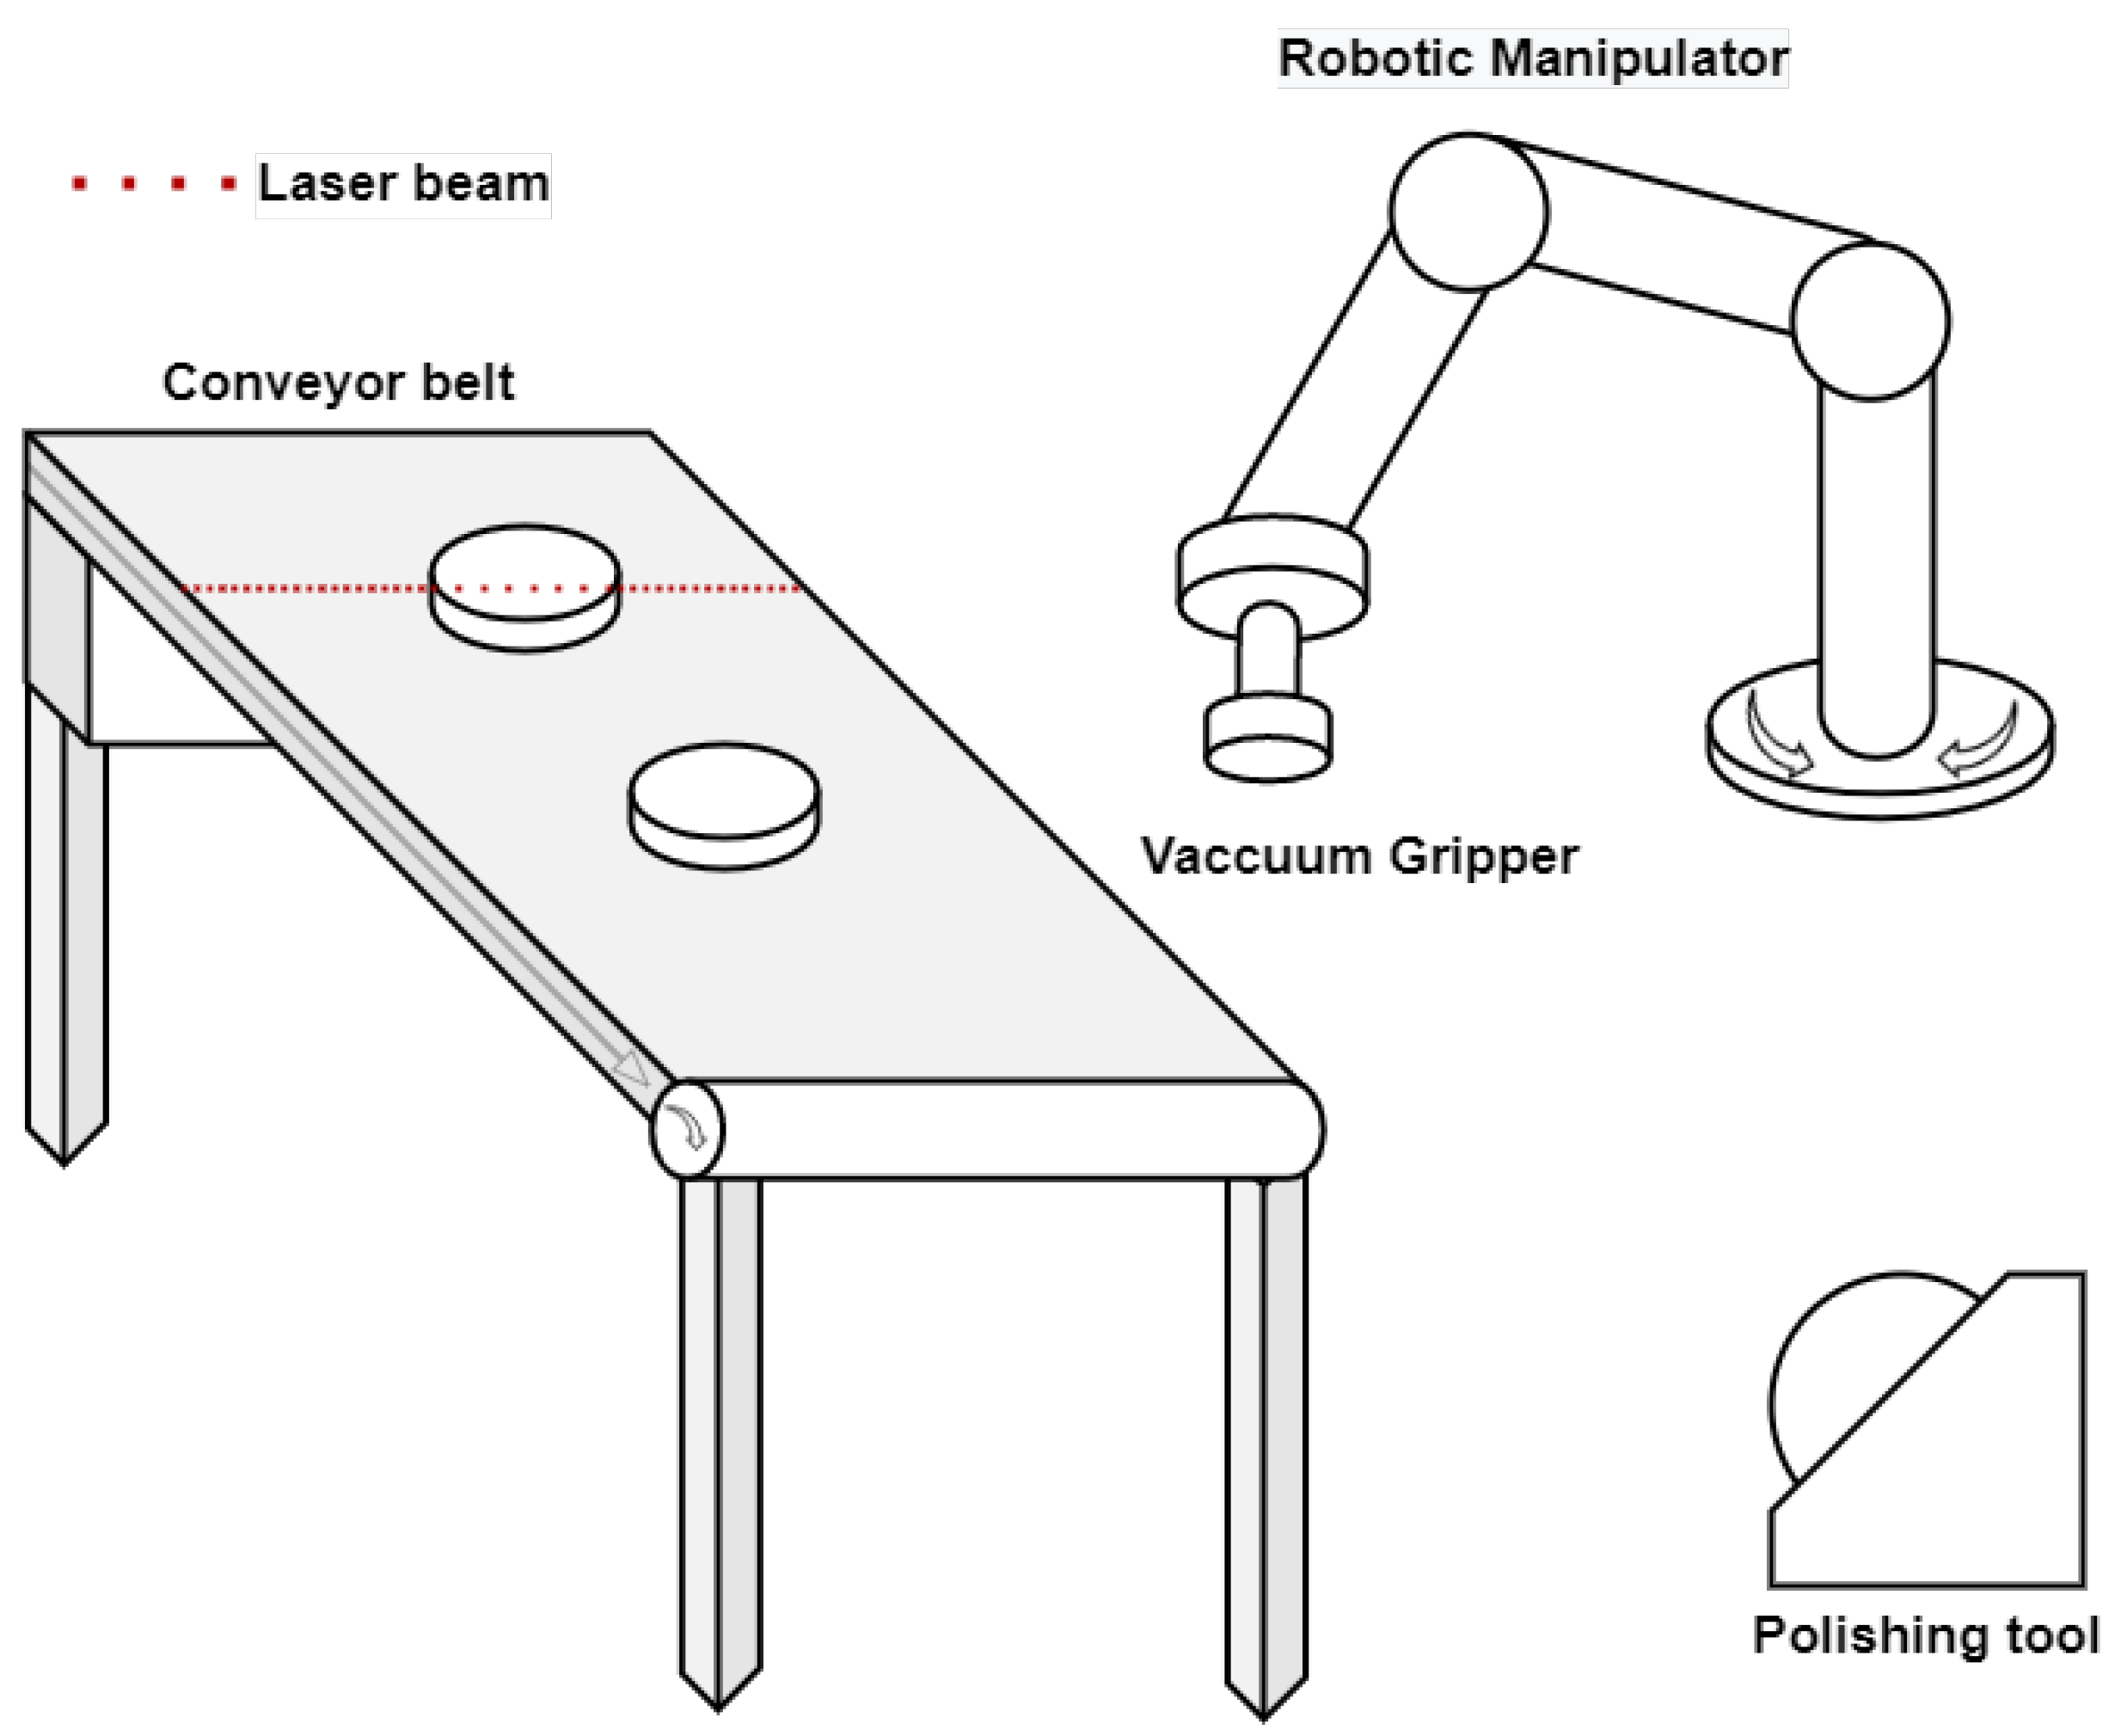
All the components were considered static for initial testing, and there were no unknown obstacles between the conveyor and the polishing tool. The result is a more direct approach to the trajectory of the manipulator. A general view of the proposed setup is presented in Figure 19.

5.2. Strategies

The main goal of this project is the data acquisition and trajectory generation of the end tool of a robotic manipulator capable of moving a ceramic piece close to a polishing station. However, a more classic approach was used for the initial testing of the acquired data, considering the polishing bit at the tip of the end tool instead of a vacuum gripper.
For initial testing, the robot was tested with a predefined trajectory using its STEP FILE [15] option, which allows the program to import trajectories from CAD software and run it in the robot environment. However, the trajectory points cannot be modified in the CAD approach. The alternative was calculating and directly sending the points to the robot using Modbus and a developed Lazarus application.

5.3. Robotic Manipulator

The communication protocol used for controlling the robot is Modbus, a standard data communication protocol used in industrial automation that established a common language for information exchange between electronic devices. In this application, the protocol is used through an ethernet cable and works in two different ways:
  • Modbus Serial
    Based on master/slave architecture. The master usually starts communication, and the answers are sent by the slave with the requested information or acknowledging a specific task.
    Modbus serial can work with RTU mode, with addresses represented in binary format or ASCII mode, where they are represented in ASCII format. The latter, however, consumes more resources from the network.
  • Modbus TCP
    Based on server/client architecture. The communication is started by the client requesting data from the server. In this application, the robot acts as the client and the computer as the server.
    Data is encapsulated in binary format using TCP frames and sent through an ethernet cable.

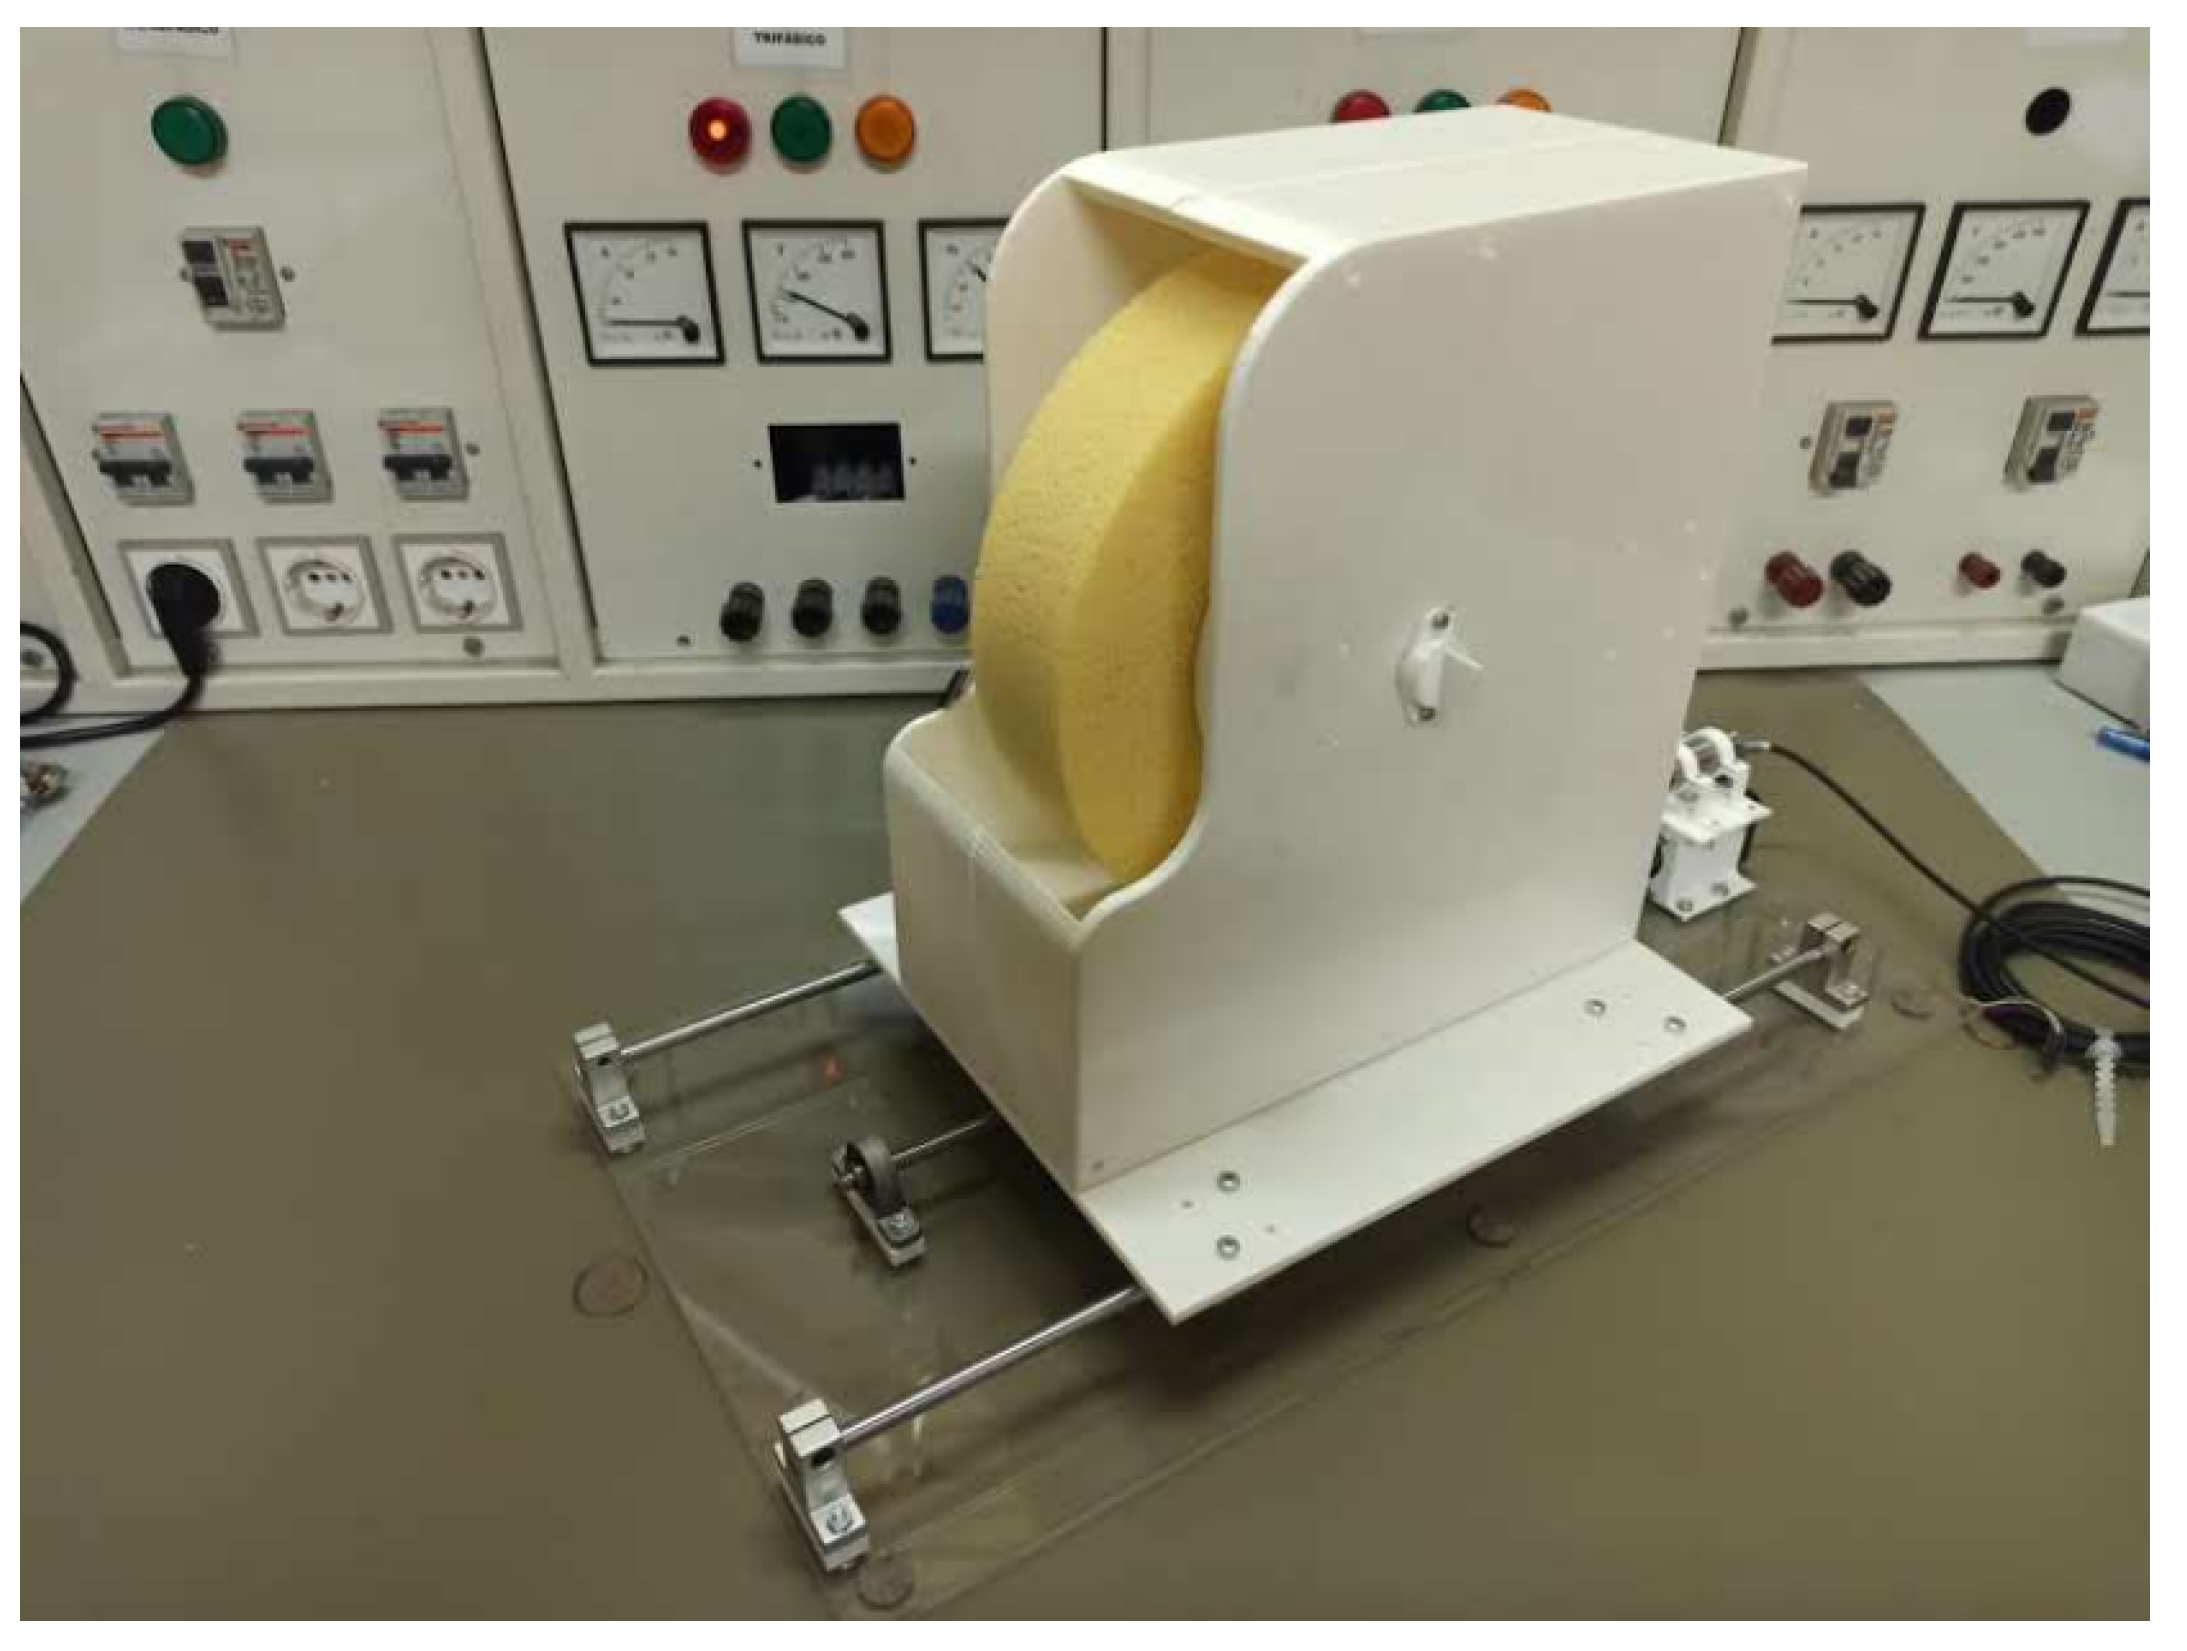
5.4. Polishing Tool

The polishing tool used with this prototype is currently being developed in IPB [16]. The finishing device has a sponge, a DC motor, a stepper motor, several measurement sensors, and a 3D-printed outer casing. The assembled tool is shown in Figure 20. The overall system is controlled with an Arduino UNO.

6. Conclusions and Future Work

Image acquisition can be accomplished in multiple ways. Each analyzed alternative has certain advantages, namely, precision and accuracy. In this work, using a 2D laser scanner combined with a conveyor provided the necessary precision for the required performance of the system. It was considered a promising approach for the necessary detail levels for this application. The results prove a minimal error regarding its expected values, which is a positive factor in favor of this implementation.
The main problem encountered during the development of this work was the speed acquisition of the conveyor belt due to the inability to constantly change the calibrated speed of the laser scanner by updating its FLASH memory. The other main issue was the calibration of the application with the data output frequency of the scanner to achieve a correct reconstruction of the object’s surface.
Future work in this subject will likely include the simulation of the robot’s behavior with the output coordinates from the developed algorithm, with a simulation environment yet to be determined. This work is an essential module of a larger project in collaboration with Instituto Politécnico de Bragança. The other modules are currently being studied and perfected, including the polishing tool with a force response system and the control and actuation of the robotic manipulator.
The next step in the project includes combining the algorithms presented in this dissertation with the other modules. Initial testing will only be performed with the robotic manipulator to ensure the correct localization of the ceramic’s central point. Only then will the polishing module be incorporated with the information about the robot’s path. However, tests are currently being performed using only the other two modules without the dynamic acquisition of data from the laser scanner. As such, combining the whole system will likely prove to be a faster process.
It is also important to note that the presented results are only for the measurements of the objects and do not include the incorporation of the robotic manipulator and the polishing tool, seeing these are still being incorporated.
Finally, the main novelty this work presents is incorporating the dynamic trajectory generation of the robot manipulator with the moving polishing station, with is dynamically regulated and moved according to the reading of force sensors.

Author Contributions

Conceptualization, D.G., J.G., P.C. and V.H.P.; validation, D.G., J.G. and V.H.P.; investigation, D.G. and V.H.P.; writing—original draft preparation, D.G.; and writing—review and editing, M.A., L.B., G.G., J.C., D.G., J.G., P.C. and V.H.P. All authors have read and agreed to the published version of the manuscript.

Funding

This research received no external funding.

Institutional Review Board Statement

Not applicable.

Informed Consent Statement

Not applicable.

Acknowledgments

This work has been supported by STC 4.0 HP (New Generation of Stoneware Tableware in Ceramic 4.0 by High Pressure Casting Robot work cell) Project with reference (POCI-01-0247-FEDER-069654 - STC 4.0 HP), financed by ‘Fundo Europeu de Desenvolvimento Regional’ (FEDER), through the incentive system to I&DT, integrated in the ‘Programa Operacional Competitividade e Internacionalização’ (POSI), within the scope of Portugal 2020.

Conflicts of Interest

The authors declare no conflict of interest.

References

  1. Wang, Q.; Kim, M.K. Applications of 3D point cloud data in the construction industry: A fifteen-year review from 2004 to 2018. Adv. Eng. Inform. 2019, 39, 306–319. [Google Scholar] [CrossRef]
  2. Wang, Q.; Tan, Y.; Mei, Z. Computational Methods of Acquisition and Processing of 3D Point Cloud Data for Construction Applications. Arch. Comput. Methods Eng. 2020, 27, 479–499. [Google Scholar] [CrossRef]
  3. Trebuňa, P.; Mizerák, M.; Rosocha, L. 3D SCANING—TECHNOLOGY AND RECONSTRUCTION. Acta Simulatio 2018, 4, 1–6. [Google Scholar] [CrossRef]
  4. ASPRS. Guidelines for Procurement of Professional Aerial Imagery, Photogrammetry, Lidar and Related Remote Sensor-Based Geospatial Mapping Services. p. 4. Available online: https://www.asprs.org/wp-content/uploads/pers/1989journal/jul/1989_jul_979-984.pdf (accessed on 26 June 2022).
  5. Gruen, A. Fundamentals of videogrammetry—A review. Hum. Mov. Sci. 1997, 16, 155–187. [Google Scholar] [CrossRef]
  6. Gasparetto, A.; Boscariol, P.; Lanzutti, A.; Vidoni, R. Path Planning and Trajectory Planning Algorithms: A General Overview. In Motion and Operation Planning of Robotic Systems: Background and Practical Approaches; Carbone, G., Gomez-Bravo, F., Eds.; Springer International Publishing: Cham, Switzerland, 2015; pp. 3–27. [Google Scholar] [CrossRef]
  7. Bedaka, A.K.; Lin, C.Y. CAD-based robot path planning and simulation using OPEN CASCADE. Procedia Comput. Sci. 2018, 133, 779–785. [Google Scholar] [CrossRef]
  8. Zhang, G.; Wang, J.; Cao, F.; Li, Y.; Chen, X. 3D curvature grinding path planning based on point cloud data. In Proceedings of the 2016 12th IEEE/ASME International Conference on Mechatronic and Embedded Systems and Applications (MESA), Auckland, New Zealand, 29–31 August 2016; pp. 1–6. [Google Scholar] [CrossRef]
  9. 0ctree. Available online: http://www.open3d.org/docs/latest/tutorial/geometry/octree.html (accessed on 25 June 2022).
  10. K Dimensional Tree | Set 1 (Search and Insert). Available online: https://www.geeksforgeeks.org/k-dimensional-tree/ (accessed on 25 June 2022).
  11. Trybała, P.; Blachowski, J.; Błażej, R.; Zimroz, R. Damage Detection Based on 3D Point Cloud Data Processing from Laser Scanning of Conveyor Belt Surface. Remote. Sens. 2020, 13, 55. [Google Scholar] [CrossRef]
  12. Veiga, G.; Malaca, P.; Cancela, R. Interactive Industrial Robot Programming for the Ceramic Industry. Int. J. Adv. Robot. Syst. 2013, 10, 354. [Google Scholar] [CrossRef] [Green Version]
  13. Yu, Z.; Lin, H.I. Development of robotic polishing/fettling system on ceramic pots. Int. J. Adv. Robot. Syst. 2021, 18, 17298814211012851. [Google Scholar] [CrossRef]
  14. Mohsin, I.; He, K.; Cai, J.; Chen, H.; Du, R. Robotic polishing with force controlled end effector and multi-step path planning. In Proceedings of the 2017 IEEE International Conference on Information and Automation, Macao, China, 18–20 July 2017. [Google Scholar] [CrossRef]
  15. Kassow Robots ApS, Oliefabriksvej 57 2770 Kastrup Denmark. Kassow Robots: Software Manual, Version: 1.2.1 en01 ed. Available online: https://www.kassowrobots.com/products/kr810/ (accessed on 30 June 2022).
  16. Alvarez, M.; Brancalião, L.; Gomes, D.; Pinto, V.; Carneiro, J.; Santos, J.; Coelho, J.P.; Gonçalves, J. Prototyping and Control of an Automatic Ceramic Tableware Finishing Device; Springer: Berlin/Heidelberg, Germany, 2022. [Google Scholar]
Figure 1. Steps to generate points (source: adapted from [7]).
Machines 10 00907 g001
Figure 2. Pot handle polishing mechanism (source: adapted from [13]).
Machines 10 00907 g002
Figure 3. Assembled setup.
Machines 10 00907 g003
Figure 4. Experimental setup block diagram.
Machines 10 00907 g004
Figure 5. Magnetic encoder speed acquisition algorithm.
Machines 10 00907 g005
Figure 6. Calibration disk (radius/width: 100 mm/10 mm).
Machines 10 00907 g006
Figure 7. Example of object scan.
Machines 10 00907 g007
Figure 8. Example of filtered 2D matrix where the blank spaces represent the values of zero and the squares represent the object’s surface points.
Machines 10 00907 g008
Figure 9. Application logic.
Machines 10 00907 g009
Figure 10. Libraryfunctions algorithm.
Machines 10 00907 g010
Figure 11. Center-point algorithm.
Machines 10 00907 g011
Figure 12. Circular.
Machines 10 00907 g012
Figure 13. Oval.
Figure 13. Oval.
Machines 10 00907 g013
Figure 14. Rectangular.
Machines 10 00907 g014
Figure 15. Border points’ acquisition.
Machines 10 00907 g015
Figure 16. Steps to order values of distances to center.
Machines 10 00907 g016
Figure 17. Center-point algorithm.
Machines 10 00907 g017
Figure 18. Border height algorithm.
Machines 10 00907 g018
Figure 19. Full setup.
Machines 10 00907 g019
Figure 20. Full application algorithm.
Machines 10 00907 g020
Table 1. Used GDK available functions and description.
FunctionDescription
GoSdk_ConstructConstructs the Gocator SDK library
GoSystem_ConstructConstructs a GoSystem object
GoSystem_FindSensorByIpAddressGets the sensor object with the specified IP address
GoSensor_ConnectCreates a connection to the sensor
GoSystem_EnableDataEstablishes data connections to all connected sensors currently in the <em>ready</em> or <em>running</em> states.
GoSensor_SetupGets the GoSetup instance associated with the sensor.
GoSetup_UniformSpacingEnabledGets the user specified Uniform Spacing enabled state
GoSystem_StartStarts all sensors that are currently in the <em>ready</em> state.
GoSystem_ReceiveDataReceives a set of sensor data messages.
GoDestroyFrees the memory associated with a given kObject sourced class handle.
Table 2. Maximum average error for center localization.
ShapeAverage Error of X Coordinate (mm)Average Error of Y Coordinate (mm)Maximum Error (mm)
Circular0.340.780.78
Oval01.021.02
Rectangular0.1080.7810.781
Table 3. Maximum average error for distance to center calculation.
ShapeTop Ideal Measurement (mm)Bottom Ideal Measurement (mm)Top Value Error (mm)Bottom Value Error (mm)Max Error (mm)
Circular50502.2412.2412.241
Oval45301.4011.6751.675
Rectangular8552.51.7741.5991.774
Table 4. Maximum average error for height determination.
ShapeHeight (mm)Average Measured Height (mm)Maximum Error (mm)
Circular94.493.3611.039
Oval1919.4480.48
Rectangular1717.2630.263
Publisher’s Note: MDPI stays neutral with regard to jurisdictional claims in published maps and institutional affiliations.