Article

A Two-Stage Method for Weak Feature Extraction of Rolling Bearing Combining Cyclic Wiener Filter with Improved Enhanced Envelope Spectrum

1
School of Mechanical Science and Engineering, Huazhong University of Science and Technology, Wuhan 430074, China
2
China Railway Engineering Equipment Group Co., Ltd., No. 99, 6th Avenue National Economic & Technical Development Zone, Zhengzhou 450016, China
*
Author to whom correspondence should be addressed.
Machines 2022, 10(10), 863; https://doi.org/10.3390/machines10100863
Submission received: 5 August 2022 / Revised: 25 August 2022 / Accepted: 19 September 2022 / Published: 27 September 2022
(This article belongs to the Section Machines Testing and Maintenance)

Abstract

:
Due to the interference of various strong background signals, it is often difficult to extract effective features by using conventional methods such as envelope spectrum analysis when early weak fault arises in rolling bearing. Inspired by the current two main research directions of weak fault diagnosis of rolling bearing, that is, the enhancement of impulse features of faulty vibration signal through vibration analysis and the selection of fault information sensitive frequency band for further envelope spectrum analysis, and based on the second-order cyclostationary characteristic of the vibration signal of faulty bearing, a two-stage method for weak feature extraction of rolling bearing combining cyclic Wiener filter with improved enhanced envelope spectrum (IEES) is proposed in the paper. Firstly, the original vibration signal of the rolling bearing’s early weak fault is handled by cyclic Wiener filter exploiting the spectral coherence (SCoh) theory and the noise components are filtered out. Then, SCoh is applied on the filtered signal. Subsequently, an IEES method obtained by integrating over the selected fault information sensitive spectral frequency band of the SCoh spectral is used to extract the fault features. The innovation of the proposed method is to fully excavate the advantages of cyclic Wiener filter and IEES simultaneously. The feasibility of the proposed method is verified by simulation firstly, and vibration signals collected from accelerated bearing degradation tests and engineering machines are used to further verify its effectiveness. Additionally, its superiority over the other state-of-the-art methods is also compared.

1. Introduction

It is of great economic and safety significance to diagnose the early weak faults of rolling bearings promptly. Fault diagnosis of rolling bearings is often realized by applying feature extracting methods on the electrical signal, thermal image [1,2,3] or vibration signal of rolling bearings, and feature extraction based on vibration signal has become the mainstream due to the reasons that vibration signals are easily collected and contain fault information. However, the impulse feature of faulty bearing vibration signals is very weak due to the inference of strong background noise. The enhancement of impulse features of faulty vibration signals and the selection of fault information sensitive frequency bands for further envelope spectrum analysis are the two main directions of the current researches on the feature extraction of the early weak fault of rolling bearing. The enhancement of impulse features could be divided into two directions, roughly: (1) noise reduction based on signal processing methods such as wavelet transform [4,5], empirical mode decomposition or related improved methods [6,7], sparse representation analysis dictionary [8,9,10], sparse representation self-learning dictionary [11,12,13], and so on. However, the performance of the above methods is more or less insufficient when the characteristic signal of faulty rolling bearing is disturbed by strong background noise, especially in the early weak fault stage of rolling bearing. (2) Impulse feature enhancement based on blind deconvolution (BD) methods, of which the minimum entropy deconvolution (MED) [14] is the typical representation. Thereafter, the kinds of BD methods by maximizing a certain criterion of the filtered signal such as maximum correlated kurtosis deconvolution [15], multipoint optimal minimum entropy deconvolution adjusted [16], and cyclostationarity-based BD [17] algorithms have been developed. Unfortunately, some of the above BD methods need to know the prior information of the faulty bearing, which is impossible in most engineering cases. The pioneered research on the selection of fault information sensitive frequency band for further envelope spectrum analysis is spectral kurtosis (SK) algorithm [18,19,20] proposed by Antoni et al. To solve the disadvantage of SK poor robustness to non-Gaussian noise, the calculated kurtosis index of the envelope spectrum of the filtered signal was used as criterion for determination of the fault sensitive information frequency band, and the Protrugram [21] was proposed. The ratio of the L2/L1 norm was calculated as new criterion to measure the fault information level of the narrowband filtered signal by sparsogram [22] and inforgram [23], respectively. The advantage of the periodicity of cyclostationarity of bearing defect signals was taken and the autocorrelation of the squared envelope of the demodulated signal was used as a criterion by Autogram [24] to improve the performance of SK. Recently, related literature has also been developed [25,26,27]. Although the SK improved methods have solved the above-mentioned shortcoming of SK to some extent, the selected frequency band in the above SK improved methods might not be the optimal frequency band due to the influence of strong background noise and the complexity of signal components. In addition, the periodic shock characteristic components might be divided into two adjacent frequency bands, resulting in the loss of useful information.
Cyclostationarity is another classical and effective method, and spectral correlation (SC), with its normalized version based on cyclostationarity, that is SCoh [28], are the most effective second-order cyclostationary methods for fault feature extraction of rolling bearing. However, its hug calculation time hinders its further wide application. Fortunately, an effective SC method, named as Fast-SC [29], with low complexity and suitable convergence performance was proposed for producing cyclic frequency spectrum of faulty bearing. Then squared envelope spectrum (SES) or enhanced envelope spectrum (EES) for identifying the fault characteristic frequencies could be obtained by integrating SCoh over the whole spectral frequency band. But the defect of SES or EES is sensitive to noise. So, some reports studying how to select a certain spectral frequency band containing rich fault information for integrating the SCoh of the original faulty signal have been proposed. The L2/L1 ratio charactering the impulsiveness and cyclostationarity of bearing fault signals was used as a guideline for the integration of SCoh over certain spectral frequency bands [30]. An indicator reflecting the signal-to-noise ratio was used to select the rich fault information frequency bands for generating EES from SCoh [31]. A fault characteristic frequency based strategy for selecting the optimal spectral frequency band of the SCoh for bearing fault feature extraction was developed [32], whose performance was also compared with other related methods. Similarly, EES was obtained by integrating the SCoh over the full band with adding different weights in different bands [33].
Considering the above stated problems of the above two main research directions for weak fault diagnosis of rolling bearing and the cyclostationarity application in fault diagnosis of rolling bearing, a two-stage method for weak feature extraction of rolling bearing combining a cyclic Wiener filter with IEES is proposed in the paper. Firstly, it has been demonstrated that cyclostationarity, especially the SCoh theory, provides powerful tools for analyzing vibration signals captured on rolling bearing for noise controlling or fault diagnosis purpose as above stated, so the cyclic Wiener filter exploiting the SCoh theory is used to enhance the impact characteristic components buried in the strong background noise when weak fault arises in rolling bearing. Subsequently, an IEES method is used to analyze the filtered signal and the fault features are extracted successfully. The main contributions and novelties of the paper are as follows: (1) A new frequency band selection method based on a new indicator measuring the level of fault features being contained in each narrowband is proposed for integrating the SCoh of original faulty signal. (2) An IEES method [32] is used to improve the noise robustness of conventional EES. (3) A cyclic Wiener filter is combined with the proposed IEES method for weak fault feature extraction of rolling bearing, and effectiveness and advantages of the proposed method are verified through simulation, experiment and engineering signals. The remainder of the paper is organized as follows. Section 2 and Section 3 are dedicated to the theory of cyclic Wiener filter and IEES, respectively. A simulation is given in Section 4 to verify the feasibility of the proposed method, and one experimental case and engineered case are used, respectively, to verify its effectiveness in Section 5 and Section 6. At last, the conclusion is obtained in Section 7.

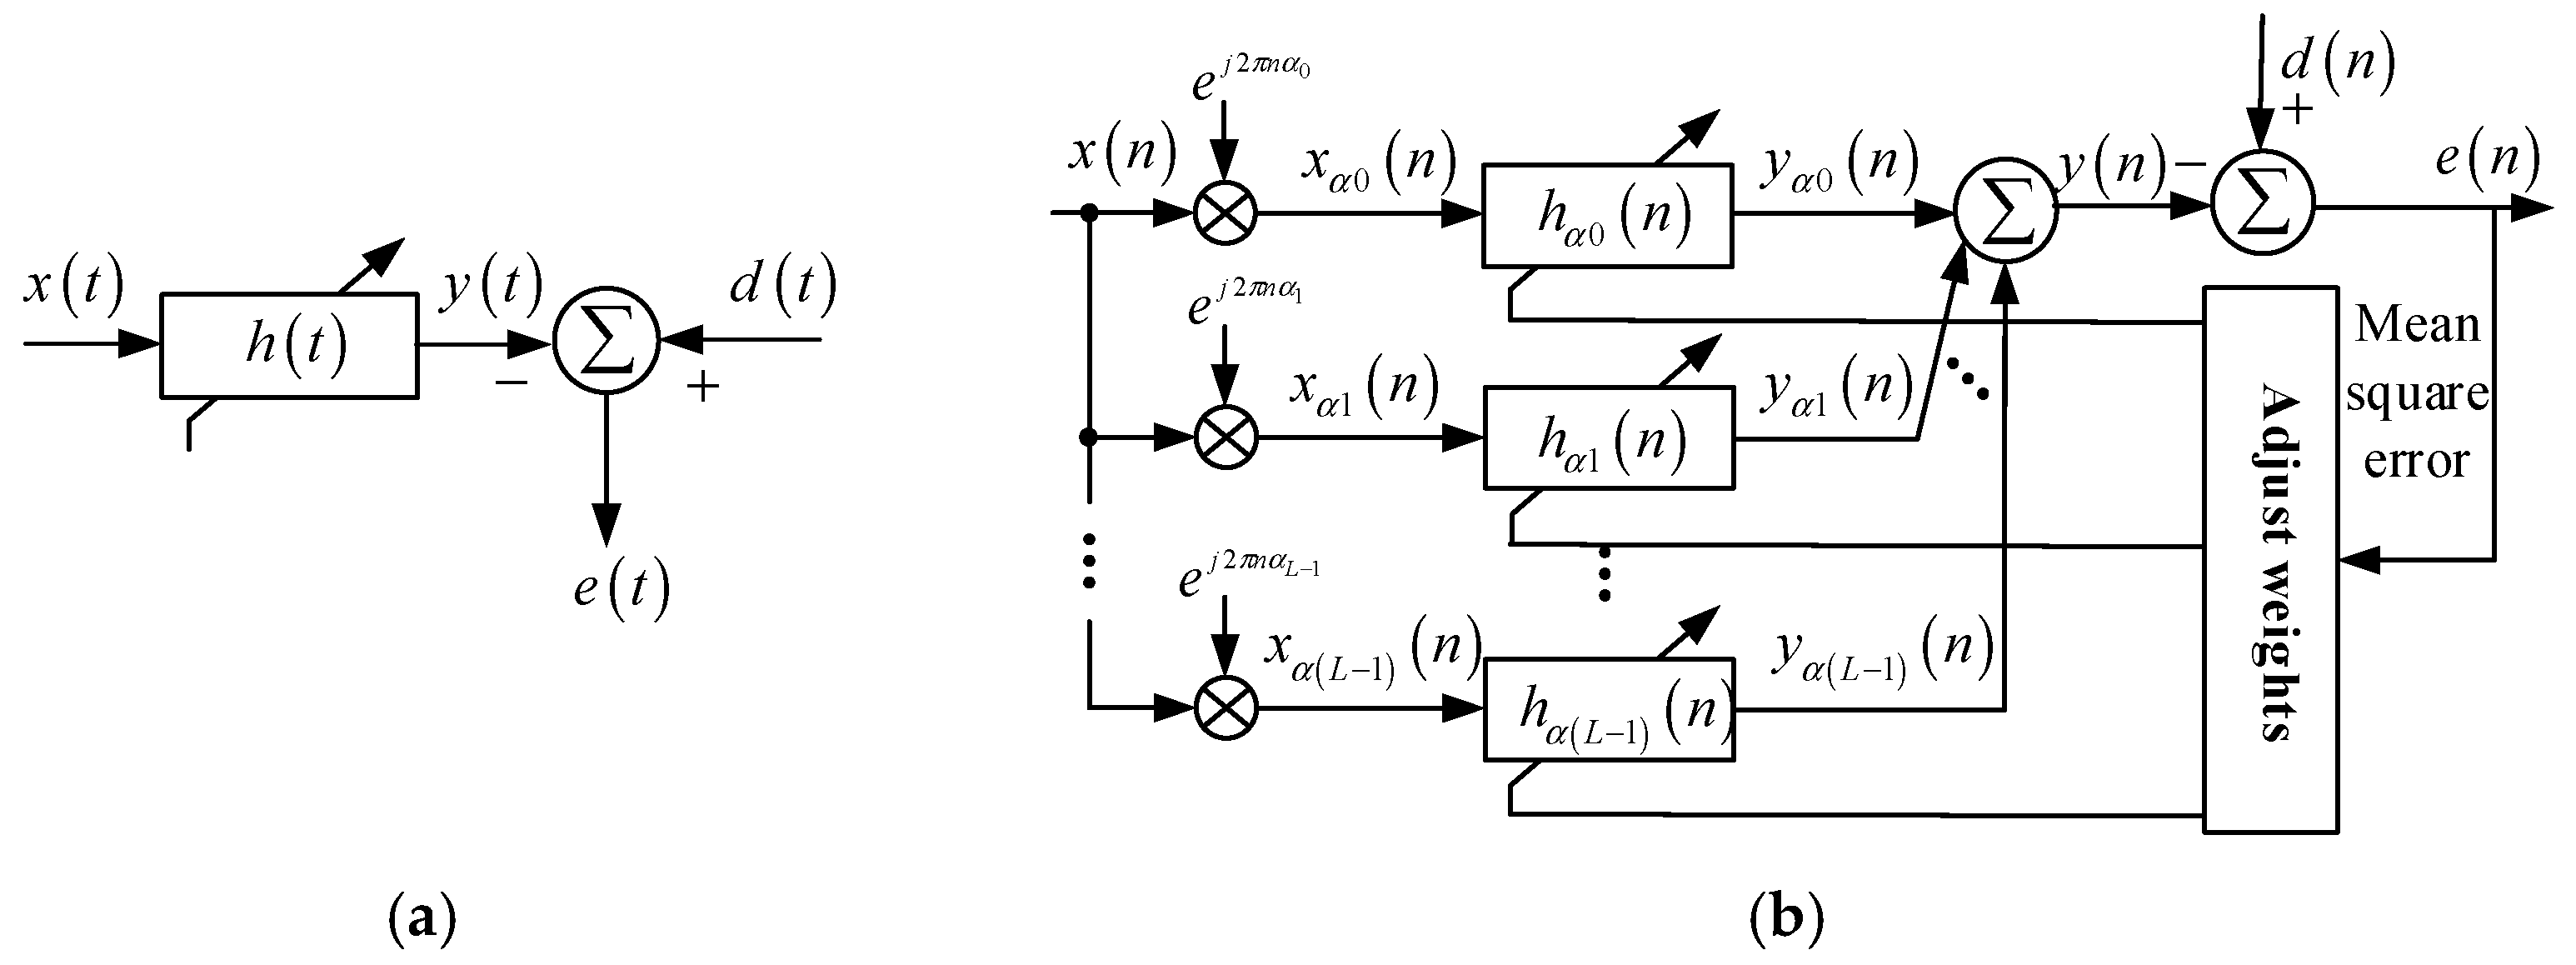
2. Cyclic Wiener Filter

As stated in the introduction section, the SCoh theory is a powerful and mature signal processing method for fault feature extraction of rolling bearing. Cyclic Wiener filter exploiting the Scoh theory could capture the impact characteristic components buried in the strong background noise adaptively by using the prior information, such as fault characteristic frequency, so cyclic Wiener filter is used for de-noising the original vibration signal of faulty rolling bearing in this study.
The filtering processes of cyclostationary adaptive filter are to use a series of frequency-shifted version of the test signal x η ( t ) = x ( t ) * e j 2 π t η η = { α 0 , α 1 , , α ( L 1 ) } as input of the filter bank h η ( t ) firstly, and the output y ( t ) is obtained by summing all of y η ( t ) . The error function e ( t ) is obtained by comparing the output y ( n ) and the expected response d ( n ) , that is e ( n ) = d ( n ) y ( n ) , and each weight of the filter bank is adjusted according to e ( t ) for achieving the optimal filtering effect. The cyclic Wiener filter is the optimal filter obtained by using the mean square value of e ( t ) as the cost function in the process of weight adjustment. Figure 1a,b is the diagram of the stationary adaptive filter and cyclic Wiener filter, respectively.
It could be observed that the cyclic Wiener filter is similar to the traditional Wiener filter in structure by comparing Figure 1a,b, except that the weights of each filter bank need to be adjusted simultaneously in the cyclic Wiener filter. The relationship between the output signals and the input is yielded as following after being filtered by the cyclic Wiener filter:
y ( n ) = η m = 0 M 1 w η , m [ x ( n m ) e j 2 π η ( n m ) ]
where w η , 0 , w η , 1 , represents the weights coefficients of filter h η corresponding to each cyclic frequency η = α 0 , α 1 , , α L 1 , and x ( n ) is the original signal. It could be concluded that cyclic Weiner filter is equal to the superposition of series of Weiner filters based on Equation (1).
The mean square error used as cost function could be expressed as following:
J ( w ) = e ( n ) e * ( n ) = E { | d ( n ) y ( n ) | 2 } = E { | x ( n ) y ( n ) | 2 } = E { | c ( n ) + n ( n ) y ( n ) | 2 } = E { | c ( n ) y ( n ) | 2 } + E { | n ( n ) | 2 } = J c + J n
where c ( n ) is the second-order cyclostationary signal component, n ( n ) represents Gaussian white noise, and they are independent of each other. The iterative weight coefficients of the cyclic Wiener filter as following could be solved by using adaptive least-mean-square (LMS) algorithm.
w ( n + 1 ) = w ( n ) + δ w ( n ) = w ( n ) + μ [ x α i ( n k ) e ( n ) ]
where w ( n + 1 ) and w ( n ) represent the updated value and past value of weight vector, respectively. δ w ( n ) is the adjustment amount and μ is the step length.
Equation (3) is expanded as following for intuitive expression:
[ [ w α 0 , 0 ( n + 1 ) w α 0 , 1 ( n + 1 ) w α 0 , M 1 ( n + 1 ) ] [ w α 1 , 0 ( n + 1 ) w α 1 , M 1 ( n + 1 ) ] [ w α L 1 , 0 ( n + 1 ) w α L 1 , M 1 ( n + 1 ) ] ] = [ [ w α 0 , 0 ( n ) w α 0 , 1 ( n ) w α 0 , M 1 ( n ) ] [ w α 1 , 0 ( n ) w α 1 , M 1 ( n ) ] [ w α L 1 , 0 ( n ) w α L 1 , M 1 ( n ) ] ] + μ e ( n ) [ [ x α 0 ( n ) x α 0 ( n 1 ) x α 0 ( n M + 1 ) ] [ x α 1 ( n ) x α 1 ( n M + 1 ) ] [ x α L 1 ( n ) x α L 1 ( n M + 1 ) ] ]

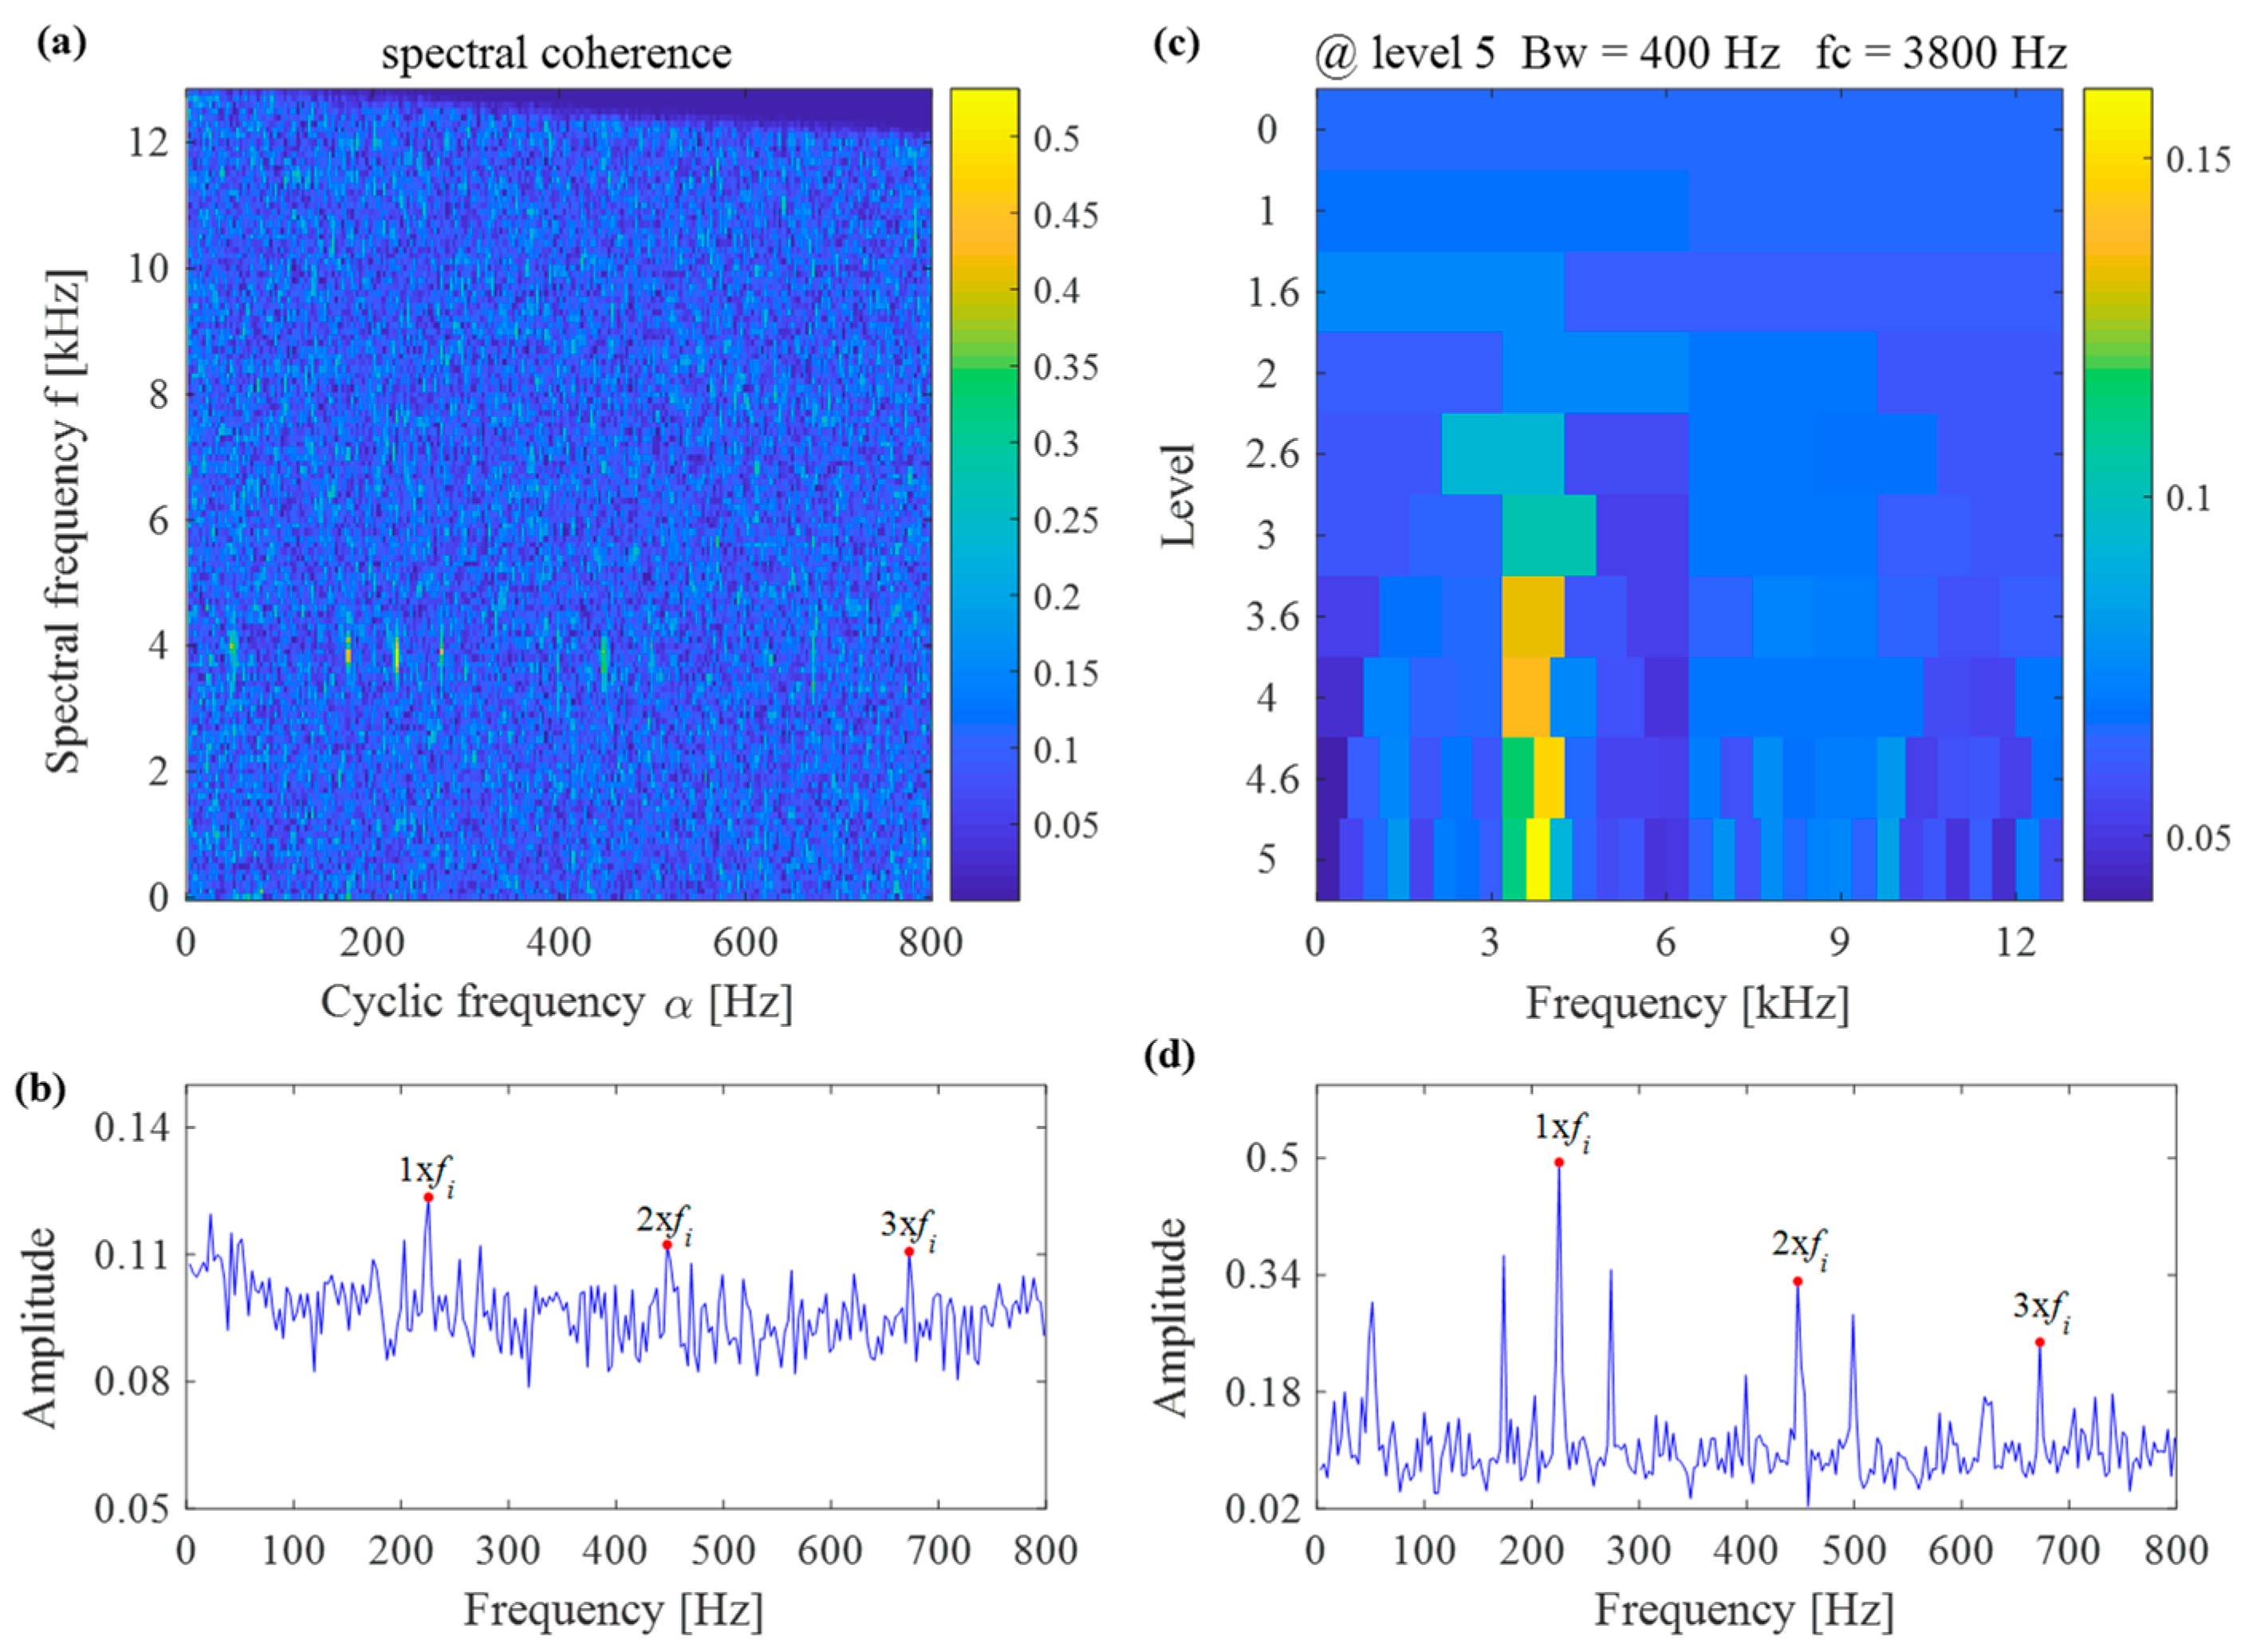
3. Improved Enhanced Envelope Spectrum
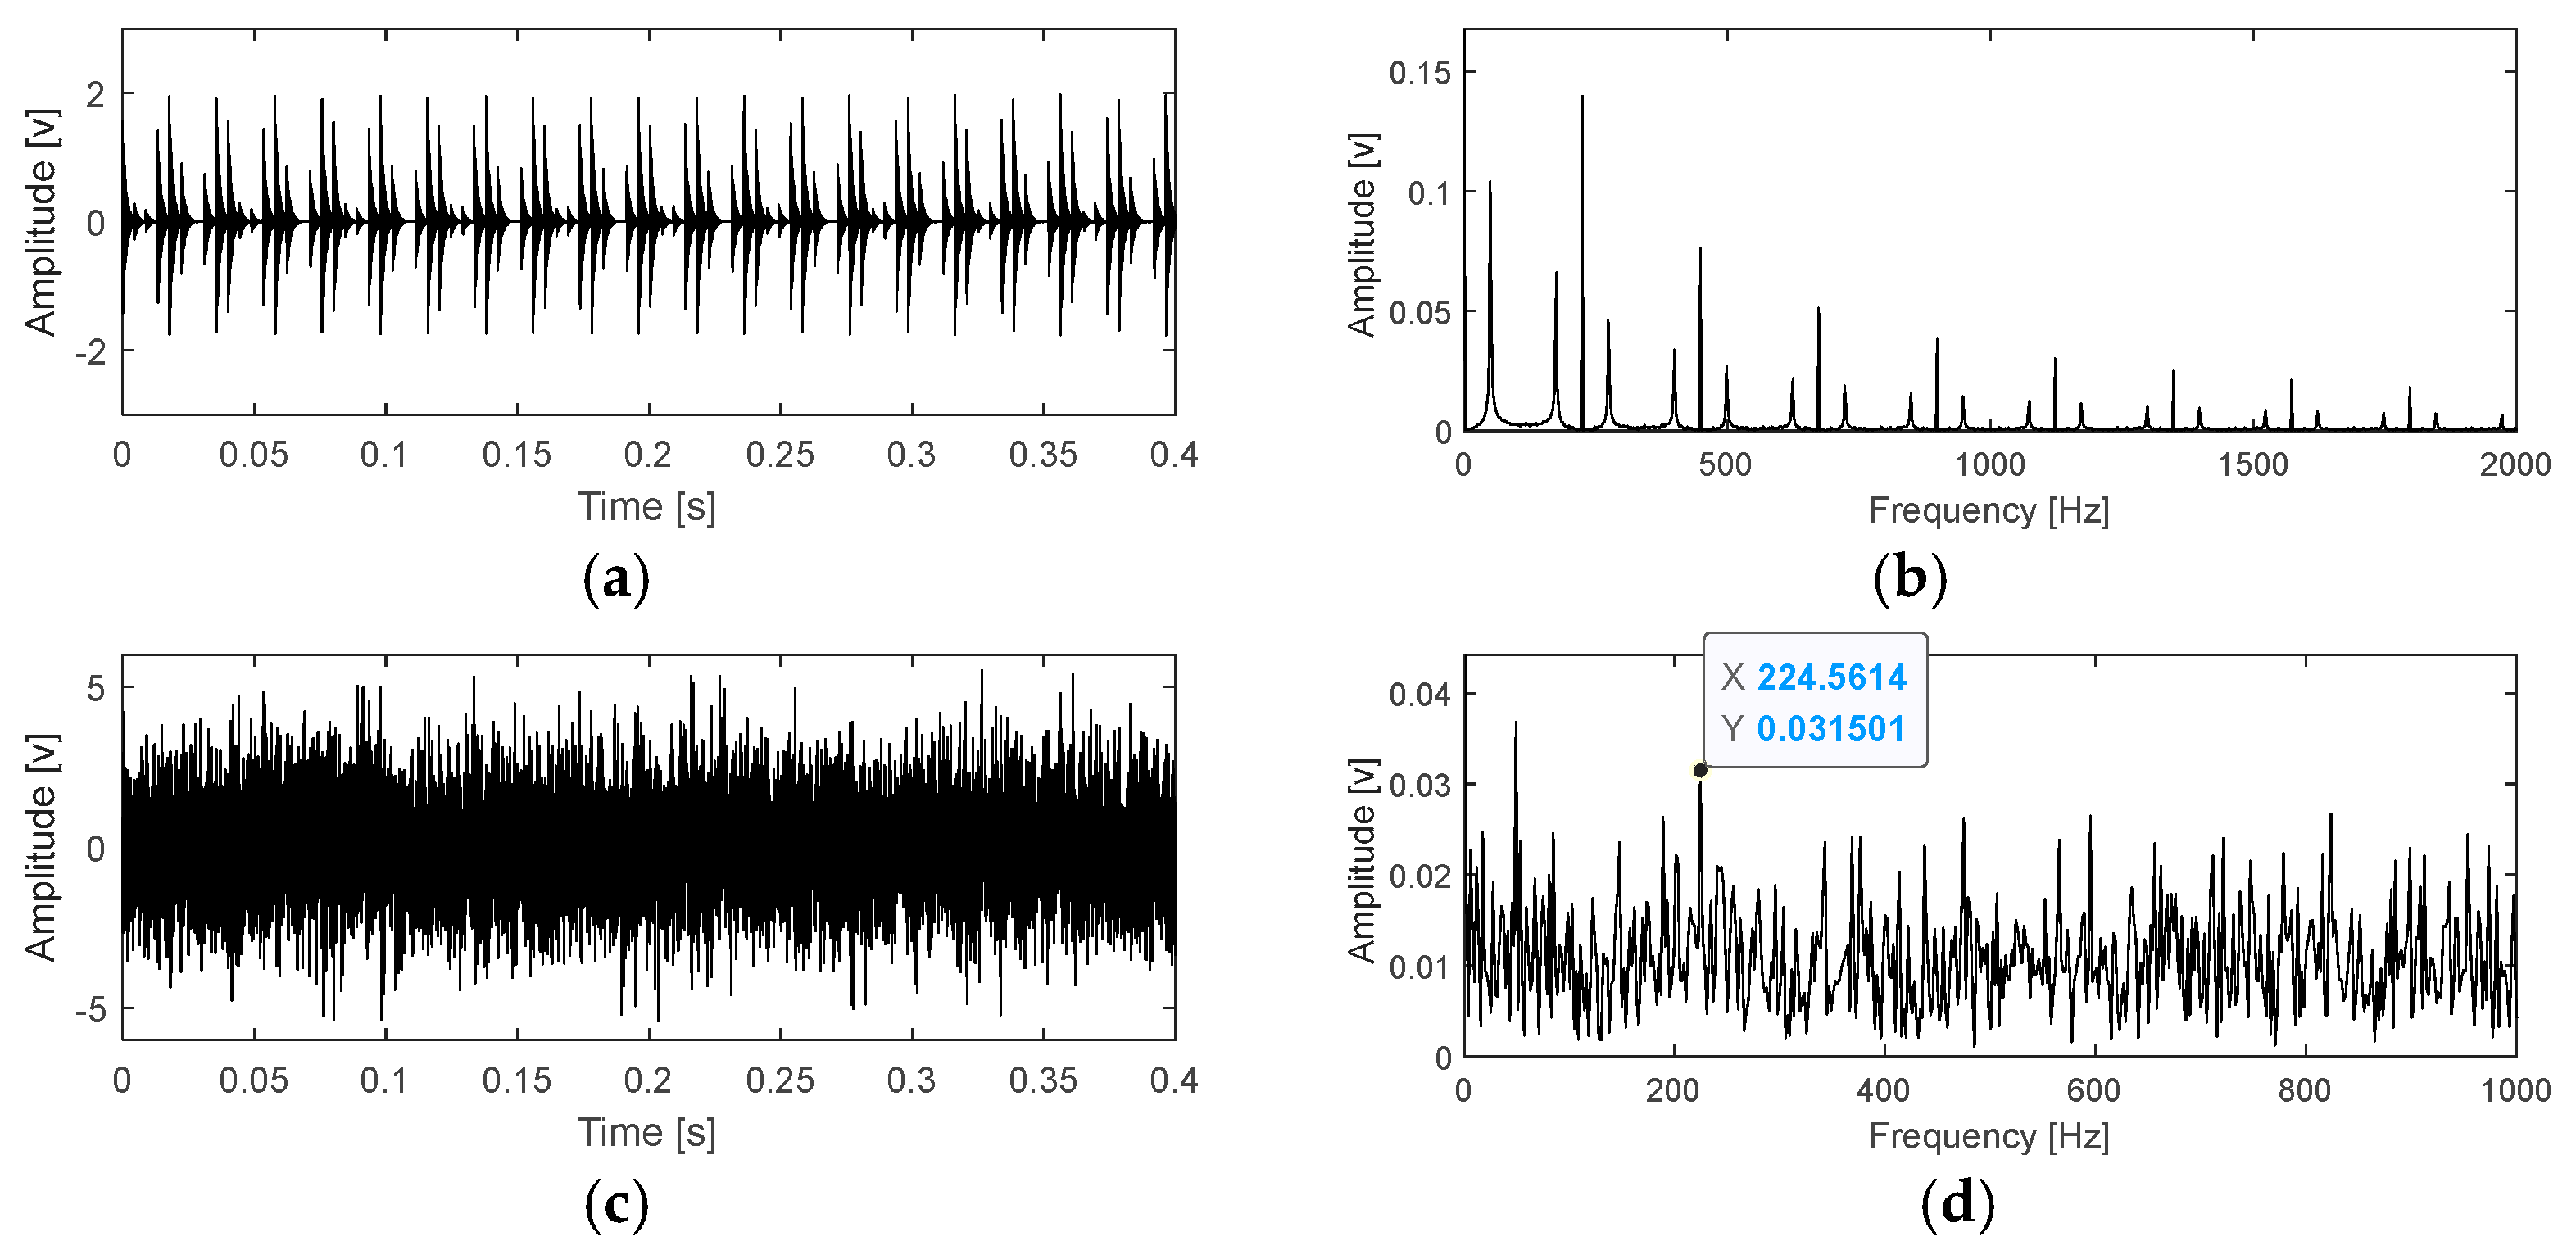
EES obtained by integrating over the full spectral frequency band is vulnerable to strong background noise. Thus, how to select a fault information sensitive frequency band for constructing a diagnostic improved envelope spectrum is important for the fault feature extracting of the rolling bearing. To solve the problem, an IEES method is proposed.
The discrete vibration signal x ( t n ) will take on second-order cyclostationary if a fault arises in rolling bearing, and SC is a powerful tool for extracting the feature of second-order cyclostationary, which is defined as the Fourier transform of the autocorrelation function of x ( t n ) :
S x ( α , f ) = lim N 1 ( 2 N + 1 ) F s n = N N m = R x ( t n , τ m ) e j 2 π n α F s e j 2 π m f F s
where F s is the sampling frequency, τ m = m / F s and R x ( t n , τ m ) is the autocorrelation function of x ( t n ) , whose calculation function is as following:
R x ( t n , τ m ) = E { x ( t n ) x ( t n τ m ) * } = R x ( t n + T , τ m )
where E represents the ensemble average operator,* represent the complex conjugate, τ m = m / F s and T is the period of x ( t n ) .
S x ( α , f ) has the following characteristic:
S x ( α , f ) = { S x k ( f ) ,     α = k / T 0 ,                 e l s e w h e r e
where S x k ( f ) ( k = 0 , ± 1 , ± 2 , ) represents the cyclic spectra. Scoh is defined as the normalization of SC:
r x ( α , f ) = S x ( α , f ) S x ( 0 , f ) S x ( 0 , f α )
where S x ( 0 , f ) is equal to the classic power spectral density. SES is calculated as follows, based on Scoh:
S E S ( α ) = 2 F s | 0 F s / 2 r x ( α , f ) d f |
To avoid the occurring of the integration of r x ( α , f ) converging to zero in case of fast rotating phases, SES is adjusted to Equation (10) as follows, that is the so-called EES obtained:
E E S ( α ) = 2 F s 0 F s / 2 | r x ( α , f ) | d f
It could be observed based on Equation (9) that SES is essentially equal to the integration of Scoh over the full spectral frequency band. However, the bearing diagnostic features will be submerged considerably in case of the strong background interferences from other cyclic frequencies in full-band, and the phenomenon will be much worse in case of the early weak fault stage of rolling bearing. So, a specific spectral frequency band containing rich diagnosis features selection method for integration of Scoh should be studied to solve the above problem. In the paper, a corresponding method is proposed and its main steps are as following [32]:
Step 1: Apply SCoh on the vibration signal of faulty bearing after repetitive impulse components enhancement, and the Scoh algorithm adopts the fast SC algorithm.
Step 2: The cyclic frequencies of faulty bearing are identified by focusing on the local extrema of the cyclic frequency spectral slices on SCoh.
Step 3: One-third binary tree filter banks is used to divide the full spectral frequency band to obtain series of narrowband.
Step 4: The indicator measuring the ratio of energy of all the identified cyclic frequencies in step 1 to the energy of IEES is calculated to quantify the level of fault features being contained in each narrowband.
Step 5: The narrowband IEES with the largest indicator is selected for fault features extracting.
It should be noted in step 1 that if apply SCoh on the original vibration signal of faulty bearing directly, the identified cyclic frequencies basing on the local extrema of the cyclic frequency spectral slices on SCoh might not be the optimal due to the interference of background noise. So, the cyclic Wiener filter is used to filter the original vibration signal to enhance the cyclic impulse component.
In step 4, the IEES is calculated as following for the i t h ( i = 0 , 1 , 1.6 , 2 , 2.6 , 3 , ) narrowband at the l t h level obtained by step 3:
I E E S l , i ( α ) = 1 F s / 2 l + 1 F s ( i 1 ) / 2 l + 1 F s i / 2 l + ! | r x ( α , f ) | d f
Additionally, the indicator used in step 4 is defined as the ratio of the energy of all identified cyclic frequencies to the energy of I E E S l , i ( α ) , abbreviated as IR, as the index measuring the level of fault characteristics buried in I E E S l , i ( α ) . I R l , i of I E E S l , i ( α ) is calculated as the following:
I R l , i = n = 1 N I { a ^ ( d ) , d = 1 , 2 , , D } ( α n ) | I E E S l , i ( α n ) | 2 n = 1 N | I E E S l , i ( α n ) | 2
where I { } ( α n ) is an indicative function, which is defined as the following:
I { a ^ ( d ) , d = 1 , 2 , , D } ( α n ) = { 1 ,   i f   α n { a ^ ( d ) , d = 1 , 2 , , D } 0 ,   i f   α n { a ^ ( d ) , d = 1 , 2 , , D }
A larger I R l , i means much more fault characteristic features related to the cyclic frequencies being buried in I E E S l , i ( α ) .
The overall flowchart of the proposed method is presented as following Figure 2.

4. Simulation

The simulation is carried out in this section to verify the feasibility of the proposed method. The classical mathematical model [34,35] of rolling bearing is used here to simulate the pitting fault arising on the inner race of rolling bearing, and the mathematical expression of the model could be expressed as the following:
{ x ( t ) = s ( t ) + n ( t ) = i A i h ( t i T τ i ) + n ( t ) A i = A 0 cos ( 2 π f r t + ϕ A ) + C A h ( t ) = e B t cos ( 2 π f n t + ϕ ω )
where τ i represents the small fluctuation of the i t h shock relative to the average fault period T . A i is the amplitude modulation with a period 1 / f r . h ( t ) is the discrete oscillating impulse with the average inter-arrival time T between two adjacent impacts. n ( t ) is a white noise. B is the damping coefficient depending on the system, and f n is the natural frequency of the system. The sampling frequency is set as f s = 2.56 kHz, the rotating frequency f r = 50 Hz and the inner race fault characteristic frequency f i = 224 Hz. The natural frequency of the system is set as f n = 3.8 kHz.
The time domain waveform of the simulated vibration signal of the faulty bearing and its corresponding envelope spectrum result are presented in Figure 3a,b respectively. Add strong background noise into the signal as shown in Figure 3a to simulate the early weak fault of rolling bearing, and time-domain waveform of the noised signal is shown in Figure 3c, from which the periodic impulse characteristics are buried completely. Furthermore, the envelope spectrum of the noised signal as shown in Figure 3d could not reflect the inner race fault characteristic frequency with its harmonics.
According to the proposed method, the signal shown in Figure 3c is filtered using the cyclic Wiener filter firstly with the cyclic frequencies of filter being set as η = n f i + m f r , n = 0 , 1 , , 5 , m = 0 , 1 ( f i = 224 Hz, f r = 50 Hz) and the filter length being set as L = 512 . The time domain waveform and envelope spectrum of the filtered signal are shown in Figure 4a,b, respectively. Comparing Figure 3c with Figure 4a, although the enhancement effect of the cyclic Wiener filter on the impact components could not be reflected intuitively, it is calculated that the kurtosis index of the latter increases about 50% compared with the former. Moreover, the fault characteristic frequency of the inner race is extracted as shown in Figure 4b. However, its harmonic is not extracted, which could not form a sufficient fault feature vector supporting the inner race failure. Apply SCoh analysis on the signal as shown in Figure 4a and the result is shown in Figure 5a, based on which it is difficult to find the hidden periodicity related to fault by visual inspection. Integrate SCoh over the whole spectral frequency band and the traditional EES is obtained as presented in Figure 5b. In Figure 5b, the fault characteristic frequency with its harmonics are extracted but accompanied with other interference spectral lines. The fault sensitive frequency band is selected based on the step 2–step 5, as presented in Section 3, and the result is given in Figure 5c, wherein the fault information sensitive frequency band is selected as [3600, 4000], which is consistent with the relevant setting parameters of the inner race fault simulated signal. The last IEES result is shown in Figure 5d, based on which the fault features extracted effect is much more satisfactory than that in Figure 5b.

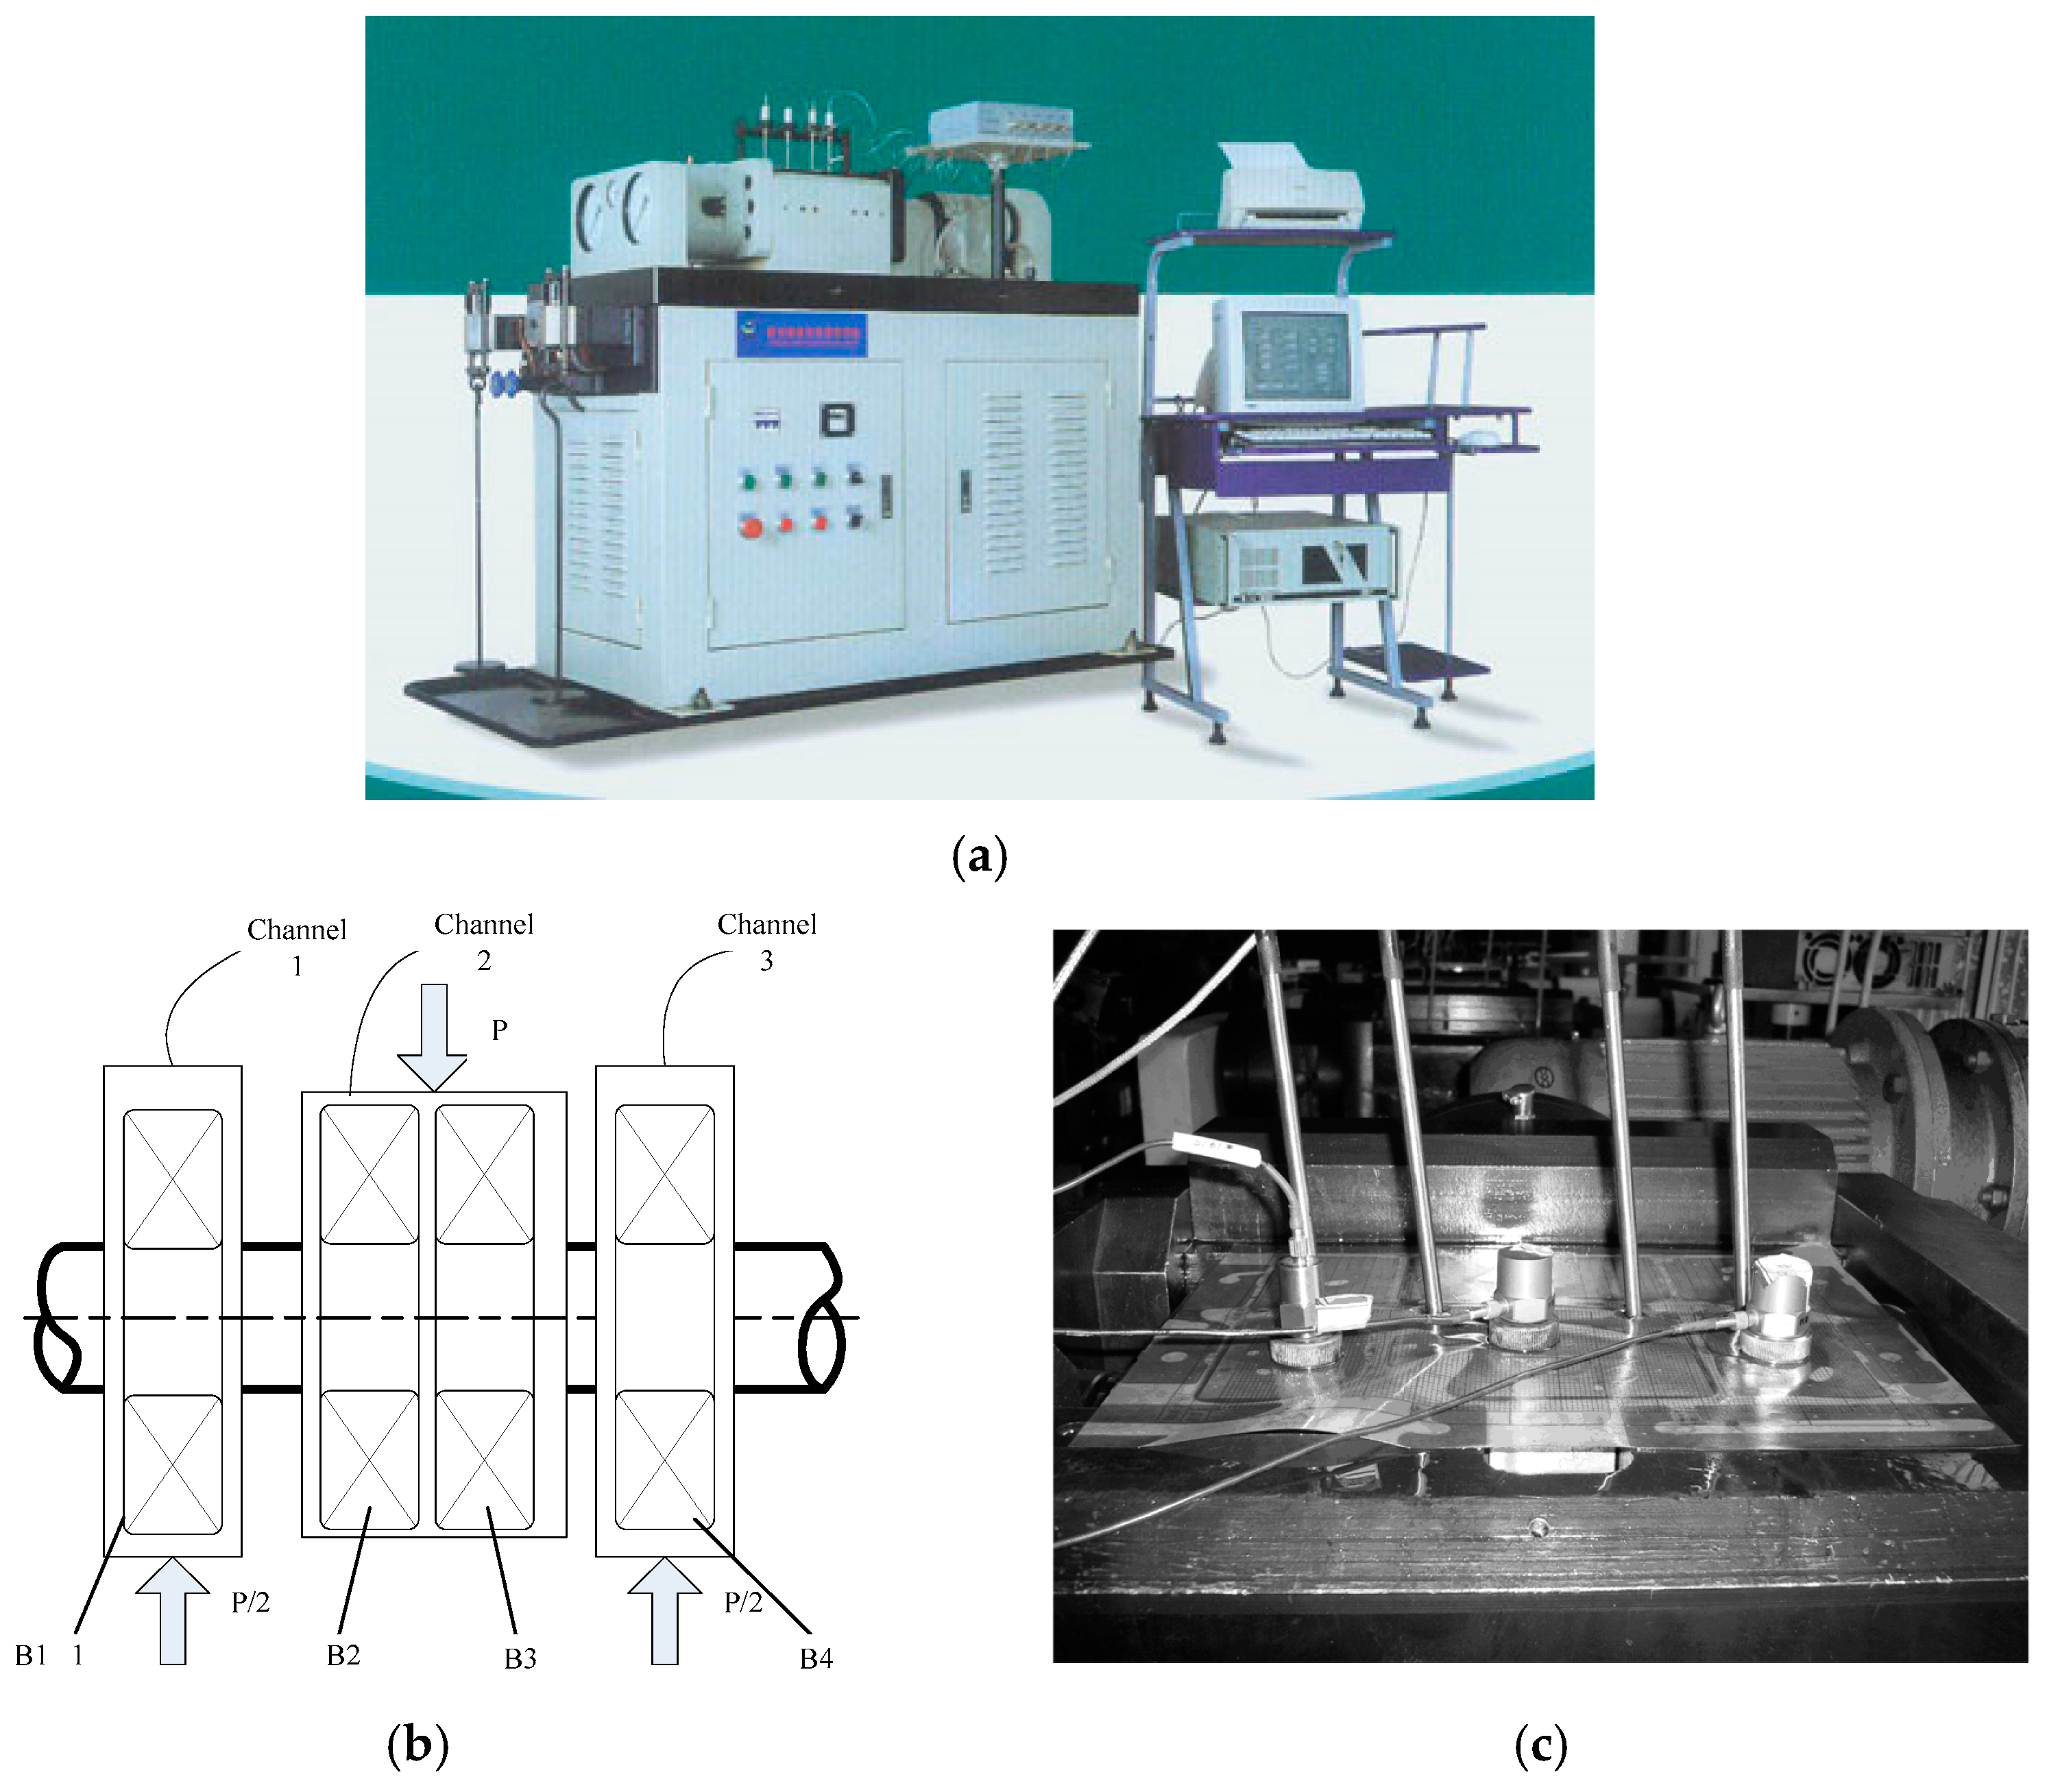
5. Experiment Verification

The bearing-accelerated life test bench adopts the ABLT-1A bearing life intensification test machine as shown in Figure 6a, which is provided by Hangzhou Bearing Test and Research Center. It is capable of mounting 4 bearings simultaneously for accelerated life tests. The intensification test is to load an equivalent load higher than the reference load on the tested bearing without changing the failure mechanism of the rolling bearing, so as to accelerate the failure of the bearing and shorten the test period, also known as the accelerated test. Figure 6b is the load schematic diagram of the test bench. The test bench is equipped with four thermocouples and three accelerators, which are used to collect the temperature and vibration signals of the test bearings, and the installation positions are shown in Figure 6c. The type of accelerator is PCB-348A, and its sensitivity is 100 mv/g.
One of the tested bearings is selected and its data corresponding to early weak failure stage is used to verify the effectiveness of the proposed method. Collect one set of vibration data every one minute, and the length of each set of data is 20,480 points. The sampling frequency is 25,600 Hz. The kurtosis and amplitude index of the selected bearing over its whole lifecycle are presented in Figure 7a,b respectively, based on which it could be observed that both of the two index change abruptly after the 2297th min, but they do not change at the very 2297th min. Therefore, the vibration data corresponding to the 2297th min could be regarded as the data collected at the test bearing’ early weak fault stage, and it will be used to verify the effectiveness of the proposed method, which will be much more persuasive. Time-domain waveform and its envelope spectrum of the vibration data corresponding to the 2297th min are shown in Figure 7c,d, respectively, based on which both of the periodic impact feature on the time domain diagram and the fault characteristic frequency with its harmonic frequencies on the envelope spectrum are not extracted effectively. Apply the cyclic Wiener filter with the cyclic frequencies of filter being set as η = n f i + m f r , n = 0 , 1 , , 5 , m = 0 , 1 ( f i = 245 Hz, f r = 50 Hz) and the filter length being set as L = 512 on the signal, as shown in Figure 7c, and the filtered signal is given in Figure 8: Figure 8a is time domain waveform of the filtered signal and Figure 8b is envelope spectrum of the filtered signal. Though the spectral line locating at 245 Hz is relative evident, the effect is not so ideal due to the inferences of the other spectral lines. The direct SCoh analysis result of the original experimental signal shown in Figure 7c is given in Figure 9a, based on which the rotating frequency with its harmonics are evident. Unfortunately, the inner race fault characteristic frequency is not extracted. The EES result of the original experimental signal based on Figure 9a is shown in Figure 9b, based on which unsatisfactory extraction effect is obtained. As in the simulation section, apply fault sensitive frequency band analysis process as presented in Section 3 (step 2–step 5) on the original experimental signal, and the result is given in Figure 9c, wherein the fault information sensitive frequency band is selected as [1000, 1800], and the last IEES result is shown in Figure 9d, based on which inner race characteristic fault frequency 245 Hz with its harmonics are extracted perfectly.

6. Engineering Verification

The monitoring object is the overpressure roll of a paper mill, whose three-dimensional schematic diagram and the layout of the measuring points are shown in Figure 10: the work roll is driven by motor through a gearbox. The rated power and speed of the driven motor is 710 kW and 1490 r/min, respectively, and the output shaft speed of the gearbox is 475 r/min. Figure 11 is the fault diagram occurring on the inner race of the engineering bearing. Vibration signals were collected for the monitoring object on January 20.2 pm, 2022 and January 21.2 pm, 2022 respectively, and the measured values of the four measuring points in Figure 10 are shown in Table 1. The signal acquisition equipment adapts the equipment status detection and safety evaluation system produced by Zhengzhou expert technology., Ltd., Zhengzhou, China The sensor is an accelerator, whose type is EAG01-100, and its sensitivity is 100 mv/g.
It could be observed from Table 1 that the vibration amplitude of measuring point 4 on January 21 increased significantly compared with that on January 20, while the vibration amplitude of other measuring points was relatively stable. The type of the monitored roll element bearing corresponding to measuring point 4 is given in Table 2, and its fault characteristic frequencies are also presented in Table 2. The collected vibration signals corresponding to measuring point 4 are analyzed by the proposed method. Time domain waveform of the analyzed data is presented in Figure 12a, and its envelope spectrum analysis result is given in Figure 12b, based on which misdiagnosis might be led easily because the amplitude corresponding to 114 Hz is evident. However, 114 Hz is not the fault characteristic frequencies of the monitored bearing components. Apply the cyclic Wiener filter with the cyclic frequencies of filter being set as η = n f i + m f r , n = 0 , 1 , , 5 , m = 0 , 1 ( f i = 121 Hz, f r = 7.9 Hz) and the filter length being set as L = 512 on the signal as shown in Figure 12a, and the filtered signal is given in Figure 13: the inner race fault characteristic frequency of the monitored bearing f i = 121Hz is extracted roughly. Apply SCoh on the filtered signal shown in Figure 13a and the SCoh spectrum is presented in Figure 14a, based on which harmonics of the inner race fault characteristic frequency 121 Hz could be identified roughly. The EES result based on SCoh is shown in Figure 14b, on which not only the inner race fault characteristic frequency with it harmonic are extracted but also the modulating frequency, that is the rotating frequency is extracted. However, compared with the IEES analysis result as shown in Figure 14d, the EES result is not so ideal due to the much more evident feature effect as presented in Figure 14d. The above further verifies the advantage of the proposed method over EES.
Additionally, the ratio of the amplitudes locating at the fault characteristic frequency with its harmonics relative to all amplitudes in the 0–800 Hz are calculated in EES and IEES, respectively, to further quantify the advantage of the IEES over EES: the ratio of Figure 4d is about 9.6 times that of Figure 4b, Figure 8d is about 6.6 times that of Figure 8b, and Figure 13d is about 11.5 times that of Figure 13b.

7. Conclusions

A two-stage method for weak feature extraction of rolling bearing combining a cyclic Wiener filter with IEES is proposed in the paper, which comprehensively utilizes the enhancement effect of the cyclic Wiener filter on periodic weak impact components and the adaptive selection ability of IEES in selecting the fault information sensitive frequency band. The feasibility and effectiveness of the proposed method is verified through simulated signal, bearing experimental signal and bearing engineering signal, accompanied by comparison analysis with EES from SCoh. The following conclusions could be drawn from the study:
(1)
The periodic weak impact component of faulty bearing buried in strong background noise could be enhanced effectively by the cyclic Wiener filter using the prior knowledge such as fault characteristic frequencies, rotating frequency and so on. However, the enhancement effect is not enough to achieve satisfactory feature extraction result under strong background noise, especially in the early weak fault stage of rolling bearing, and requires further processing.
(2)
The proposed IEES could excavate the fault information hidden in SCoh adaptively and could select the fault information sensitive frequency band for further envelope analysis. Though the traditional EES has the similar extraction effect with the proposed IEES, the latter has the advantage of a much better effect.
(3)
Satisfactory extraction results could be achieved by using the combination of the cyclic Wiener filter with IEES in feature extraction the bearing’s early weak fault through the verification of simulation, experiment and engineering.
The paper mainly solves the difficult problem of extraction of weak fault features of rolling element bearing under constant speed. In the future research, the order tracking analysis method being suitable for analyzing variable speed conditions will be combined with the proposed method to extend the research for fault diagnosis of rotating machinery working on variable speed conditions and make the proposed method more universal for engineering applications.

Author Contributions

Writing, review and editing, funding acquisition, L.J. (Lianhui Jia); Investigation, Data curation, L.J. (Lijie Jiang); Methodology, project administration, Y.W. All authors have read and agreed to the published version of the manuscript.

Funding

The research is supported by the National Key R&D Program of China (approved grant: 2020YFB2007200).

Informed Consent Statement

Not applicable.

Data Availability Statement

Not applicable.

Acknowledgments

Many thanks to editors and reviewers for their comments and help.

Conflicts of Interest

The authors declare no conflict of interest.

Nomenclature

IEESImproved enhanced envelope spectrum
SCohSpectral coherence
BDBlind deconvolution
MEDMinimum entropy deconvolution
SKSpectral kurtosis
SCSpectral correlation
EESEnhanced envelope spectrum
SESSquare envelope spectrum

References

  1. Azeez, A.A.; Alkhedher, M.; Gadala, M.S. Thermal imaging fault detection for rolling element bearings. In Proceedings of the Advances in Science and Engineering Technology International Conferences (ASET), Dubai, United Arab Emirates, 4 February–9 April 2020; pp. 1–5. [Google Scholar]
  2. Harlisca, C.; Szabó, L.; Frosini, L.; Albini, A. Diagnosis of rolling bearings faults in electric machines through stray magnetic flux monitoring. In Proceedings of the 8th international symposium on advanced topics in electrical engineering (atee), Bucharest, Romania, 23–25 May 2013; pp. 1–6. [Google Scholar]
  3. Kanemaru, M.; Tsukima, M.; Miyauchi, T.; Hayashi, K. Bearing fault detection in induction machine based on stator current spectrum monitoring. IEEJ J. Ind. Appl. 2018, 7, 282–288. [Google Scholar] [CrossRef]
  4. Qin, Y.; Mao, Y.F.; Tang, B.P.; Wang, Y.; Chen, H.Z. M-band flexible wavelet transform and its application to the fault diagnosis of planetary gear transmission systems. Mech. Syst. Signal Process. 2019, 134, 106298. [Google Scholar] [CrossRef]
  5. Yu, H.; Li, H.R.; Li, Y.L. Vibration signal fusion using improved empirical wavelet transform and variance contribution rate for weak fault detection of hydraulic pumps. ISA Trans. 2020, 107, 385–401. [Google Scholar] [CrossRef] [PubMed]
  6. Yuan, J.; Xu, C.; Zhao, Q.; Jiang, H.M.; Weng, Y.H. High-fidelity noise-reconstructed empirical mode decomposition for mechanical multiple and weak fault extractions. ISA Trans. 2022. online. [Google Scholar] [CrossRef]
  7. Gao, Z.H.; Liu, Y.; Wang, Q.J.; Wang, J.L.; Luo, Y.G. Ensemble empirical mode decomposition energy moment entropy and enhanced long short-term memory for early fault prediction of bearing. Measurement 2022, 188, 110417. [Google Scholar] [CrossRef]
  8. Deng, F.Y.; Qiang, Y.W.; Yang, S.P.; Hao, R.J.; Liu, Y.Q. Sparse representation of parametric dictionary based on fault impact matching for wheelset bearing fault diagnosis. ISA Trans. 2021, 110, 368–378. [Google Scholar] [CrossRef] [PubMed]
  9. Huang, W.G.; Song, Z.S.; Zhang, C.; Wang, J.; Shi, J.J.; Jiang, X.X.; Zhu, Z.K. Multi-source fidelity sparse representation via convex optimization for gearbox compound fault diagnosis. J. Sound Vib. 2021, 496, 115879. [Google Scholar] [CrossRef]
  10. Zhang, X.; Liu, Z.W.; Wang, L.; Zhang, J.T.; Han, W. Bearing fault diagnosis based on sparse representations using an improved OMP with adaptive Gabor sub-dictionaries. ISA Trans. 2020, 106, 355–366. [Google Scholar] [CrossRef]
  11. Ding, J.M.; Zhao, W.T.; Miao, B.R. Adaptive sparse representation based on circular-structure dictionary learning and its application in wheelset-bearing fault detection. Mech. Syst. Signal Process. 2018, 111, 399–422. [Google Scholar] [CrossRef]
  12. Li, Q.C.; Ding, X.X.; Huang, W.B.; He, Q.B.; Shao, Y.M. Transient feature self-enhancement via shift-invariant manifold sparse learning for rolling bearing health diagnosis. Measurement 2019, 148, 106957. [Google Scholar] [CrossRef]
  13. Meng, Z.; Shi, Y.; Pan, Z.Z.; Chen, Z.J. Fault diagnosis of rolling bearing based on adaptive block forward and backward stagewise orthogonal matching pursuit algorithm. J. Mech. Eng. 2020, 56, 91–101. [Google Scholar]
  14. Li, G.; Zhao, Q. Minimum entropy deconvolution optimized sinusoidal synthesis and its application to vibration based fault detection. J. Sound Vib. 2017, 390, 218–231. [Google Scholar] [CrossRef]
  15. Mcdonald, G.L.; Zhao, Q.; Zuo, M.J. Maximum correlated Kurtosis deconvolution and application on gear tooth chip fault detection. Mech. Syst. Signal Process. 2012, 33, 237–255. [Google Scholar] [CrossRef]
  16. Mcdonald, G.L.; Zhao, Q. Multipoint optimal minimum entropy deconvolution and convolution fix: Application to vibration fault detection. Mech. Syst. Signal Process. 2016, 82, 461–477. [Google Scholar] [CrossRef]
  17. Buzzoni, M.; Antoni, J.; D’Elia, G. Blind deconvolution based on cyclostationarity maximization and its application to fault identification. J. Sound Vib. 2018, 432, 569–601. [Google Scholar] [CrossRef]
  18. Antoni, J.; Randall, R.B. The spectral kurtosis: Application to the vibratory surveillance and diagnostics of rotating machines. Mech. Syst. Signal Process. 2006, 20, 308–331. [Google Scholar] [CrossRef]
  19. Antoni, J. The spectral kurtosis: A useful tool for characterising non-stationary signals. Mech. Syst. Signal Process. 2006, 20, 282–307. [Google Scholar] [CrossRef]
  20. Antoni, J. Fast computation of the kurtogram for the detection of transient faults. Mech. Syst. Signal Process. 2007, 21, 108–124. [Google Scholar] [CrossRef]
  21. Barszcz, T.; Jabło´nski, A. A novel method for the optimal band selection for vibration signal demodulation and comparison with the Kurtogram. Mech. Syst. Signal Process. 2011, 25, 431–451. [Google Scholar] [CrossRef]
  22. Tse, P.W.; Wang, D. The design of a new sparsogram for fast bearing fault diagnosis: Part 1 of the two related manuscripts that have a joint title as two automatic vibration-based fault diagnostic methods using the novel sparsity measurement–Parts 1 and 2. Mech. Syst. Signal Process. 2013, 40, 499–519. [Google Scholar] [CrossRef]
  23. Antoni, J. The infogram: Entropic evidence of the signature of repetitive transients. Mech. Syst. Signal Process. 2016, 74, 73–94. [Google Scholar] [CrossRef]
  24. Moshrefzadeh, A.; Fasana, A. The Autogram: An effective approach for selecting the optimal demodulation band in rolling element bearings diagnosis. Mech. Syst. Signal Process. 2018, 105, 294–318. [Google Scholar] [CrossRef]
  25. Wang, D.; Tse, P.W.; Tsui, K.L. An enhanced kurtogram method for fault diagnosis of rolling element bearings. Mech. Syst. Signal Process. 2013, 35, 176–199. [Google Scholar] [CrossRef]
  26. Smith, W.A.; Fan, Z.Q.; Peng, Z.X.; Li, H.Z.; Randall, R.B. Optimised spectral kurtosis for bearing diagnostics under electromagnetic interference. Mech. Syst. Signal Process. 2015, 75, 371–394. [Google Scholar] [CrossRef]
  27. Wang, D. An extension of the infograms to novel Bayesian inference for bearing fault feature identification. Mech. Syst. Signal Process. 2016, 80, 19–30. [Google Scholar] [CrossRef]
  28. Antoni, J. Cyclostationarity by examples. Mech. Syst. Signal Process. 2017, 23, 987–1036. [Google Scholar] [CrossRef]
  29. Antoni, J.; Xin, G.; Hamzaoui, N. Fast computation of the spectral correlation. Mech. Syst. Signal Process. 2017, 92, 248–277. [Google Scholar] [CrossRef]
  30. Wang, D.; Zhao, X.J.; Kou, L.L.; Qin, Y.; Zhao, Y.; Tsui, K.L. A simple and fast guideline for generating enhanced/squared envelope spectra from spectral coherence for bearing fault diagnosis. Mech. Syst. Signal Process. 2019, 122, 754–768. [Google Scholar] [CrossRef]
  31. Schmidt, S.; Mauricio, A.; Heyns, P.S.; Gryllias, K.C. A methodology for identifying information rich frequency bands for diagnostics of mechanical components-of-interest under time-varying operating conditions. Mech. Syst. Signal Process. 2020, 142, 106739. [Google Scholar] [CrossRef]
  32. Chen, B.Y.; Cheng, Y.; Zhang, W.H.; Gu, F.S.; Mei, G.M. Optimal frequency band selection using blind and targeted features for spectral coherence-based bearing diagnostics: A comparative study. ISA Trans. 2021, in press. [Google Scholar] [CrossRef]
  33. Zhang, B.Y.; Miao, Y.H.; Lin, J.; Li, H. Wghted envelope spectrum based on the spectral coherence for bearing diagnosis. ISA Trans. 2022, 123, 398–412. [Google Scholar] [CrossRef] [PubMed]
  34. McFadden, P.D.; Smith, J.D. Model for the vibration produced by a single point defecting in a rolling element bearing. J. Sound Vib. 1984, 96, 69–82. [Google Scholar] [CrossRef]
  35. McFadden, P.D.; Smith, J.D. The vibration produced by multiple point defects in a rolling element bearing. J. Sound Vib. 1985, 98, 263–273. [Google Scholar] [CrossRef]
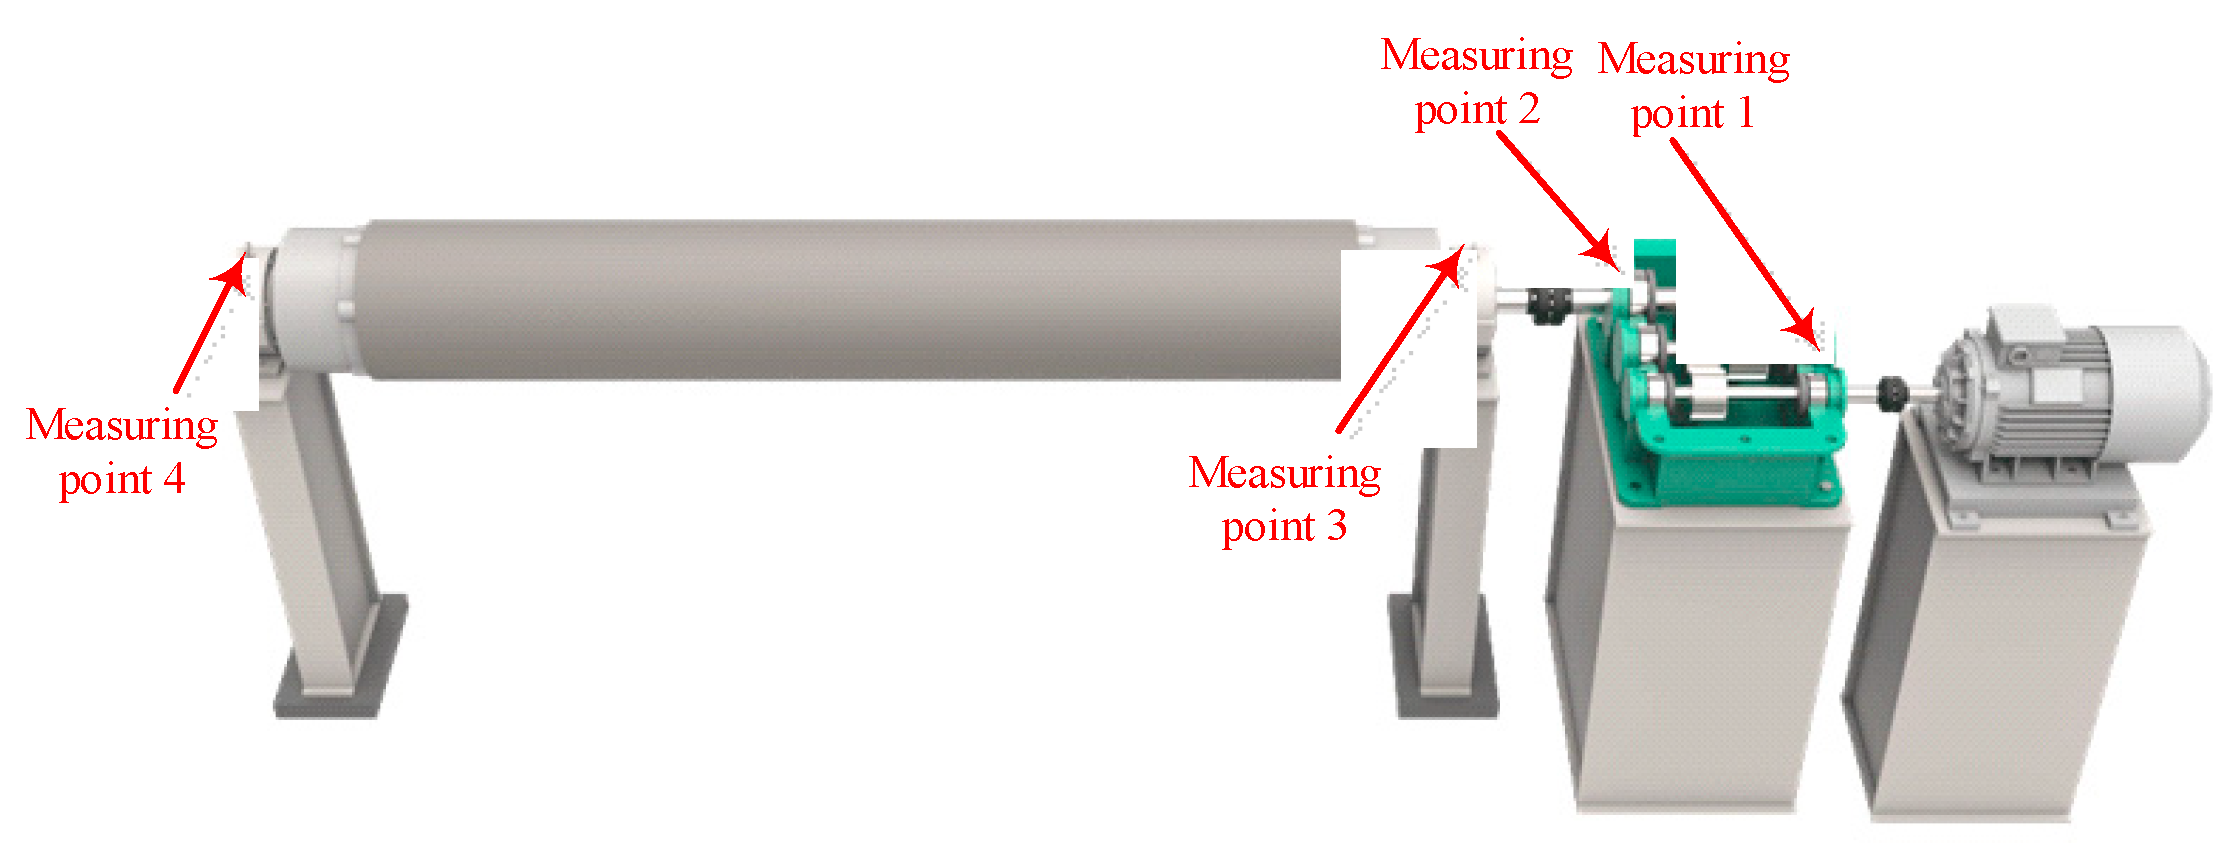
Figure 1. Diagram of the stationary adaptive filter and cyclic Wiener filter. (a) Diagram of stationary adaptive filter. (b) Diagram of cyclic Wiener filter.
Machines 10 00863 g001
Figure 2. Flowchart of the proposed method.
Machines 10 00863 g002
Figure 3. Simulated and noised vibration signal of faulty rolling bearing: (a) simulated vibraiton signal of fault bearing; (b) envelope spectrum of the signal as shown in (a); (c) the signal as shown in Figure 3a with added noise; (d) envelope spectrum of the signal as shown in (c).
Machines 10 00863 g003
Figure 4. Timedomain waveform of the filtered simulated signal using cyclic Wiener filter with its envelope spectrum: (a) time domain waveform of the filtered signal as shown in Figure 3c using cyclic Wiener filter. (b) Envelope spectrum of the signal as shown in (a).
Machines 10 00863 g004
Figure 5. The EES and IEES results of the signal as shown in Figure 4a. (a) Spectral coherence of the signal as shown in Figure 4a. (b) EES of the signal as shown in Figure 4a. (c) Optimal frequency band analysis result of the signal as shown in Figure 4a. (d) IEES of the signal as shown in Figure 4a.
Machines 10 00863 g005
Figure 6. Accelerated life test of rolling element bearing. (a) Accelerated bearing life tester, ABLT-1A; (b) sketch of load; (c) location of sensors.
Machines 10 00863 g006
Figure 7. Vibration signal of the bearing’ early weak fault stage: (a) Kurtosis index of the selected bearing over its whole lifecycle; (b) Amplitude of the selected bearing over its whole lifecycle; (c) Time-domain waveform of the vibration data at 2297th mim; (d) Envelope spectrum of the signal as shwon in Figure 7c.
Machines 10 00863 g007
Figure 8. Time-domain waveform of the filtered experimental signal using cyclic Wiener filter with its envelope spectrum. (a) Time domain waveform of the filtered signal as shown in Figure 7c using cyclic Wiener filter. (b) Envelope spectrum of the signal as shown in (a).
Machines 10 00863 g008
Figure 9. The EES and improved EES results of the signal as shown in Figure 8a. (a) Spectral coherence of the signal as shown in Figure 8a. (b) EES of the signal as shown in Figure 8a. (c) Optimal frequency band analysis result of the signal as shown in Figure 8a. (d) IEES of the signal as shown in Figure 8a.
Machines 10 00863 g009
Figure 10. Three-dimensional schematic of the engineering object with the layout of measuring points.
Machines 10 00863 g010
Figure 11. The fault occurring on the inner race of the engineering bearing.
Machines 10 00863 g011
Figure 12. The engineering data with its envelope spectrum result: (a) Time domain waveform of the engineering data; (b) Envelope sepctrum of the signal as shown in (a).
Machines 10 00863 g012
Figure 13. The filtered engineering data using cyclic Wiener filter with its envelope spectrum. (a) Time-domain waveform of the filtered signal as shown in Figure 12a using cyclic Wiener filter. (b) Envelope sepctrum of the signal as shown in (a).
Machines 10 00863 g013
Figure 14. The EES and improved EES results of the signal as shown in Figure 13a. (a) Spectral coherence of the signal as shown in Figure 13a. (b) EES of the signal as shown in Figure 13a. (c) Optimal frequency band analysis result of the signal as shown in Figure 13a. (d) IEES of the signal as shown in Figure 13a.
Machines 10 00863 g014
Table 1. Measured amplitudes of the four measuring points.
Measuring PointsMeasuring DirectionsVibration Amplitudes of January 20.2 pm (mm/s2)Vibration Amplitudes of January 21.2 pm (mm/s2)
1Horizontal5.726.17
2Horizontal9.689.01
3Vertical1.491.91
4Vertical4.0210.37
Table 2. Measured amplitudes of the four measuring points.
Bearing Type f i f o f c f b
230/560 CA/W33121100.53.642.2
Publisher’s Note: MDPI stays neutral with regard to jurisdictional claims in published maps and institutional affiliations.

