Article

PSO with Dynamic Adaptation of Parameters for Optimization in Neural Networks with Interval Type-2 Fuzzy Numbers Weights

1
Engineering Faculty, University Autonomous of Chihuahua, Chihuahua 31125, Mexico
2
Division of Graduate Studies, Tijuana Institute of Technology, Tijuana 22414, Mexico
3
Chemical Faculty of Sciences and Engineering, University Autonomous of Baja California, Tijuana 14418, Mexico
*
Author to whom correspondence should be addressed.
Axioms 2019, 8(1), 14; https://doi.org/10.3390/axioms8010014
Submission received: 4 December 2018 / Revised: 9 January 2019 / Accepted: 9 January 2019 / Published: 24 January 2019
(This article belongs to the Special Issue Type-2 Fuzzy Logic: Theory, Algorithms and Applications)

Abstract

:
A dynamic adjustment of parameters for the particle swarm optimization (PSO) utilizing an interval type-2 fuzzy inference system is proposed in this work. A fuzzy neural network with interval type-2 fuzzy number weights using S-norm and T-norm is optimized with the proposed method. A dynamic adjustment of the PSO allows the algorithm to behave better in the search for optimal results because the dynamic adjustment provides good synchrony between the exploration and exploitation of the algorithm. Results of experiments and a comparison between traditional neural networks and the fuzzy neural networks with interval type-2 fuzzy numbers weights using T-norms and S-norms are given to prove the performance of the proposed approach. For testing the performance of the proposed approach, some cases of time series prediction are applied, including the stock exchanges of Germany, Mexican, Dow-Jones, London, Nasdaq, Shanghai, and Taiwan.

1. Introduction

In time series prediction problems, the main objective is to obtain results that approximate the real data as closely as possible with minimum error. The use of intelligent systems for working with time series problems is widely utilized [1,2]. For example, Zhou et al. [3] used a dendritic mechanism in a neural model and phase space reconstruction (PSR) for the prediction of a time series, and Hrasko et al. [4] presented a prediction of a time series with a Gaussian-Bernoulli restricted Boltzmann machine hybridized with the backpropagation algorithm.
For optimization problems, the principle objective is to work in a search space to encounter an optimal choice among a set of potential solutions. In many cases, the search space is too wide, which means that the time used for obtaining an optimal solution is very extensive. To improve the optimization and search problems, a set of methods of computational intelligence was the focus of some recent work in improving the solving of optimization and search problems [5,6,7]. These methods can achieve competitive results, but not the best solutions. Furthermore, heuristic algorithms can be used like alternative methods. Although these algorithms are not guaranteed to find the best solution, they are able to obtain an optimal solution in a reasonable time.
The main contribution is the dynamic adaptation of the parameters for particle swarm optimization (PSO) used to optimize parameters for a neural network with interval type-2 fuzzy numbers weights with different T-norms and S-norms, proposed in Gaxiola et al. [8] and used to perform the prediction of financial time series [9,10,11].
The adaptation of parameters is performed with a Type-2 fuzzy inference system (T2-FIS) to adjust the c 1 and c 2 parameters for the particle swarm optimization. This adaptation is based on the work of Olivas et al. [12], who used interval type-2 fuzzy logic to improve the convergence and diversity of PSO to optimize the minimum for several mathematical functions. In this work, control of the c 1 and c 2 parameters is performed using fuzzy rules to achieve a good dynamic adaptation [13,14].The use of type-2 fuzzy logic gives a better performance in our work and this is justified by recent research from Wu and Tan [15] and Sepulveda et al. [16], who demonstrated that interval type-2 fuzzy systems perform better than type-1 fuzzy systems.
The neural network with interval type-2 fuzzy numbers weights optimized with the proposed approach is different from others works using the adjustment of weights in neural networks [17,18], such as James and Donald [19,20].
A comparison of the performance of the traditional neural network compared to the proposed optimization for the fuzzy neural network with interval type-2 fuzzy numbers weights is performed in this paper. In this case, a prediction for a financial time series is used to verify the efficiency of the proposed method.
The use of T-norms and S-norms of sum-product can be seen in Hamacher [21,22]. Olivas [23] developed a new method for PSO of parameter adaptation using fuzzy logic. In their work, the authors improved the performance of the traditional PSO. We decided to use the parameter adaptation because in previous works, we have had good results with other metaheuristic methods. For instance, in [24], we proposed a gravitational search algorithm (GSA) with parameter adaptation to improve the original GSA metaheuristic algorithm. The next section states the theoretical approach to the work in the paper. Section 3 presents the background research performed to adjust the parameters in PSO, as well as research performed in the neural network area with fuzzy numbers. Section 4 explains the proposed approach and a description of the problem to be solved in the paper. Section 5 presents the simulation results for the proposed approach. Section 6 presents a discussion of the results of the experiments. Finally, in Section 7, conclusions are shown.

2. Theoretical Basement

2.1. Particle Swarm Optimization (PSO)

Kennedy and Eberhart [25] introduced a bio-inspired algorithm based on the behavior of a swarm of particles “flying” (moving around) through a multidimensional space search, and the potential solutions to the problem are represented as particles [26]. The dynamics of the algorithm are performed by adjusting the position of each particle based on the experience acquired for each particle and its neighbors [27,28]. The search in PSO is defined by the equations to update the position (Equation (1)) and velocity (Equation (2)) of each particle, respectively:
  • x i ( t + 1 ) = x i ( t ) + v i ( t + 1 )
    where:
    • x i is the particle i .
    • t is the current iteration.
    • v i is the velocity of the particle i .
  • v i ( t + 1 ) = v i j ( t ) + c 1 r 1 ( t ) [ y i j ( t ) x i j ( t ) ] + c 2 r 2 ( t ) [ y ^ j ( t ) x i j ( t ) ]
    where:
    • v i is the velocity of the particle i in the dimension j .
    • c 1 is the cognitive factor (importance of the best previous position of the particle).
    • c 2 is the social factor (importance of the best global position of the swarm).
    • r 1 , r 2 are random values in the range of [0, 1].
    • y i j is the best position of the particle i in the dimension j .
    • x i j is the current position of the particle i in the dimension j .
    • y ^ j is the best global position of the swarm in the dimension j .
In Figure 1, the movements of a particle in the search space according to Equations (1) and (2) are presented.
The triangle and rhombus points represent the movement of the particle with a change in the parameters, c 1 and c 2 . The triangle point is the result for the case when c 1 > c 2 , in this case, the swarm performs exploration and “fly” in the search space to find a best area which allows the obtainment of the global best position; so, the exploration allows the particles to perform long movements for travelling in all the search space. The rhombus point is the result for the case when c 1 < c 2 , in this case, the swarm uses exploitation and “fly” in the best area of the search space with short movements to perform an exhaustive search in the best area.

2.2. Type-2 Fuzzy Systems

Zadeh [29] introduced the approach of type-2 fuzzy sets as an extension of the type-1 fuzzy sets. Later, Mendel and John [30] defined the type-2 fuzzy set as follows:
A ~ = { [ ( x , u ) , μ A ~ ( x , u ) ] | x X , u J x [ 0 , 1 ] }
where
  • A ~ is a type-2 fuzzy set.
  • μ A ~ ( x , u ) is a type-2 membership function.
  • J x is called primary membership function of A ~ .
The type-2 fuzzy set (T2FS) consists of generating a bounded region of uncertainty in the primary membership, called the footprint of uncertainty (FOU) [31]. The interval type-2 fuzzy sets are a particular case of T2FS in which the FOU is generated by the union of two type-1 membership functions (MF), a lower MF (LMF) and an upper MF (UMF) [32]. For IT2FS, the defuzzification is performed by the calculation of the centroid of the FOU founded in Karnik and Mendel [33]. The use of a T2FS allows the handling of more uncertainty and provides fuzzy systems with more robustness than a type-1 fuzzy sets [34,35,36].

2.3. Fuzzy Neural Network

The area of fuzzy neural networks consists in developing hybrid algorithms that implement the approach of neural networks architectures with fuzzy logic theory [17,18,37,38].

3. Antecedents Development

The PSO bio-inspired algorithm has received many improvements in their performance by many researchers. The most important modifications made to PSO are to increment the diversity of the swarm and to enhance the convergence [39,40].
Olivas et al. [12] proposed a method to dynamically adjust the parameters of particle swarm optimization using type-2 and type-1 fuzzy logic.
Muthukaruppan and Er [41] presented a hybrid algorithm of particle swarm optimization using a fuzzy expert system in the diagnosis of coronary artery disease.
Taher et al. [42] developed a fuzzy system to perform an adjustment of the parameters, c 1 , c 2 , and w (inertia weight), for the particle swarm optimization.
Wang et al. [43] presented a PSO variant utilizing a fuzzy system to implement changes in the velocity of the particle according to the distance between all particles. If the distance is small, the velocity of some particles is modified drastically.
Hongbo and Abraham [44] proposed a new parameter, called the minimum velocity threshold, to the equation used to calculate the velocity of the particle. The approach consists in that the new parameter performs the control in the velocity of the particles and applies fuzzy logic to make the new parameter dynamically adaptive.
Shi and Eberhart [45] presented a dynamic adaptive PSO to adjust the inertia weight utilizing a fuzzy system. The fuzzy system works with two input variables, the current inertia weight and the current best performance evaluation, and the change of the inertia weight is the output variable.
In neural networks, the use of fuzzy logic theory to obtain hybrid algorithms has improved the results for several problems [46,47,48]. In this area, some significant papers of works with fuzzy numbers are presented [49,50]:
Dunyak et al. [51] proposed a fuzzy neural network that works with fuzzy numbers for the obtainment of new weights (inputs and outputs) in the step of training. Coroianu et al. [52] presented the use of the inverse F-transform to obtain the optimal fuzzy numbers, preserving the support and the convergence of the core.
Li Z. et al. [53] proposed a fuzzy neural network that works with two fuzzy numbers to calculate the results with operations, like subtraction, addition, division, and multiplication. Fard et al. [54] presented a fuzzy neural network utilizing sum and product operations for two interval type-2 triangular fuzzy numbers in combination with the Stone-Weierstrass theorem.
Molinari [55] proposed a comparison of generalized triangular fuzzy numbers with other fuzzy numbers. Asady [56] presented a comparison of a new method for approximation trapezoidal fuzzy numbers with methods of approximation in the literature.
Figueroa-García et al. [57] presented a comparison for different interval type-2 fuzzy numbers performing distance measurement. Requena et al. [58] proposed a fuzzy neural network working with trapezoidal fuzzy numbers to obtain the distance between the numbers and utilized a proposed decision personal index (DPI).
Valdez et al. [59] proposed a novel approach applied to PSO and ACO algorithms. They used fuzzy systems to dynamically update the parameters for the two algorithms. In addition, as another important work, we can mention Fang et al. in [60], who proposed a hybridized model of a phase space reconstruction algorithm (PSR) with the bi-square kernel (BSK) regression model for short term load forecasting. Also, it is worth mentioning the interesting work of Dong et al. [61], who proposed a hybridization method using the support vector regression (SVR) model with a cuckoo search (CS) algorithm for short term electric load forecasting.

4. Proposed Method and Problem Description

In this work, the optimization for interval type-2 fuzzy number weights neural networks (IT2FNWNN) using particle swarm optimization (PSO) is proposed. The PSO is dynamically adapted utilizing interval type-2 fuzzy systems. A comparison of the traditional neural network and the IT2FNWNN optimized with PSO is performed. The operations in the neurons are obtained with calculation of T-norms and S-norms of the sum-product, Hamacher and Frank [62,63,64].
For testing the proposed method, the prediction of the financial time series of the stock exchange markets of Germany, Mexican, Dow-Jones, London, Nasdaq, Shanghai, and Taiwan is performed. The databases consisted of 1250 data for each time series (2011 to 2015).
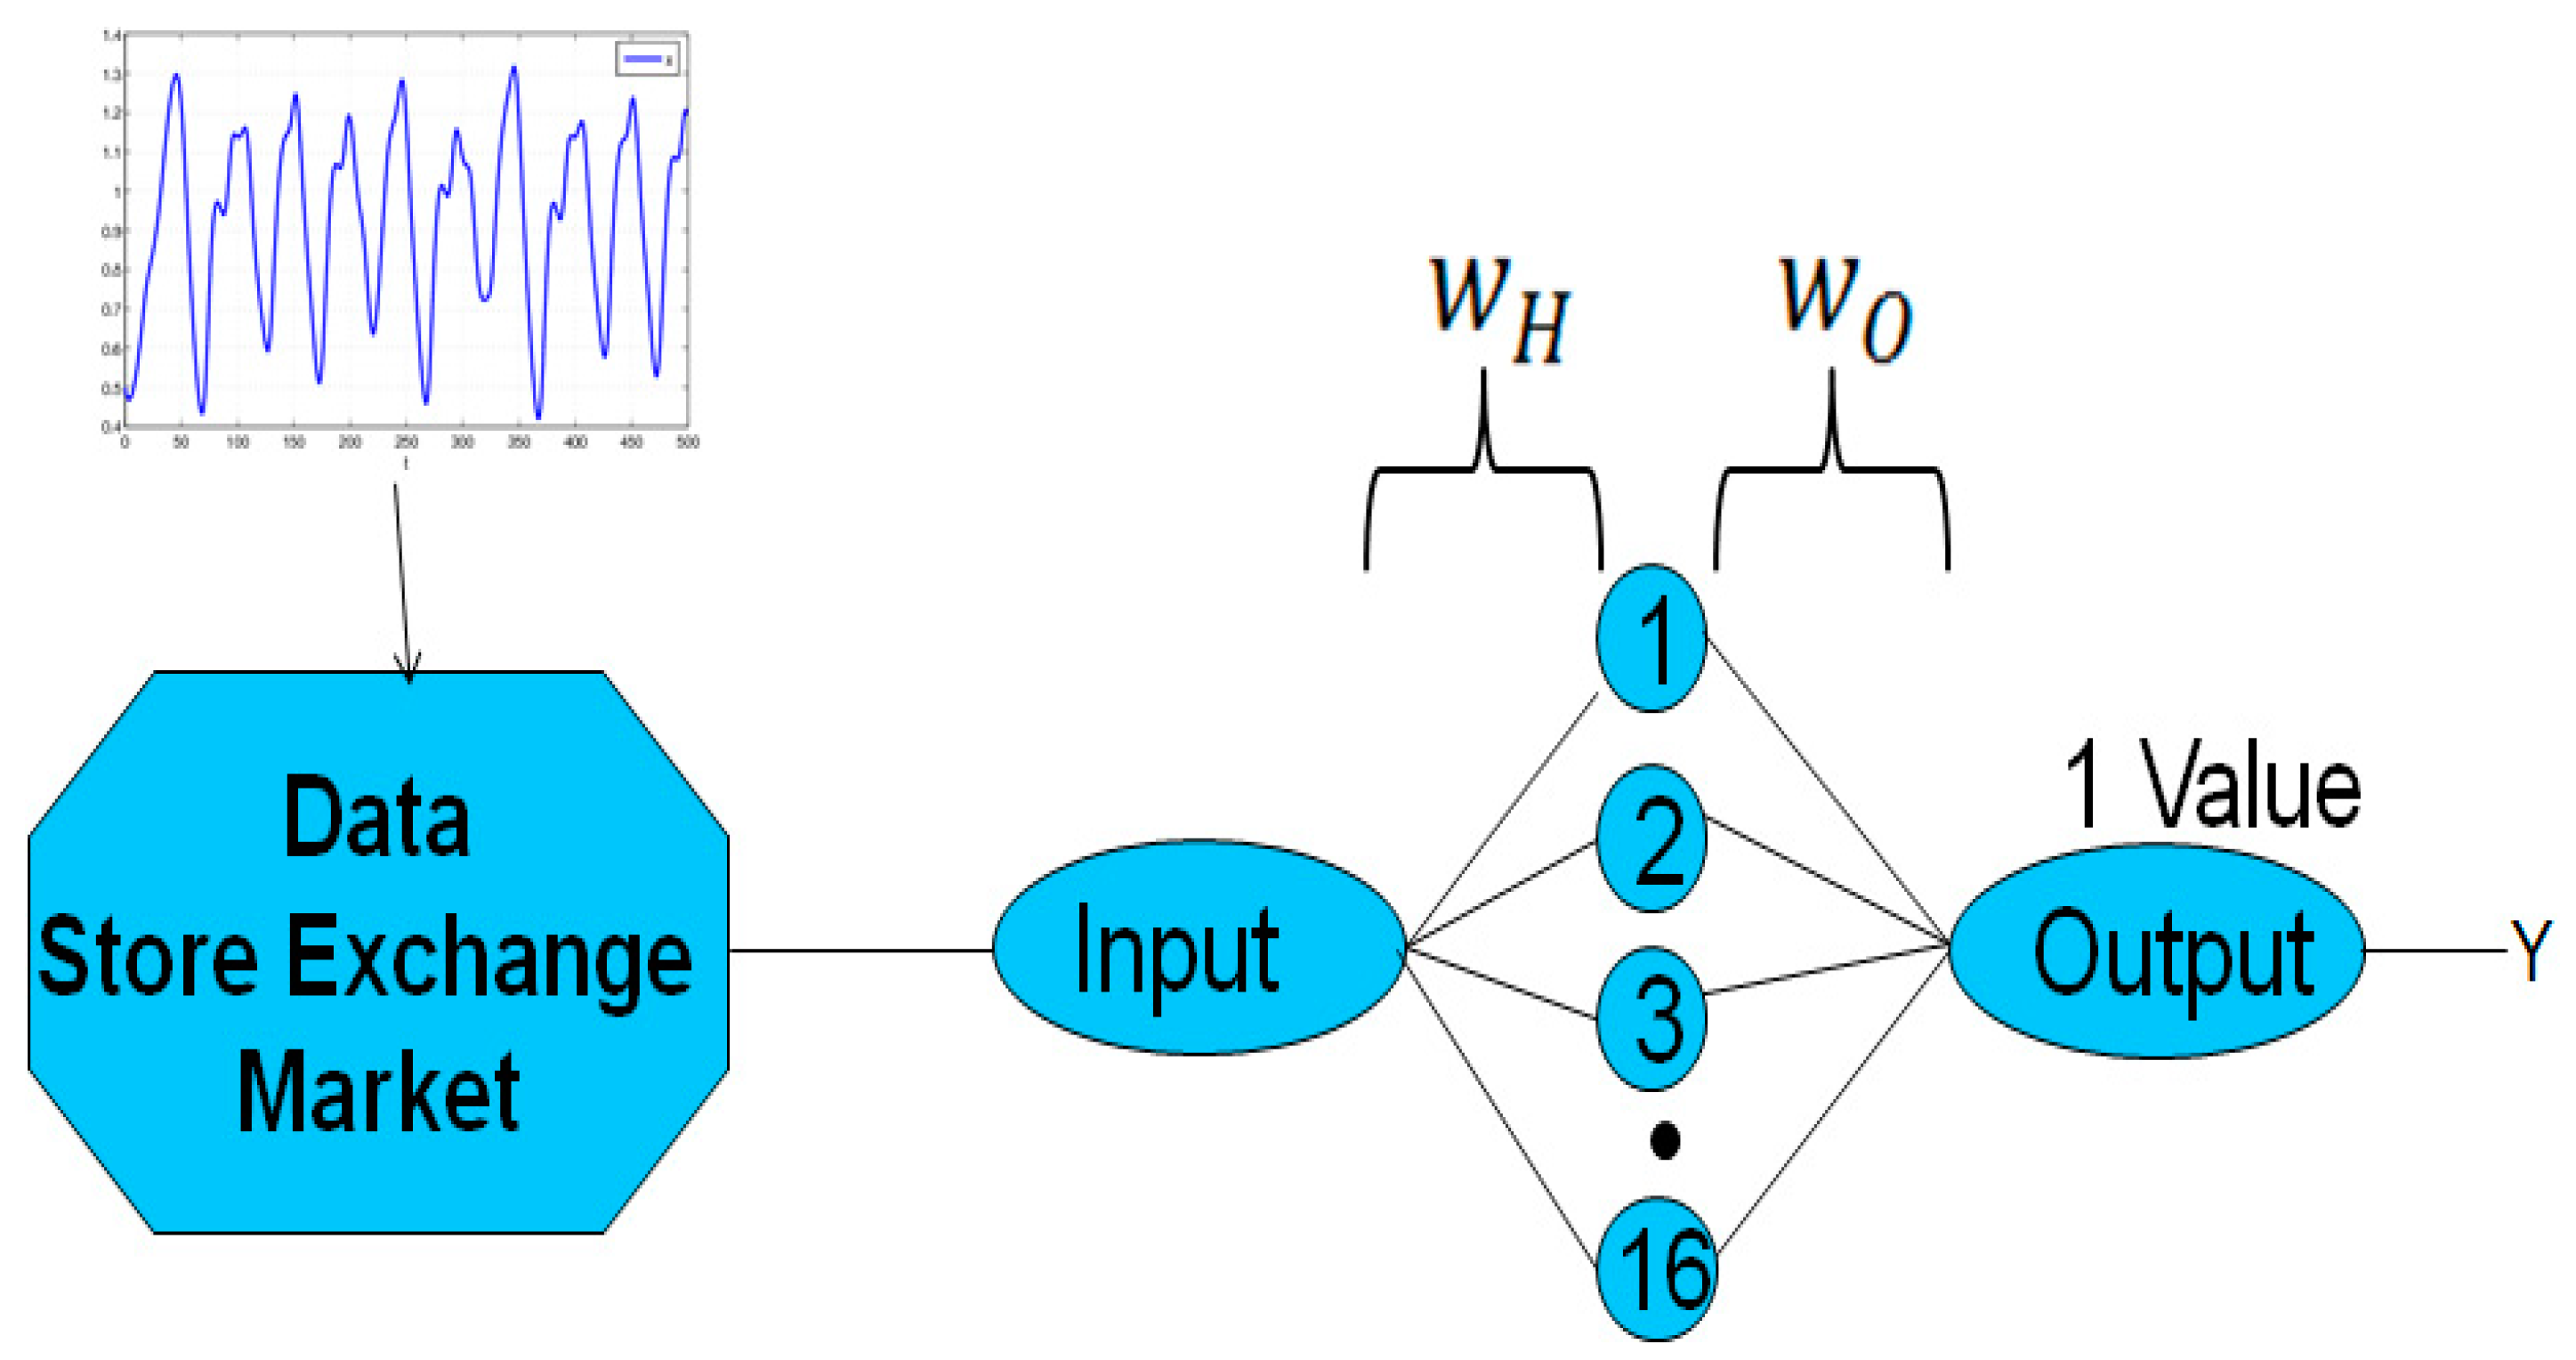
The architecture of the traditional neural network used in this paper (see Figure 2) consists of 16 neurons for the hidden layer and one neuron for the output layer.
The architecture of the interval type-2 fuzzy number weight neural network (IT2FNWNN) has the same structure of the traditional neural network, with 16, 39, and 19 neurons in the hidden layer for the sum-product, Hamacher and Frank, respectively, and one neuron for the output layer (see Figure 3) [8].
The IT2FNWNN work with fuzzy numbers weights in the connections between the layers, and these weights are represented as follows [8]:
w ˜ = [ w _ , w ¯ ]
where w ¯ and w ¯ are obtained using the Nguyen-Widrow algorithm [65] in the initial execution of the network.
The linear function as the activation function for the output neuron and the secant hyperbolic for the hidden neurons are applied. The S-Norm and T-Norm for obtaining the lower and upper outputs of the neurons are applied, respectively. For the lower output, the S-Norm is used and for the upper output, the T-Norm is utilized. The T-Norms and S-Norms used in this work are described as follows:
Sum-product:
T N o r m ( N e t ¯ , N e t ¯ ) = N e t ¯ . ×   N e t ¯
S N o r m ( N e t ¯ , N e t ¯ ) = N e t ¯ + N e t ¯ T N o r m ( N e t ¯ , N e t ¯ )
Hamacher: for γ > 0 .
T N o r m H ( N e t ¯ , N e t ¯ , γ ) = N e t ¯ . × N e t ¯ γ + ( 1 γ ) ( N e t ¯ + N e t ¯ N e t ¯ . × N e t ¯ )
S N o r m H ( N e t ¯ , N e t ¯ , γ ) = N e t ¯ + N e t ¯ + ( γ 2 ) ( N e t ¯ . × N e t ¯ ) 1 + ( γ 1 ) ( N e t ¯ . × N e t ¯ )
Frank: for s > 0 .
T N o r m F ( N e t ¯ , N e t ¯ , s ) = l o g s [ 1 + ( s N e t ¯ 1 ) ( s N e t ¯ 1 ) s 1 ]
S N o r m F ( N e t ¯ , N e t ¯ , s ) = 1 l o g s [ 1 + ( s 1 N e t ¯ 1 ) ( s 1 N e t ¯ 1 ) s 1 ]
The back-propagation algorithm using gradient descent and an adaptive learning rate is implemented for the neural networks.
A modification of the back-propagation algorithm that allows operations with interval type-2 fuzzy numbers to obtain new weights for the forthcoming epochs of the fuzzy neural network is proposed [8].
The particle swarm optimization (PSO) is used to optimize the number of neurons for the IT2FNWNN for operations with S-norm and T-norm of Hamacher and Frank. Also, for Hamacher, the parameter, γ, is optimized, and for Frank, the parameter, s, is optimized.
The parameters used in the PSO to optimize the IT2FNWNN are presented in Table 1. The same parameters and design are applied to optimize all the IT2FNWNN for all the financial time series.
In the literature [27], the recommended values for the c 1 and c 2 parameters are in the interval of 0.5 and 2.5; also, the change of these parameters in the iterations of the PSO can generate better results.
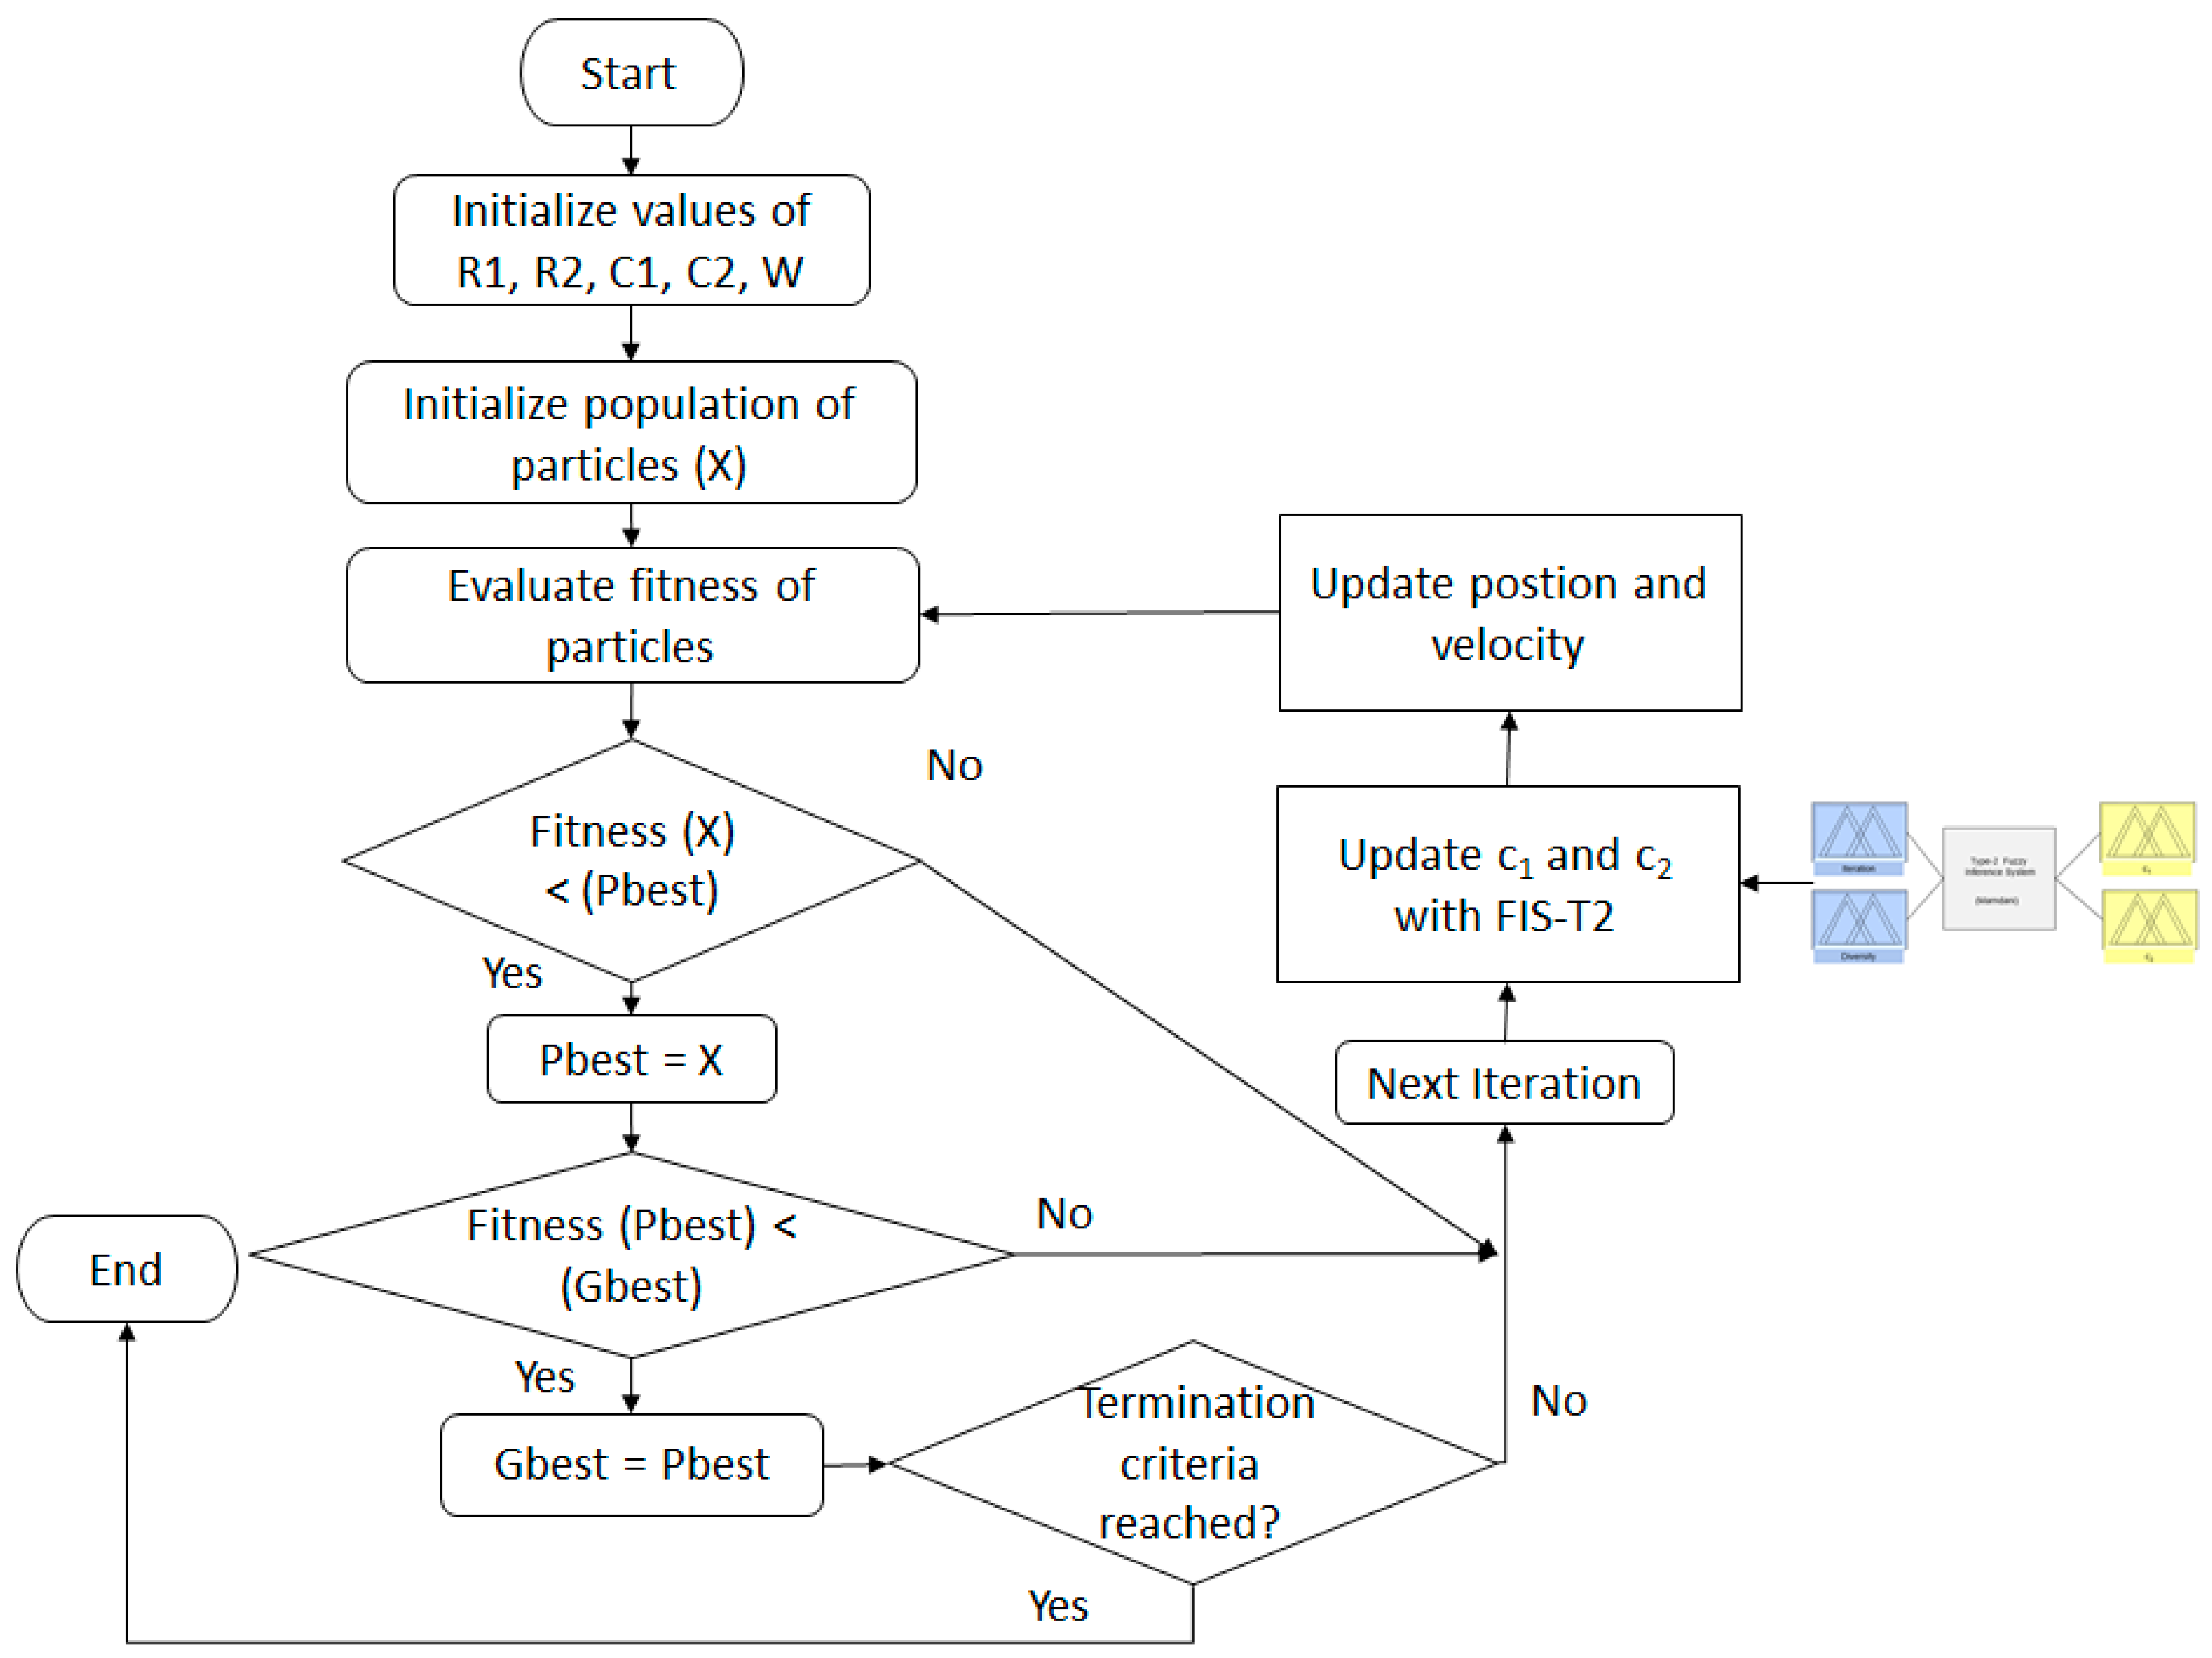
In the PSO used to optimize the IT2FNWNN, the parameters, c 1 and c 2 , from Equation (2) are selected to perform the dynamic adjustment utilizing an interval type-2 fuzzy inference system (IT2FIS).This selection is in the base as these parameters allow the particles to generate movements for performing the exploration or exploitation in the search space. The structure of the IT2FIS utilized in the PSO is presented in Figure 4.
Based on the literature [12,66,67], the inputs selected for the IT2FIS are the diversity of the swarm and the percentage of iterations. Also, in [68], a problem of online adaptation of radial basis function (RBF) neural networks is presented. The authors present a new adaptive training, which is able to modify both the structure of the network (the number of nodes in the hidden layer) and the output weights.
The diversity input is defined by Equation (11), in which the degree of the dispersion of the swarm is calculated. This means that for less diversity, the particles are closer together, and for high diversity, the particles are more separated. The diversity equation can be taken as the average of the Euclidean distances amongst each particle and the best particle:
D i v e r s i t y ( t ) = 1 n s i = 1 n s j = 1 n x [ x i j ( t ) x j ¯ ( t ) ]
where:
  • x i j ( t ) : represents the particle in the iteration t.
  • x j ¯ ( t ) : represents the best particle in the iteration t.
For the diversity variable, normalization is performed based on Equation (12), taking values in the range of 0 to 1:
D i v e r s i t y N o r m = { 0 , i f m i n D i v e r = m a x D i v e r D i v e r N o r m , i f m i n D i v e r m a x D i v e r
where:
  • minDiver: Minimum Euclidian distance for the particle.
  • maxDiver: Maximum Euclidian distance for the particle.
  • DiverNorm: Value obtained with Equation (13).
    D i v e r N o r m = D i v e r s i t y m i n D i v e r m a x D i v e r m i n D i v e r
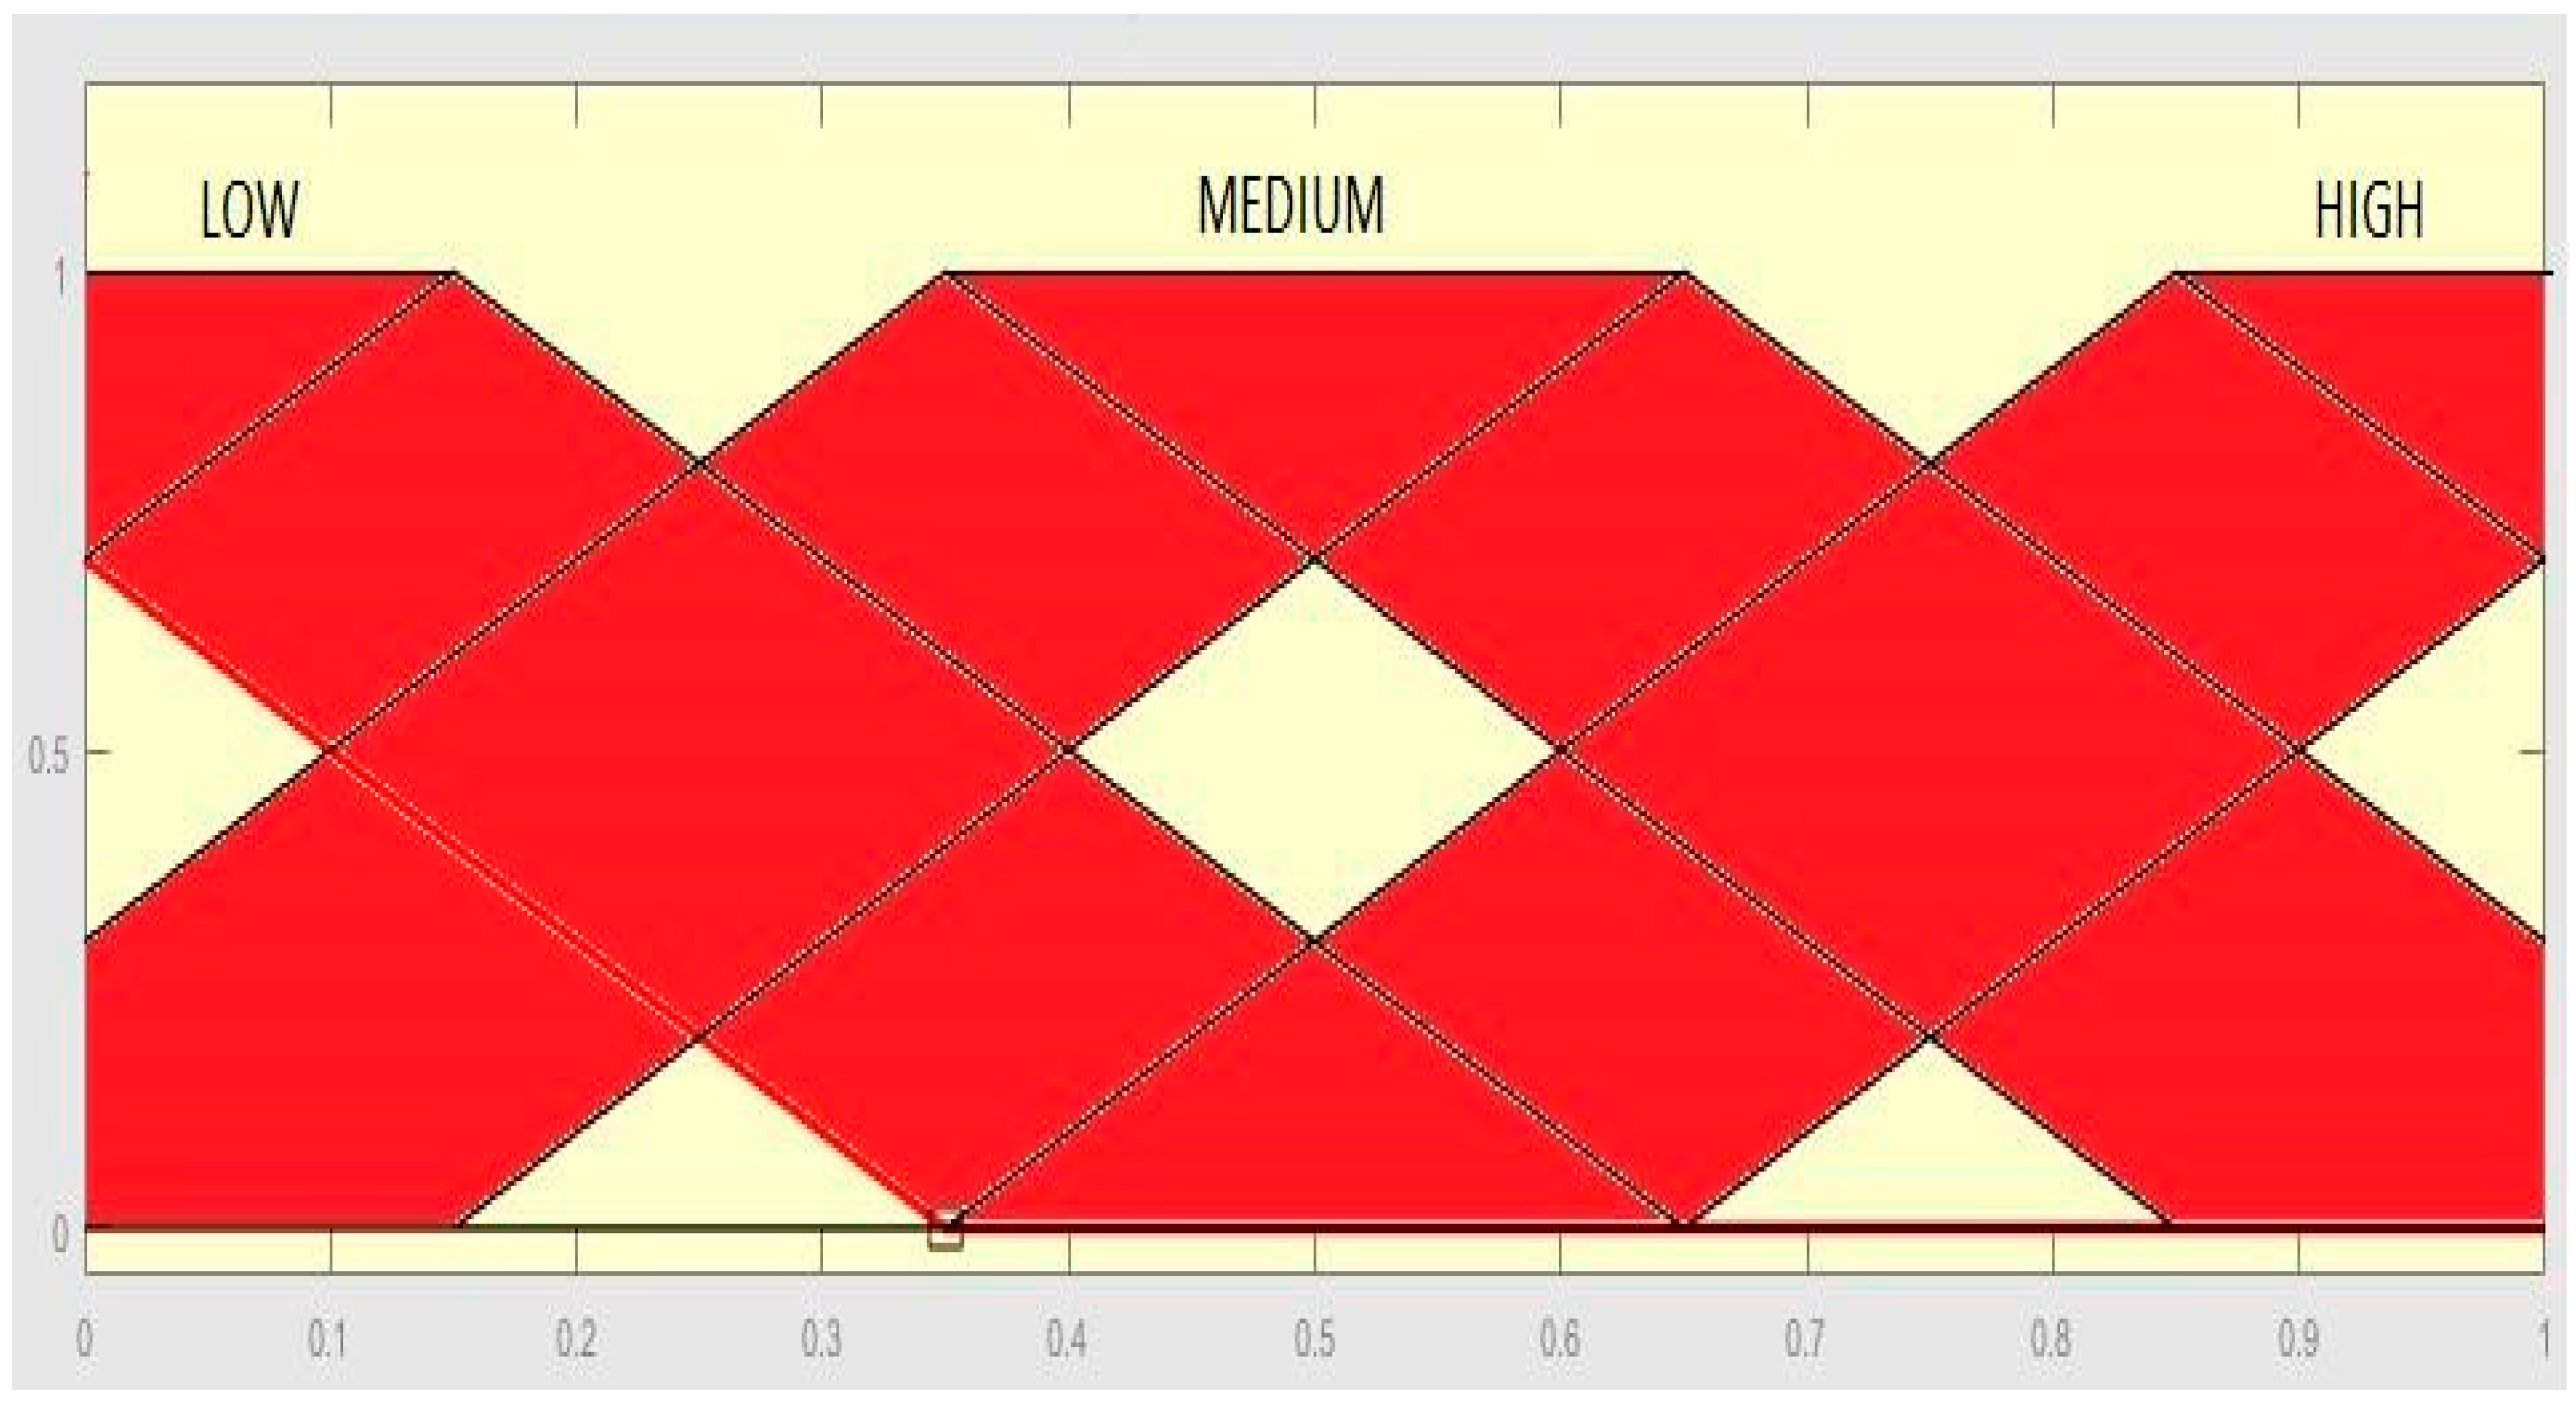
The membership functions for the input diversity are presented in Figure 5.
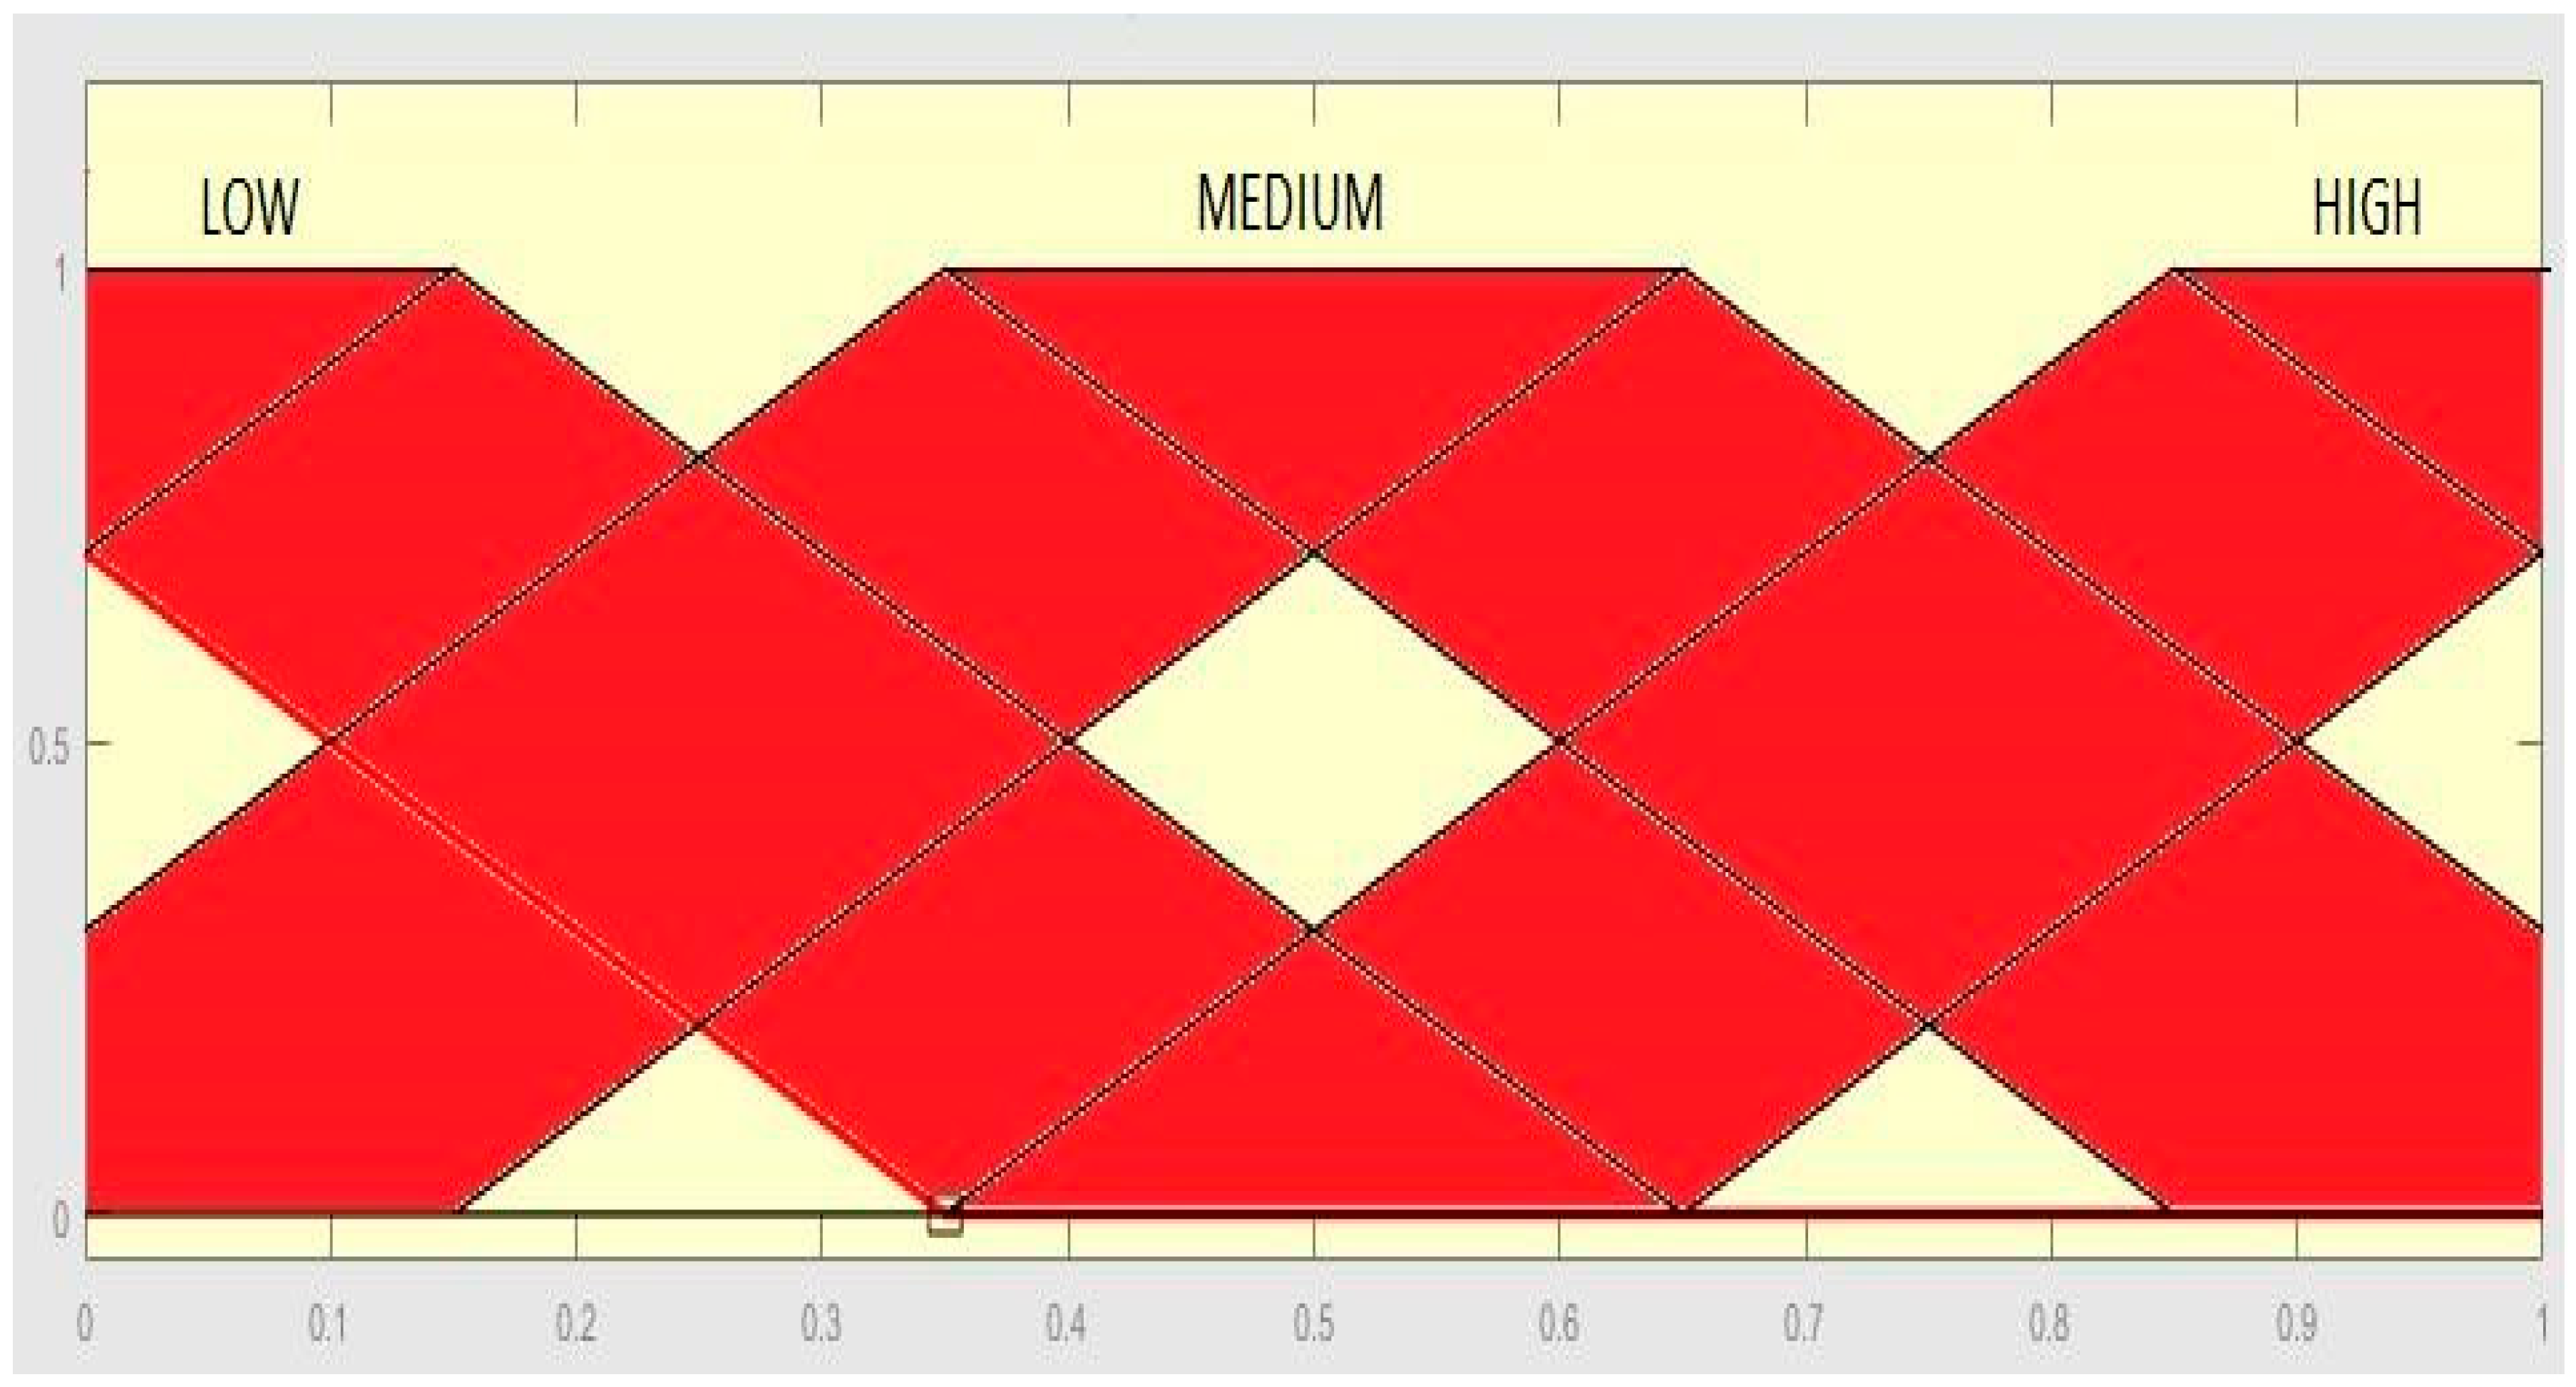
The iteration input is considered as a percentage of iterations during the execution of the PSO, the values for this input are in the range from 0 to 1. In the start of the algorithm, the iteration is considered as 0% and is increased until it reaches 100% at the end of the execution. The values are obtained as follows:
I t e r a t i o n = C u r r e n t i t e r a t i o n T o t a l o f i t e r a t i o n s
The membership functions for the input iteration are presented in Figure 6.
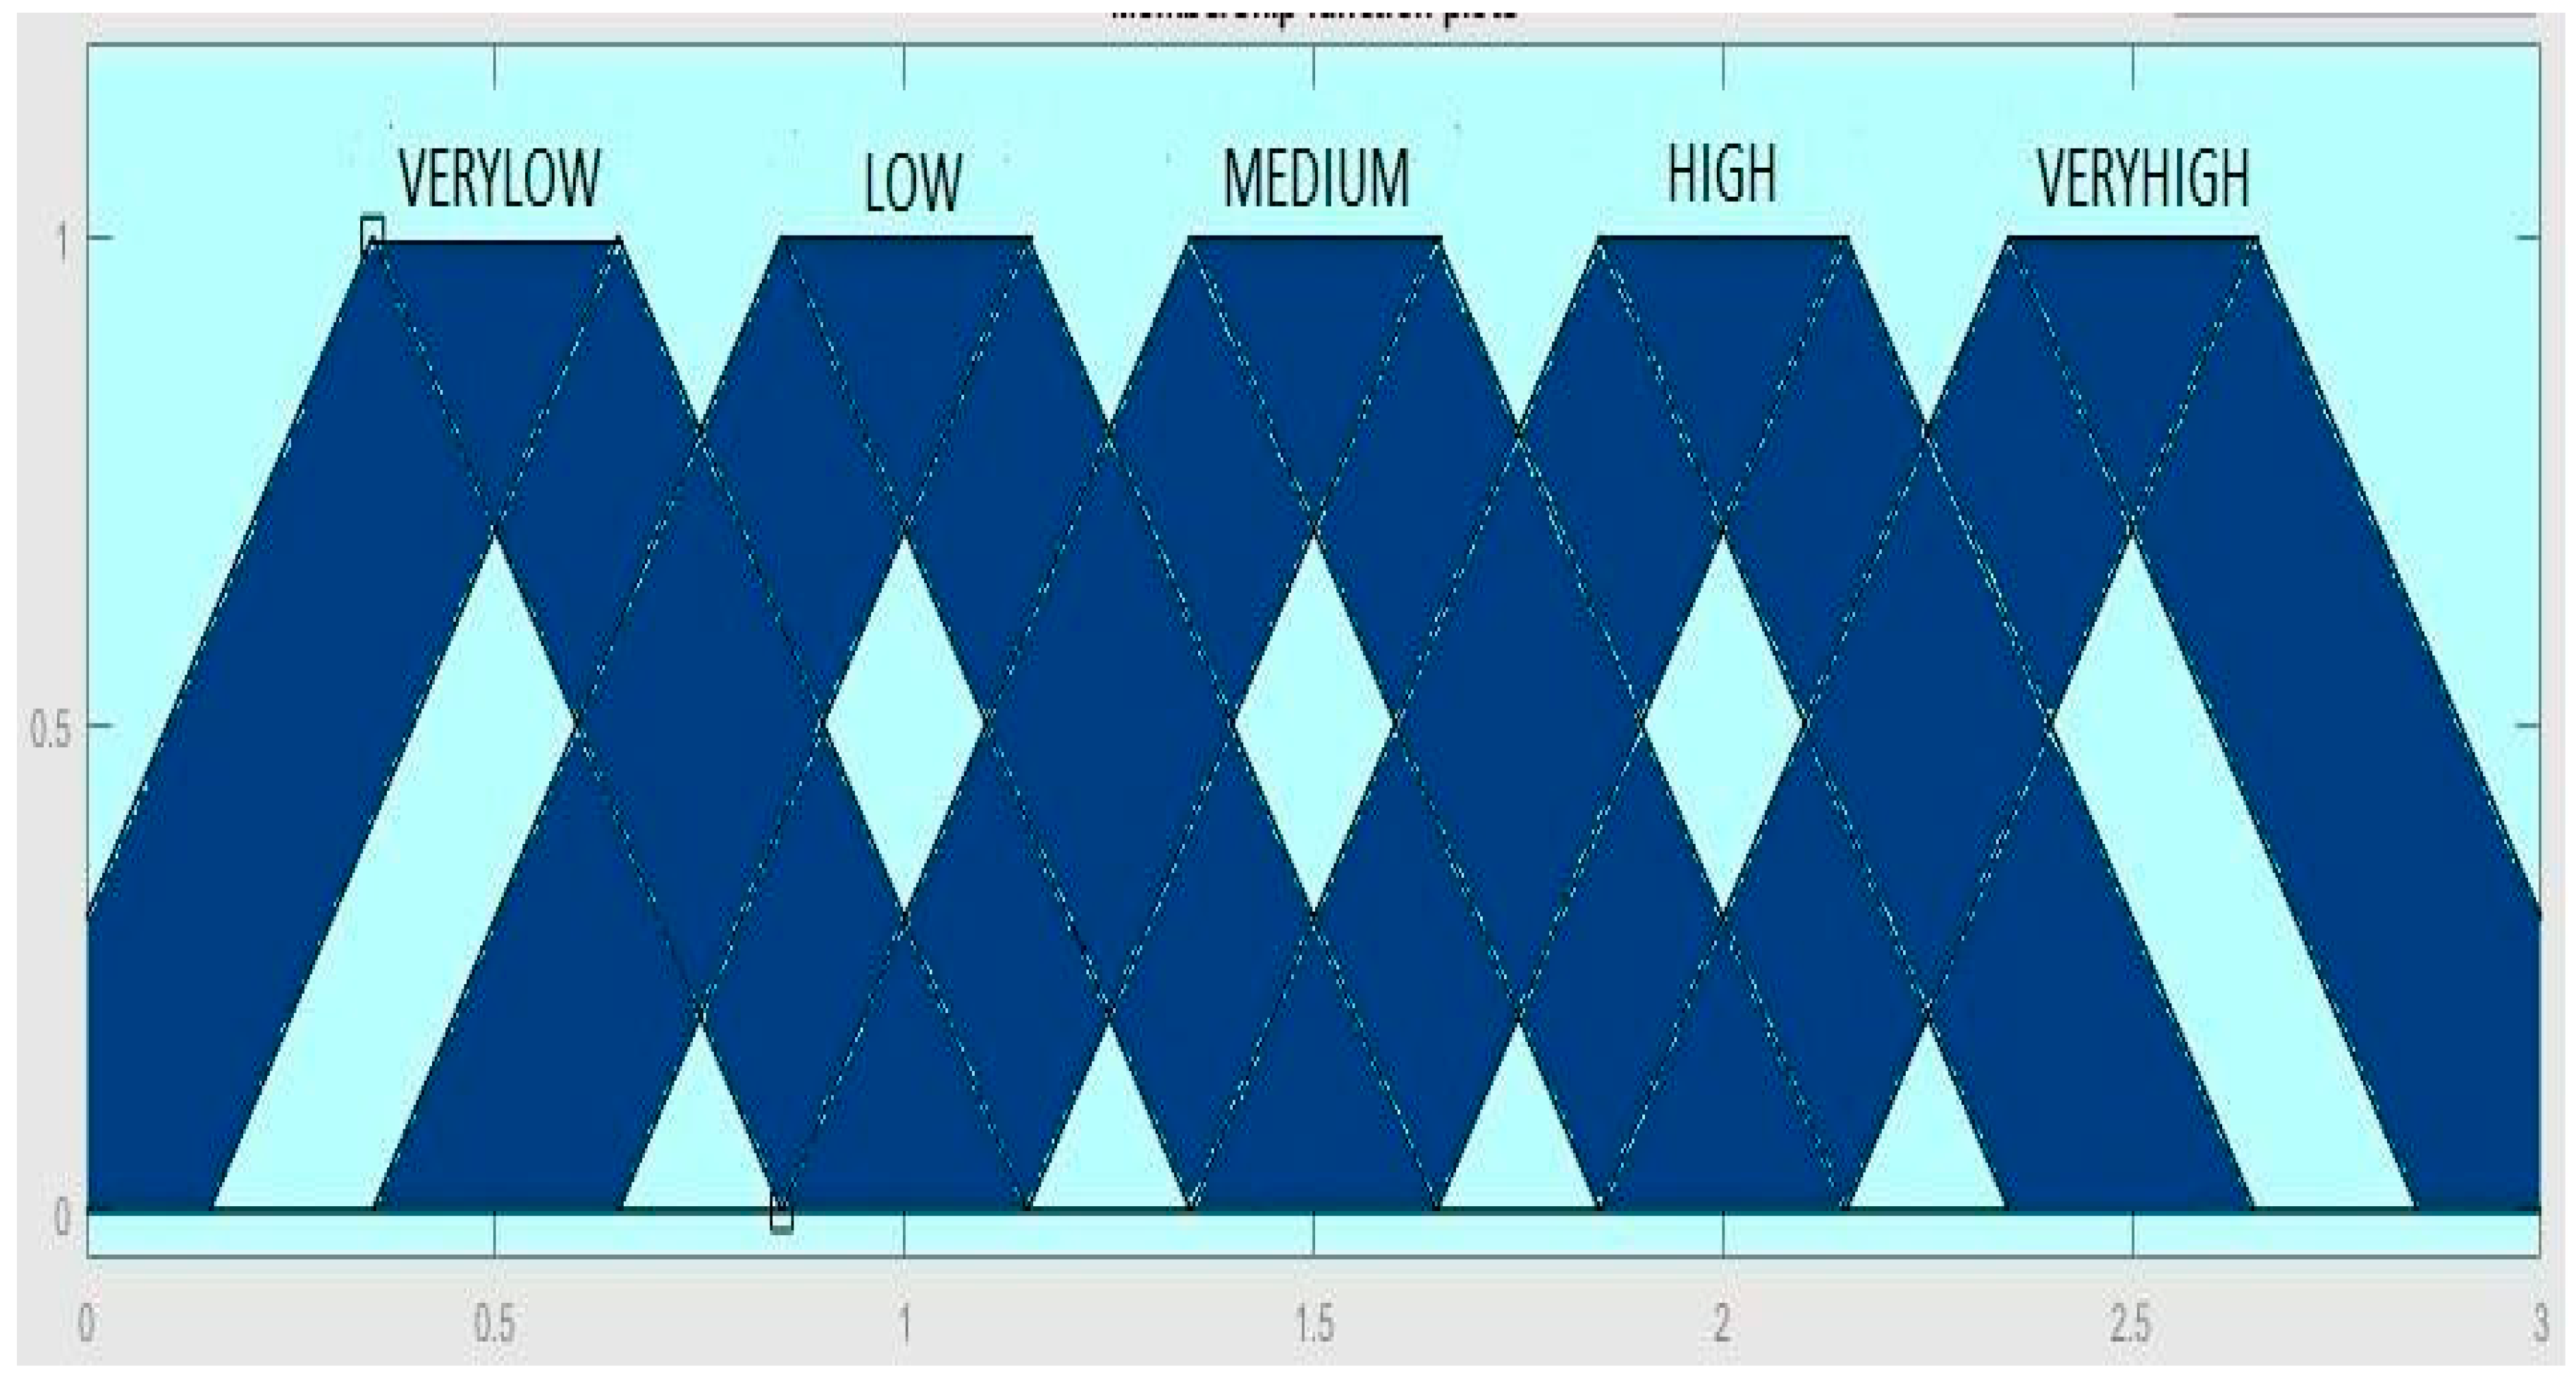
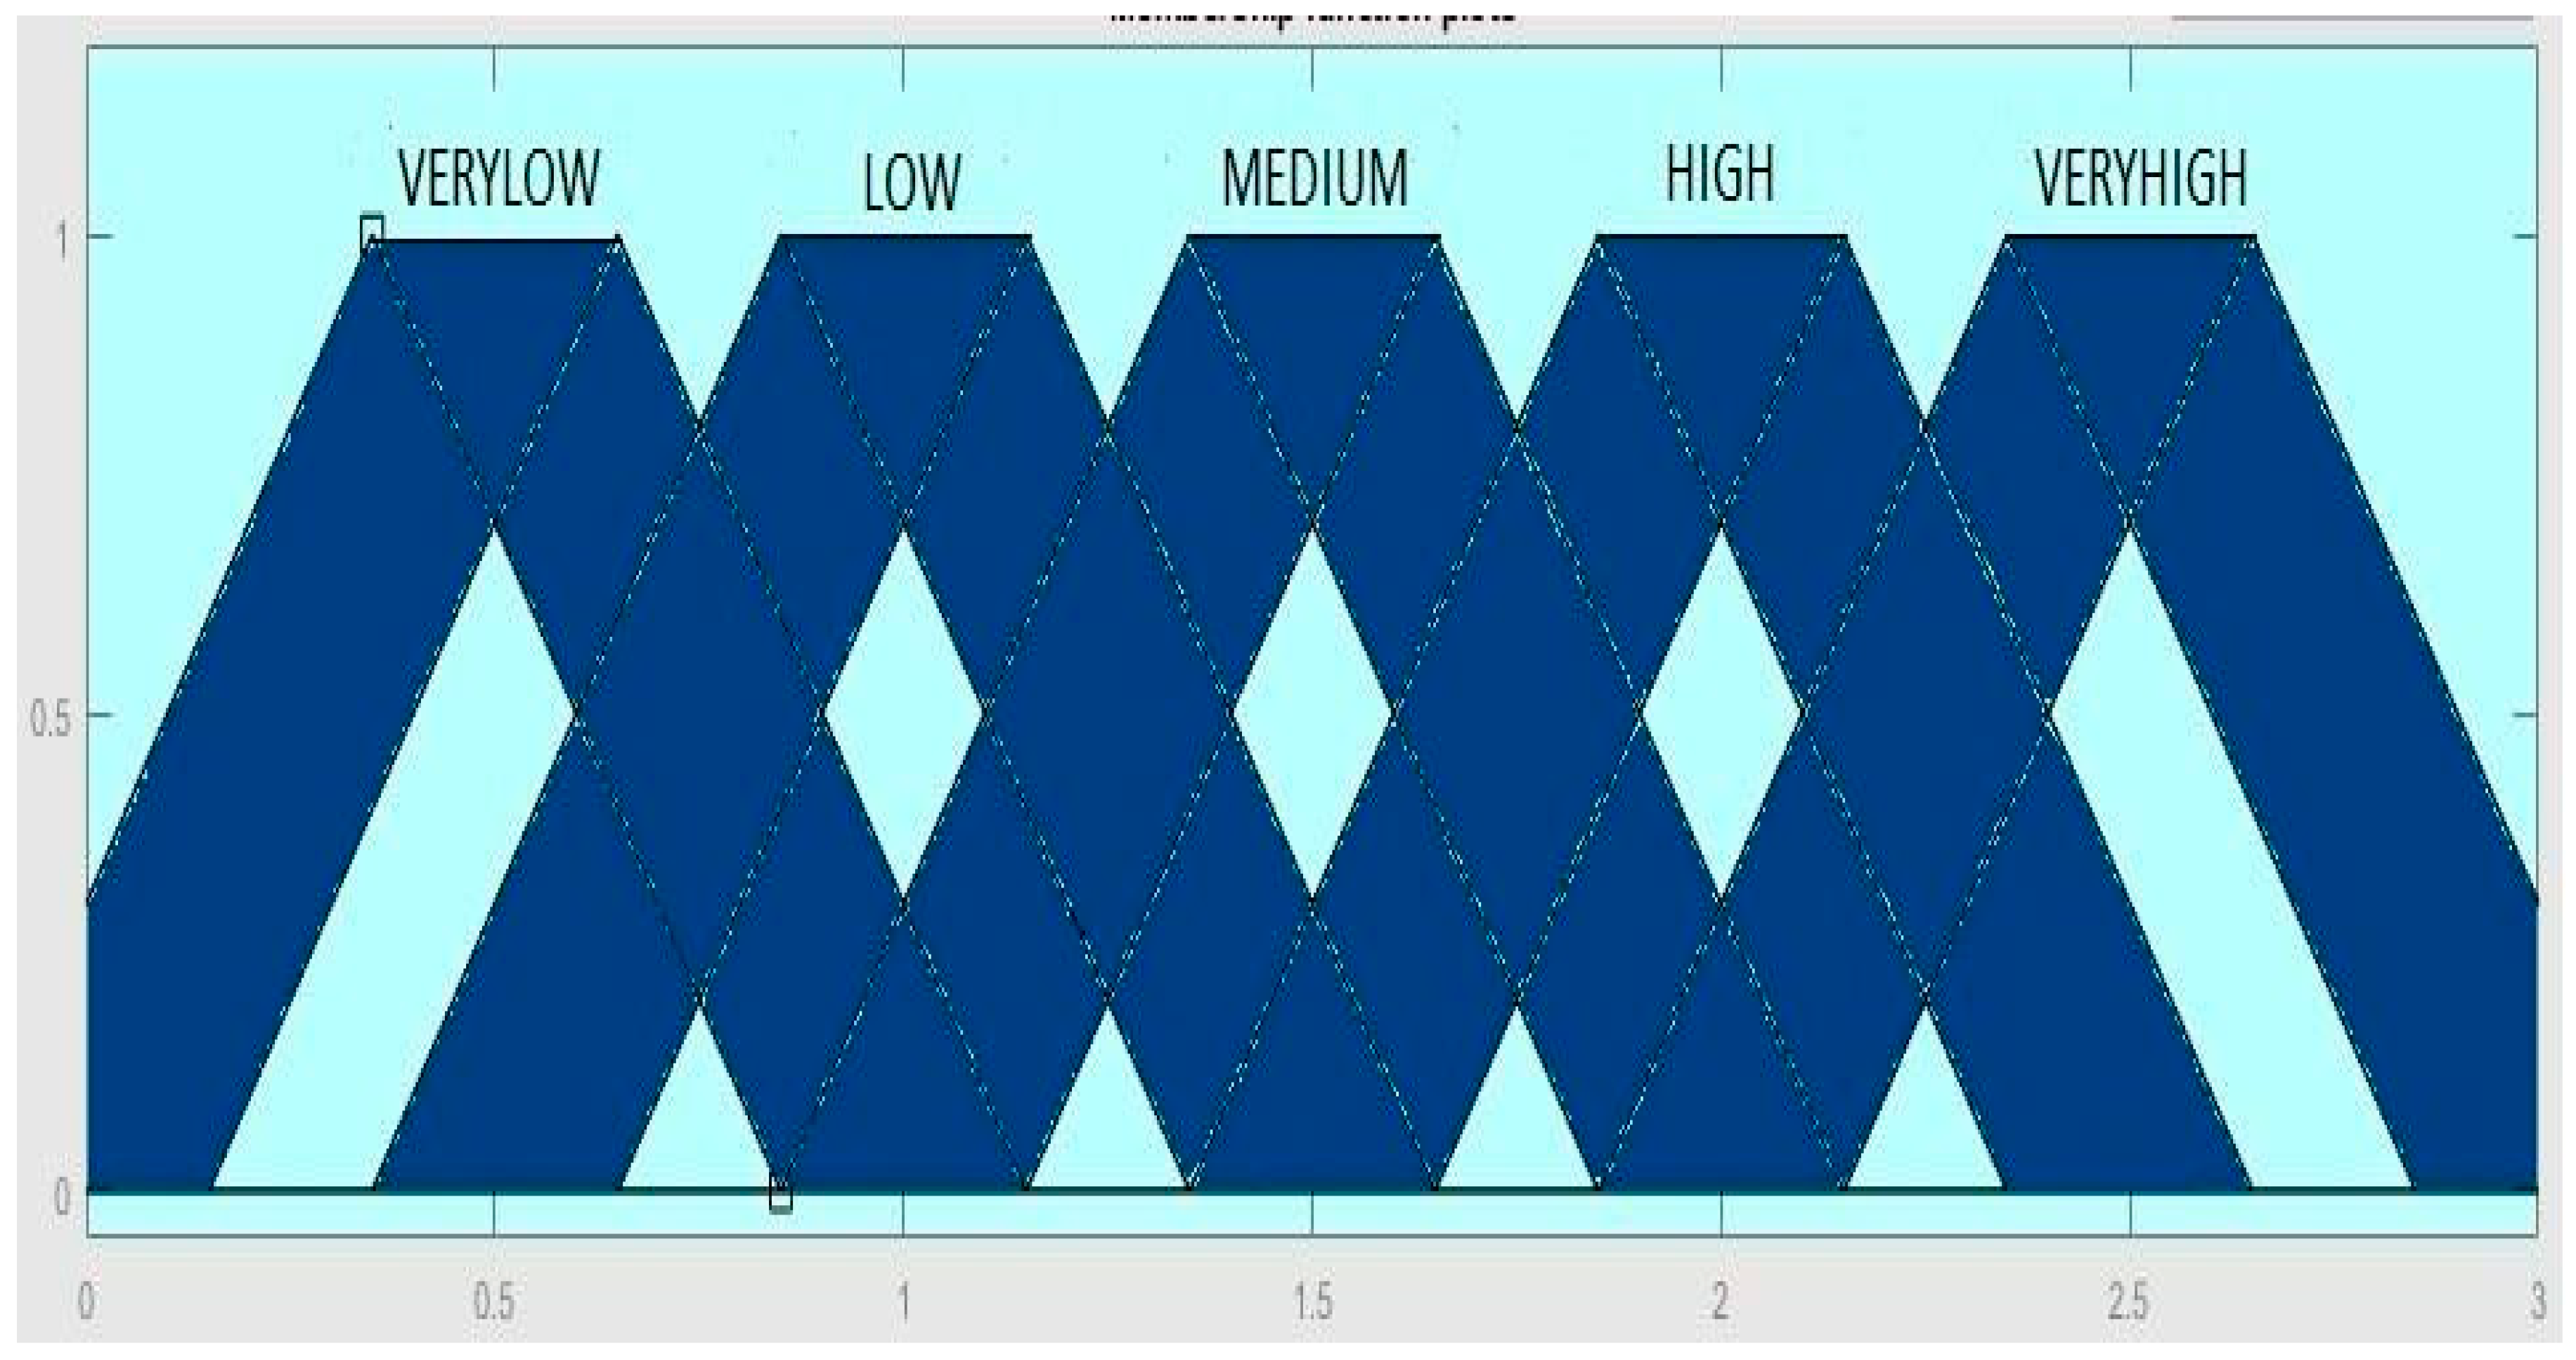
The membership functions for the outputs, c 1 and c 2 , are presented in Figure 7 and Figure 8, respectively. The values for the two outputs are in the range from 0 to 3.
Based on the literature of the behavior for the c 1 and c 2 parameters described in Section 2, for the dynamic adjustment of the c 1 and c 2 parameters in each iteration of the PSO, a fuzzy rules set with nine rules is designed as follows:
  • If (Iteration is Low) and (Diversity is Low) then ( c 1 is VeryHigh) ( c 2 is VeryLow).
  • If (Iteration is Low) and (Diversity is Medium) then ( c 1 is High) ( c 2 is Medium).
  • If (Iteration is Low) and (Diversity is High) then ( c 1 is High) ( c 2 is Low).
  • If (Iteration is Medium) and (Diversity is Low) then ( c 1 is High) ( c 2 is Low).
  • If (Iteration is Medium) and (Diversity is Medium) then ( c 1 is Medium) ( c 2 is Medium).
  • If (Iteration is Medium) and (Diversity is High) then ( c 1 is Low) ( c 2 is High).
  • If (Iteration is High) and (Diversity is Low) then ( c 1 is Medium) ( c 2 is VeryHigh).
  • If (Iteration is High) and (Diversity is Medium) then ( c 1 is Low) ( c 2 is High).
  • If (Iteration is High) and (Diversity is High) then ( c 1 is VeryLow) ( c 2 is VeryHigh).
In Figure 9, a block diagram of the procedure for the proposed approach is presented.

5. Simulation Results

We achieved the experiments for the financial time series of the stock exchange markets of Germany, Mexico, Dow-Jones, London, Nasdaq, Shanghai, and Taiwan, and for all experiments, we used 1250 data points. In this case, 750 data points are considered for the training stage and 500 data points for the testing stage.
In Table 2, the results of the experiments for the financial time series of stock exchange markets for the traditional neural network with 16 neurons in the hidden layer are presented.
The results of the experiments are obtained with the mean absolute error (MAE) and root mean standard error (RMSE). Thirty experiments with the same parameters and conditions to obtain the average error were performed, but only the best result and average of the 30 experiments are presented.
In Table 3, the results of the experiments for the financial time series of the stock exchange for the IT2FNWNN with 16 neurons in the hidden layer for the S-norm and the T-norm of the sum of the product are presented (IT2FNWNNSp).
In Table 4, the results of the experiments for the financial time series of the stock exchange markets for the IT2FNWNN with 39 neurons in the hidden layer for the S-norm and T-norm of Hamacher are presented (IT2FNWNNH). The value for the parameter, γ , in the Hamacher IT2FNWNN without optimization is 1.
In Table 5, the results of the experiments for the financial time series of the stock exchange for the IT2FNWNN with 19 neurons in the hidden layer for the S-norm and T-norm of Frank are presented (IT2FNWNNF). The value for the parameter, s , in the Frank IT2FNWNN without optimization is 2.8.
We performed the optimization of the Hamacher IT2FNWNN and Frank IT2FNWNN for the number of neurons in the hidden layer and the parameters, γ and s , respectively, with PSO using the dynamic adjustment for the c 1 and c 2 parameters of Equation (2), applying the interval type-2 fuzzy inference system of Figure 4 and the parameters of Table 1.
In Table 6, the optimization for each financial time series for the Hamacher IT2FNWNN is presented. We presented the best result of the five experiments performed.
In Table 7, the results of the experiments for the financial time series of the stock exchange for the IT2FNWNN for the Hamacher S-norm and T-norm optimized with dynamic PSO are presented (IT2FNWNNH-PSO). The value for the number of neurons in the hidden layer and the parameter, γ , in the Hamacher IT2FNWNN are taken from Table 6.
In Table 8, the optimization for each financial time series for the Frank IT2FNWNN is presented. We are only showing the best result of five performed experiments.
In Table 9, the results of the experiments for the financial time series of the stock exchange for the IT2FNWNN for Frank S-norm and T-norm optimized with dynamic PSO are presented (IT2FNWNNF-PSO). The value for the number of neurons in the hidden layer and the parameter, s , in the Frank IT2FNWNN are taken for Table 8.
In Table 10, a comparison of the best results for the prediction for all financial time series of the stock exchange markets with the traditional neural network (TNN), the interval type-2 fuzzy numbers weights neural network with the sum of the product (IT2FNWNNSp), Hamacher (IT2FNWNNH) and Frank (IT2FNWNNF) without optimization, and Hamacher (IT2FNWNNH-PSO) and Frank (IT2FNWNNF-PSO) optimized with dynamic PSO is presented.
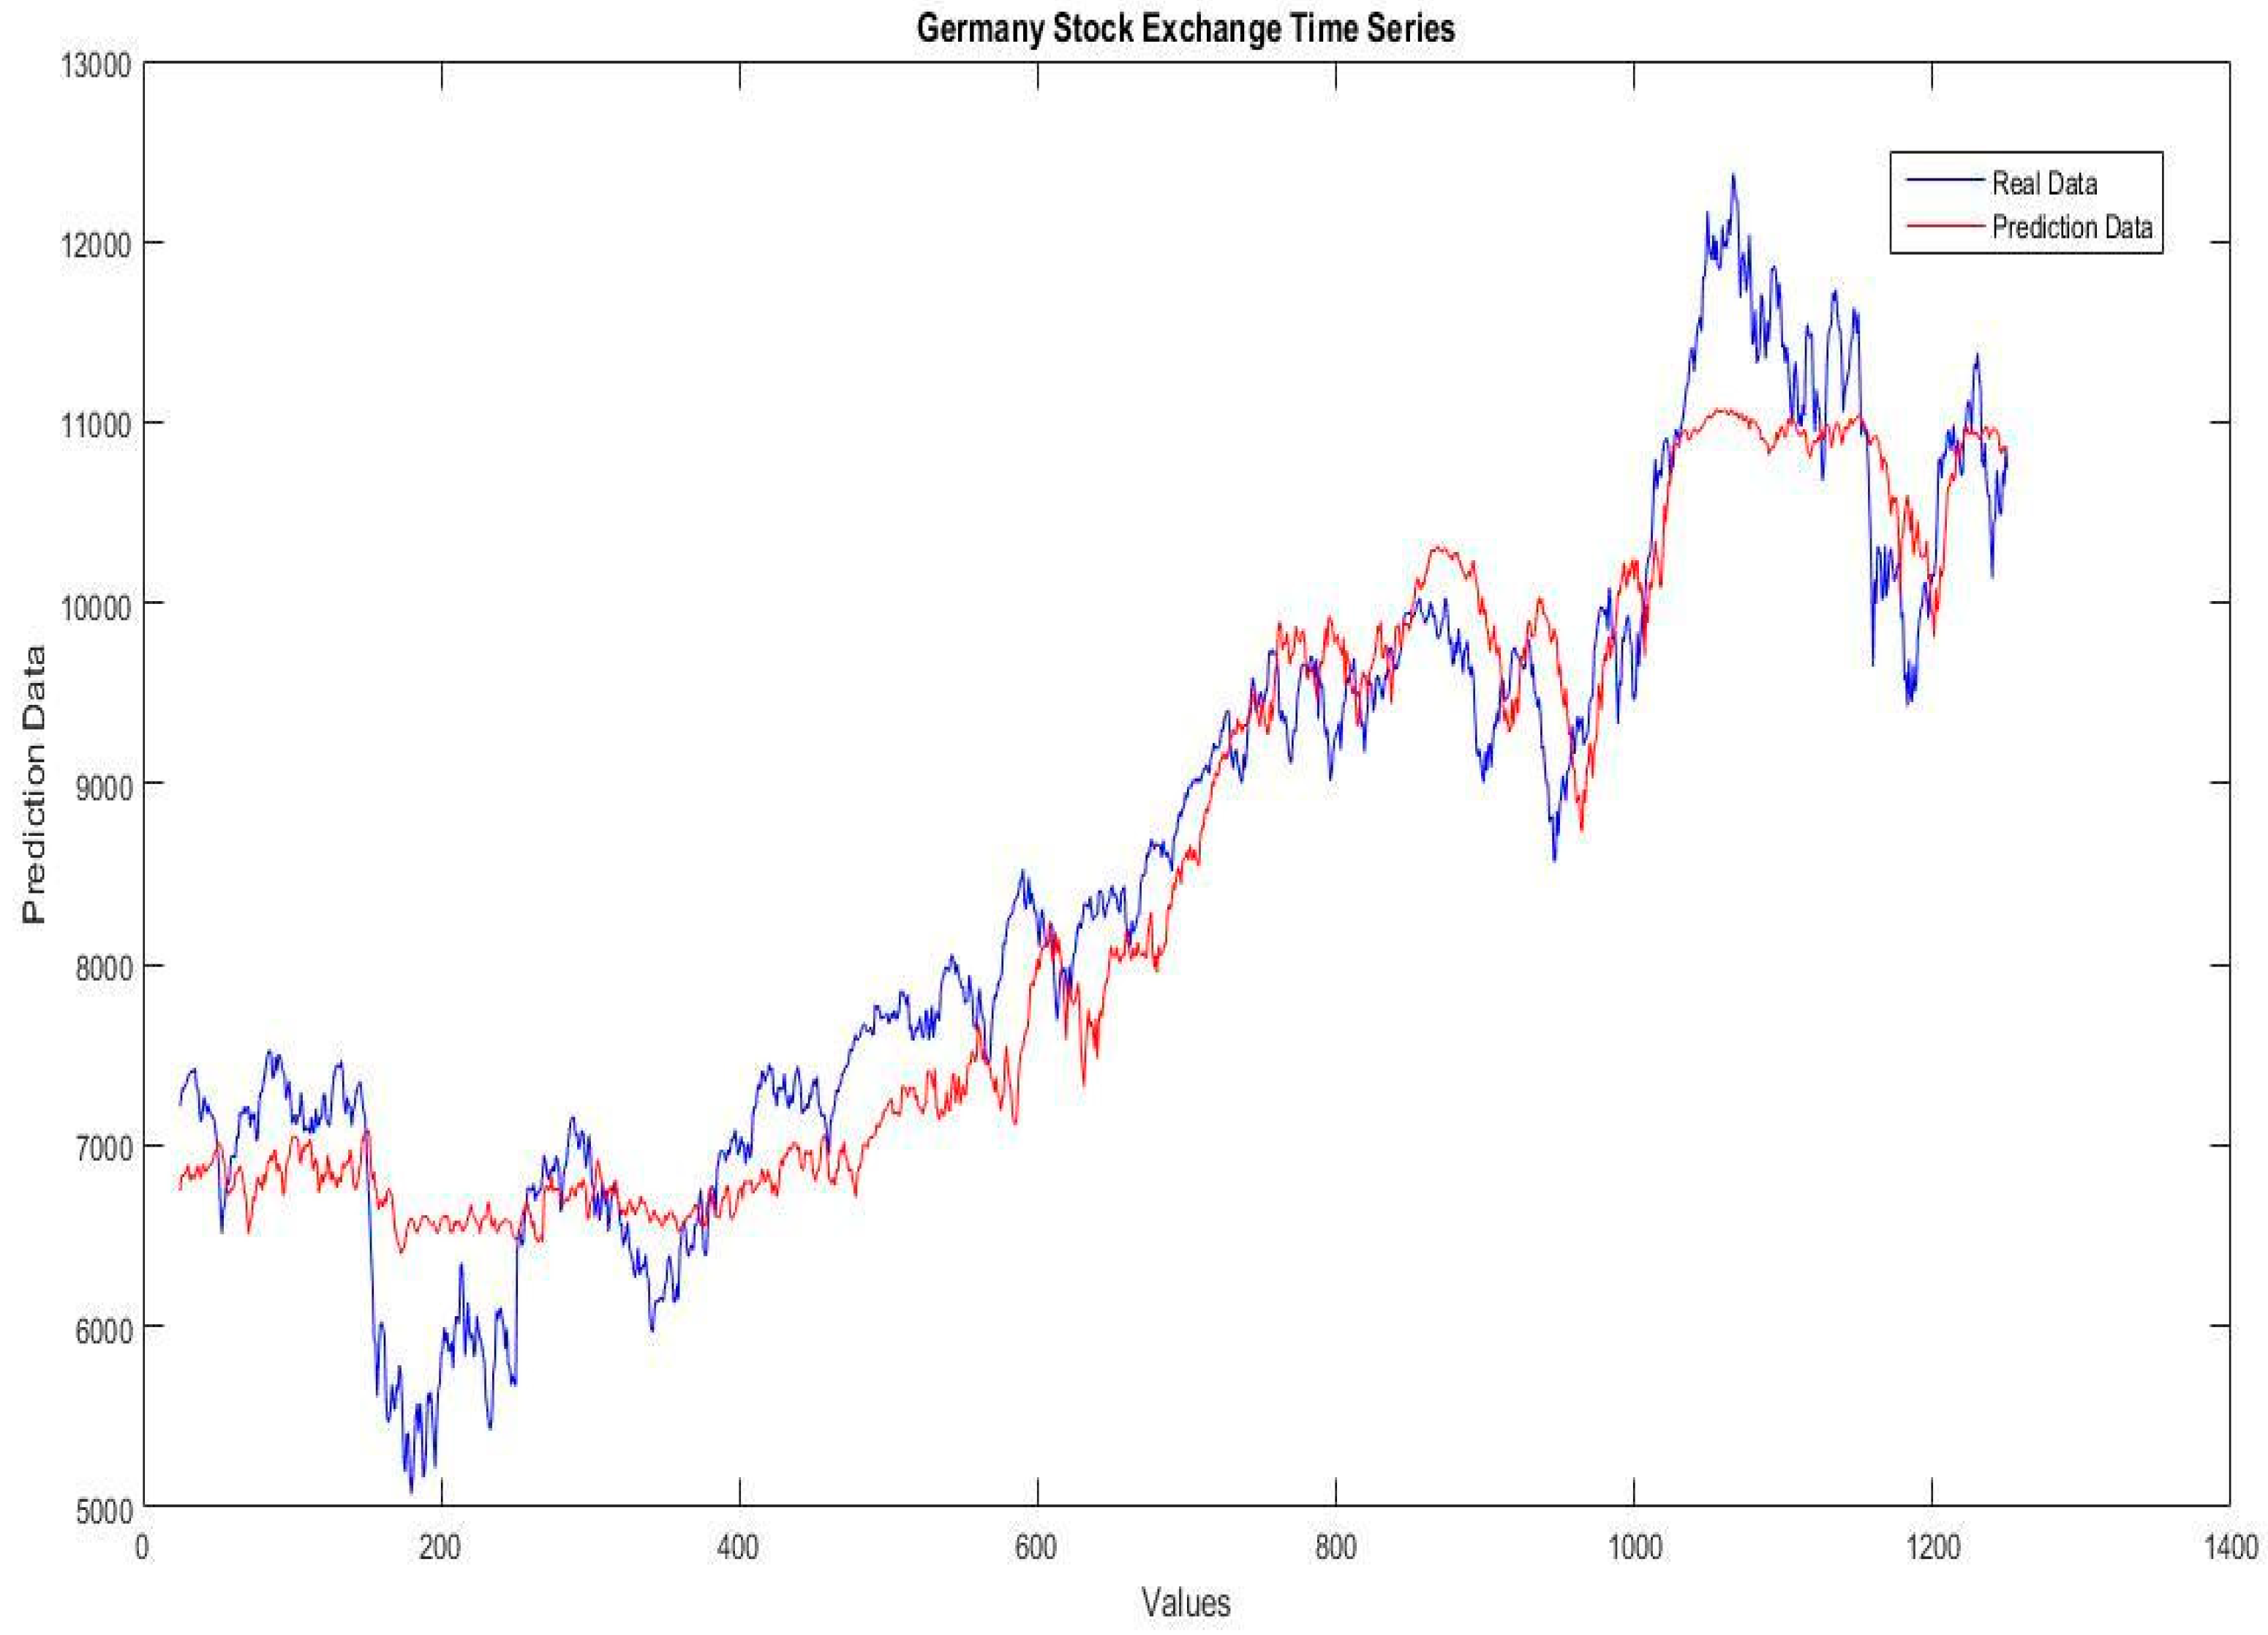
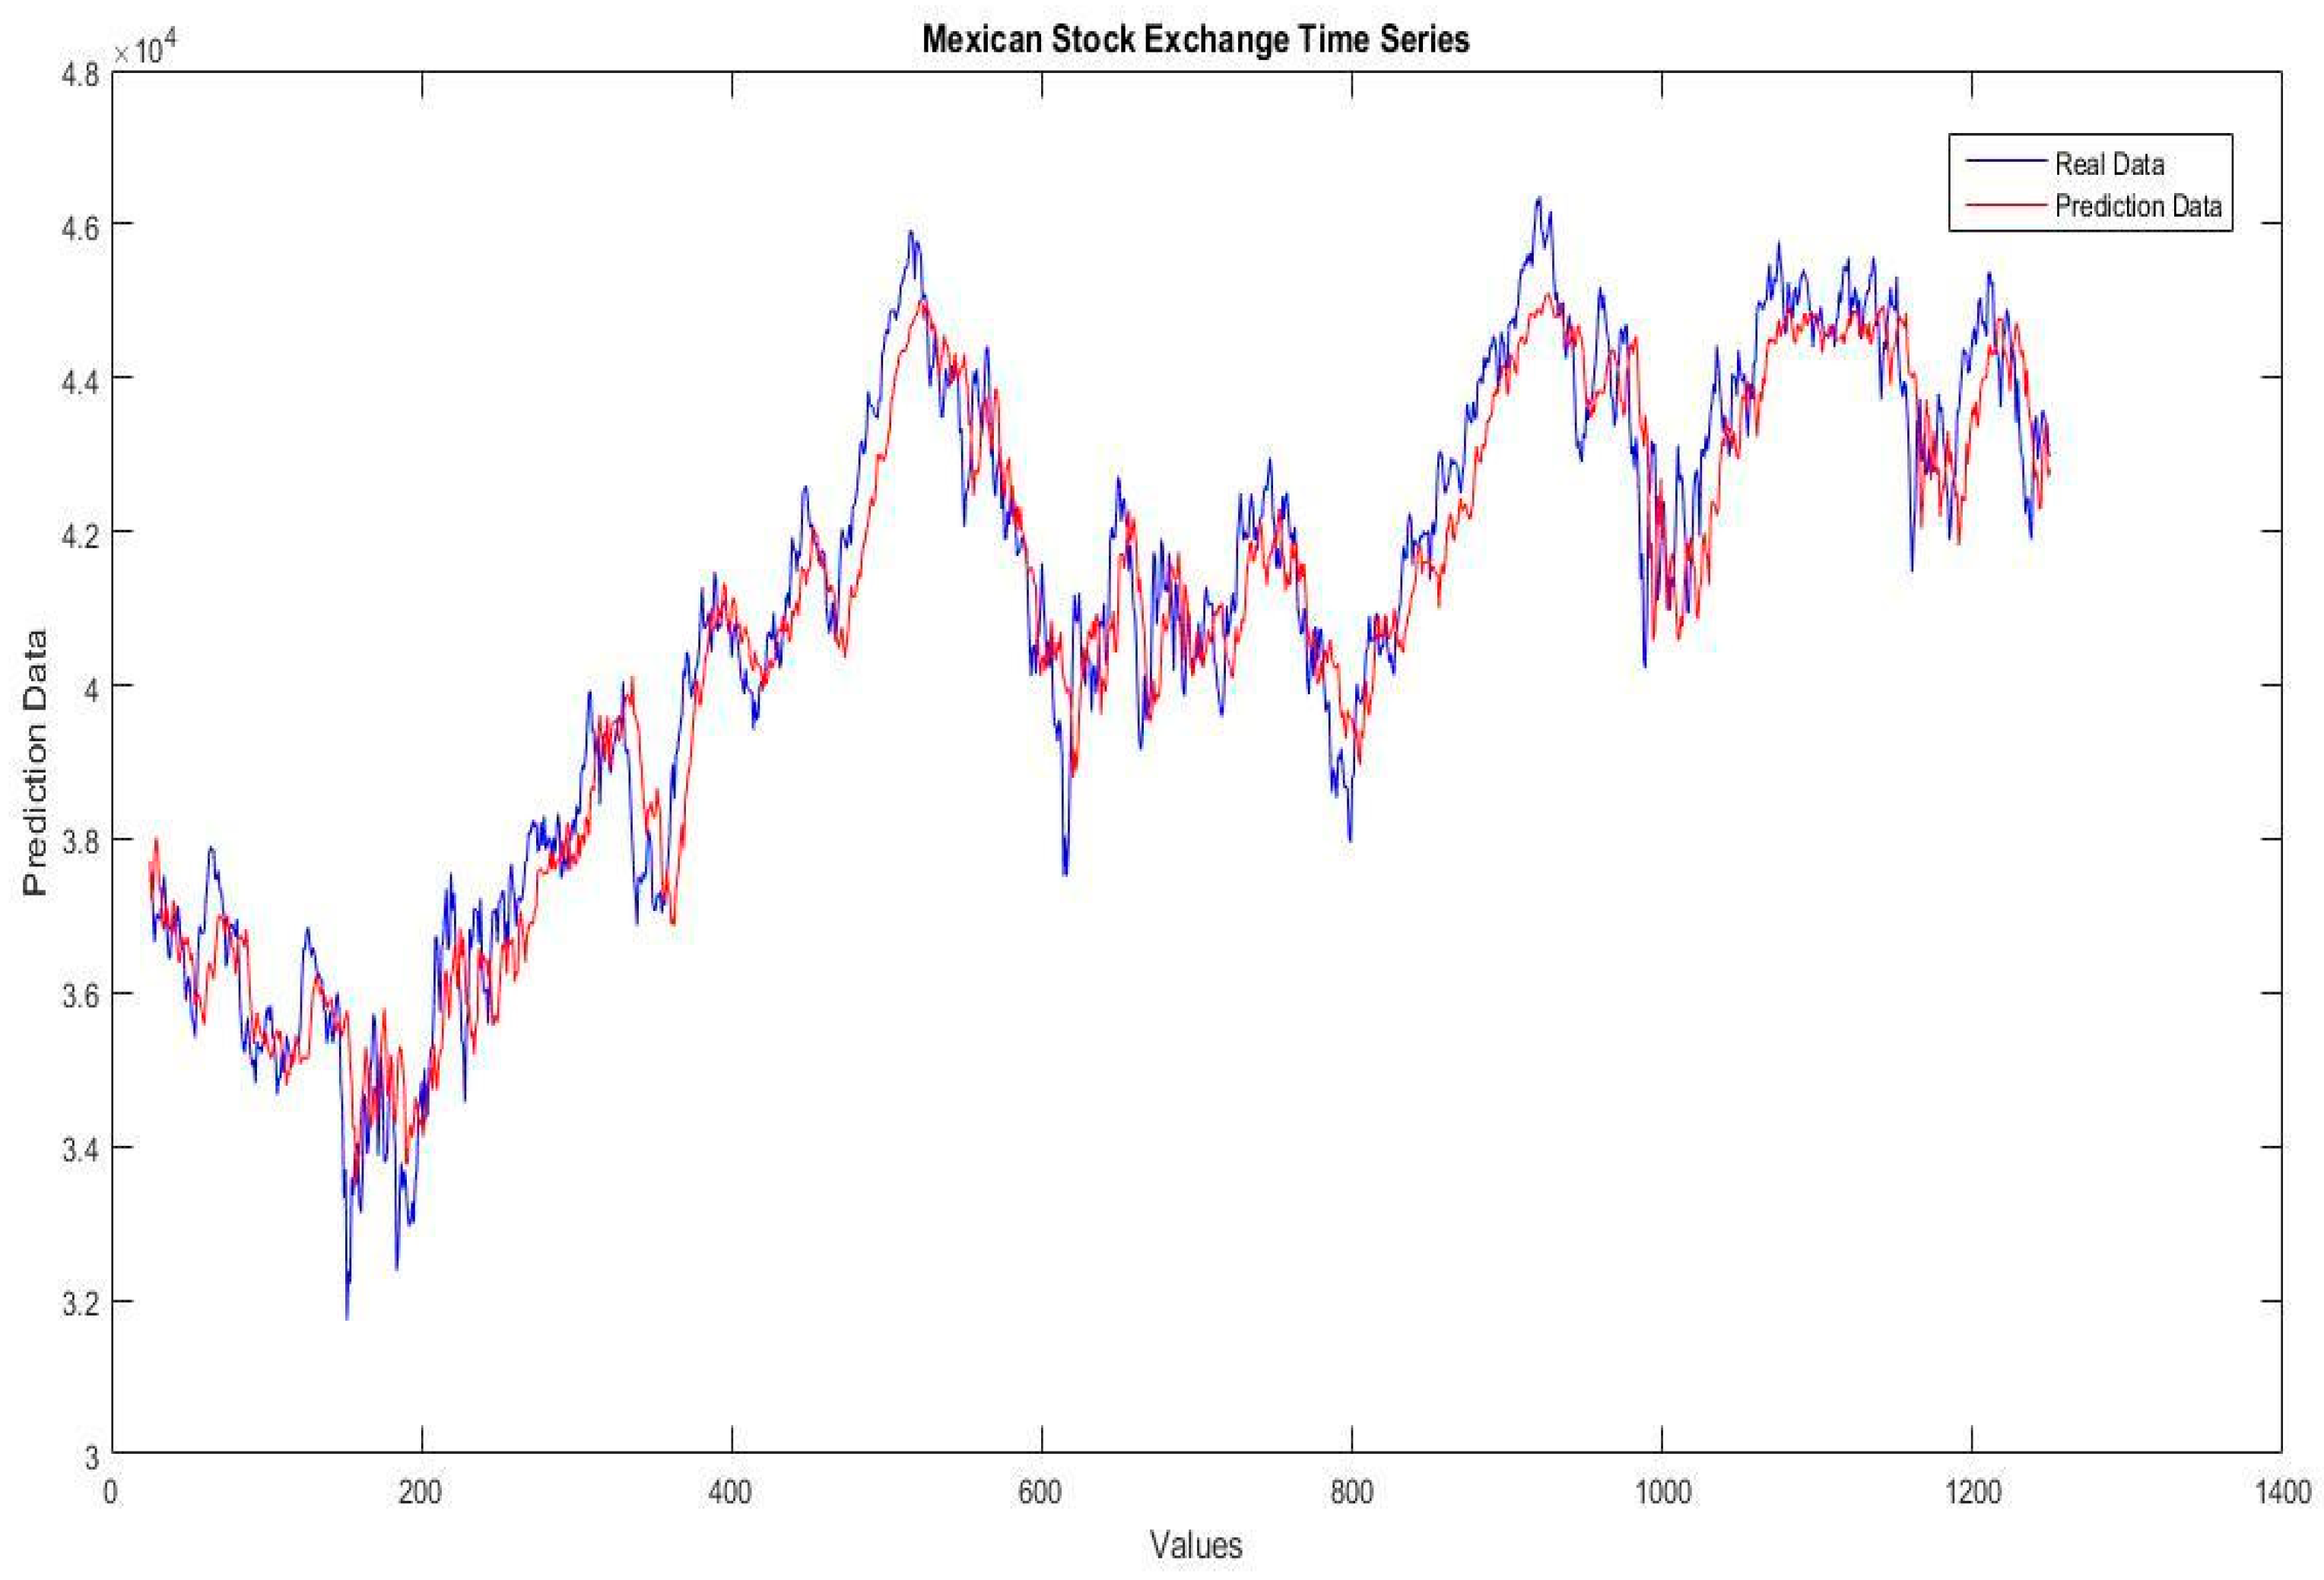
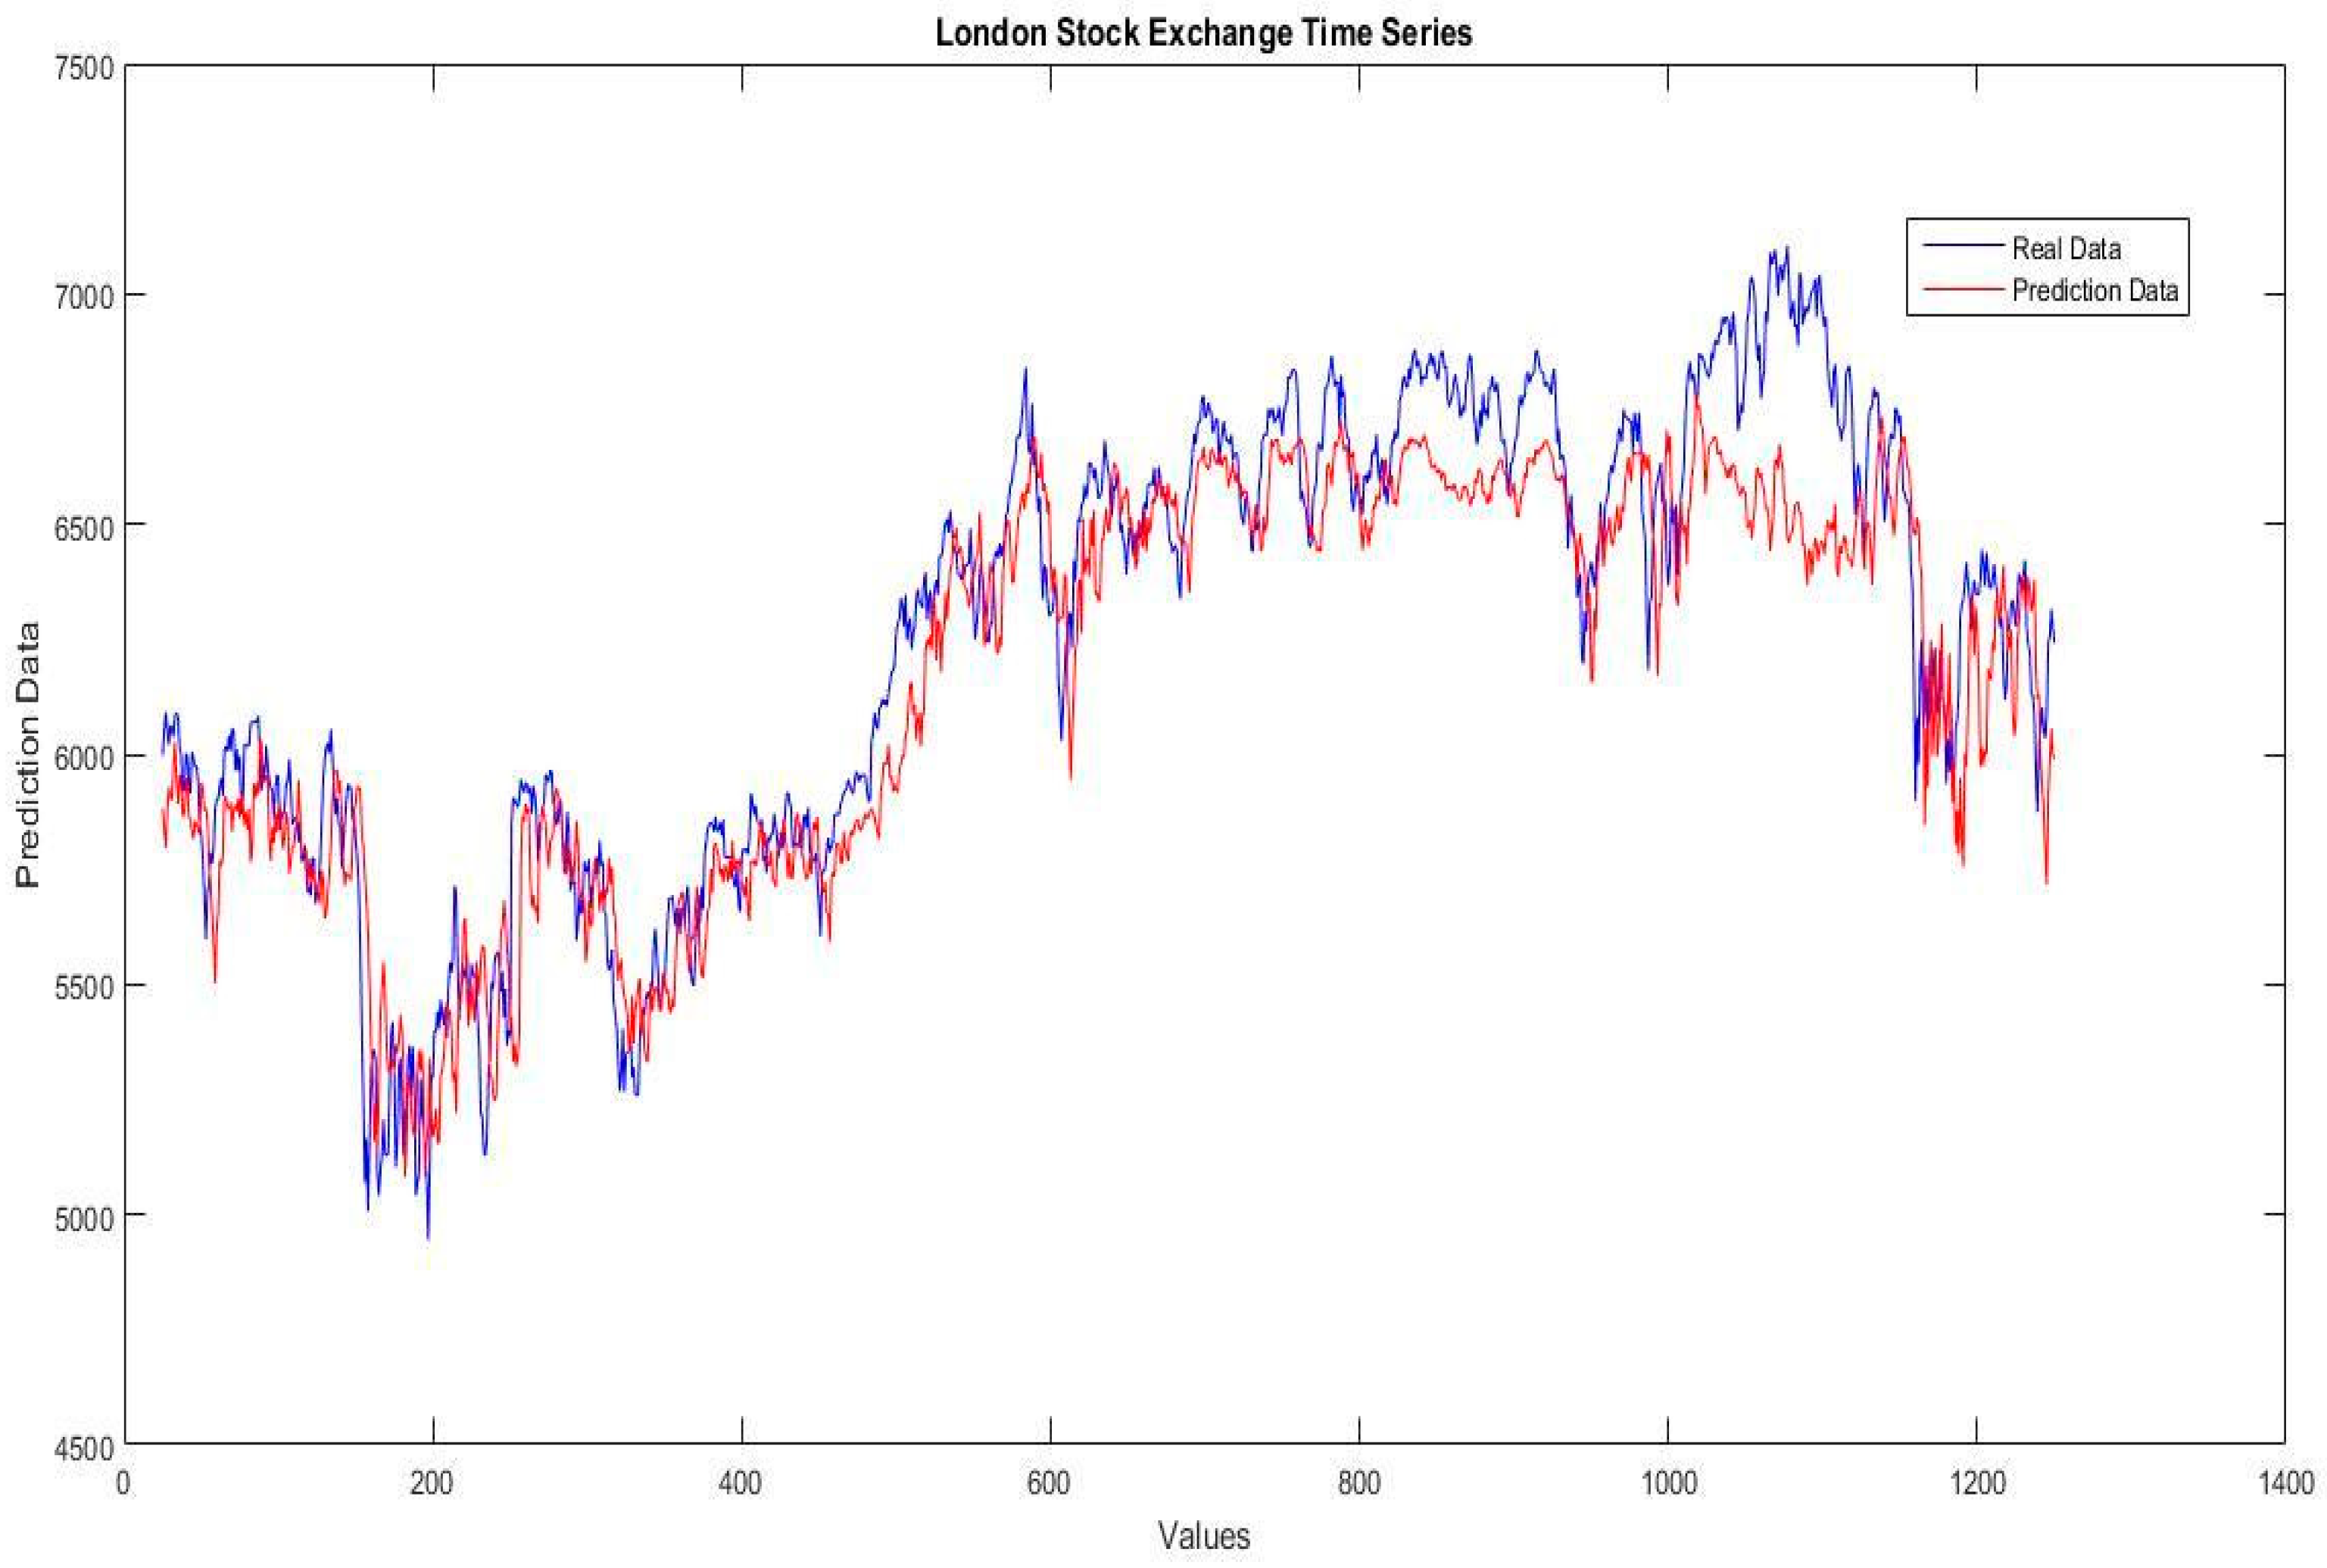
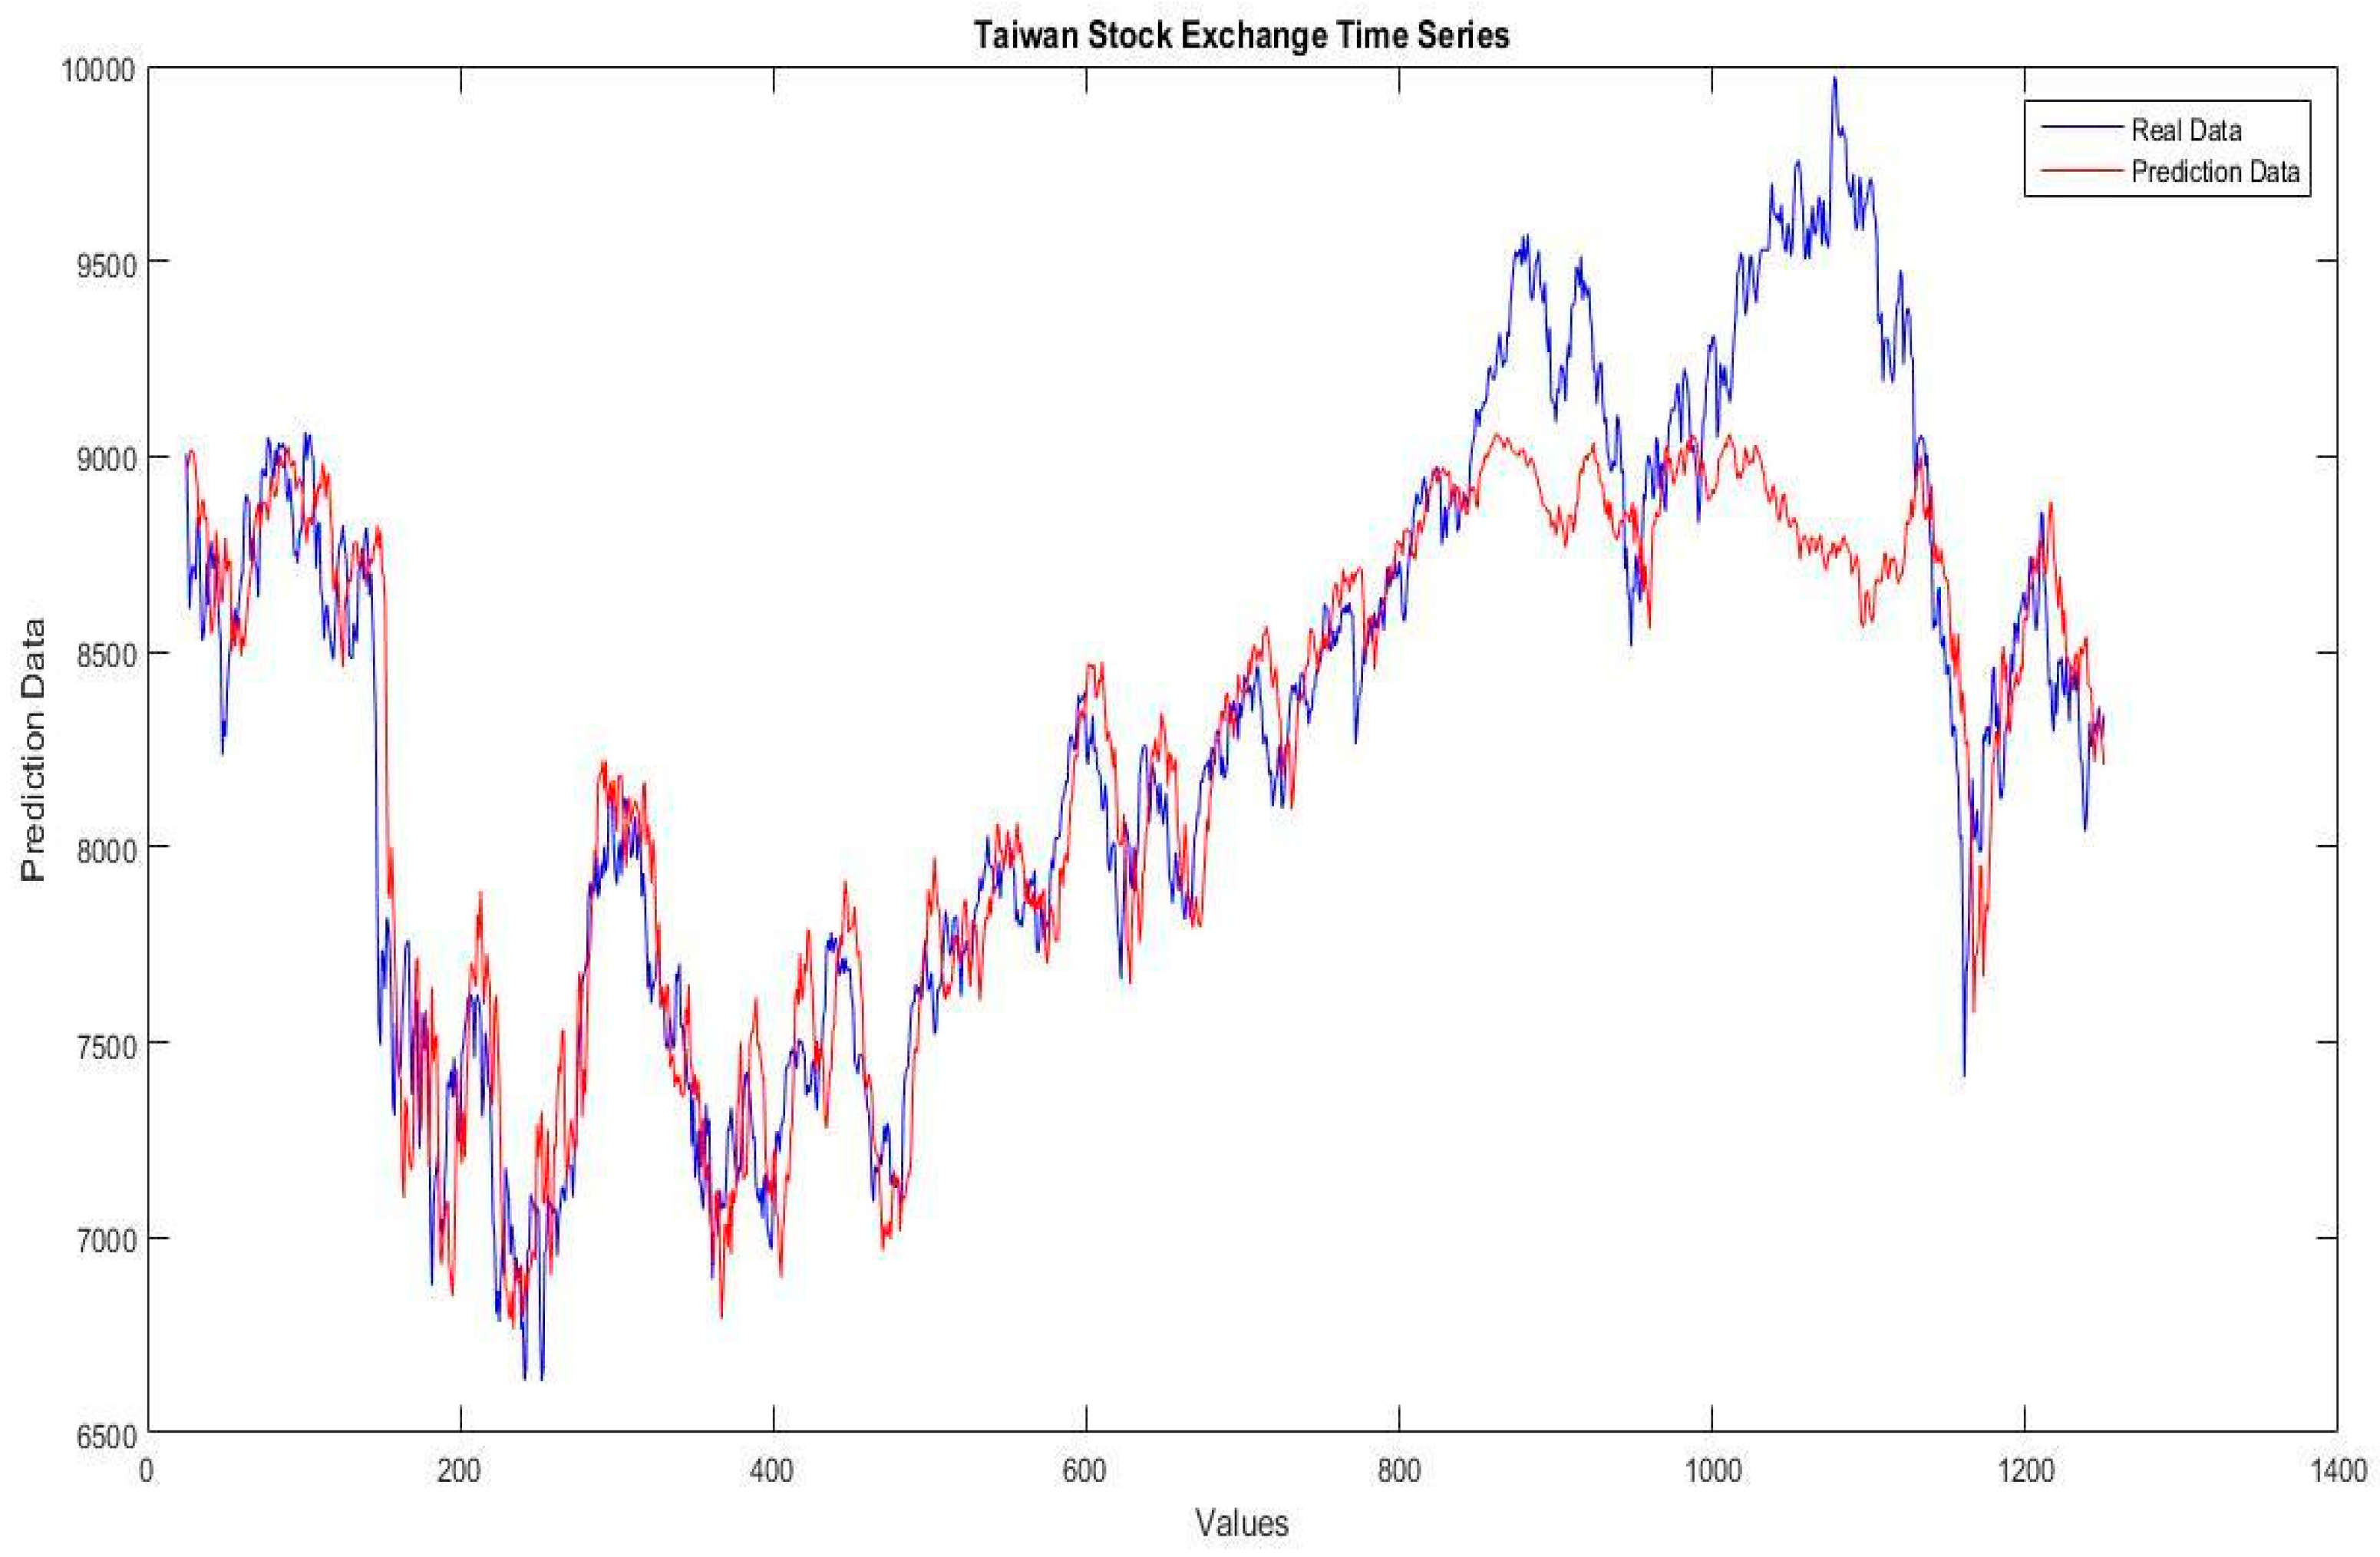
In Figure 10, Figure 11, Figure 12, Figure 13, Figure 14, Figure 15 and Figure 16, the plots of the real data of each stock exchange time series against the predicted data of the best results for the Interval type-2 fuzzy number weights neural network taken from the comparison in Table 10 are presented.
A statistical test of T-student is applied to verify the accuracy of the results. In Table 11, the best results for each financial time series is compared with the TNN. The null hypothesis is H1 = H2 and the alternative hypothesis is H1 > H2 (AVG = average, SD = standard deviation, SEM = standard error of the mean, ED = estimation of the difference, LLD 95% = lower limit 95% of the difference, GL = degrees of liberty) [69].

6. Discussion of Results

For the best results of the financial time series, the results in Table 10 show that the interval type-2 fuzzy numbers weights neural network with S-Norms and T-norms Hamacher (IT2FNWNNH-PSO) and Frank (IT2FNWNNF-PSO) optimized using particle swarm optimization (PSO) with dynamic adjustment obtains better results than the neural networks without optimization; only for the London time series is the best result the result of the interval type-2 fuzzy numbers weights neural network with Hamacher (IT2FNWNNH).
The data of the statistical test of T-student in Table 11 demonstrate that the IT2FNWNNH-PSO and IT2FNWNNF-PSO have acceptable accuracy for almost all the financial time series against the traditional neural network. Only in the Nasdaq and Shanghai time series, the T value is minimal to consider a meaningful difference

7. Conclusions

Based on the experiments, we have reached the conclusion that the interval type-2 fuzzy numbers weights neural network with S-Norms and T-norms Hamacher (IT2FNWNNH) and Frank (IT2FNWNNF) optimized using particle swarm optimization (PSO) with dynamic adjustment achieves better results than the traditional neural network and the interval type-2 fuzzy numbers weights neural network without optimization, in almost all the cases of study, for the stock exchanges time series used in this work. This assertion is based on the comparison of prediction errors for all stock exchange time series shown in Table 10 and the data of the statistical test of T-student for best results against the traditional neural network (TNN).
The proposed approach of dynamic adjustment in PSO for optimization of interval type-2 fuzzy numbers weights neural network was compared with the traditional neural network to demonstrate the effectiveness of the proposed method.
The proposed optimization applying an interval type-2 fuzzy inference system to perform dynamic adjustment of the c 1 and c 2 parameters in PSO allows the algorithm find optimal results for the testing problems. In almost all the cases of testing, the results obtained with the IT2FNWNN optimized were the better results, only in the London stock exchanges time series did the IT2FNWNNH obtained better results.
These results are good considering that the number of iterations and the number of particles for the executions of the PSO are relatively small, only 50 iterations with 50 particles. We believe that performing experiments with more iterations and particles will allow it to find better optimal results.

Author Contributions

F.G. worked on the conceptualization and proposal of the methodology, P.M. on the formal analysis, writing and review of the paper, F.V. on the investigation and validation of results, J.R.C. on the software and validation, and A.M.-M. on methodology and visualization.

Funding

This research was funded by CONACYT grant number 178539.

Acknowledgments

The authors would like to thank CONACYT and Tijuana Institute of Technology for the support during this research work.

Conflicts of Interest

The authors declare no conflict of interest.

References

  1. Wang, X.; Han, M. Online sequential extreme learning machine with kernels for nonstationary time series prediction. Neurocomputing 2014, 145, 90–97. [Google Scholar] [CrossRef]
  2. Xue, J.; Zhou, S.H.; Liu, Q.; Liu, X.; Yin, J. Financial time series prediction using ℓ2,1RF-ELM. Neurocomputing 2018, 227, 176–186. [Google Scholar] [CrossRef]
  3. Zhou, T.; Gao, S.; Wang, J.; Chu, C.; Todo, Y.; Tang, Z. Financial time series prediction using a dendritic neuron model. Knowl.-Based Syst. 2016, 105, 214–224. [Google Scholar] [CrossRef]
  4. Hrasko, R.; Pacheco, A.G.C.; Krohlinga, R.A. Time Series Prediction using Restricted Boltzmann Machines and Backpropagation. Procedia Comput. Sci. 2015, 55, 990–999. [Google Scholar] [CrossRef]
  5. Baykasoglu, A.; Özbakır, L.; Tapkan, P. Artificial bee colony algorithm and its application to generalized assignment problem. In Swarm Intelligence: Focus on Ant and Particle Swarm Optimization; Felix, T.S.C., Manoj, K.T., Eds.; Itech Education and Publishing: Vienna, Austria, 2007; pp. 113–143. [Google Scholar]
  6. Qin, A.K.; Huang, V.L.; Suganthan, P.N. Differential evolution algorithm with strategy adaptation for global numerical optimization. IEEE Trans. Evol. Comput. 2009, 13, 398–417. [Google Scholar] [CrossRef]
  7. Vesterstrom, J.; Thomsen, R. A comparative study of differential evolution, particle swarm optimization, and evolutionary algorithms on numerical benchmark problems. In Proceedings of the CEC2004 IEEE Congress on Evolutionary Computation 2004, Portland, OR, USA, 19–23 June 2004; Volume 2, pp. 1980–1987. [Google Scholar]
  8. Gaxiola, F.; Melin, P.; Valdez, F.; Castillo, O.; Castro, J.R. Comparison of T-Norms and S-Norms for Interval Type-2 Fuzzy Numbers in Weight Adjustment for Neural Networks. Information 2017, 8, 114. [Google Scholar] [CrossRef]
  9. Kim, K.; Han, I. Genetic algorithms approach to feature discretization in artificial neural networks for the prediction of stock price index. Expert Syst. Appl. 2000, 19, 125–132. [Google Scholar] [CrossRef]
  10. Dash, R.; Dash, P.K. Prediction of Financial Time Series Data using Hybrid Evolutionary Legendre Neural Network: Evolutionary LENN. Int. J. Appl. Evol. Comput. 2016, 7, 16–32. [Google Scholar] [CrossRef]
  11. Kim, K. Financial time series forecasting using support vector machines. Neurocomputing 2003, 55, 307–319. [Google Scholar] [CrossRef]
  12. Olivas, F.; Valdez, F.; Castillo, O.; Melin, P. Dynamic parameter adaptation in particle swarm optimization using interval type-2 fuzzy logic. Soft Comput. 2014, 20, 1057–1070. [Google Scholar] [CrossRef]
  13. Abdelbar, A.; Abdelshahid, S.; Wunsch, D. Fuzzy PSO: A generalization of particle swarm optimization. In Proceedings of the 2005 IEEE International Joint Conference on Neural Networks, Montreal, QC, Canada, 31 July–4 August 2005; Volume 2, pp. 1086–1091. [Google Scholar]
  14. Valdez, F.; Melin, P.; Castillo, O. An improved evolutionary method with fuzzy logic for combining particle swarm optimization and genetic algorithms. Appl. Soft Comput. 2011, 11, 2625–2632. [Google Scholar] [CrossRef]
  15. Wu, D.; Tan, W.W. Interval type-2 fuzzy PI controllers why they are more robust. In Proceedings of the 2010 IEEE International Conference on Granular Computing, San Jose, CA, USA, 14–16 August 2010; pp. 802–807. [Google Scholar]
  16. Sepulveda, R.; Castillo, O.; Melin, P.; Rodriguez-Diaz, A.; Montiel, O. Experimental study of intelligent controllers under uncertainty using type-1 and type-2 fuzzy logic. Inf. Sci. 2007, 177, 2023–2048. [Google Scholar] [CrossRef]
  17. Gaxiola, F.; Melin, P.; Valdez, F.; Castillo, O. Interval Type-2 Fuzzy Weight Adjustment for Backpropagation Neural Networks with Application in Time Series Prediction. Inf. Sci. 2014, 260, 1–14. [Google Scholar] [CrossRef]
  18. Gaxiola, F.; Melin, P.; Valdez, F.; Castillo, O. Generalized Type-2 Fuzzy Weight Adjustment for Backpropagation Neural Networks in Time Series Prediction. Inf. Sci. 2015, 325, 159–174. [Google Scholar] [CrossRef]
  19. Dunyak, J.P.; Wunsch, D. Fuzzy regression by fuzzy number neural networks. Fuzzy Sets Syst. 2000, 112, 371–380. [Google Scholar] [CrossRef]
  20. Ding, S.; Li, H.; Su, C.; Yu, J.; Jin, F. Evolutionary Artificial Neural Networks: A Review. Artif. Intell. Rev. 2013, 39, 251–260. [Google Scholar] [CrossRef]
  21. Weber, S. A general concept of fuzzy connectives, negations and implications based on t-norms and t-conorms. Fuzzy Sets Syst. 1983, 11, 115–134. [Google Scholar] [CrossRef]
  22. Hamacher, H. Überlogischeverknupfungenunscharferaussagen und derenzugehorigebewertungsfunktionen. In Progress in Cybernetics and Systems Research, III.; Trappl, R., Klir, G.J., Ricciardi, L., Eds.; Hemisphere: New York, NY, USA, 1975; pp. 276–288. [Google Scholar]
  23. Melin, P.; Olivas, F.; Castillo, O.; Valdez, F.; Soria, J.; Valdez, M. Optimal design of fuzzy classification systems using PSO with dynamic parameter adaptation through fuzzy logic. Expert Syst. Appl. 2013, 40, 3196–3206. [Google Scholar] [CrossRef]
  24. Olivas, F.; Valdez, F.; Melin, P.; Sombra, A.; Castillo, O. Interval type-2 fuzzy logic for dynamic parameter adaptation in a modified gravitational search algorithm. Inf. Sci. 2019, 476, 159–175. [Google Scholar] [CrossRef]
  25. Kennedy, J.; Eberhart, R. Swarm Intelligence; Morgan Kaufmann: San Francisco, CA, USA, 2001. [Google Scholar]
  26. Jang, J.; Sun, C.; Mizutani, E. Neuro-Fuzzy and Soft Computing: A Computational Approach to Learning and Machine Intelligence; Prentice-Hall: Upper Saddle River, NJ, USA, 1997. [Google Scholar]
  27. Engelbrecht, A. Fundamentals of Computational Swarm Intelligence; University of Pretoria: Pretoria, South Africa, 2005. [Google Scholar]
  28. Bingül, Z.; Karahan, O. A fuzzy logic controller tuned with PSO for 2 DOF robot trajectory control. Expert Syst. Appl. 2001, 38, 1017–1031. [Google Scholar] [CrossRef]
  29. Zadeh, L. The concept of a linguistic variable and its application to approximate reasoning. Inf. Sci. 1975, 8, 199–249. [Google Scholar] [CrossRef]
  30. Mendel, J.; John, R. Type-2 fuzzy sets made simple. IEEE Trans. Fuzzy Syst. 2002, 10, 117–127. [Google Scholar] [CrossRef] [Green Version]
  31. Liang, Q.; Mendel, J. Interval type-2 fuzzy logic systems: Theoryand design. IEEE Trans. Fuzzy Syst. 2000, 8, 535–550. [Google Scholar] [CrossRef]
  32. Chandra Shill, P.; Faijul Amin, M.; Akhand, M.A.H.; Murase, K. Optimization of interval type-2 fuzzy logic controller using quantum genetic algorithms. In Proceedings of the IEEE World Congress Computational Intelligence, Brisbane, Australia, 10–15 June 2012; pp. 1027–1034. [Google Scholar]
  33. Karnik, N.N.; Mendel, J.M. Centroid of a type-2 fuzzy set. Inf. Sci. 2001, 132, 195–220. [Google Scholar] [CrossRef]
  34. Biglarbegian, M.; Melek, W.W.; Mendel, J.M. On the robustness of Type-1 and Interval Type-2 fuzzy logic systems in modeling. Inf. Sci. 2011, 181, 1325–1347. [Google Scholar] [CrossRef]
  35. Mendel, J.M. Uncertain Rule-Based Fuzzy Logic Systems: Introduction and New Directions; Prentice Hall PTR: Upper Saddle River, NJ, USA, 2001. [Google Scholar]
  36. Wu, D.; Mendel, J.M. On the continuity of type-1 and interval type-2 fuzzy logic systems. IEEE Trans. Fuzzy Syst. 2011, 19, 179–192. [Google Scholar]
  37. Ishibuchi, H.; Nii, M. Numerical Analysis of the Learning of Fuzzified Neural Networks from Fuzzy If–Then Rules. Fuzzy Sets Syst. 1998, 120, 281–307. [Google Scholar] [CrossRef]
  38. Feuring, T. Learning in Fuzzy Neural Networks. In Proceedings of the IEEE International Conference on Neural Networks, Washington, DC, USA, 3–6 June 1996; Volume 2, pp. 1061–1066. [Google Scholar]
  39. Valdez, F.; Melin, P.; Castillo, O. A survey on nature-inspired optimization algorithms with fuzzy logic for dynamic parameter adaptation. Expert Syst. Appl. 2014, 41, 6459–6466. [Google Scholar] [CrossRef]
  40. Li, C.; Wu, T. Adaptive fuzzy approach to function approximation with PSO and RLSE. Expert Syst. Appl. 2011, 38, 13266–13273. [Google Scholar] [CrossRef]
  41. Muthukaruppan, S.; Er, M.J. A hybrid particle swarm optimization based fuzzy expert system for the diagnosis of coronary artery disease. Expert Syst. Appl. 2012, 39, 11657–11665. [Google Scholar] [CrossRef]
  42. Taher, N.; Ehsan, A.; Masoud, J. A new hybrid evolutionary algorithm based on new fuzzy adaptive PSO and NM algorithms for distribution feeder reconfiguration. Energy Convers. Manag. 2012, 54, 7–16. [Google Scholar]
  43. Wang, B.; Liang, G.; Wang, C.; Dong, Y. A new kind of fuzzy particle swarm optimization fuzzy PSO algorithm. In Proceedings of the 1st International Symposium on Systems and Control in Aerospace and Astronautics, ISSCAA, Harbin, China, 19–21 January 2006; pp. 309–311. [Google Scholar]
  44. Hongbo, L.; Abraham, M. Fuzzy Adaptive Turbulent Particle Swarm Optimization. In Proceedings of the IEEE Fifth International Conference on Hybrid Intelligent Systems (HIS’05), Rio de Janeiro, Brazil, 6–9 November 2005; pp. 445–450. [Google Scholar]
  45. Shi, Y.; Eberhart, R. Fuzzy Adaptive Particle Swarm Optimization. In Proceedings of the IEEE International Conference on Evolutionary Computation, Seoul, Korea, 27–30 May 2001; IEEE Service Center: Piscataway, NJ, USA, 2001; pp. 101–106. [Google Scholar]
  46. Yang, D.; Li, Z.; Liu, Y.; Zhang, H.; Wu, W. A Modified Learning Algorithm for Interval Perceptrons with Interval Weights. Neural Process Lett. 2015, 42, 381–396. [Google Scholar] [CrossRef]
  47. Kuo, R.J.; Chen, J.A. A Decision Support System for Order Selection in Electronic Commerce based on Fuzzy Neural Network Supported by Real-Coded Genetic Algorithm. Experts Syst. Appl. 2004, 26, 141–154. [Google Scholar] [CrossRef]
  48. Karnik, N.N.; Mendel, J. Operations on type-2 fuzzy sets. Fuzzy Sets Syst. 2001, 122, 327–348. [Google Scholar] [CrossRef]
  49. Chai, Y.; Xhang, D. A Representation of Fuzzy Numbers. Fuzzy Sets Syst. 2016, 295, 1–18. [Google Scholar] [CrossRef]
  50. Chu, T.C.; Tsao, T.C. Ranking Fuzzy Numbers with an Area between the Centroid Point and Original Point. Comput. Math. Appl. 2002, 43, 111–117. [Google Scholar] [CrossRef]
  51. Dunyak, J.; Wunsch, D. Fuzzy Number Neural Networks. Fuzzy Sets Syst. 1999, 108, 49–58. [Google Scholar] [CrossRef]
  52. Coroianu, L.; Stefanini, L. General Approximation of Fuzzy Numbers by F-Transform. Fuzzy Sets Syst. 2016, 288, 46–74. [Google Scholar] [CrossRef]
  53. Li, Z.; Kecman, V.; Ichikawa, A. Fuzzified Neural Network based on fuzzy number operations. Fuzzy Sets Syst. 2002, 130, 291–304. [Google Scholar] [CrossRef]
  54. Fard, S.; Zainuddin, Z. Interval Type-2 Fuzzy Neural Networks Version of the Stone–Weierstrass Theorem. Neurocomputing 2011, 74, 2336–2343. [Google Scholar] [CrossRef]
  55. Molinari, F. A New Criterion of Choice between Generalized Triangular Fuzzy Numbers. Fuzzy Sets Syst. 2016, 296, 51–69. [Google Scholar] [CrossRef]
  56. Asady, B. Trapezoidal Approximation of a Fuzzy Number Preserving the Expected Interval and Including the Core. Am. J. Oper. Res. 2013, 3, 299–306. [Google Scholar] [CrossRef]
  57. Figueroa-García, J.C.; Chalco-Cano, Y.; Roman-Flores, H. Distance Measures for Interval Type-2 Fuzzy Numbers. Discret. Appl. Math. 2015, 197, 93–102. [Google Scholar] [CrossRef]
  58. Requena, I.; Blanco, A.; Delgado, M.; Verdegay, J. A Decision Personal Index of Fuzzy Numbers based on Neural Networks. Fuzzy Sets Syst. 1995, 73, 185–199. [Google Scholar] [CrossRef]
  59. Valdez, F.; Vazquez, J.C.; Gaxiola, F. Fuzzy Dynamic Parameter Adaptation in ACO and PSO for Designing Fuzzy Controllers: The Cases of Water Level and Temperature Control. Adv. Fuzzy Syst. 2018, 2018, 1274969. [Google Scholar] [CrossRef]
  60. Fan, G.F.; Peng, L.L.; Hong, W.C. Short term load forecasting based on phase space reconstruction algorithm and bi-square kernel regression model. Appl. Energy 2018, 224, 13–33. [Google Scholar] [CrossRef]
  61. Dong, Y.; Zhang, Z.; Hong, W.-C. A hybrid seasonal mechanism with a chaotic cuckoo search algorithm with a support vector regression model for electric load forecasting. Energies 2018, 11, 1009. [Google Scholar] [CrossRef]
  62. Tung, S.W.; Quek, C.; Guan, C. eT2FIS: An Evolving Type-2 Neural Fuzzy Inference System. Inf. Sci. 2013, 220, 124–148. [Google Scholar] [CrossRef]
  63. Castillo, O.; Melin, P. A review on the design and optimization of interval type-2 fuzzy controllers. Appl. Soft Comput. 2012, 12, 1267–1278. [Google Scholar] [CrossRef]
  64. Zarandi, M.H.F.; Torshizi, A.D.; Turksen, I.B.; Rezaee, B. A new indirect approach to the type-2 fuzzy systems modeling and design. Inf. Sci. 2013, 232, 346–365. [Google Scholar] [CrossRef]
  65. Nguyen, D.; Widrow, B. Improving the Learning Speed of 2-Layer Neural Networks by choosing Initial Values of the Adaptive Weights. In Proceedings of the International Joint Conference on Neural Networks, San Diego, CA, USA, 17–21 June 1990; Volume 3, pp. 21–26. [Google Scholar]
  66. Caraveo, C.; Valdez, F.; Castillo, O. Optimization of fuzzy controller design using a new bee colony algorithm with fuzzy dynamic parameter adaptation. Appl. Soft Comput. 2016, 43, 131–142. [Google Scholar] [CrossRef]
  67. Castillo, O.; Neyoy, H.; Soria, J.; Melin, P.; Valdez, F. A new approach for dynamic fuzzy logic parameter tuning in Ant Colony Optimization and its application in fuzzy control of a mobile robot. Appl. Soft Comput. 2015, 28, 150–159. [Google Scholar] [CrossRef]
  68. Alexandridis, A.; Sarimveis, H.; Bafas, G. A new algorithm for online structure and parameter adaptation of RBF networks. Neural Netw. 2003, 16, 1003–1017. [Google Scholar] [CrossRef]
  69. Derrac, J.; García, S.; Molina, D.; Herrera, F. A practical tutorial on the use of nonparametric statistical tests as a methodology for comparing evolutionary and swarm intelligence algorithms. Swarm Evol. Comput. 2011, 1, 3–18. [Google Scholar] [CrossRef]
Figure 1. Movement of the particle in the search space.
Axioms 08 00014 g001
Figure 2. Scheme of the architecture of the traditional neural network.
Axioms 08 00014 g002
Figure 3. Scheme of the architecture of the interval type-2 fuzzy number weight neural network.
Axioms 08 00014 g003
Figure 4. Structure of type-2 fuzzy inference system for the PSO.
Axioms 08 00014 g004
Figure 5. Membership function for the input diversity.
Axioms 08 00014 g005
Figure 6. Membership function for the input iteration.
Axioms 08 00014 g006
Figure 7. Membership function for the output, c 1 .
Axioms 08 00014 g007
Figure 8. Membership function for the output, c2.
Axioms 08 00014 g008
Figure 9. Block diagram of the proposed approach.
Axioms 08 00014 g009
Figure 10. Illustration of the real data against the prediction data of the Germany stock exchange time series for the fuzzy neural network using Hamacher optimized with dynamic PSO.
Axioms 08 00014 g010
Figure 11. Illustration of the real data against the prediction data of the Mexican stock exchange time series for the fuzzy neural network using Frank optimized with dynamic PSO.
Axioms 08 00014 g011
Figure 12. Illustration of the real data against the prediction data of the Dow-Jones stock exchange time series for the fuzzy neural network using Hamacher optimized with dynamic PSO.
Axioms 08 00014 g012
Figure 13. Illustration of the real data against the prediction data of the London stock exchange time series for the fuzzy neural network using Hamacher without optimization.
Axioms 08 00014 g013
Figure 14. Illustration of the real data against the prediction data of theNasdaq stock exchange time series for the fuzzy neural network using Hamacher optimized with dynamic PSO.
Axioms 08 00014 g014
Figure 15. Illustration of the real data against the prediction data of the Shanghai stock exchange time series for the fuzzy neural network using Hamacher and optimized with the dynamic PSO.
Axioms 08 00014 g015
Figure 16. Illustration of the real data against the prediction data of Taiwan stock exchange time series for the fuzzy neural network using Hamacher optimized with dynamic PSO.
Axioms 08 00014 g016
Table 1. Parameters of PSO to optimize IT2FNWNN.
ParametersValues
Particles50
Dimensions2
Iterations50
Inertia Weight0.1
Constriction Coefficient (C)1
R1, R2Random in [0, 1]
c 1 , c 2 Dynamic adjust IT2FIS
Table 2. Results of the traditional neural network for the financial series.
ErrorResultsGermanyMexicanDow-JonesLondonNasdaqShanghaiTaiwan
MAEBest1089.19733.50920.89167.05468.81361.95383.00
Average1138.48755.34956.03168.76470.43367.90412.52
RMSEBest1264.68917.931075.70200.13550.95561.29458.28
Average1332.28935.581109.73203.29558.95580.00480.11
Table 3. Results of the IT2FNWNN with the S-norm and T-norm of the sum of the product for the financial time series.
ErrorResultsGermanyMexicanDow-JonesLondonNasdaqShanghaiTaiwan
MAEBest1038.84739.26736.26155.51585.70391.21321.86
Average1148.27760.49937.09159.20725.07403.97339.18
RMSEBest1338.21915.45840.21192.14786.84458.75499.62
Average1414.93939.701098.61196.65884.07474.99615.84
Table 4. Results of the IT2FNWNN with the S-norm and T-norm of Hamacher for the financial time series.
ErrorResultsGermanyMexicanDow-JonesLondonNasdaqShanghaiTaiwan
MAEBest1055.06730.13686.05151.76463.77314.71349.78
Average1093.54756.95787.61158.96711.63334.81392.70
RMSEBest1216.24912.65800.68188.46570.36569.32449.41
Average1334.42945.19925.43198.98854.65626.49472.24
Table 5. Results of the IT2FNWNN with the S-norm and T-norm of Frank for the financial time series.
ErrorResultsGermanyMexicanDow-JonesLondonNasdaqShanghaiTaiwan
MAEBest1058.87730.96853.69153.35663.02354.07362.56
Average4439.15756.19944.12159.58741.04336.64399.85
RMSEBest1256.37915.84972.34186.68730.97607.68448.20
Average1402.82936.951101.39197.71902.34640.26470.09
Table 6. Results of the optimization with Dynamic PSO for Hamacher IT2FNWNN for the financial time series.
Financial Time SeriesPrediction ErrorNo. NeuronsParameter γ
Germany417.33391.6471
Mexican744.34210.9997
Dow-Jones517.58151.9270
London155.72221.0016
Nasdaq227.53560.6822
Shanghai211.40991.7397
Taiwan236.15281.1997
Table 7. Results of the IT2FNWNN with the S-norm and T-norm of Hamacher optimized with dynamic PSO for the financial time series.
ErrorResultsGermanyMexicanDow-JonesLondonNasdaqShanghaiTaiwan
MAEBest417.33728.61517.58154.87227.53211.40236.15
Average813.21751.48881.97160.47342.14313.86401.49
RMSEBest507.43909.39769.15192.81283.92443.85331.32
Average1172.56930.471290.34197.99530.34543.39472.44
Table 8. Results of the optimization with dynamic PSO for Frank IT2FNWNN for the financial time series.
Financial Time SeriesPrediction ErrorNo. NeuronsParameter γ
Germany935.77891.7796
Mexican726.84221.4607
Dow-Jones768.811193.1526
London153.60321.2669
Nasdaq302.19731.2910
Shanghai277.72791.9962
Taiwan359.211241.6347
Table 9. Results of the IT2FNWNN with the S-norm and T-norm of Frank optimized with dynamic PSO for the financial time series.
ErrorResultsGermanyMexicanDow-JonesLondonNasdaqShanghaiTaiwan
MAEBest935.77726.84768.81153.60288.70277.72359.21
Average1050.87773.60863.79163.12391.39373.38399.28
RMSEBest1226.07911.63979.26188.63349.02491.98439.93
Average1302.99963.741082.81201.38469.52597.62481.62
Table 10. Comparison of the best results of financial time series prediction with all neural networks.
Financial Time SeriesErrorTNNIT2FNWNNSpIT2FNWNNHIT2FNWNNFIT2FNWNNH-PSOIT2FNWNNF-PSO
GermanyMAE1089.191038.841055.061058.87417.33935.77
RMSE1264.681338.211216.241256.37507.431226.07
MexicanMAE733.50739.26730.13730.96728.61726.84
RMSE917.93915.45912.65915.84909.39911.63
Dow-JonesMAE920.89736.26686.05853.69517.58768.81
RMSE1075.70840.21800.68972.34769.15979.26
LondonMAE167.05155.51151.76153.35154.87153.60
RMSE200.13192.14188.46186.68192.81188.63
NasdaqMAE468.81585.70463.77663.02227.53288.70
RMSE550.95786.84570.36730.97283.92349.02
ShanghaiMAE361.95391.21314.71354.07211.40277.72
RMSE561.29458.75569.32607.68443.85491.98
TaiwanMAE383.00321.86349.78362.56236.15359.21
RMSE458.28499.62449.41448.20331.32439.93
Table 11. Comparison of the best results of financial time series prediction with all neural networks.
Financial Time SeriesComparison ResultsNAVGSDSEMEDLLD 95%T ValueP ValueGL
GermanyH1:TNN301332.322.84.2159.7662.90.00429
H2: IT2FNWNNH-PSO30117330155
MexicanH1:TNN30935.612.52.3−28.15−35.27−5.83144
H2: IT2FNWNNF-PSO30963723.34.3
Dow-JonesH1:TNN301082.847.18.6−208−491−1.240.88829
H2: IT2FNWNNH-PSO301290912167
LondonH1:TNN30203.292.480.454.3042.9275.240.000450
H2: IT2FNWNNH30198.983.760.69
NasdaqH1:TNN30558.954.190.7728.6−260.890.19029
H2: IT2FNWNNH-PSO3053017632
ShanghaiH1:TNN305807.481.436.6122.934.540.000430
H2: IT2FNWNNH-PSO30543.443.57.9
TaiwanH1:TNN30480.117.311.3−1.51−5.88−0.580.71747
H2: IT2FNWNNH-PSO30481.612.22.2