Neutrosophic Hough Transform


Abstract
:1. Introduction
2. Previous Works
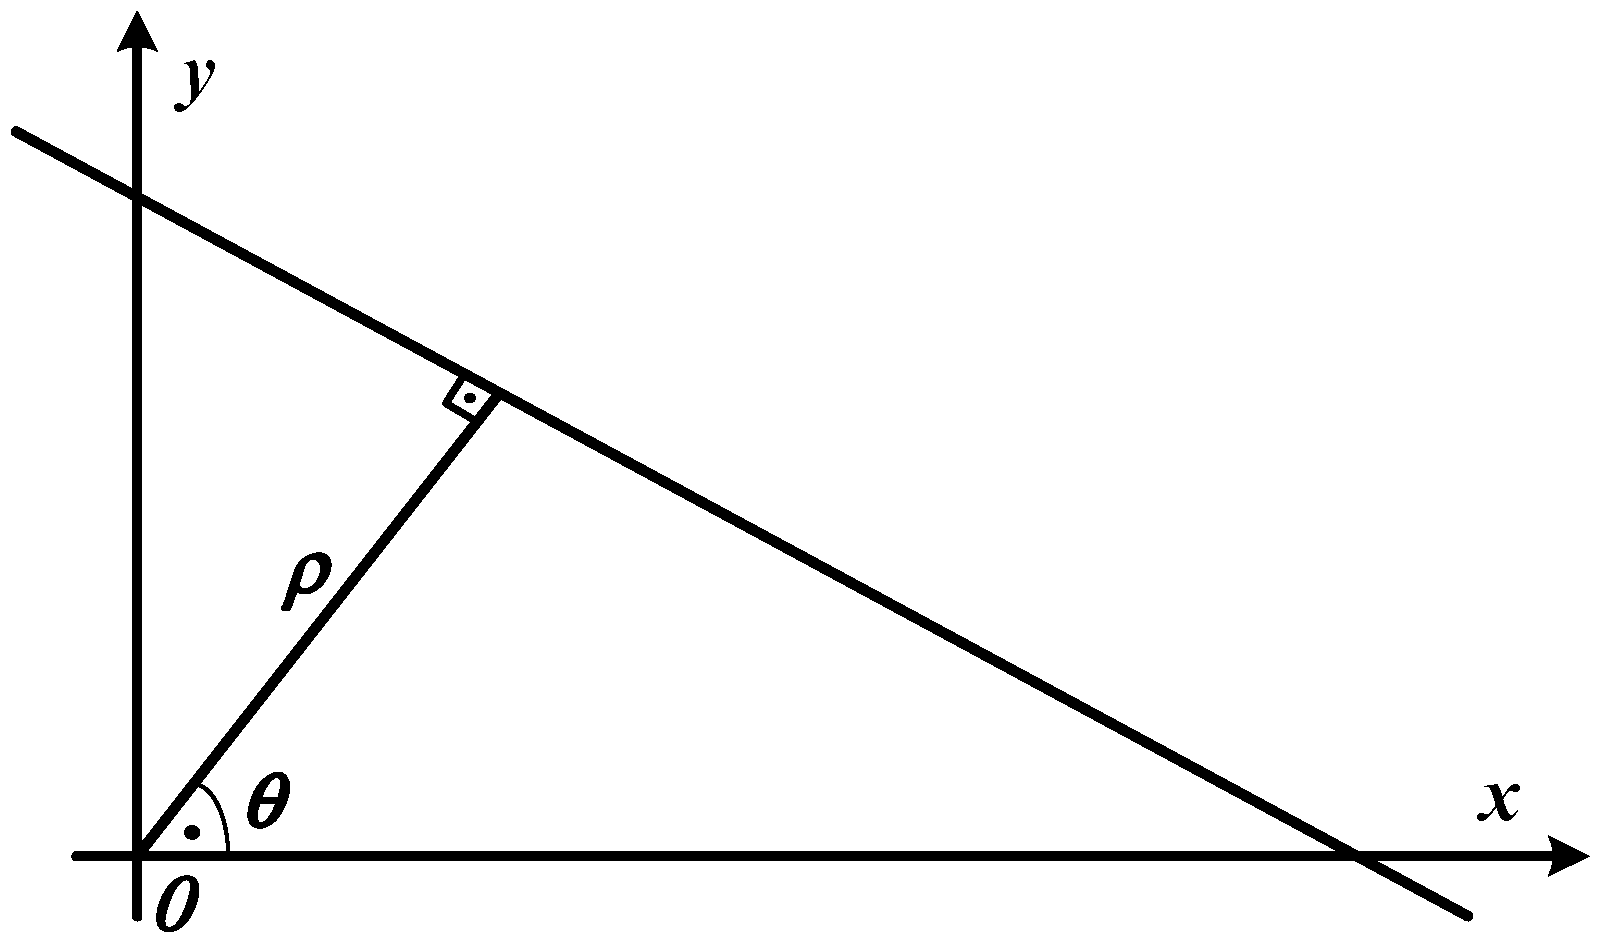
2.1. Hough Transform
2.2. Fuzzy Hough Transform
3. Proposed Method
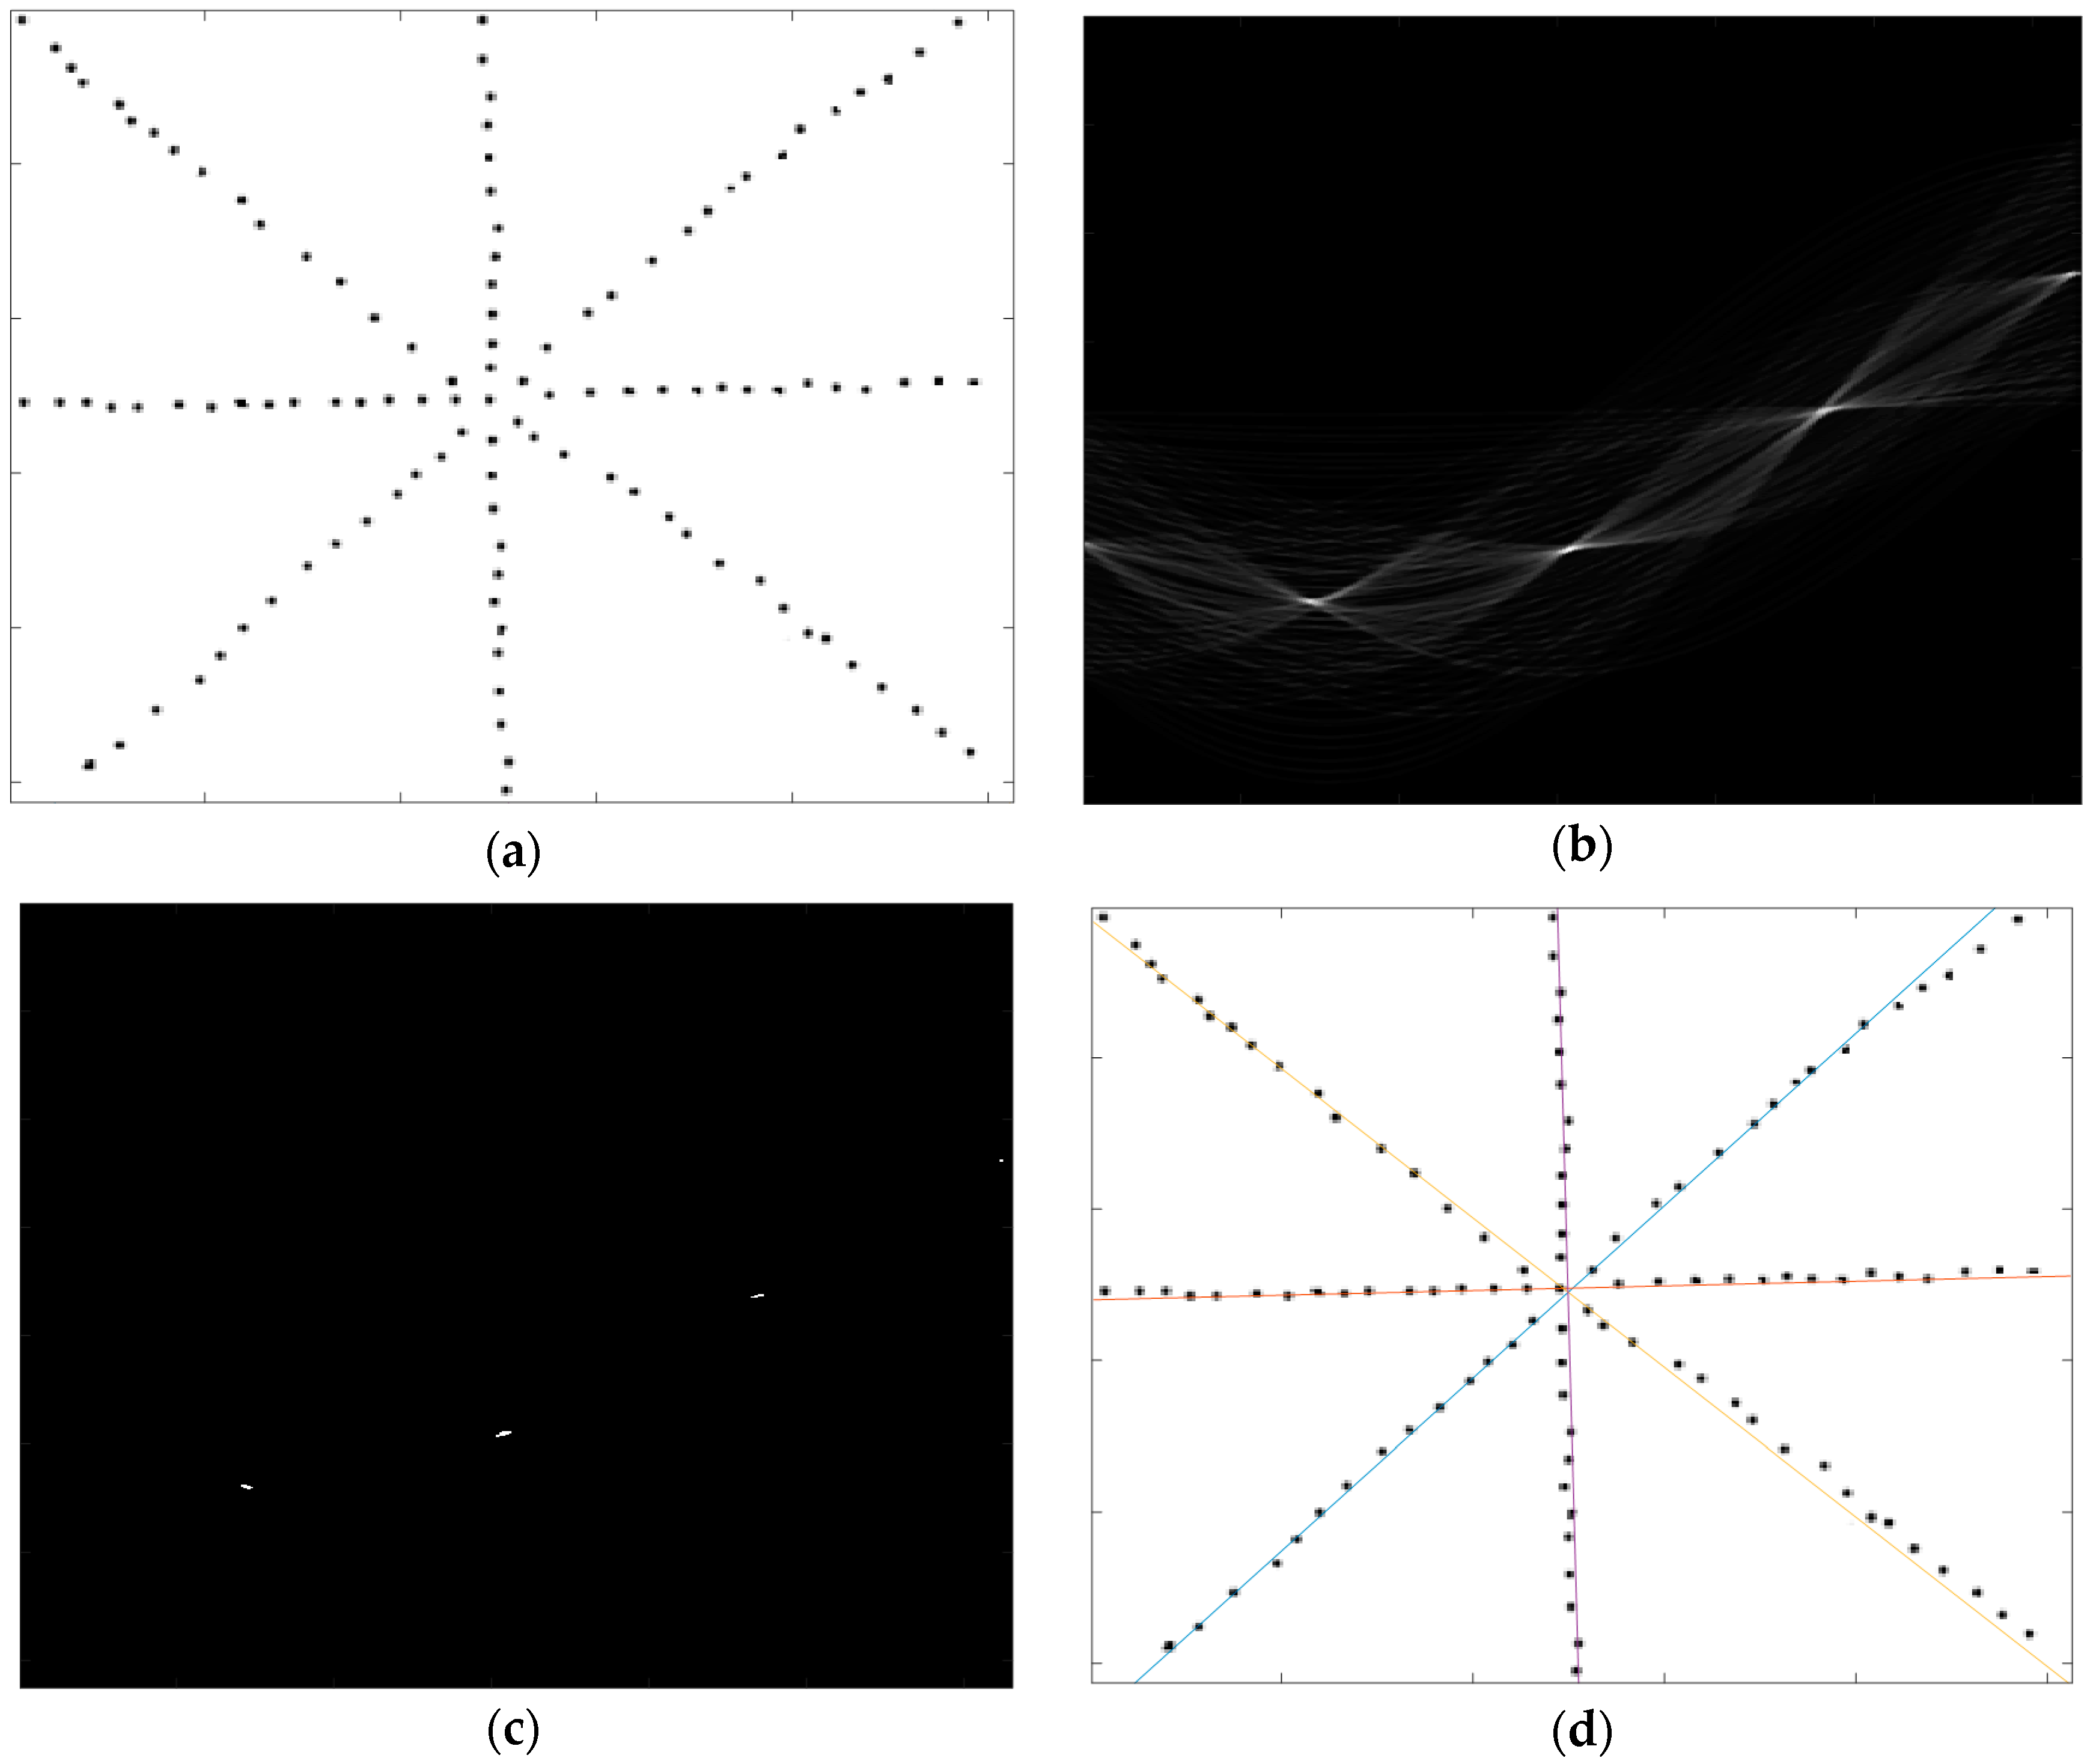
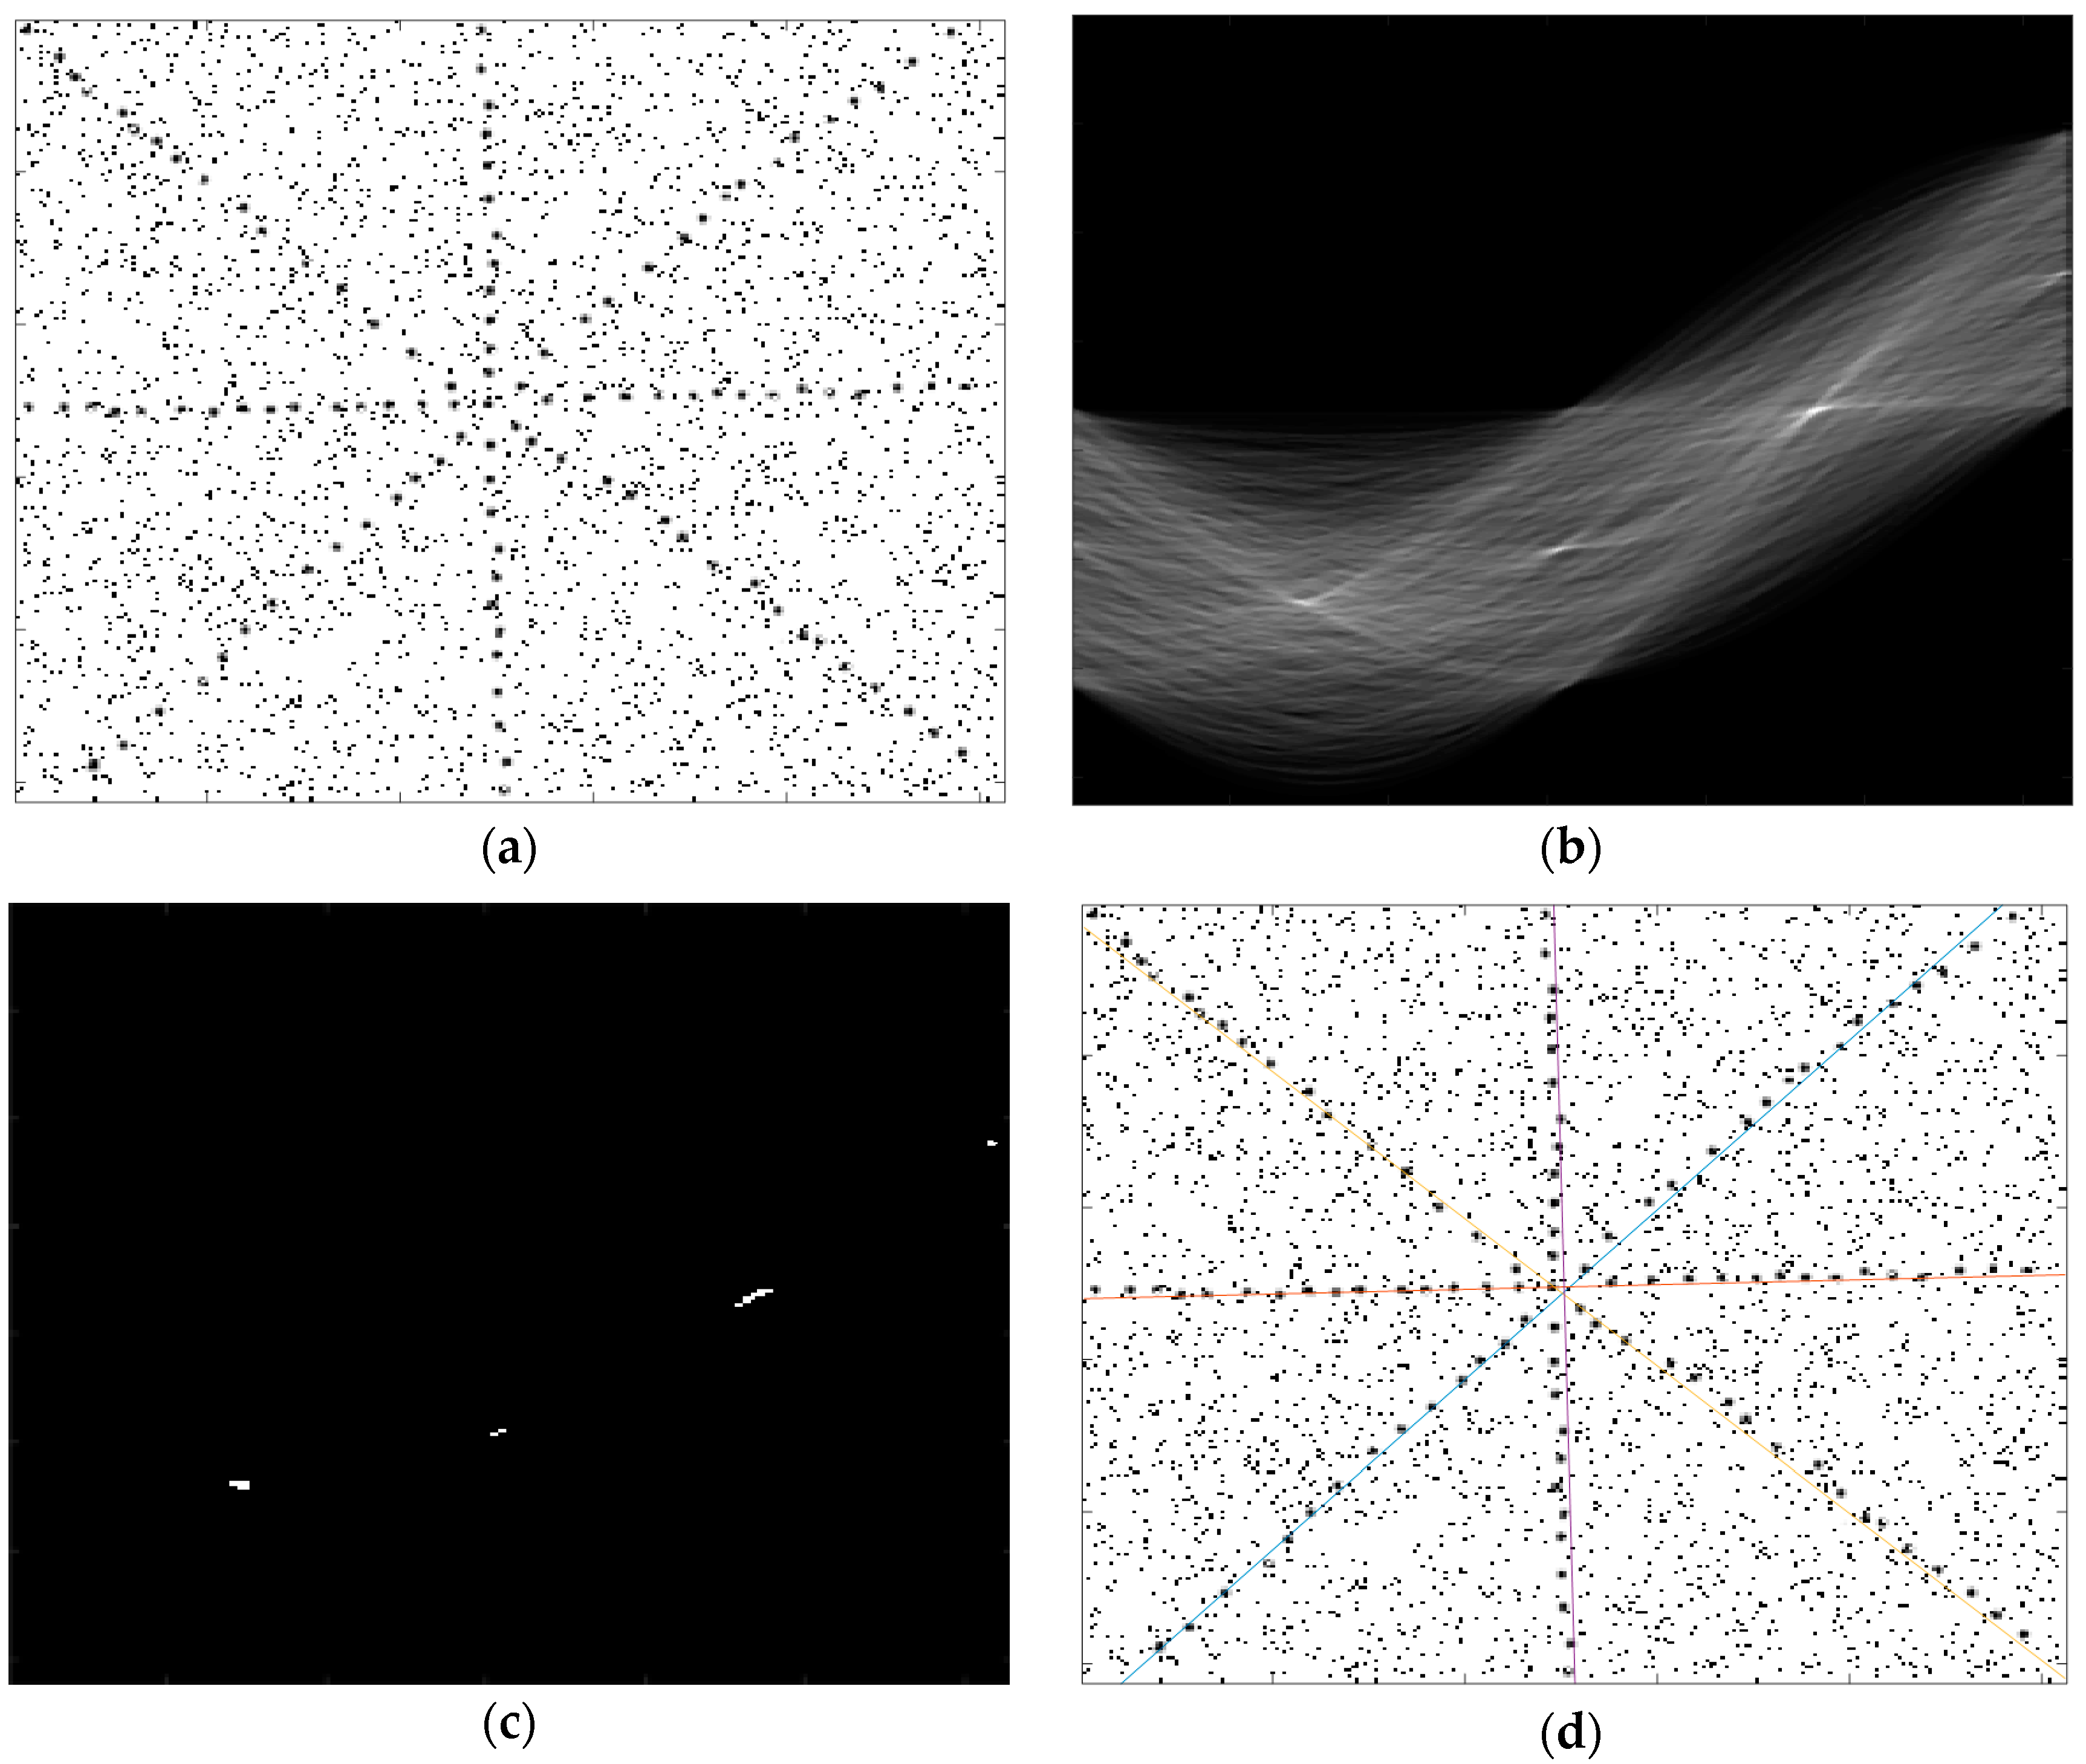
3.1. Neutrosophic Hough Space Image
3.2. Indeterminacy Filtering
3.3. Thresholding Based on Histogram in Neutrosophic Hough Image
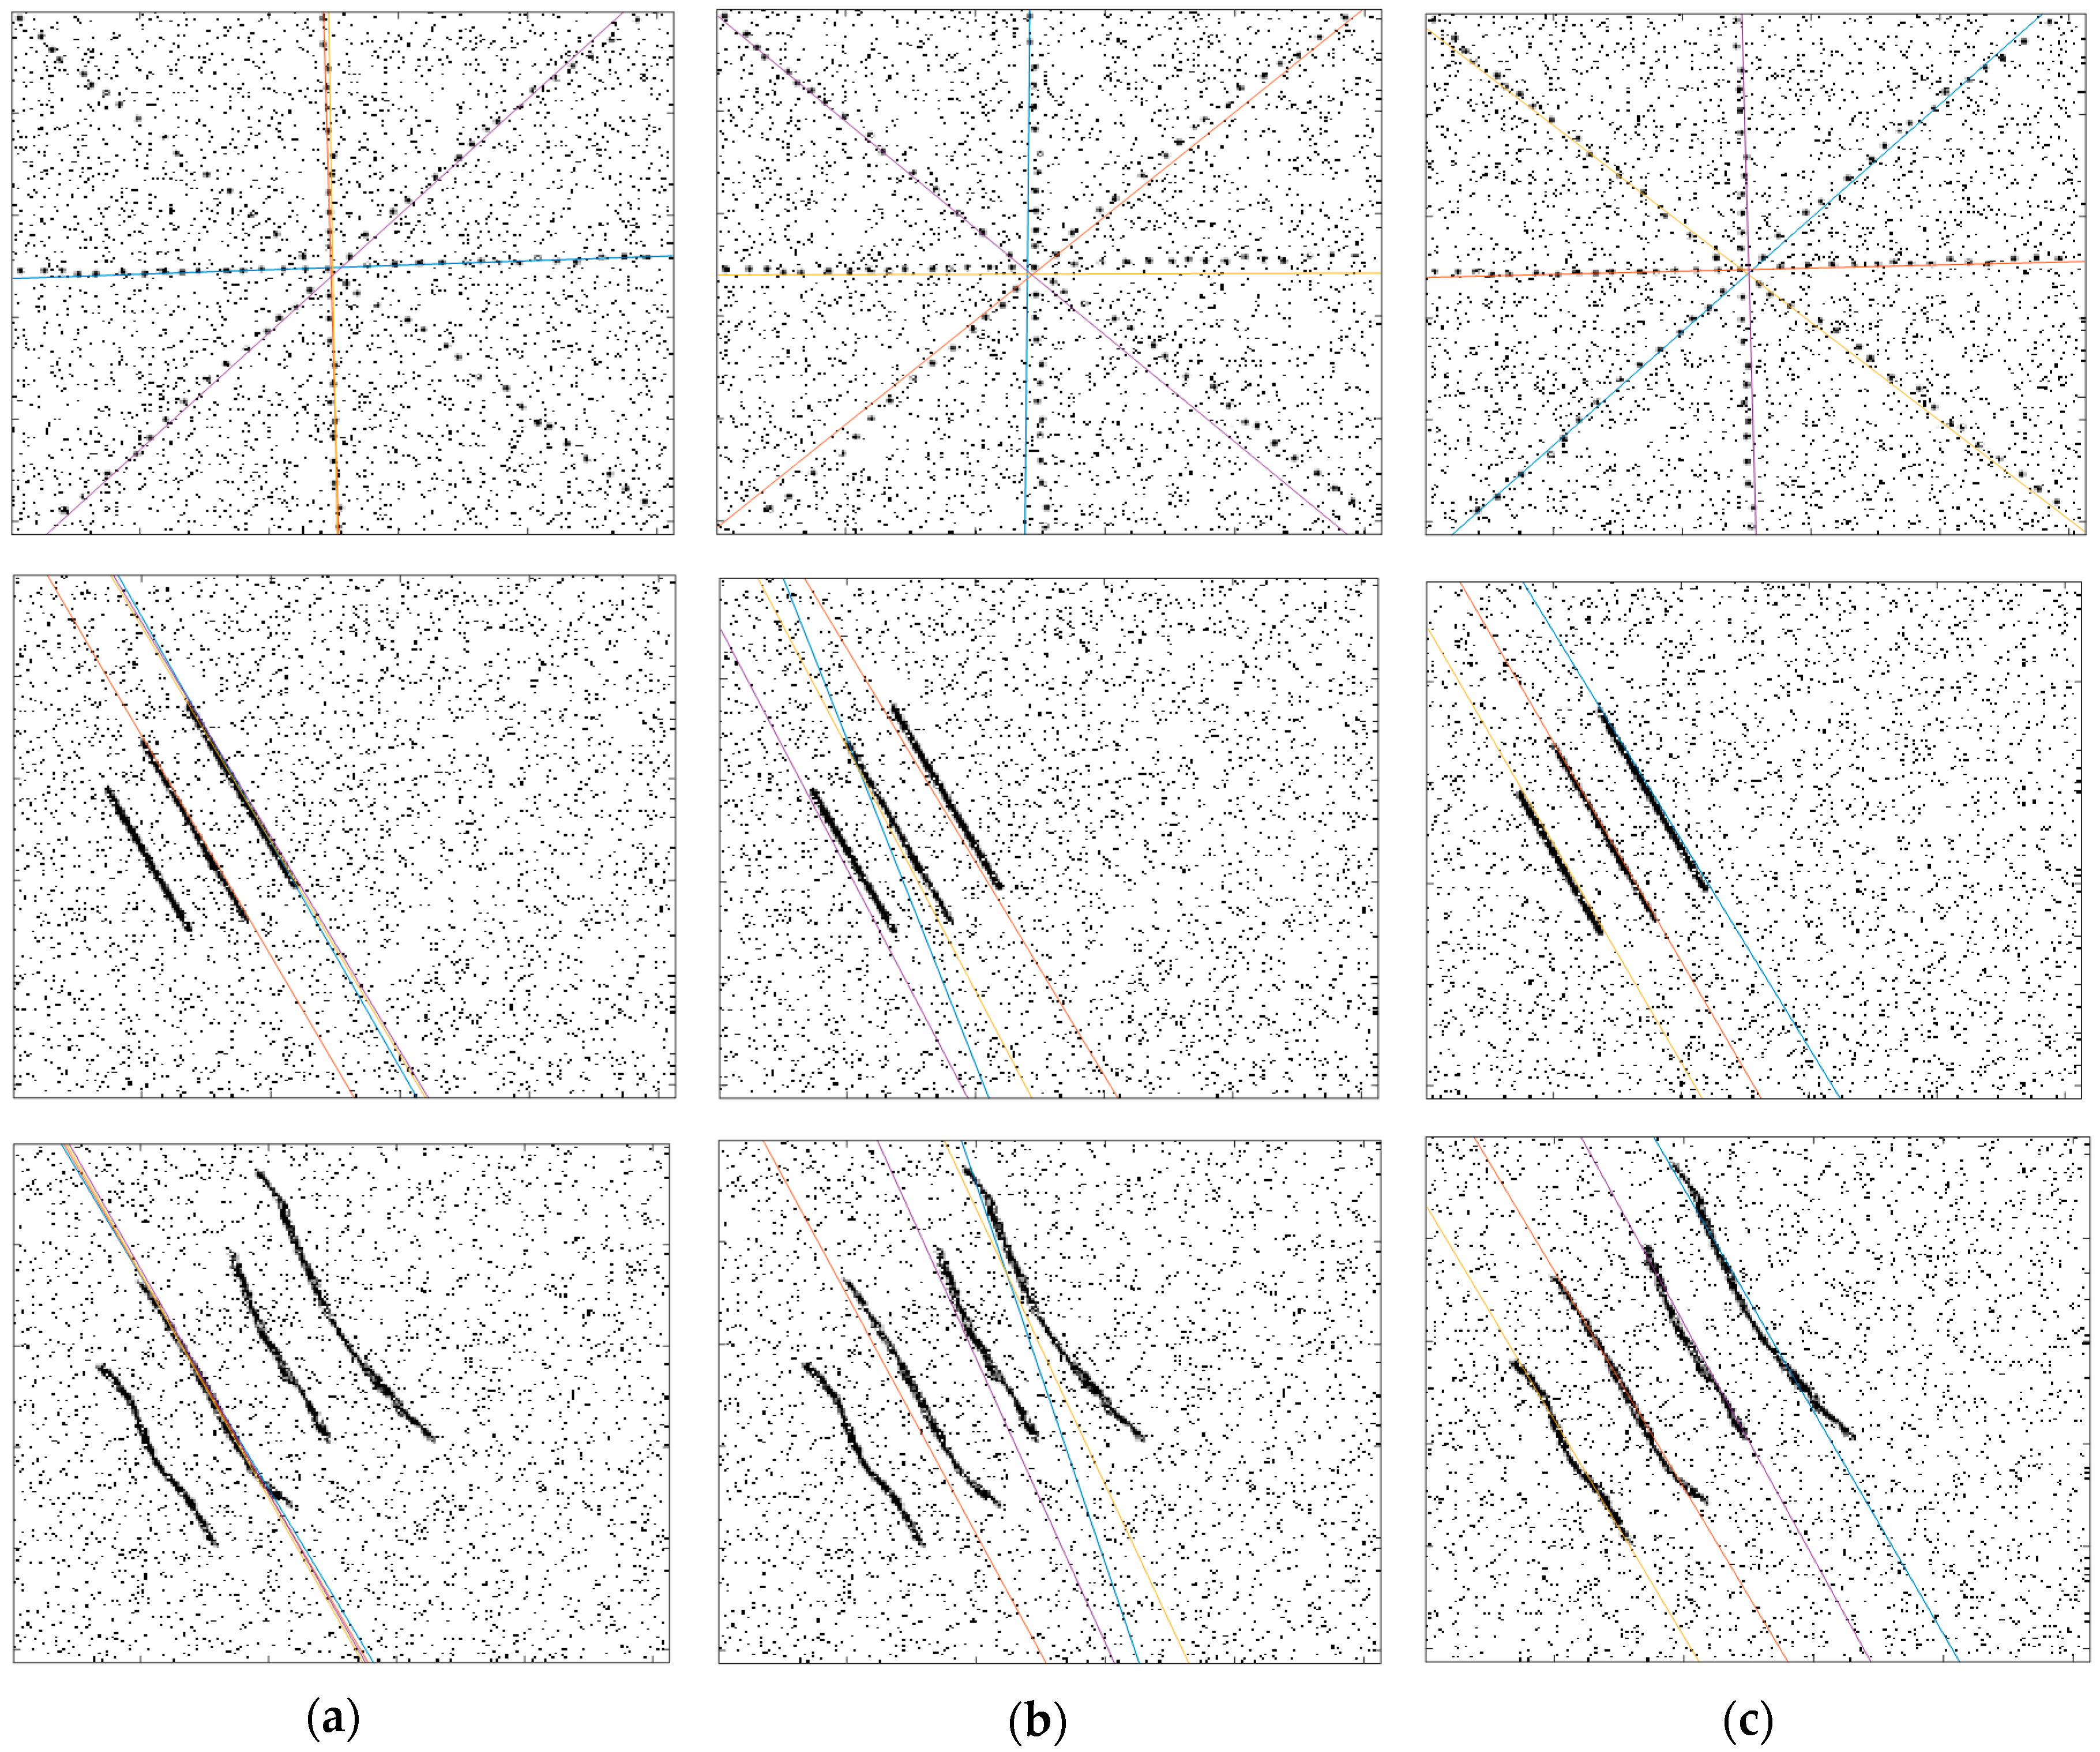
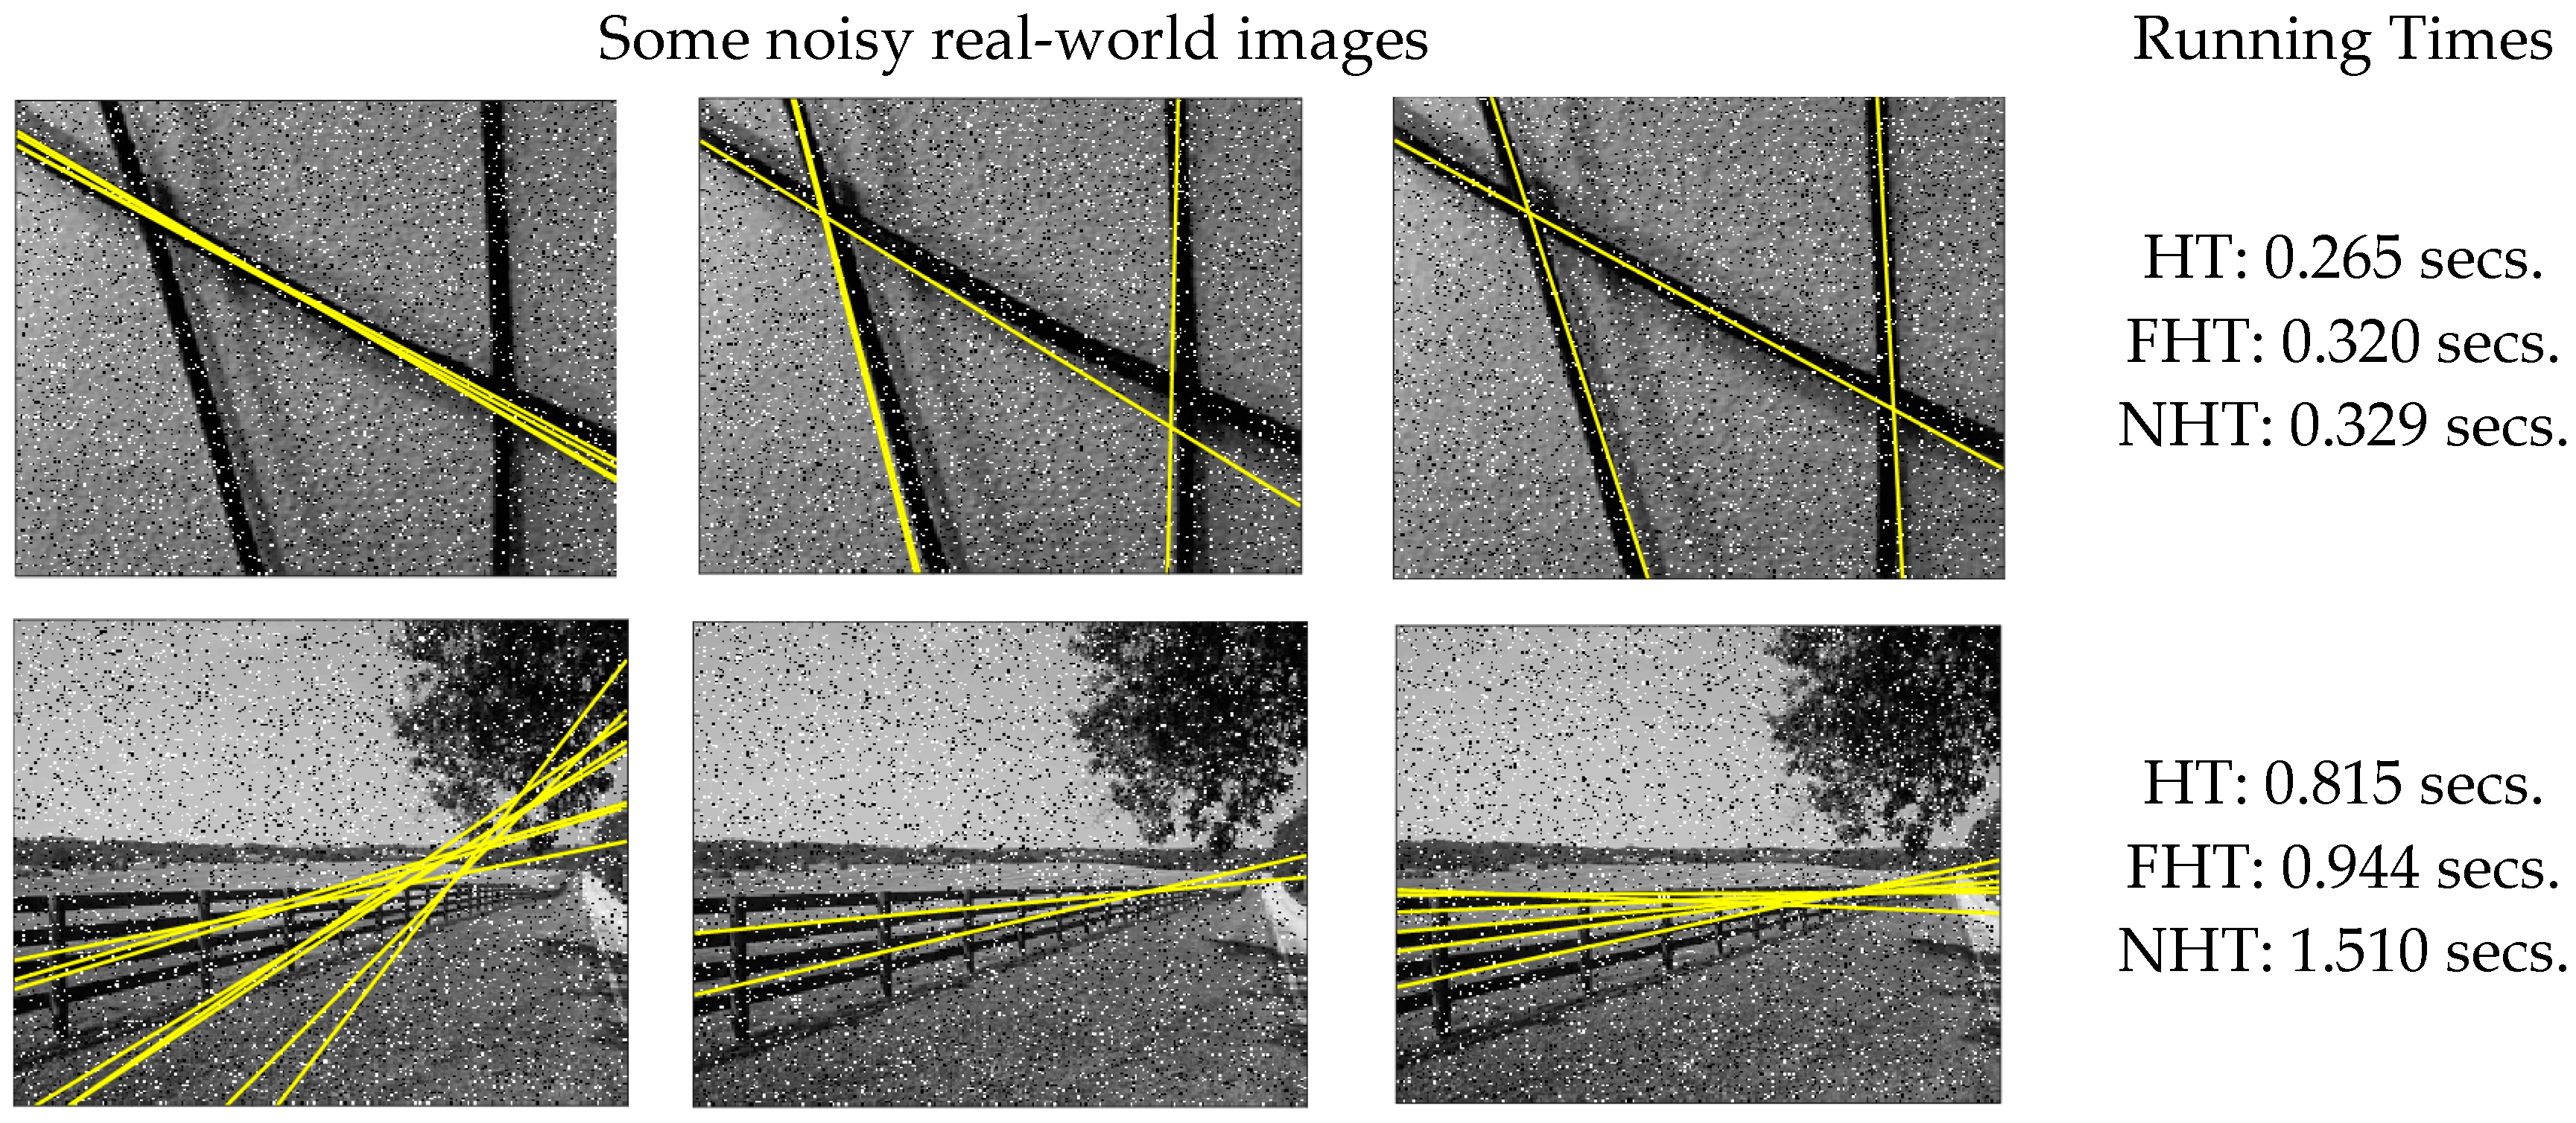
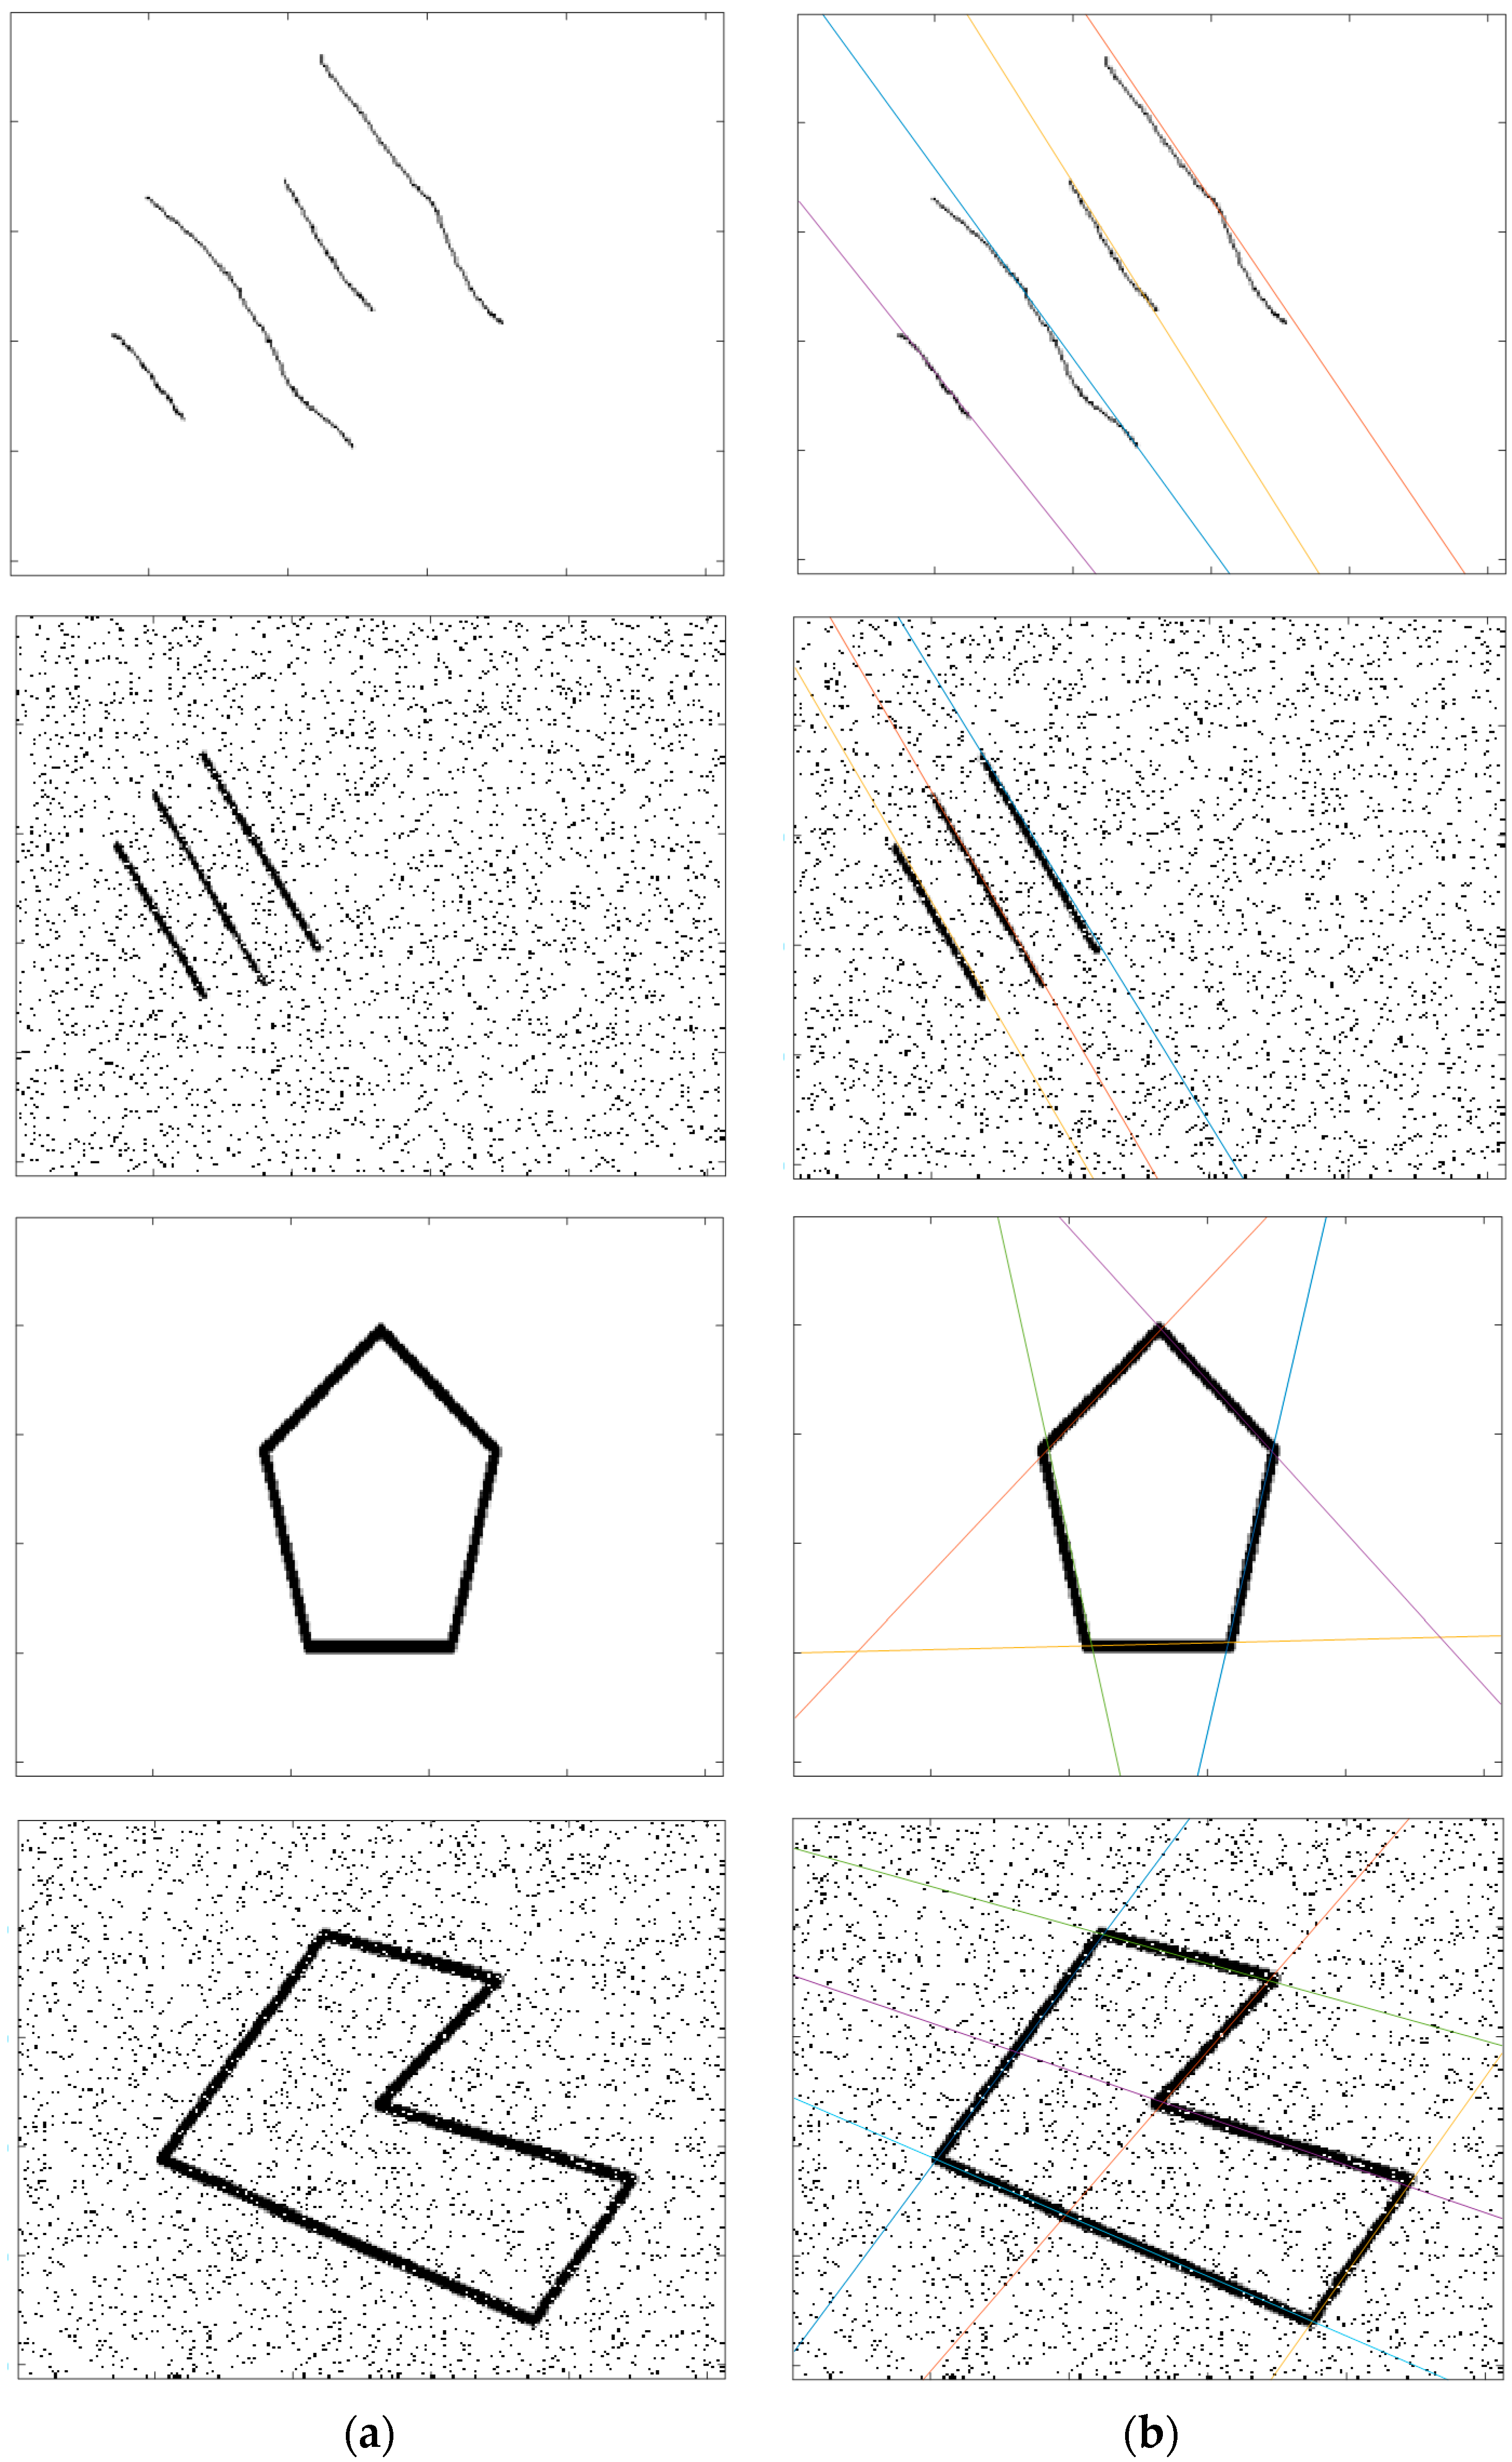
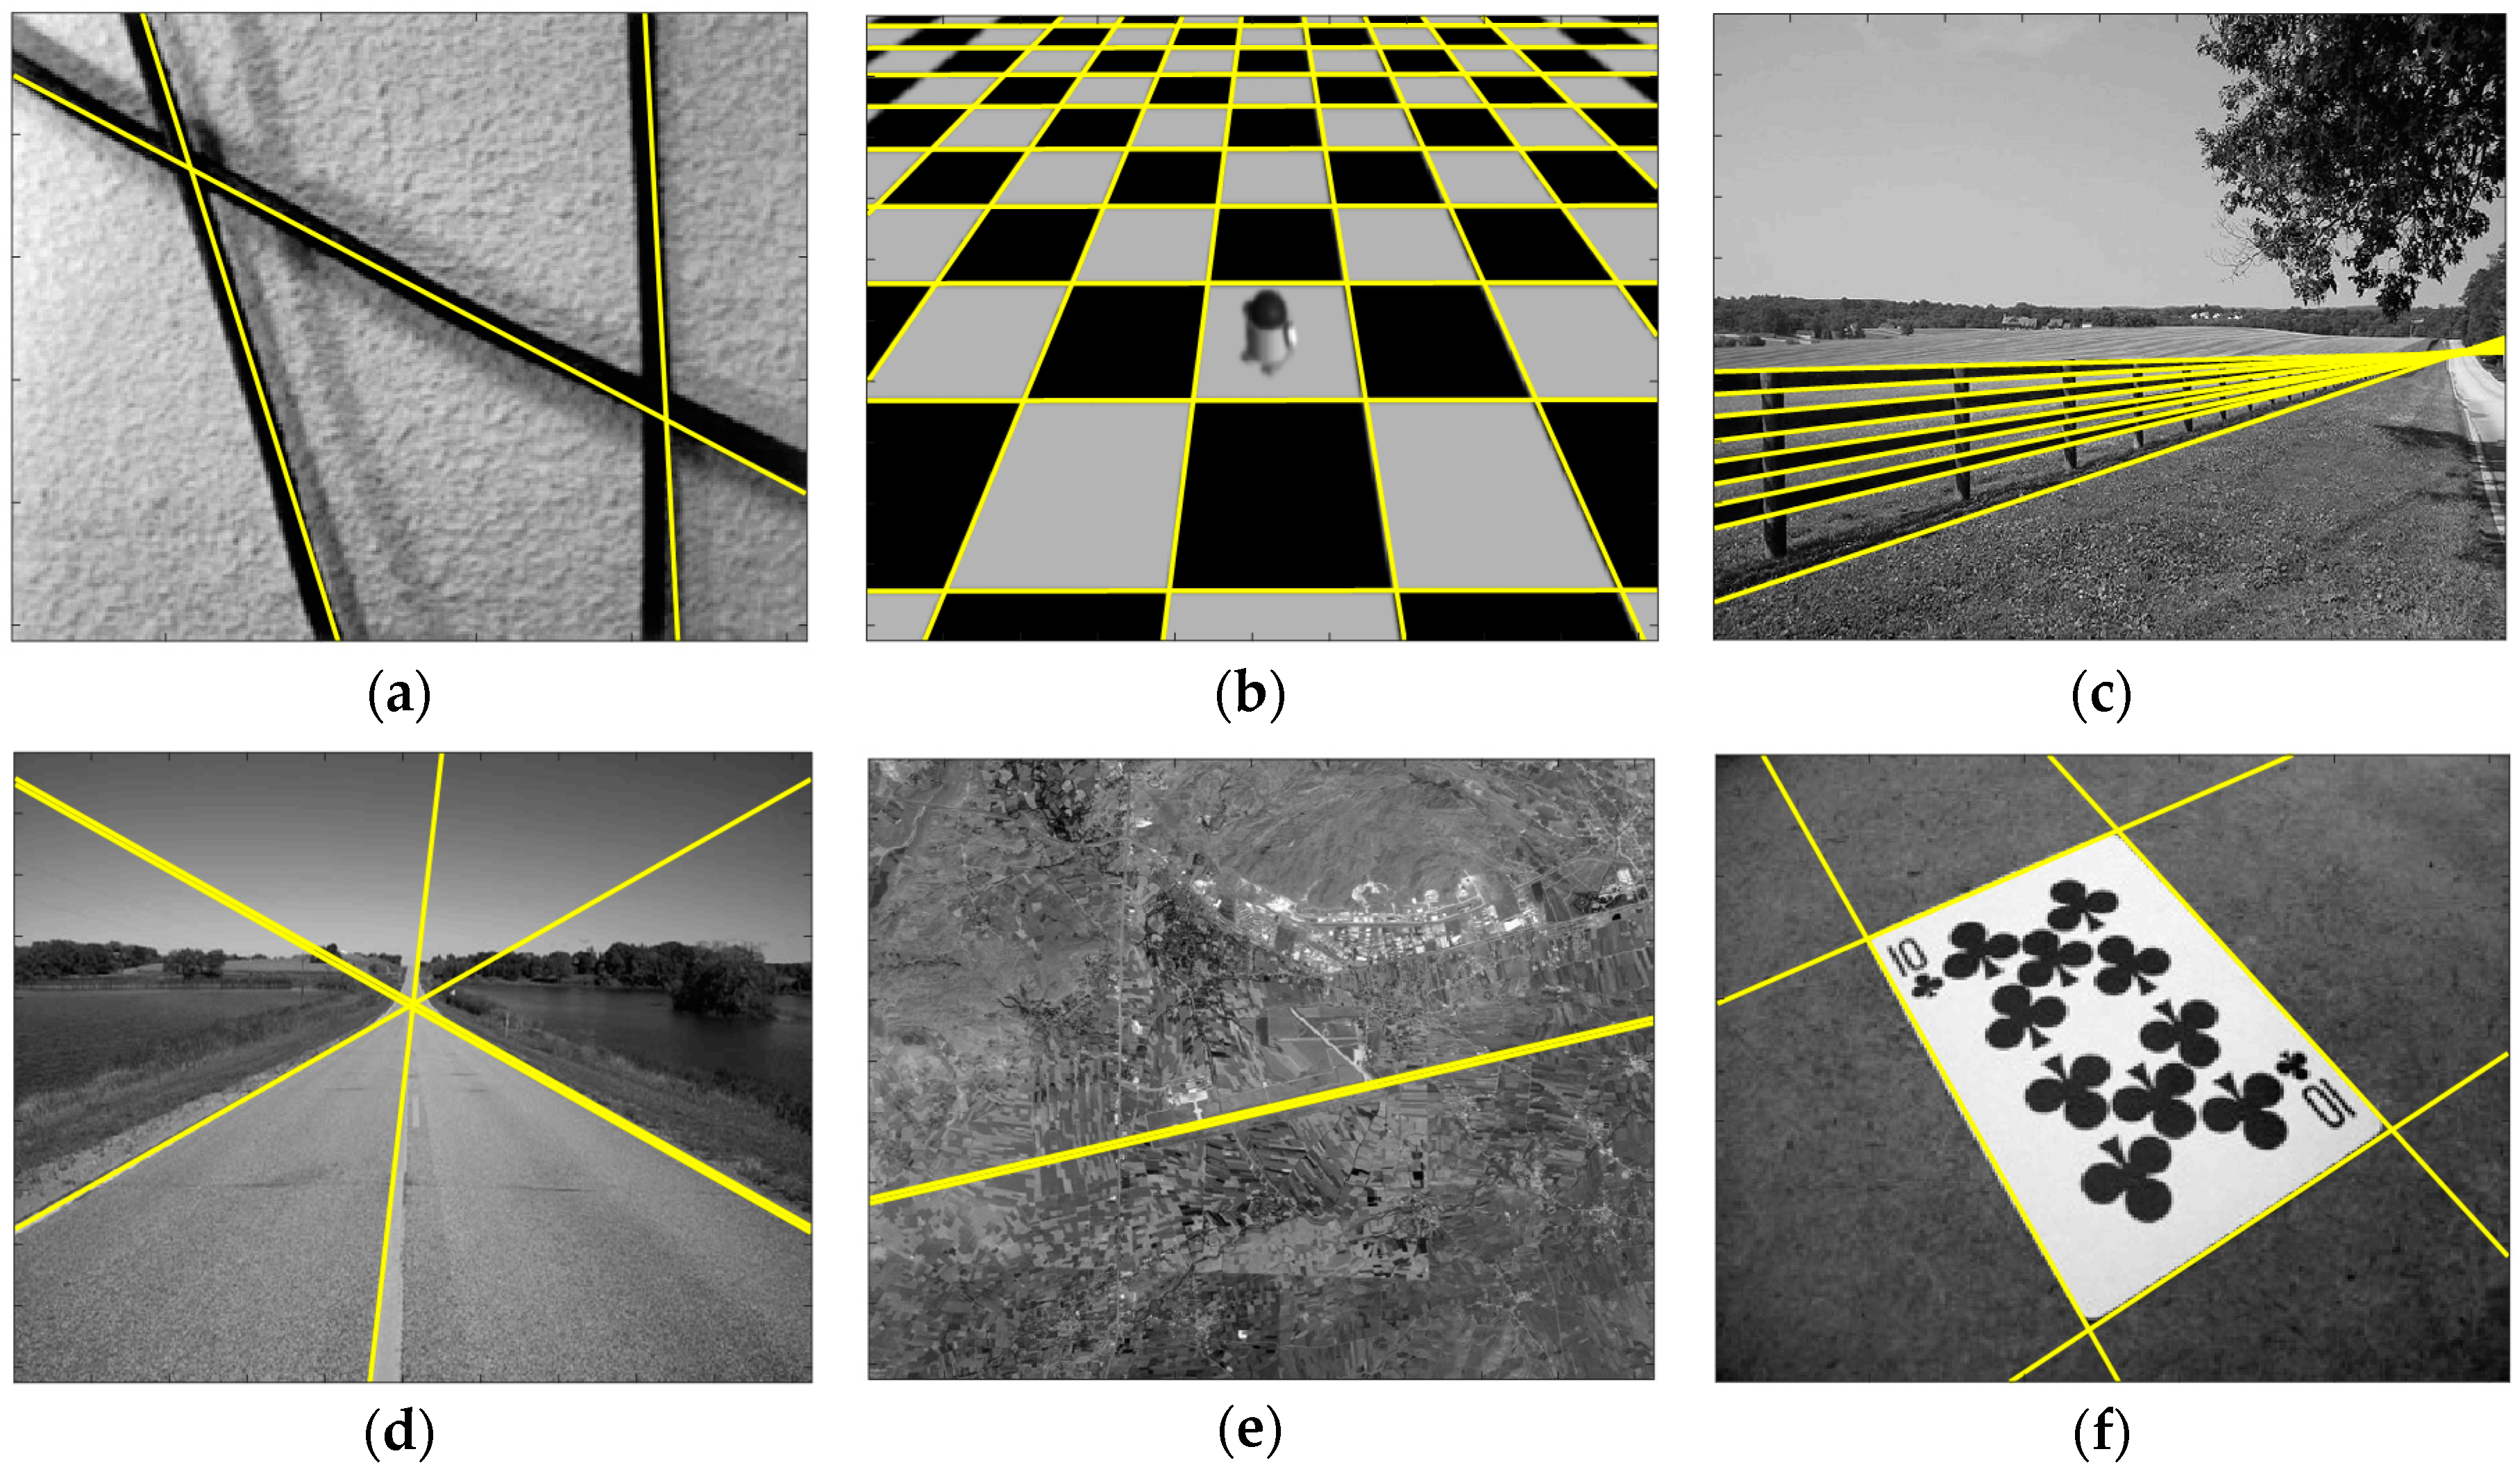
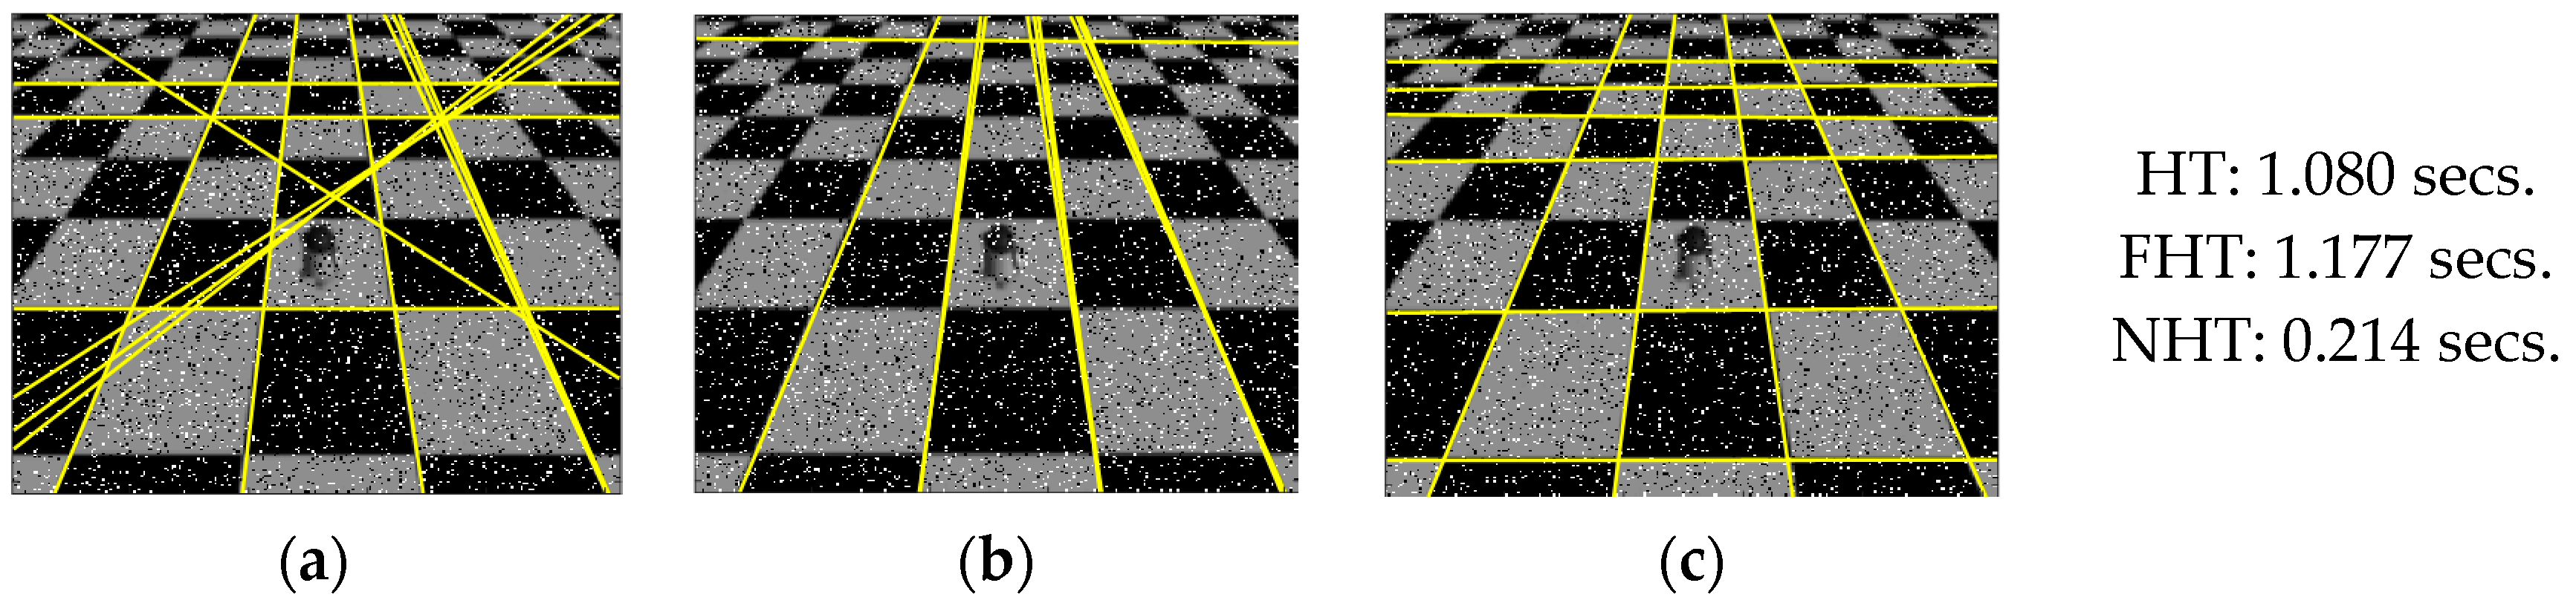
4. Experimental Results
5. Conclusions
Author Contributions
Conflicts of Interest
References
- Hough, P.V.C. Method and Means for Recognizing. US Patent 3,069,654, 25 March 1960. [Google Scholar]
- Duda, R.O.; Hart, P.E. Use of the Hough transform to detect lines and curves in pictures. Commun. ACM 1972, 15, 11–15. [Google Scholar] [CrossRef]
- Chung, K.L.; Chen, T.C.; Yan, W.M. New memory- and computation-efficient Hough transform for detecting lines. Pattern Recognit. 2004, 37, 953–963. [Google Scholar] [CrossRef]
- Guo, S.; Pridmore, T.; Kong, Y.; Zhang, X. An improved Hough transform voting scheme utilizing surround suppression. Pattern Recognit. Lett. 2009, 30, 1241–1252. [Google Scholar] [CrossRef]
- Walsh, D.; Raftery, A. Accurate and efficient curve detection in images: The importance sampling Hough transform. Pattern Recognit. 2002, 35, 1421–1431. [Google Scholar] [CrossRef]
- Xu, L.; Oja, E. Randomized Hough transform (RHT): Basic mechanisms, algorithms, and computational complexities. CVGIP Image Underst. 1993, 57, 131–154. [Google Scholar] [CrossRef]
- Han, J.H.; Koczy, L.T.; Poston, T. Fuzzy Hough transform. Patterns Recognit. Lett. 1994, 15, 649–658. [Google Scholar] [CrossRef]
- Montseny, E.; Sobrevilla, P.; Marès Martí, P. Edge orientation-based fuzzy Hough transform (EOFHT). In Proceedings of the 3rd Conference of the European Society for Fuzzy Logic and Technology, Zittau, Germany, 10–12 September 2003. [Google Scholar]
- Mathavan, S.; Vaheesan, K.; Kumar, A.; Chandrakumar, C.; Kamal, K.; Rahman, M.; Stonecliffe-Jones, M. Detection of pavement cracks using tiled fuzzy Hough transform. J. Electron. Imaging 2017, 26, 053008. [Google Scholar] [CrossRef]
- Chatzis, V.; Ioannis, P. Fuzzy cell Hough transform for curve detection. Pattern Recognit. 1997, 30, 2031–2042. [Google Scholar] [CrossRef]
- Suetake, N.; Uchino, E.; Hirata, K. Generalized fuzzy Hough transform for detecting arbitrary shapes in a vague and noisy image. Soft Comput. 2006, 10, 1161–1168. [Google Scholar] [CrossRef]
- Chung, K.-L.; Lin, Z.-W.; Huang, S.-T.; Huang, Y.-H.; Liao, H.-Y.M. New orientation-based elimination approach for accurate line-detection. Pattern Recognit. Lett. 2010, 31, 11–19. [Google Scholar] [CrossRef]
- Cheng, H.-D.; Guo, Y.; Zhang, Y. A novel Hough transform based on eliminating particle swarm optimization and its applications. Pattern Recognit. 2009, 42, 1959–1969. [Google Scholar] [CrossRef]
- Zhu, L.; Chen, Z. Probabilistic Convergent Hough Transform. In Proceedings of the International Conference on Information and Automation, Changsha, China, 20–23 June 2008. [Google Scholar]
- Ballard, D.H. Generalizing the Hough Transform to Detect Arbitrary Shapes. Pattern Recognit. 1981, 13, 111–122. [Google Scholar] [CrossRef]
- Smarandache, F. Neutrosophy: Neutrosophic Probability, Set, and Logic; ProQuest Information & Learning; American Research Press: Rehoboth, DE, USA, 1998; 105p. [Google Scholar]
- Smarandache, F. Introduction to Neutrosophic Measure, Neutrosophic Integral and Neutrosophic Probability; Sitech Education Publishing: Columbus, OH, USA, 2013; 55p. [Google Scholar]
- Smarandache, F. A Unifying Field in Logics Neutrosophic Logic. In Neutrosophy, Neutrosophic Set, Neutrosophic Probability, 3rd ed.; American Research Press: Rehoboth, DE, USA, 2003. [Google Scholar]
- Vaheesan, K.; Chandrakumar, C.; Mathavan, S.; Kamal, K.; Rahman, M.; Al-Habaibeh, A. Tiled fuzzy Hough transform for crack detection. In Proceedings of the Twelfth International Conference on Quality Control by Artificial Vision (SPIE 9534), Le Creusot, France, 3–5 June 2015. [Google Scholar]
- Guo, Y.; Şengür, A. A novel image segmentation algorithm based on neutrosophic filtering and level set. Neutrosophic Sets Syst. 2013, 1, 46–49. [Google Scholar]
- Guo, Y.; Xia, R.; Şengür, A.; Polat, K. A novel image segmentation approach based on neutrosophic c-means clustering and indeterminacy filtering. Neural Comput. Appl. 2017, 28, 3009–3019. [Google Scholar] [CrossRef]
- Karabatak, E.; Guo, Y.; Sengur, A. Modified neutrosophic approach to color image segmentation. J. Electron. Imaging 2013, 22, 013005. [Google Scholar] [CrossRef]
- Guo, Y.; Sengur, A. A novel color image segmentation approach based on neutrosophic set and modified fuzzy c-means. Circuits Syst. Signal Process. 2013, 32, 1699–1723. [Google Scholar] [CrossRef]
- Sengur, A.; Guo, Y. Color texture image segmentation based on neutrosophic set and wavelet transformation. Comput. Vis. Image Underst. 2011, 115, 1134–1144. [Google Scholar] [CrossRef]
- Guo, Y.; Şengür, A.; Tian, J.W. A novel breast ultrasound image segmentation algorithm based on neutrosophic similarity score and level set. Comput. Methods Programs Biomed. 2016, 123, 43–53. [Google Scholar] [CrossRef] [PubMed]
- Guo, Y.; Sengur, A. NCM: Neutrosophic c-means clustering algorithm. Pattern Recognit. 2015, 48, 2710–2724. [Google Scholar] [CrossRef]
- Guo, Y.; Şengür, A. A novel image segmentation algorithm based on neutrosophic similarity clustering. Appl. Soft Comput. 2014, 25, 391–398. [Google Scholar] [CrossRef]


© 2017 by the authors. Licensee MDPI, Basel, Switzerland. This article is an open access article distributed under the terms and conditions of the Creative Commons Attribution (CC BY) license (http://creativecommons.org/licenses/by/4.0/).
Share and Cite
Budak, Ü.; Guo, Y.; Şengür, A.; Smarandache, F. Neutrosophic Hough Transform. Axioms 2017, 6, 35. https://doi.org/10.3390/axioms6040035
Budak Ü, Guo Y, Şengür A, Smarandache F. Neutrosophic Hough Transform. Axioms. 2017; 6(4):35. https://doi.org/10.3390/axioms6040035
Chicago/Turabian StyleBudak, Ümit, Yanhui Guo, Abdulkadir Şengür, and Florentin Smarandache. 2017. "Neutrosophic Hough Transform" Axioms 6, no. 4: 35. https://doi.org/10.3390/axioms6040035
APA StyleBudak, Ü., Guo, Y., Şengür, A., & Smarandache, F. (2017). Neutrosophic Hough Transform. Axioms, 6(4), 35. https://doi.org/10.3390/axioms6040035