1. Introduction
In many applied areas such as engineering, medicine, insurance, and economics, probability distributions are widely used to model, analyze, and predict data behavior. The accuracy with which we have performed statistical inference would depend, to a large extent, on the quality of fit of the selected probability distribution to the underlying data patterns. However, many traditional distributions are often not flexible and accurate enough to model complex datasets, which has led to the development of new distribution models that possess more flexibility.
The T-X method proposed by [
1] is one of the popular approaches for creating classes of distributions. This technique consists in combining a base distribution
with an upper bound function
to obtain different families of distributions. Based on this idea, some remarkable families and distributions have been constructed, such as the Gompertz–G family by [
2], exponentiated T-X family by [
3], the transmuted Topp–Leone–G family by [
4], and the odd Nadarajah–Haghighi family by [
5].
In a very recent research article [
6], a new family based on the T-X approach was proposed by introducing
as an upper bound of the integral, where
is the exponentiated inverse of the hazard function (HF), and
is a shape parameter that affects the weight of the distribution. The cumulative distribution function (CDF), and the probability density function (PDF) of the family can be obtained as follows:
This approach has been designed to successfully achieve more flexible distributions that can accurately fit real data.
Therefore, this article will introduce a new class of distributions based on the HF of the Weibull distribution. The CDF and PDF for this new class are defined as follows.
The Weibull distribution is one of the most popular life and reliability data distributions, because of its flexibility to model increasing and decreasing failure rates. As a versatile tool in temporal data analysis, it has been shown to be effective in capturing time-related failure behaviors, especially in the analysis of temporal failure behaviors related to reliability and survivability and the response of physical or biological systems under various changing conditions.
The Weibull distribution, while versatile, is insufficient for modeling data that exhibit non-monotonic failure behavior. In order to address these limitations, various extended families have been introduced, with the Weibull-G proposed by [
7] being the most notable. This involves inserting a baseline distribution function into the Weibull structure to increase the flexibility of the model. In addition, several families were established such as the generalized Weibull family introduced by [
8], the truncated Weibull-G family, introduced by [
9], as well as the extended odd Weibull-G given in [
10], and a new power generalized Weibull-G from [
11]. These families can be used to improve modeling for real-world data that have complex tail behavior or varying hazard rate shapes by incorporating additional shape parameters to improve flexibility.
The Rayleigh distribution, which is a special case of the Weibull distribution, is one of the oldest and most recognized distributions in fields such as signal analysis, radar systems, and reliability. The significance of this distribution is that it has a straightforward and interpretable design. It has frequently been used to describe multipath fading in wireless communication systems by [
12]. Within fading-shadowing channels [
13] showed that it is also the basic reference structure for models with more involved anatomy. Furthermore, the extended form of the Rayleigh distribution has been widely investigated in reliability analysis and parameter estimation, as presented by [
14].
In such contexts, change-point (CP) analysis has become a useful statistical tool to detect discontinuities and turning points in real-world data. This approach is used to identify the points in time at which a distribution changes significantly either in mean, variance, or overall distributional shape. It has found its extensive application from quality control, medical diagnosis and performance monitoring to time-series analysis in dynamical or industrial environments. The techniques used are based on classical tests, information criteria, and data-driven algorithms, making it an advanced technique to identify unobserved changing signals in data. In addition to its numerous applications in applied sciences, CP analysis is also effective in analyzing probability distributions, particularly in detecting structural changes in distributional characteristics, such as changes in parameters or changes in shape [
15,
16,
17,
18,
19].
Inspired by the efficacy of the novel methodology in [
6] to generate more flexible distributions that accurately correspond to empirical data, this article aims to integrate the capabilities of the Weibull distribution with the features of the Rayleigh distribution. This will yield a distribution capable of modeling complex data with non-monotonic failure rates, reflecting real-world scenarios where system or component failure rates vary over time, a phenomenon prevalent in engineering, finance, healthcare, and other sectors. The newly developed flexible form of the Weibull–Rayleigh distribution (WR) will effectively capture structural changes in the data. This is especially advantageous in contexts where distributional characteristics undergo sudden changes, such as alterations in operational conditions or treatment effects. The WR distribution integrates the CP analysis using MIC to determine the location of structural changes.
The structure of the paper is outlined as follows:
Section 2 introduces the new Weibull–Rayleigh distribution. Some statistical properties of WR are investigated in
Section 3. Five methods of estimation are used to estimate the WR parameters in
Section 4.
Section 5 presents a simulation study to evaluate the performance of the estimators. In
Section 6, three real-world data sets are analyzed to emphasize the importance of the WR distribution and demonstrate CP detection. Finally,
Section 7 reports the findings and concludes the article.
6. Applications
This section demonstrates the applicability of the WR distribution to real-life data, indicating that WR provides a superior fit compared to several established distributions.
Failure times of 50 components (per 1000 h).
The following is the dataset, which is taken from [
21] and represents the failure times of 50 components (in 1000 h). The observations are:
0.036, 0.058, 0.061, 0.074, 0.078, 0.086, 0.102, 0.103, 0.114, 0.116, 0.148, 0.183, 0.192, 0.254, 0.262, 0.379, 0.381, 0.538, 0.570, 0.574, 0.590, 0.618, 0.645, 0.961, 1.228, 1.600, 2.006, 2.054, 2.804, 3.058, 3.076, 3.147, 3.625, 3.704, 3.931, 4.073, 4.393, 4.534, 4.893, 6.274, 6.816, 7.896, 7.904, 8.022, 9.337, 10.940, 11.020, 13.880, 14.730, 15.080.
Carbon fiber breaking stress (GPa).
The second data set scoured from [
22], comprises 100 observations on breaking stress of carbon fibers (in Gba):
0.39, 0.81, 0.85, 0.98, 1.08, 1.12, 1.17, 1.18, 1.22, 1.25, 1.36, 1.41, 1.47, 1.57, 1.57, 1.59, 1.59, 1.61, 1.61, 1.69, 1.69, 1.71, 1.73, 1.80, 1.84, 1.84, 1.87, 1.89, 1.92, 2, 2.03, 2.03, 2.05, 2.12, 2.17, 2.17, 2.17, 2.35, 2.38, 2.41, 2.43, 2.48, 2.48, 2.50, 2.53, 2.55, 2.55, 2.56, 2.59, 2.67, 2.73, 2.74, 2.76, 2.77, 2.79, 2.81, 2.81, 2.82, 2.83, 2.85, 2.87, 2.88, 2.93, 2.95, 2.96, 2.97, 2.97, 3.09, 3.11, 3.11, 3.15, 3.15, 3.19, 3.19, 3.22, 3.22, 3.27, 3.28, 3.31, 3.31, 3.33, 3.39, 3.39, 3.51, 3.56, 3.60, 3.65, 3.68, 3.68, 3.68, 3.70, 3.75, 4.20, 4.38, 4.42,4.70. 4.90, 4.91, 5.08, 5.56.
Survival time for chemotherapy patients.
The third data from [
23] provides survival times (in years) for 46 patients undergoing chemotherapy. The data are listed below:
0.047, 0.115, 0.121, 0.132, 0.164, 0.197, 0.203, 0.260, 0.282, 0.296, 0.334, 0.395, 0.458, 0.466, 0.501, 0.507, 0.529, 0.534, 0.540, 0.570, 0.641, 0.644, 0.696, 0.841, 0.863, 1.099, 1.219, 1.271, 1.326, 1.447, 1.485, 1.553, 1.581, 1.589, 2.178, 2.343, 2.416, 2.444, 2.825, 2.830, 3.578, 3.658, 3.743, 3.978, 4.003, 4.033.
We evaluate the appropriateness of the WR model on the three datasets by contrasting its fit with that of the following competing models
Rayleigh distribution (R),
Lomax–Rayleigh (LR), [
24].
Exponential transformed inverse Rayleigh (ETIR), [
25]:
Extended odd Weibull inverse Rayleigh (EOWIR), [
26].
Alpha-Power exponentiated inverse Rayleigh (APEIR), [
27].
Type II exponentiated half-logistic-PLo (TIIEHL-PLo), [
28]
Scale mixture of Rayleigh distribution (SMR), [
29]
Each model’s parameters are estimated using the ML approach, and calculations are carried out using the ‘optim’ function in the R statistical program. The results are summarized in
Table 6,
Table 7 and
Table 8, presenting the superiority of the WR model over other competing distributions in terms of goodness of fit (GoF) measures. In particular, it achieves the lowest scores in major statistics, including the Akaike Information Criterion (AIC), Bayesian Information Criterion (BIC), Consistent Akaike Information Criterion (CAIC), Hannan–Quinn Information Criterion (HQIC), Kolmogorov–Smirnov (K-S) and Anderson–Darling (A-D) tests. The K-S and A-D tests assess the alignment between the empirical distribution function of the data and the CDF of the fitted model. The null hypothesis for each test proposes that the data are in conformity with the designated distribution. As all
p-values for the K-S test in
Table 6,
Table 7 and
Table 8 exceed 0.05, we do not reject the null hypothesis. This signifies that the WR model fits the data adequately and consistently produces a larger
p-value compared to competing distributions, which implies its strength in modeling the supplied datasets.
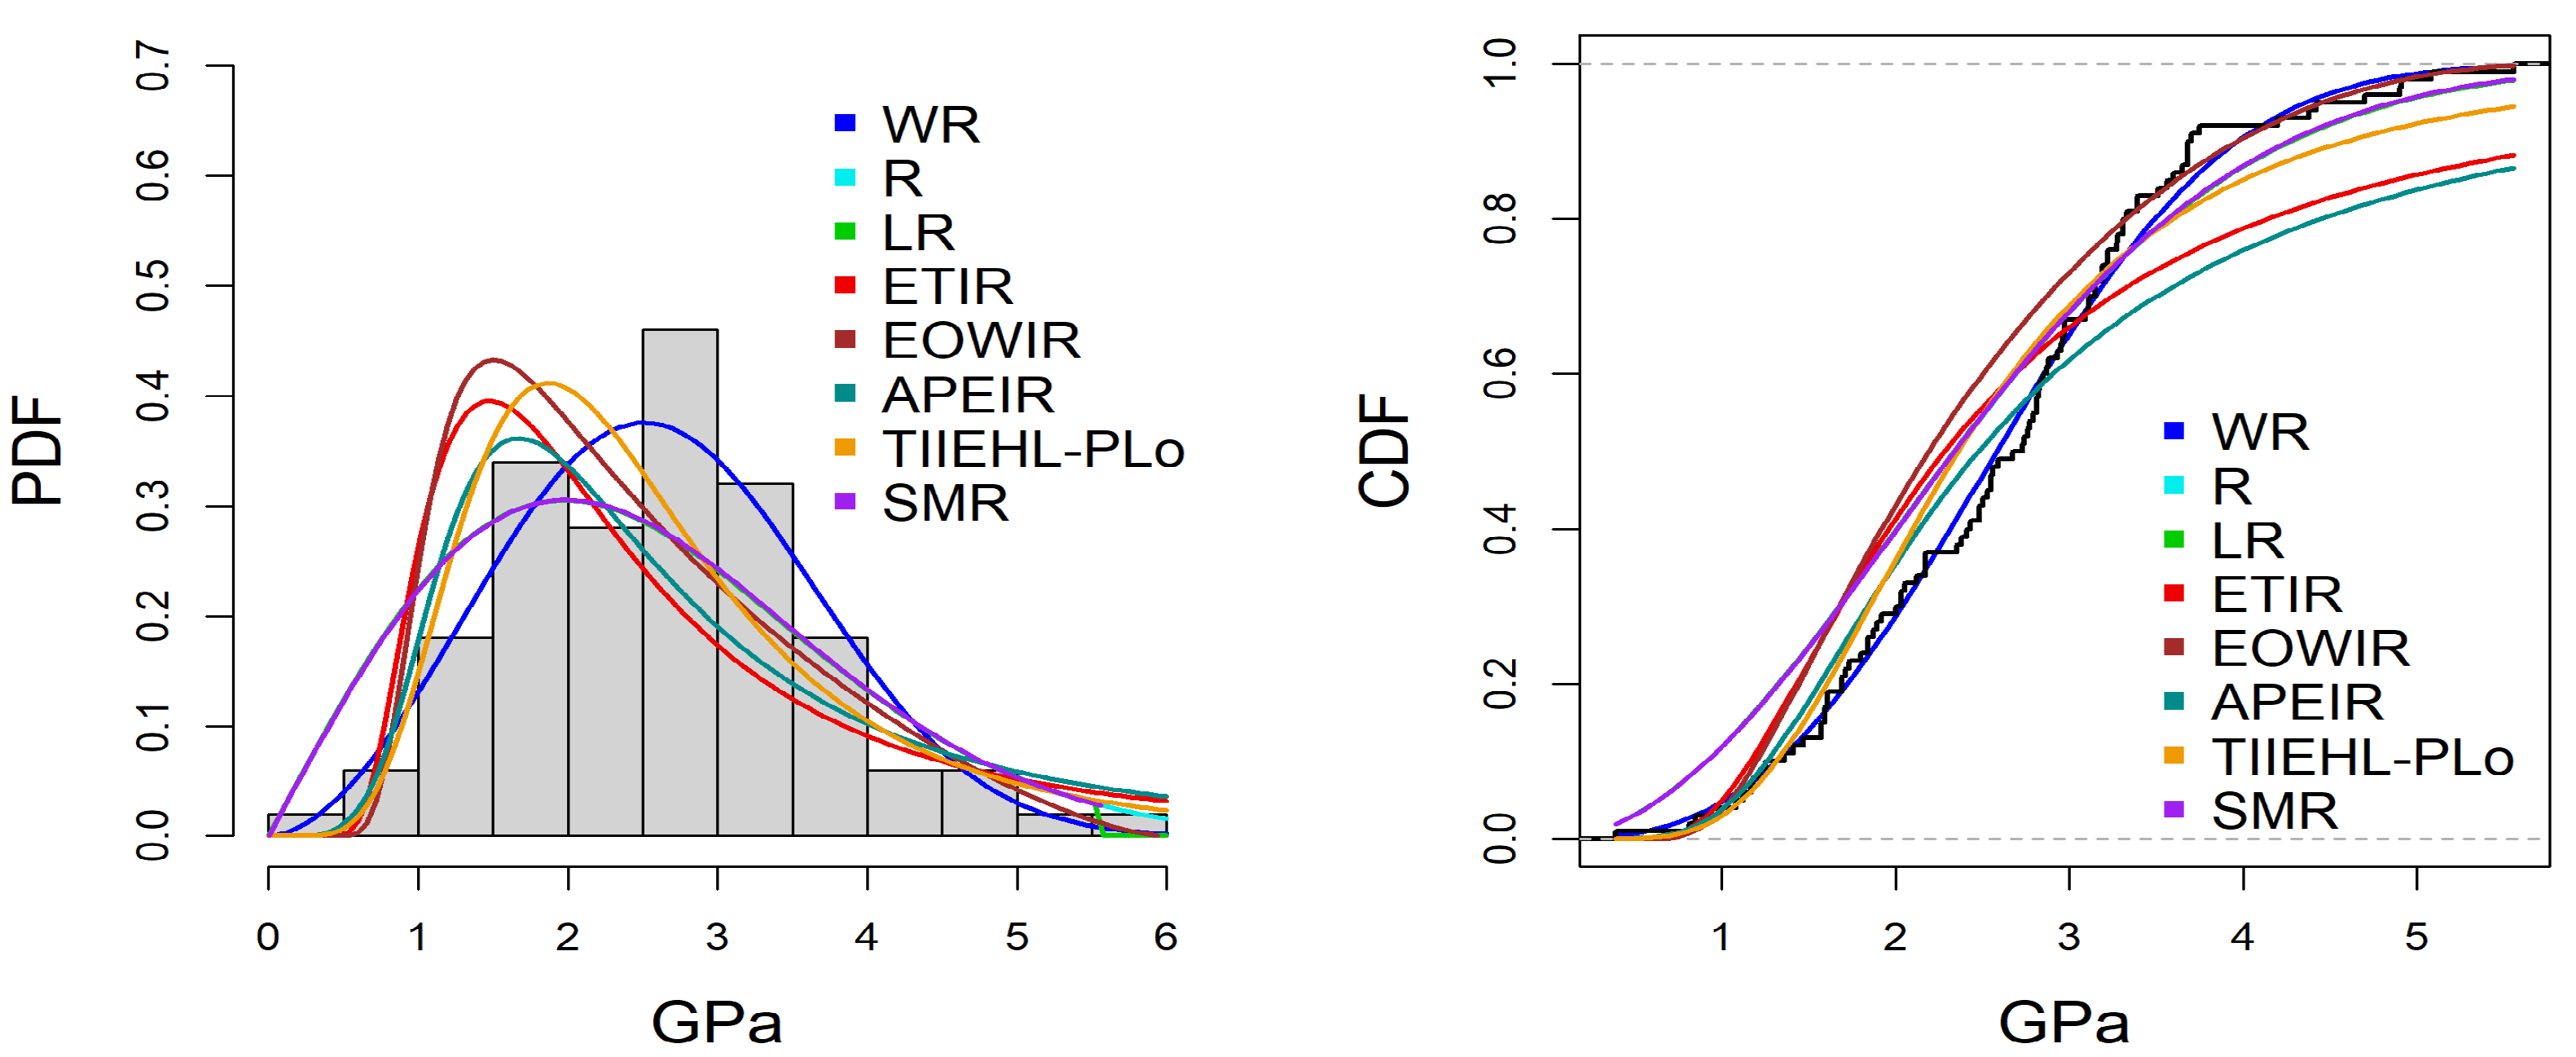
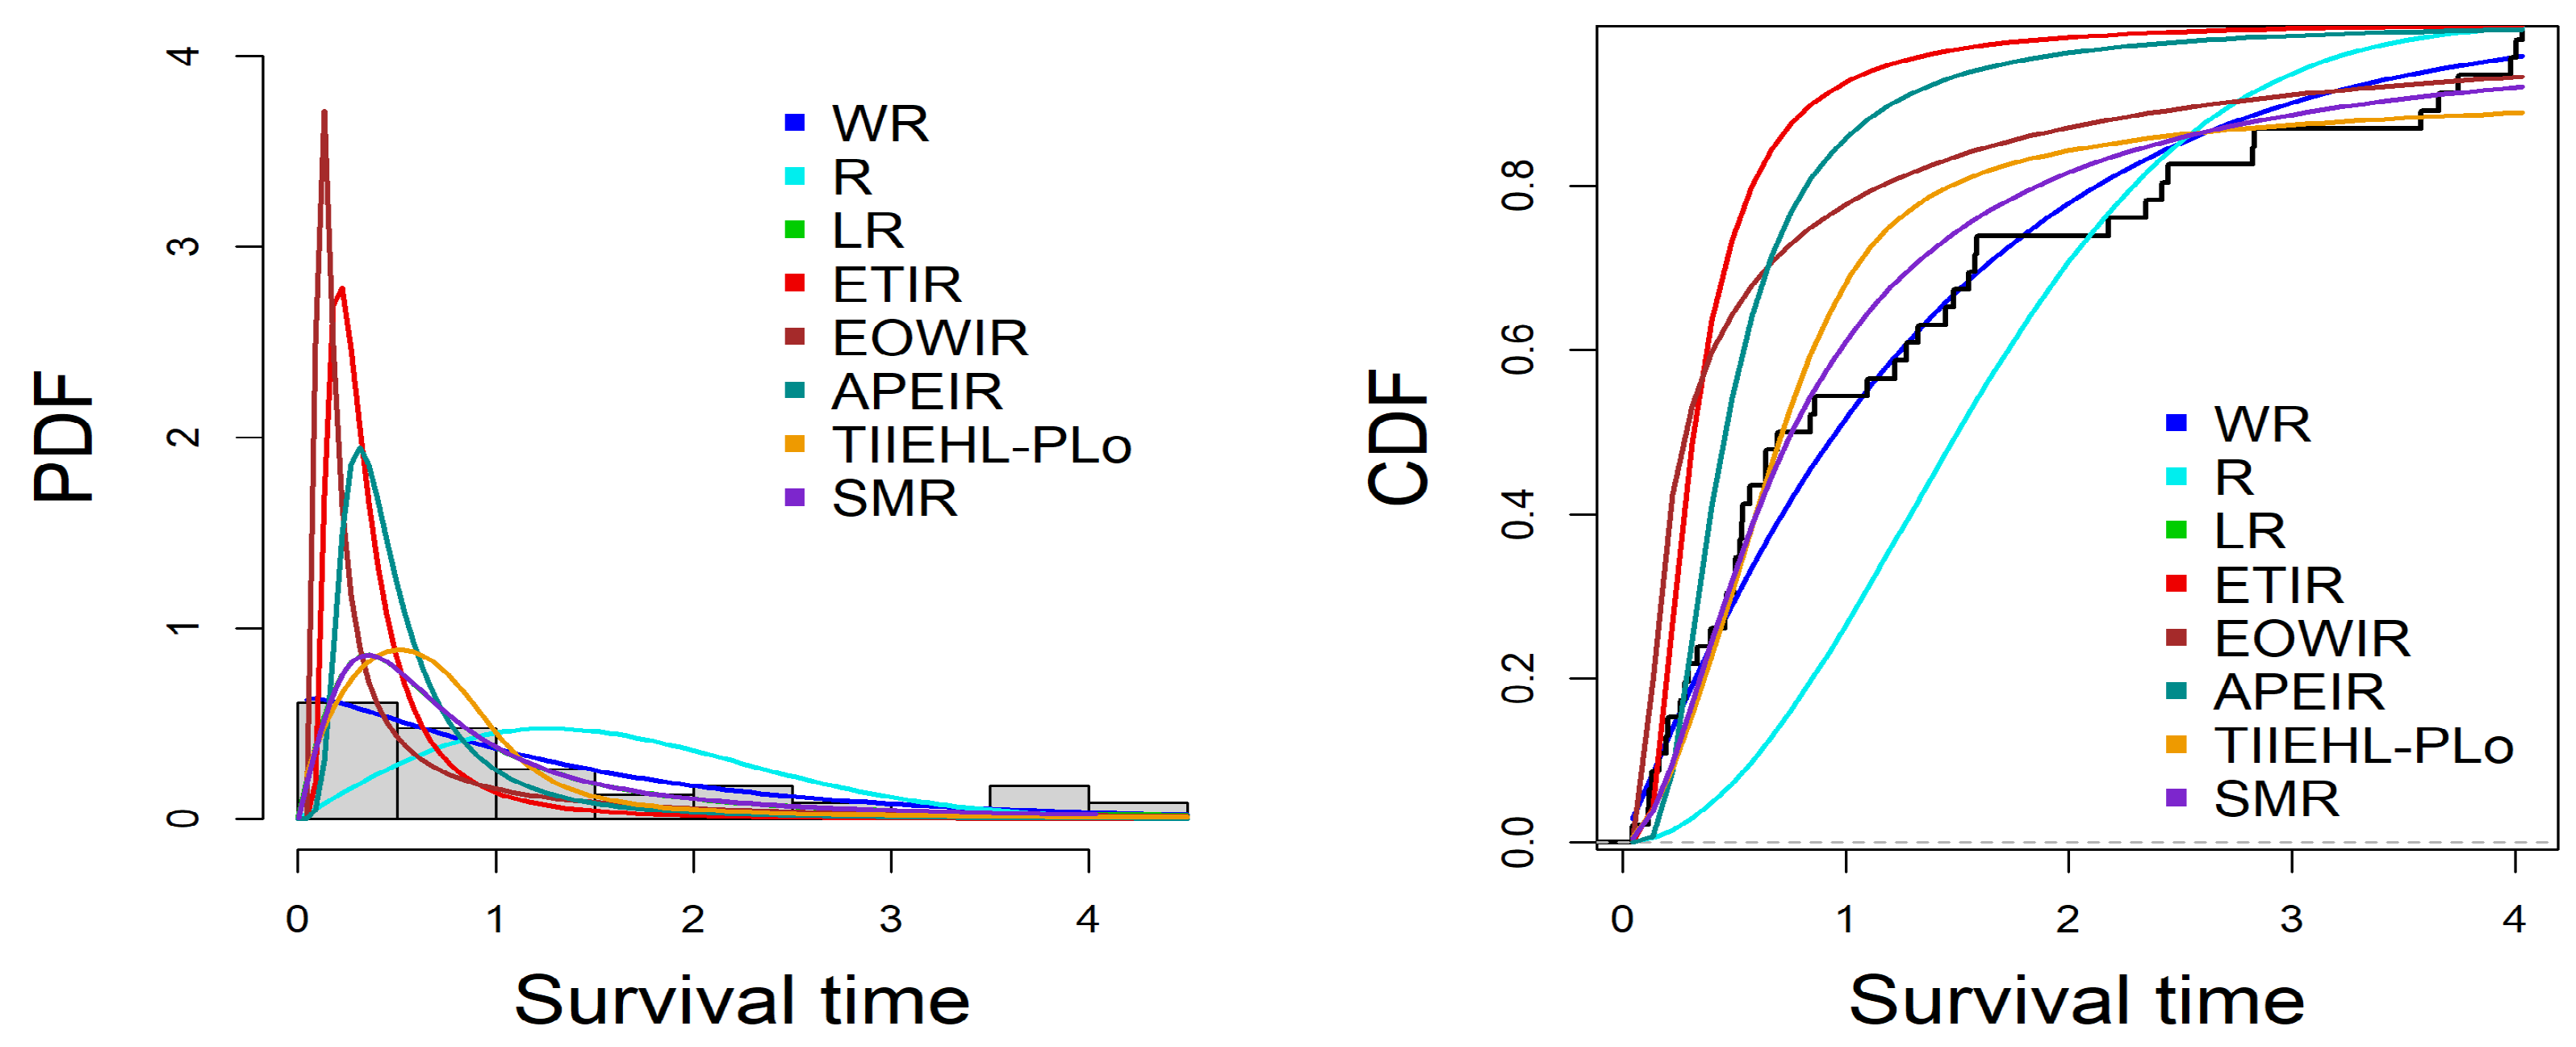
Finally, the PDF along with the CDF in all the datasets are plotted in
Figure 8,
Figure 9 and
Figure 10 which confirms that the WR model fits the data very well, and the inherent skewness is better captured compared to other distributions.
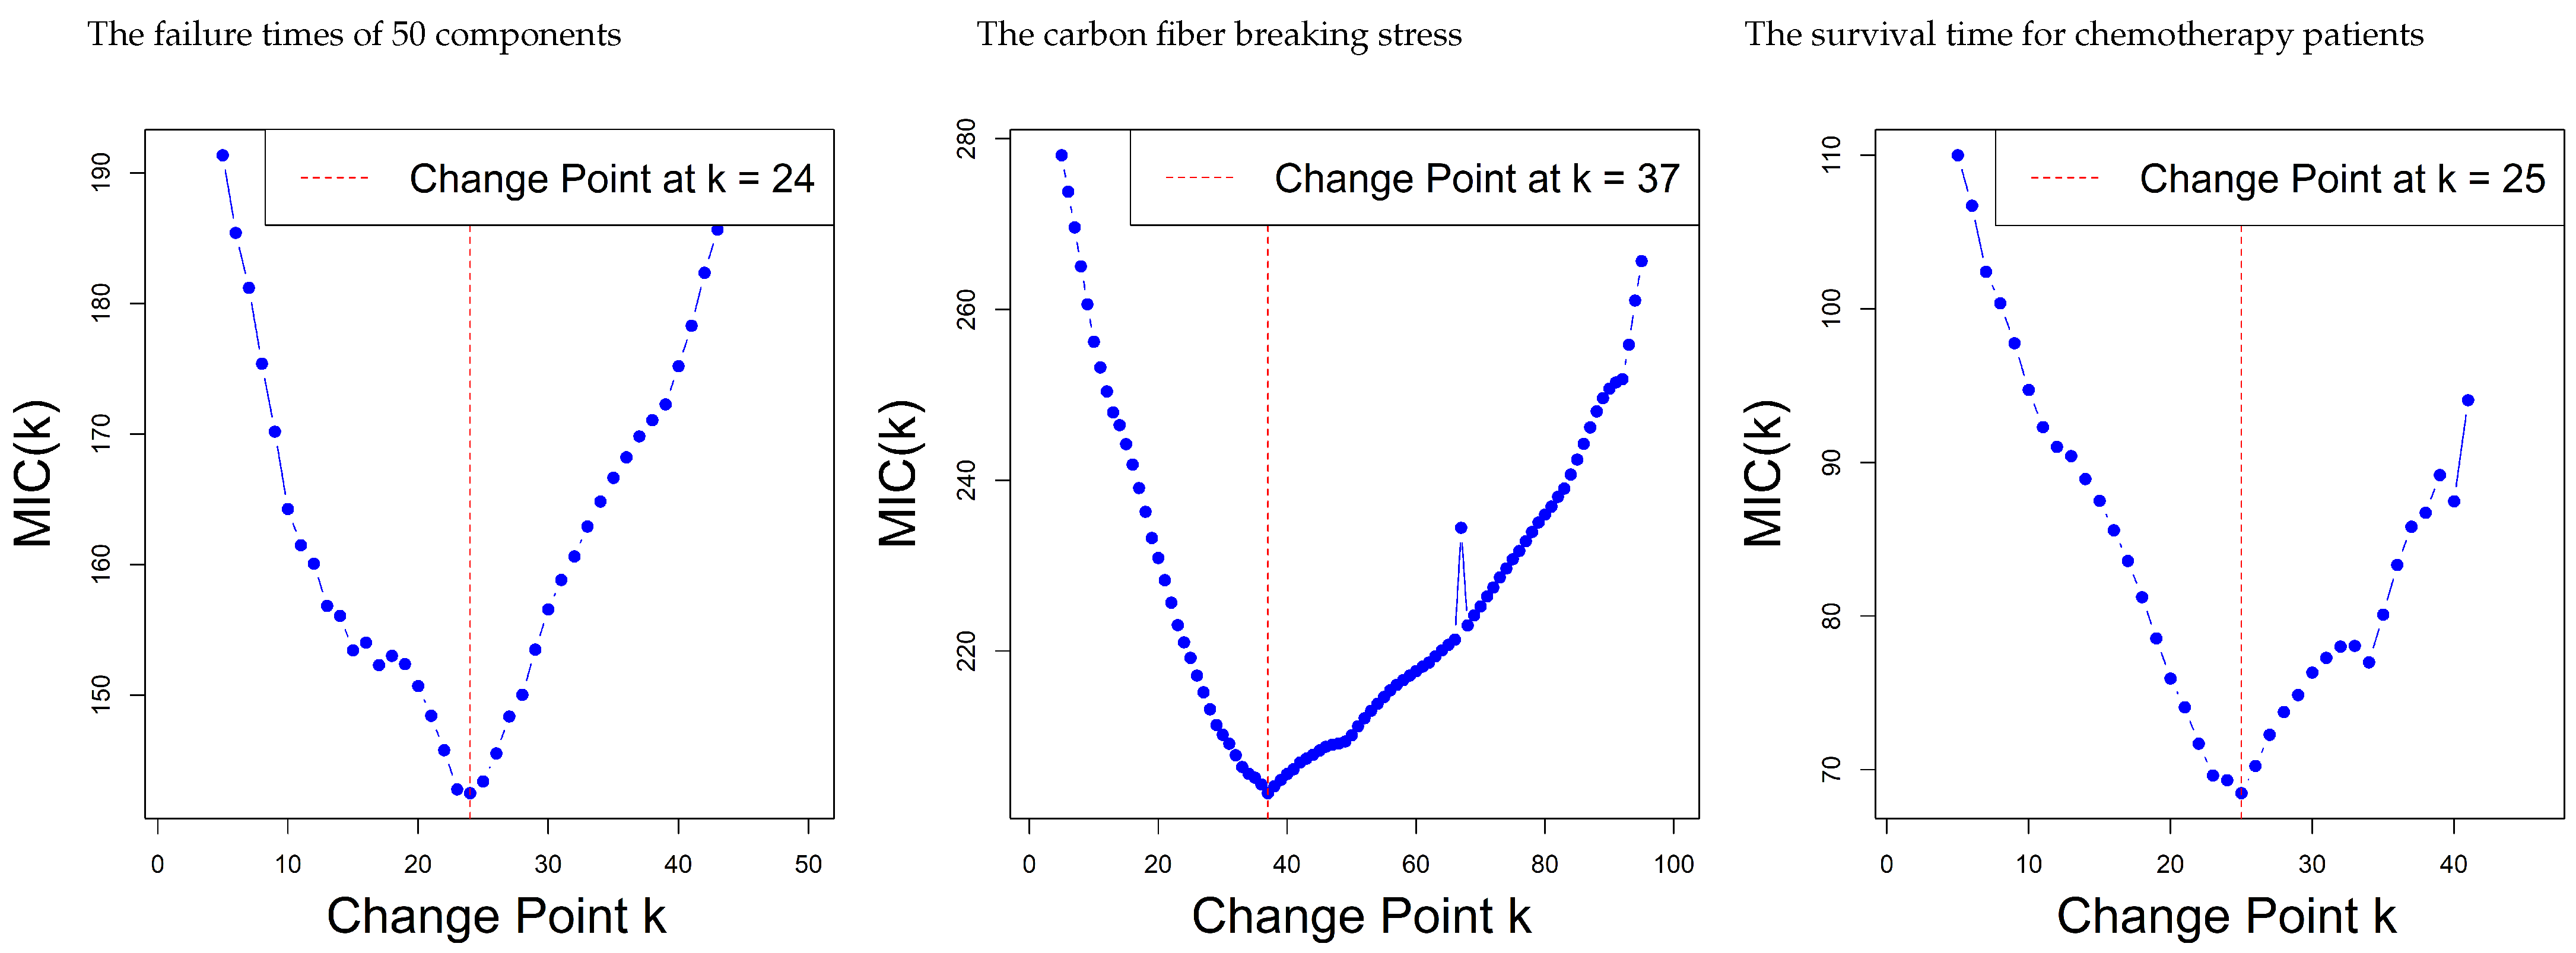
Moreover, the modified information criterion (MIC), introduced in [
30], was also employed to search for potential CP in each of the real datasets using the proposed WR model. The objective of this analysis is to test whether the statistical structure of the data results in changes in a substantial way in some intervals, the fact that in such cases, it would seem more appropriate to fit two separate models (one for the before and another one for the after the CP).
The MIC is calculated as the difference in the log-likelihood of the WR distribution when the data is partitioned at a putative CP
k as follows:
where
is the log-likelihood function computed independently on the two intervals,
are the distribution parameters, and
n is the overall sample size.
Under the null case (no CP), the MIC is computed over the entire dataset as:
It enables the detection of any meaningful transitions in the distributional structure of the data (e.g., changes in skewness, variance, or shape). A significant drop in the MIC value indicates that the three datasets before and after this point are under different statistical rules.
We present the parameter estimates for the WR distribution with and without a CP in
Table 9. The results include the parameter values estimated before the CP, the parameters estimated using the complete data, and MIC criterion indices that assist in identifying the optimal CP in each dataset.
Figure 11 shows the MIC curves at each candidate point
k, including the minimum value related to the estimated CP. Upon examining the results, The first example demonstrates a shift from a symmetric to a less clustered pattern, which would suggest a change in variance or shape; a second set of data shows a clear shift to the right in the skewness of the data from every well-clustered right-skewed distribution to a more smooth-like distribution which may point toward a change in experimental conditions or sample sources. The third set of series displays a change in both the concentration and the frequency of the observed effects that could reflect an external factor, such as a treatment effect or a modified measurement protocol.
These results highlight the adaptability of the proposed WR distribution in response to the underlying evolution of the data behavior, further evidencing its practical importance for real-world modeling situations.

