Article

Mathematical Modeling of the Impact of Desert Dust on Asthma Dynamics

by
Zakaria S. Al Ajlan
and
Moustafa El-Shahed
*
Department of Mathematics, College of Science, Qassim University, P.O. Box 6644, Buraydah 51452, Saudi Arabia
*
Author to whom correspondence should be addressed.
Axioms 2025, 14(8), 639; https://doi.org/10.3390/axioms14080639
Submission received: 14 July 2025 / Revised: 11 August 2025 / Accepted: 14 August 2025 / Published: 16 August 2025

Abstract

This study presents a mathematical model to describe the transmission dynamics of asthma, explicitly accounting for the impact of dust waves and airborne particulate matter in the environment, recognized as key triggers of asthma exacerbations. The model incorporates a single endemic equilibrium point, which is shown to be locally asymptotically stable. To mitigate the burden of asthma, we employed the Pontryagin Maximum Principle within an optimal control framework, incorporating three time-dependent intervention strategies: vaccination, treatment, and avoidance of environmental triggers such as dust exposure. The model was numerically solved using the fourth-order Runge–Kutta method in conjunction with a forward–backward sweep algorithm to investigate the effects of various control combinations on the prevalence of asthma. Additionally, a comprehensive cost-effectiveness analysis was conducted to evaluate the economic viability of each strategy. The results indicate that the combined application of vaccination and treatment is the most cost-effective approach among the strategies analyzed, significantly reducing the number of asthma cases at minimal cost. All simulations and numerical experiments were performed to validate the theoretical findings and quantify the effectiveness of the proposed interventions under realistic environmental conditions driven by dust activity. The model highlights the importance of integrated medical and environmental control policies in mitigating asthma outbreaks, particularly in regions frequently exposed to dust storms.
MSC:
92D30; 92D40; 49K15

1. Introduction

Asthma affects both children and adults alike and is a chronic disease that frequently affects children [1]. Exposure to a complex mixture of pollutants has damaging effects on human health that shorten the human life span. Pollutants in the air are directly or indirectly related to the many serious health issues like asthma, lung cancer and other diseases related to the respiratory system [1,2]. Medical studies have shown that short-term exposure to air pollutants can lead to decreased lung function, which can trigger asthma exacerbations [3,4]. Asthma is a major global problem of mortality and disability, and according to the World Health Organization, approximately 235 million people worldwide currently suffer from asthma [5,6,7]. The economic cost of diseases resulting from exposure to fine particles carried in desert dust, especially P M 10 and P M 2.5 , is very large [5,6,7]. The Qassim region is exposed to desert dust for long periods, which causes many diseases, especially asthma and pneumonia, which causes great pressure on the living institutions in the region [8,9]. In Saudi Arabia, there is a scarcity of research regarding the prevalence of asthma. However, one study conducted in the Riyadh region reported that 11.3 % of the surveyed population had received a physician’s diagnosis of asthma. Despite the many research interests in air quality, there are still many research gaps in the field of determining the negative consequences of desert dust on the health of residents in the Qassim region, such as the need for more accurate and understandable mathematical models, integration of different data sources, and comparison of practical results with theoretical models [10,11,12,13]. Mathematical models play an important role in exploring disease dynamics and producing important information about disease dynamics for control and prevention [14,15,16,17].
Although mathematical modeling for studying the transmission of infectious diseases has been applied to the study of the prevalence of many diseases, there are only a few studies on mathematical modeling of the effect of polluted environments on asthma. Ghosh [18] proposed some nonlinear mathematical models for the transmission of asthma under the influence of pollutants from industry, and the results showed that the number of asthmatics increases due to the increase in air pollutants. Ram and Tripathi also formulated a mathematical model to study the effect of tobacco smoke and pollutants from industry on the prevalence of asthma [19]. Agarwal and Devi [20] investigated the impact of environmental taxes on the survival of biological species affected by pollutants in the environment. They demonstrated that, without the implementation of an environmental tax, the density of these species may face extinction as the rate of pollutant emissions increases. Alejo and Quesada presented a mathematical model inspired by the statistical analysis of emergency department visits of people with asthma [21]. Kim et al. proposed an analytical model of asthma development focusing on the complex network of interactions between certain cells and specific molecules [22]. Lee [23] formulated a mathematical model of the response of macrophages to respiratory viral infections in normal and asthmatic conditions. Recently, Shah [24] proposed a mathematical model of asthma transmission in a population of variable size under the influence of indoor smoke and outdoor air pollution. Jan [25] generalized the mathematical model in [19] and studied the existence and uniqueness of the solution of the new model through fixed-point theories. Adeyemo [26] also proposed a new mathematical model of asthma by incorporating a class for undetected sufferers. In the Qassim region of Saudi Arabia, dust storms affect health in general and the spread of asthma in particular. The present study is motivated by the rising prevalence of asthma in arid regions such as Qassim, Saudi Arabia, where environmental triggers like dust storms are common. However, the modeling framework and analytical methods developed here are not restricted to a specific location. Instead, they are formulated in a generalizable way, allowing for adaptation to other geographical contexts with similar epidemiological and environmental conditions. This study will formulate and analyze a mathematical model to assess the impact of desert dust storms on the spread of asthma. The remainder of this paper is structured as follows: In Section 2, we formulate the mathematical model for asthma. Section 3 presents the derivation of the unique endemic equilibrium point and investigates its local stability. In Section 4, we develop the optimal control problem. Section 5 provides a numerical simulation of the optimal control problem under seven different control strategies. Finally, Section 6 is devoted to the cost-effectiveness analysis of the proposed control strategies.

2. Formulation of the Asthma Transmission Model

The development of the asthma transmission model in system (1) is based on the following assumptions:
  • The population is divided into four epidemiological classes: susceptible individuals without protection awareness ( S 1 ), susceptible individuals with protection awareness ( S 2 ), exposed individuals (E), and individuals with asthma (asthmatic) individuals (A).
  • The recruitment of new individuals into the population occurs at a constant rate Λ , and all newborns enter the S 1 compartment. A proportion of the unaware susceptible individuals ( S 1 ) acquire awareness of environmental triggers (e.g., desert dust) through education or public health campaigns at rate α , thereby transitioning to the S 2 class.
  • The transmission of asthma-related sensitization occurs due to exposure to desert dust particles in the environment. Following [27], the transmission is modulated by a multiplicative factor ( 1 + m C ( t ) ) , where C ( t ) denotes the concentration of desert dust in the human population, and m is the modulation coefficient that quantifies the enhancing effect of desert dust on the transmission rate. A fraction ϵ of S 2 is protected from transmission due to behavioral awareness or preventive measures, reducing their risk of exposure.
  • Exposed individuals (E) develop asthma at a rate proportional to both the dust exposure P ( t ) and a progression parameter σ , and they exit the class via natural death μ or disease progression. Individuals in the asthmatic class (A) experience disease-induced mortality at a rate denoted by δ .
  • The concentration of desert dust in the population C ( t ) increases due to transfer from the environment at rate ρ and decreases due to natural clearance at rate θ . The environmental dust concentration P ( t ) increases at a constant input rate Q due to seasonal sandstorms and decreases at a depletion rate ν .
Taking into account the above assumptions and the insights provided by previous research [18,19,20,21,22,23,24,25,26,27], the mathematical model is formulated as follows:
d S 1 ( t ) d t = Λ β 1 + m C ( t ) S 1 ( t ) P ( t ) α S 1 ( t ) μ S 1 ( t ) , d S 2 ( t ) d t = α S 1 ( t ) ( 1 ϵ ) β ( 1 + m C ( t ) ) S 2 ( t ) P ( t ) μ S 2 ( t ) , d E ( t ) d t = β ( 1 + m C ( t ) ) S 1 ( t ) P ( t ) + ( 1 ϵ ) β ( 1 + m C ( t ) ) S 2 ( t ) P ( t ) σ E ( t ) P ( t ) μ E ( t ) , d A ( t ) d t = σ E ( t ) P ( t ) ( δ + μ ) A ( t ) , d C ( t ) d t = ρ P ( t ) θ C ( t ) , d P ( t ) d t = Q ν P ( t ) .
Table 1 presents the values of the parameters used in the asthma model (1). Some of these values were selected or adjusted to ensure consistency with the model’s structure and the simulation conditions adopted in this study, while others were adapted from relevant literature and previous studies [18,27,28].
Lemma 1.
Solutions to the asthma model (1) with initial conditions in R + 6 remaining non-negative.
Proof. 
Since all the right-hand sides of system (1) are continuous and locally Lipschitz in the state variables, it follows from standard theory of differential equations that the system admits a unique classical solution on some maximal interval. We show that this solution remains non-negative. From the first equation of the susceptible class in the asthma system (1), we have
d S 1 ( t ) d t + α + μ + β ( 1 + m C ( t ) ) P ( t ) S 1 ( t ) = Λ .
The corresponding solution is given by
S 1 ( t ) = e ( 0 t ( K 1 ( x ) d x ) 0 t Λ e 0 y ( K 1 ( u ) ) d u d y + S 1 ( 0 ) 0 ,
where K 1 ( x ) = α + μ + β ( 1 + m C ( t ) ) P ( t ) .
Similarly:
S 2 ( t ) = e ( 0 t ( K 2 ( x ) d x ) 0 t Λ e 0 y K 2 ( u ) d u d y + S 2 ( 0 ) 0 E ( t ) = e ( 0 t ( K 3 ( x ) d x ) 0 t β ( 1 + m C ( y ) ) ( S 1 ( t ) + ( 1 ϵ ) S 2 ( t ) ) P ( y ) e 0 y K 3 ( u ) d u d y + E ( 0 ) 0 A ( t ) = e ( δ + μ ) t 0 t σ E ( y ) P ( y ) e ( δ + μ ) y d y + A ( 0 ) 0 C ( t ) = e θ t 0 t ρ P ( y ) e θ y d y + C ( 0 ) 0 P ( t ) = e ν t 0 t Q e ν y d y + P ( 0 ) 0 ,
where K 2 ( x ) = μ + ( 1 ϵ ) β ( 1 + m C ( t ) ) P ( t ) , K 3 ( x ) = μ + σ P ( t ) . □
The system (1), together with non-negative initial conditions in R + 6 , constitutes a well-posed Cauchy problem.

3. Analysis of the Model

3.1. The Asthma Endemic Point

For the asthma system (1), there exists a unique equilibrium point denoted by F * = ( S 1 * , S 2 * , E * , A * , C * , P * ) , where
S 1 * = Λ θ ν 2 β Q w 1 + θ ν 2 w 2 S 2 * = Λ α θ 2 ν 4 ( β Q w 1 + θ ν 2 w 2 ) ( w 3 β Q w 1 + μ θ ν 2 ) E * = Λ β Q ν w 1 ( β Q w 1 w 3 + θ ν 2 ( α w 3 + μ ) ) w 4 ( β Q w 1 + θ ν 2 w 2 ) ( β Q w 1 w 3 + μ θ ν 2 ) A * = Λ σ β Q 2 w 1 ( β Q w 1 w 3 + θ ν 2 ( α w 3 + μ ) ) w 5 w 4 ( β Q w 1 + θ ν 2 w 2 ) ( β Q w 1 w 3 + μ θ ν 2 ) C * = Q ρ θ ν P * = Q ν ,
where w 1 = θ ν + m Q ρ , w 2 = α + μ , w 3 = 1 ϵ , w 4 = σ Q + μ ν and w 5 = δ + μ .
The current model does not admit a disease-free equilibrium; rather, it exhibits a unique endemic equilibrium. Consequently, the standard approach of computing the basic reproduction number R 0 , which is based on the disease-free equilibrium point and the next-generation matrix method, is not applicable here. A similar situation has been reported in other asthma models in the literature [18,19] where a unique endemic equilibrium exists.

3.2. Local Stability of the Asthma Model

In this section, we investigate the local asymptotic stability (LAS) of the asthma system (1).
Theorem 1.
The endemic equilibrium point F * of the asthma model is locally asymptotically stable (LAS).
Proof. 
To analyze the local stability of F * , we compute the Jacobian matrix of the system evaluated at the endemic equilibrium point. The Jacobian is given by
J ( F * ) = j 11 0 0 0 j 15 j 16 j 21 j 22 0 0 j 25 j 26 j 31 j 32 j 33 0 j 35 j 36 0 0 j 43 j 44 0 0 0 0 0 0 j 55 j 56 0 0 0 0 0 j 66 .
where j 11 = ( β ( 1 + m C * ) P * + α + μ ) , j 15 = β m S 1 * P * , j 16 = β ( 1 + m C * ) S 1 * , where j 21 = α , j 22 = ( ( 1 ϵ ) β ( 1 + m C * ) P * + μ ) , j 25 = β m ( 1 ϵ ) S 2 * P * , where j 26 = ( 1 ϵ ) β ( 1 + m C * ) S 2 * , j 31 = β ( 1 + m C * ) P * , j 32 = ( 1 ϵ ) β ( 1 + m C * ) P * , where j 33 = ( σ P * + μ ) , j 35 = β m P * ( S 1 * + ( 1 ϵ ) S 2 * ) , j 36 = β ( 1 + m C * ) ( S 1 * + ( 1 ϵ ) S 2 * ) , where j 43 = σ P * , j 44 = ( μ + δ ) , j 55 = θ , j 56 = ρ , j 66 = ν .
The Jacobian matrix J ( F * ) has a special block structure, which significantly simplifies the computation of its eigenvalues. Consequently, the eigenvalues of J ( F * ) can be obtained explicitly without expanding the full determinant:
λ 1 = ν , λ 2 = θ , λ 3 = ( β ( 1 + m C * ) P * + α + μ ) , λ 4 = ( ( 1 ϵ ) β ( 1 + m C * ) P * + μ ) , λ 5 = ( σ P * + μ ) , λ 6 = ( μ + δ ) .
Since all eigenvalues have negative real parts, it follows that the endemic equilibrium F * is locally asymptotically stable. □

4. Optimal Control Application

In this study, we investigate the effect of three time-dependent control functions within the asthma model.
  • u 1 ( t ) : represents the vaccination of susceptible individuals.
  • u 2 ( t ) : represents the treatment of individuals in the asthmatic class.
  • u 3 ( t ) : represents the avoidance of environmental triggers.
The following equations describe the corresponding controlled asthma model.
d S 1 ( t ) d t = Λ β ( 1 + m C ( t ) ) S 1 ( t ) P ( t ) α S 1 ( t ) μ S 1 ( t ) u 1 ( t ) S 1 ( t ) , d S 2 ( t ) d t = α S 1 ( t ) ( 1 ϵ ) β ( 1 + m C ( t ) ) S 2 ( t ) P ( t ) μ S 2 ( t ) u 1 ( t ) S 2 ( t ) , d E ( t ) d t = β ( 1 + m C ( t ) ) S 1 ( t ) P ( t ) + ( 1 ϵ ) β ( 1 + m C ( t ) ) S 2 ( t ) P ( t ) σ E ( t ) P ( t ) μ E ( t ) , d A ( t ) d t = σ E ( t ) P ( t ) ( δ + μ ) A ( t ) u 2 ( t ) A ( t ) , d C ( t ) d t = ρ P ( t ) θ C ( t ) u 3 ( t ) C ( t ) , d P ( t ) d t = Q ν P ( t ) .
For the controlled system described by Equation (2), the objective functional to be minimized is defined as follows:
J = 0 T A 1 S 1 ( t ) + A 2 S 2 ( t ) + A 3 A ( t ) + A 4 C ( t ) + 1 2 ( B 1 u 1 2 + B 2 u 2 2 + B 3 u 3 2 ) d t .
Here, T denotes the final time horizon, and A 1 , A 2 , A 3 , and A 4 are weighting coefficients associated with the susceptible population without protection awareness, the susceptible population with protection awareness, the asthmatic class, and the concentration of desert dust in the population, respectively. Similarly, B 1 , B 2 , and B 3 are the weight constants corresponding to the control efforts of vaccination, treatment, and avoidance of environmental triggers, respectively.
The following expression gives the corresponding Lagrangian
L ( S 1 , S 2 , A , C , u 1 , u 2 , u 3 ) = A 1 S 1 ( t ) + A 2 S 2 ( t ) + A 3 A ( t ) + A 4 C ( t ) + 1 2 ( B 1 u 1 2 + B 2 u 2 2 + B 3 u 3 2 ) ) .
The Lagrangian defined above plays a central role in the formulation of the optimal control problem. It represents the integrand of the objective functional and captures the competing goals of minimizing the disease burden and the costs associated with control measures.
Specifically, the terms A 1 S 1 ( t ) + A 2 S 2 ( t ) + A 3 A ( t ) + A 4 C ( t ) account for the epidemiological impact of the unprotected and protected susceptible populations, the infected individuals, and the concentration of desert dust, respectively. Meanwhile, the quadratic control terms 1 2 ( B 1 u 1 2 + B 2 u 2 2 + B 3 u 3 2 ) are introduced to reflect the economic cost of implementing the control interventions. The quadratic form is commonly used in optimal control theory as it ensures convexity and provides a natural penalization for extreme control efforts.
This structure of the Lagrangian facilitates the application of Pontryagin’s Maximum Principle and leads to analytically tractable necessary conditions for optimality, as discussed in the subsequent section.

The Hamiltonian and Optimality System

We applied Pontryagin’s Maximum Principle [29,30] to derive the necessary conditions that an optimal control must satisfy. This principle transforms the optimal control problem defined by system (2) and the associated Lagrangian into the problem of minimizing a pointwise Hamiltonian function H with respect to the control variables u 1 ( t ) , u 2 ( t ) , and u 3 ( t ) , as follows:
H = L + λ 1 d S 1 ( t ) d t + λ 2 d S 2 ( t ) d t + λ 3 d E ( t ) d t + λ 4 d A ( t ) d t + λ 5 d C ( t ) d t + λ 6 d P ( t ) d t = A 1 S 1 ( t ) + A 2 S 2 ( t ) + A 3 A ( t ) + A 4 C ( t ) + 1 2 B 1 u 1 2 + B 2 u 2 2 + B 3 u 3 2 + λ 1 ( t ) Λ β ( 1 + m C ( t ) ) S 1 ( t ) P ( t ) α S 1 ( t ) μ S 1 ( t ) u 1 ( t ) S 1 ( t ) + λ 2 ( t ) α S 1 ( t ) ( 1 ϵ ) β ( 1 + m C ( t ) ) S 2 ( t ) P ( t ) μ S 2 ( t ) u 1 ( t ) S 2 ( t ) + λ 3 ( t ) β ( 1 + m C ( t ) ) S 1 ( t ) P ( t ) + ( 1 ϵ ) β ( 1 + m C ( t ) ) S 2 ( t ) P ( t ) σ E ( t ) P ( t ) μ E ( t ) + λ 4 ( t ) σ E ( t ) P ( t ) ( δ + μ ) A ( t ) u 2 ( t ) A ( t ) + λ 5 ( t ) ρ P ( t ) θ C ( t ) u 3 ( t ) C ( t ) + λ 6 ( t ) Q ν P ( t ) ,
where λ i , for i = 1 , 2 , 3 , 4 , 5 , 6 , are the adjoint variables corresponding to the state variables S 1 , S 2 , E, A, C, and P, respectively.
The following result establishes the adjoint system, which is formulated as follows:
d λ 1 d t = H S 1 , d λ 2 d t = H S 2 , d λ 3 d t = H E , d λ 4 d t = H A , d λ 5 d t = H C , d λ 6 d t = H P .
These adjoint variables are to be determined by appropriately applying Pontryagin’s maximum principle as follows:
λ 1 t = A 1 q ( λ 1 λ 3 ) + ( α + μ + u 1 ( t ) ) λ 1 α λ 2 , λ 2 t = A 1 + ( 1 ϵ ) q P ( t ) ( λ 2 λ 3 ) + ( μ + u 1 ( t ) ) λ 2 , λ 3 t = σ P ( t ) ( λ 3 λ 4 ) + μ λ 3 , λ 4 t = A 3 + ( δ + μ + u 2 ( t ) ) λ 4 , λ 5 t = A 4 + β m S 1 ( t ) P ( t ) ( λ 1 λ 3 ) + ( 1 ϵ ) β m S 2 ( t ) P ( T ) ( λ 2 λ 3 ) + ( θ + u 3 ( t ) ) λ 5 , λ 6 t = β ( 1 + m C ( t ) ) S 1 ( t ) ( λ 1 λ 3 ) + ( 1 ϵ ) q S 2 ( t ) ( λ 2 λ 3 ) + σ E ( t ) ( λ 3 λ 4 ) ρ λ 5 + ν λ 6 .
The optimal controls are derived based on the necessary optimality conditions, which require that
H u 1 = 0 , H u 2 = 0 , H u 3 = 0 .
The resulting expressions for the optimal controls are given by
u 1 * ( t ) = min 1 , max 0 , S 1 λ 1 + S 2 λ 2 B 1 , u 2 * ( t ) = min 1 , max 0 , 1 B 2 λ 4 A , u 3 * ( t ) = min 1 , max 0 , C λ 5 B 3 .
The optimality system is composed of the state equations (the optimal control system), the corresponding adjoint equations, and the characterized optimal controls, along with the specified initial and transversality conditions λ i ( T ) = 0 , i = 1 , 2 , 3 , 4 , 5 , 6 .

5. Numerical Simulation

In this section, we employ parameter values adapted from previous studies, as presented in Table 1. The model incorporates three control variables: vaccination, treatment, and the avoidance of environmental triggers, denoted by u 1 , u 2 , and u 3 , respectively. To assess the relative effectiveness of these control measures, we consider seven distinct strategies, categorized into three groups: single-control, dual-control, and full-control strategies, as outlined below.
  • Strategy 1: Vaccination only ( u 1 0 , u 2 = 0 , u 3 = 0 ) .
  • Strategy 2: Treatment only ( u 1 = 0 , u 2 0 , u 3 = 0 ) .
  • Strategy 3: Avoidance of environmental triggers only ( u 1 = 0 , u 2 = 0 , u 3 0 ) .
  • Strategy 4: Treatment and avoidance of environmental triggers ( u 1 = 0 , u 2 0 , u 3 0 ) .
  • Strategy 5: Vaccination and avoidance of environmental triggers ( u 1 0 , u 2 = 0 , u 3 0 ) .
  • Strategy 6: Vaccination and treatment ( u 1 0 , u 2 0 , u 3 = 0 ) .
  • Strategy 7: All controls ( u 1 0 , u 2 0 , u 3 0 ) .
The efficiency index ( E . I . ) is computed using the formula
E . I . = 1 Z c Z 0 × 100 ,
where Z c and Z 0 represent the cumulative number of infected individuals under control and in the absence of control, respectively. The optimal strategy is defined as the one that yields the highest efficiency index [31,32].
In this analysis, we evaluate the cumulative number of individuals in the asthmatic class over the time interval [ 0 , 50 ] . This cumulative value is
Z = 0 50 A ( t ) d t ,
where A ( t ) denotes the number of individuals in the asthmatic compartment at time t [31,32]. The computed values of Z c and the corresponding efficiency indices for all seven strategies are presented in Table 2.
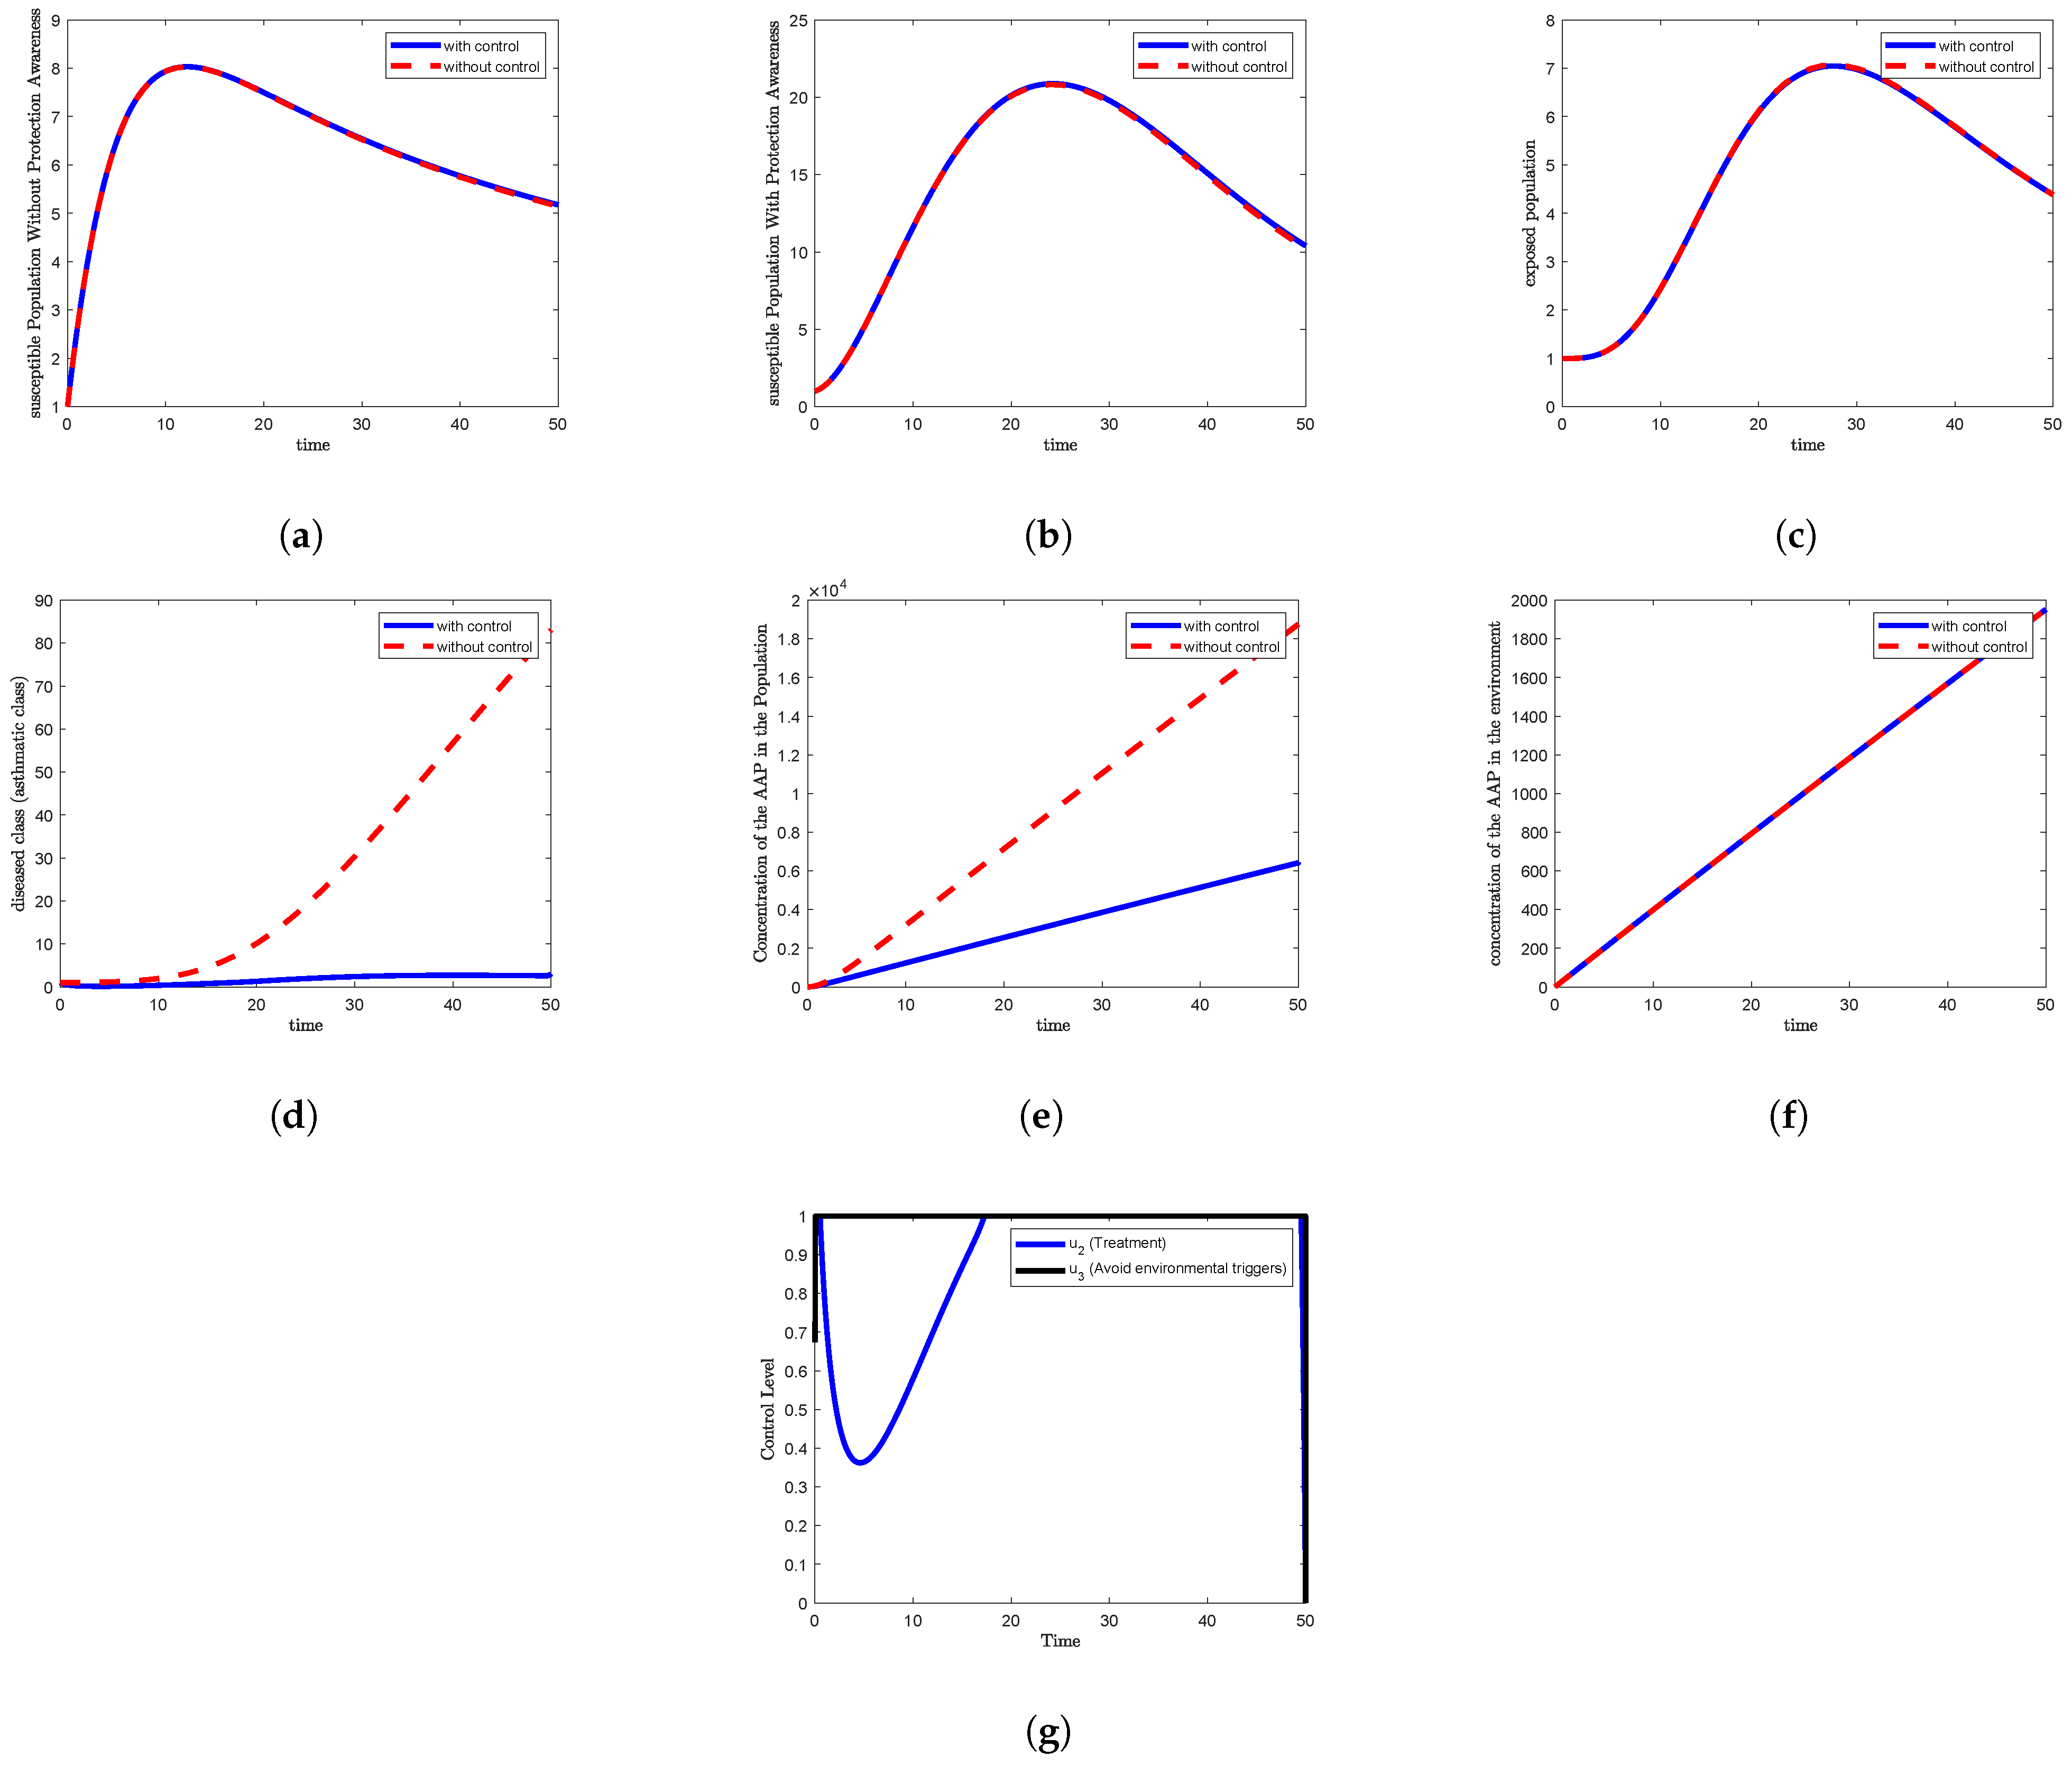
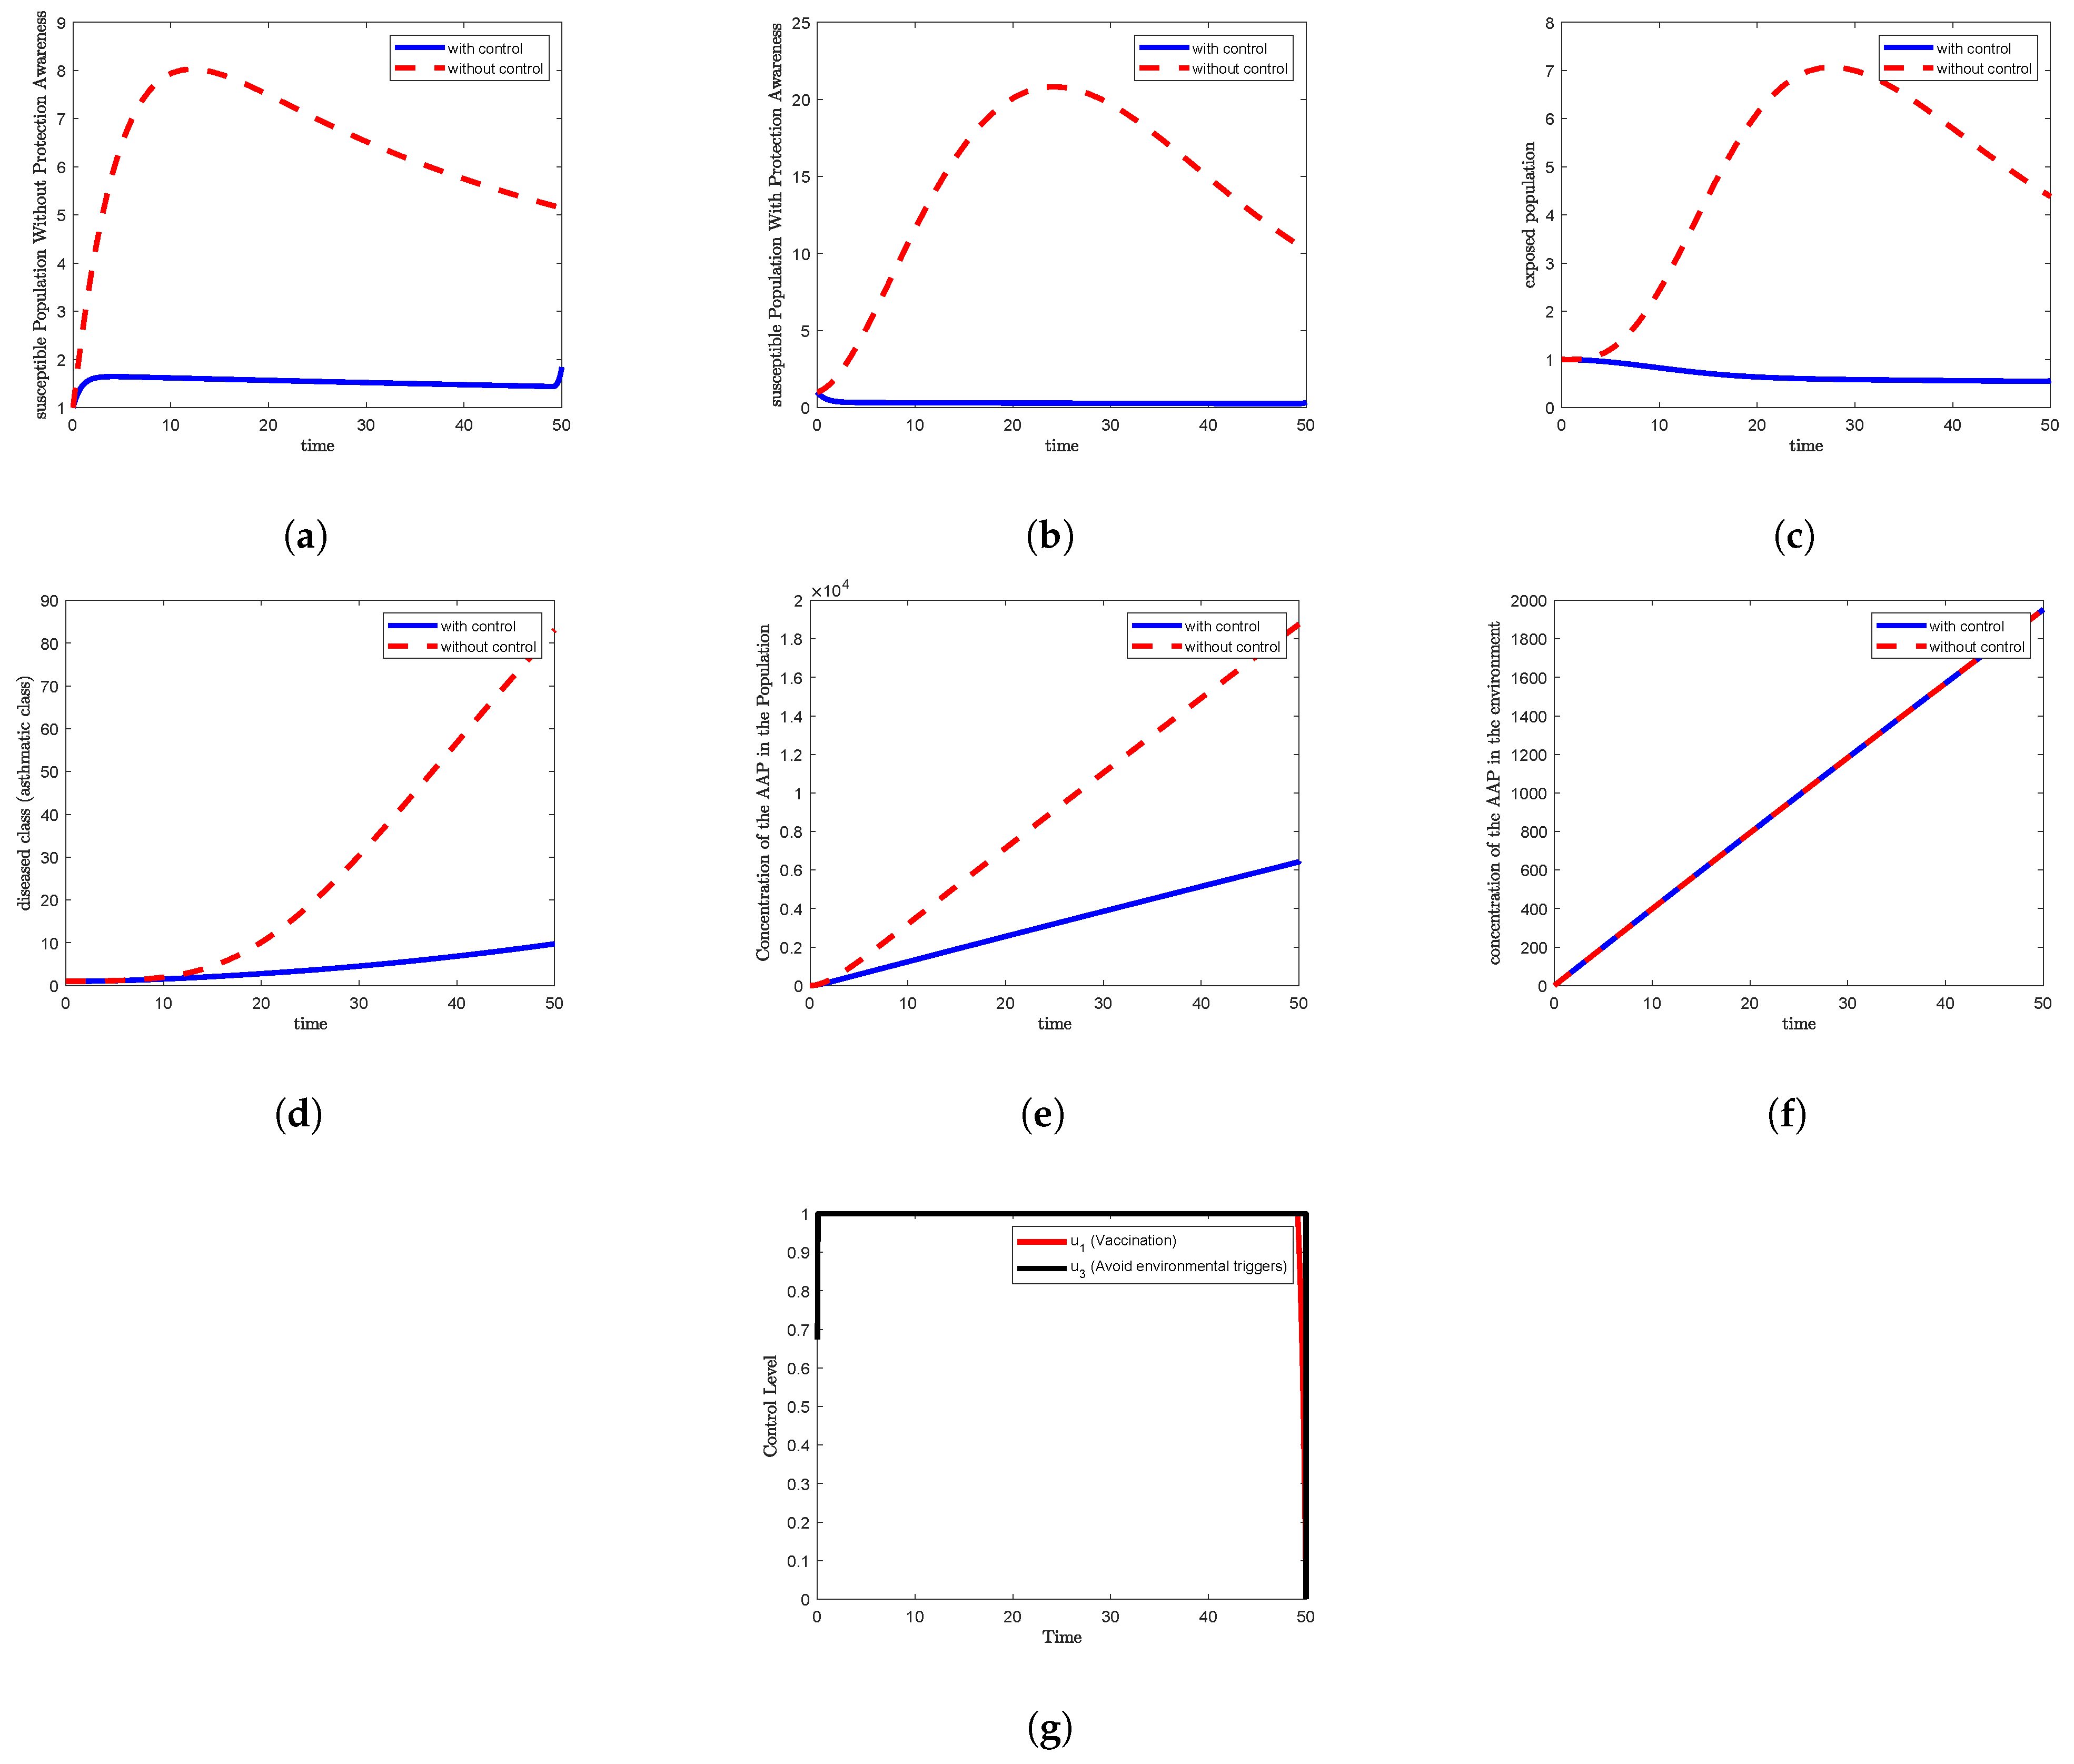
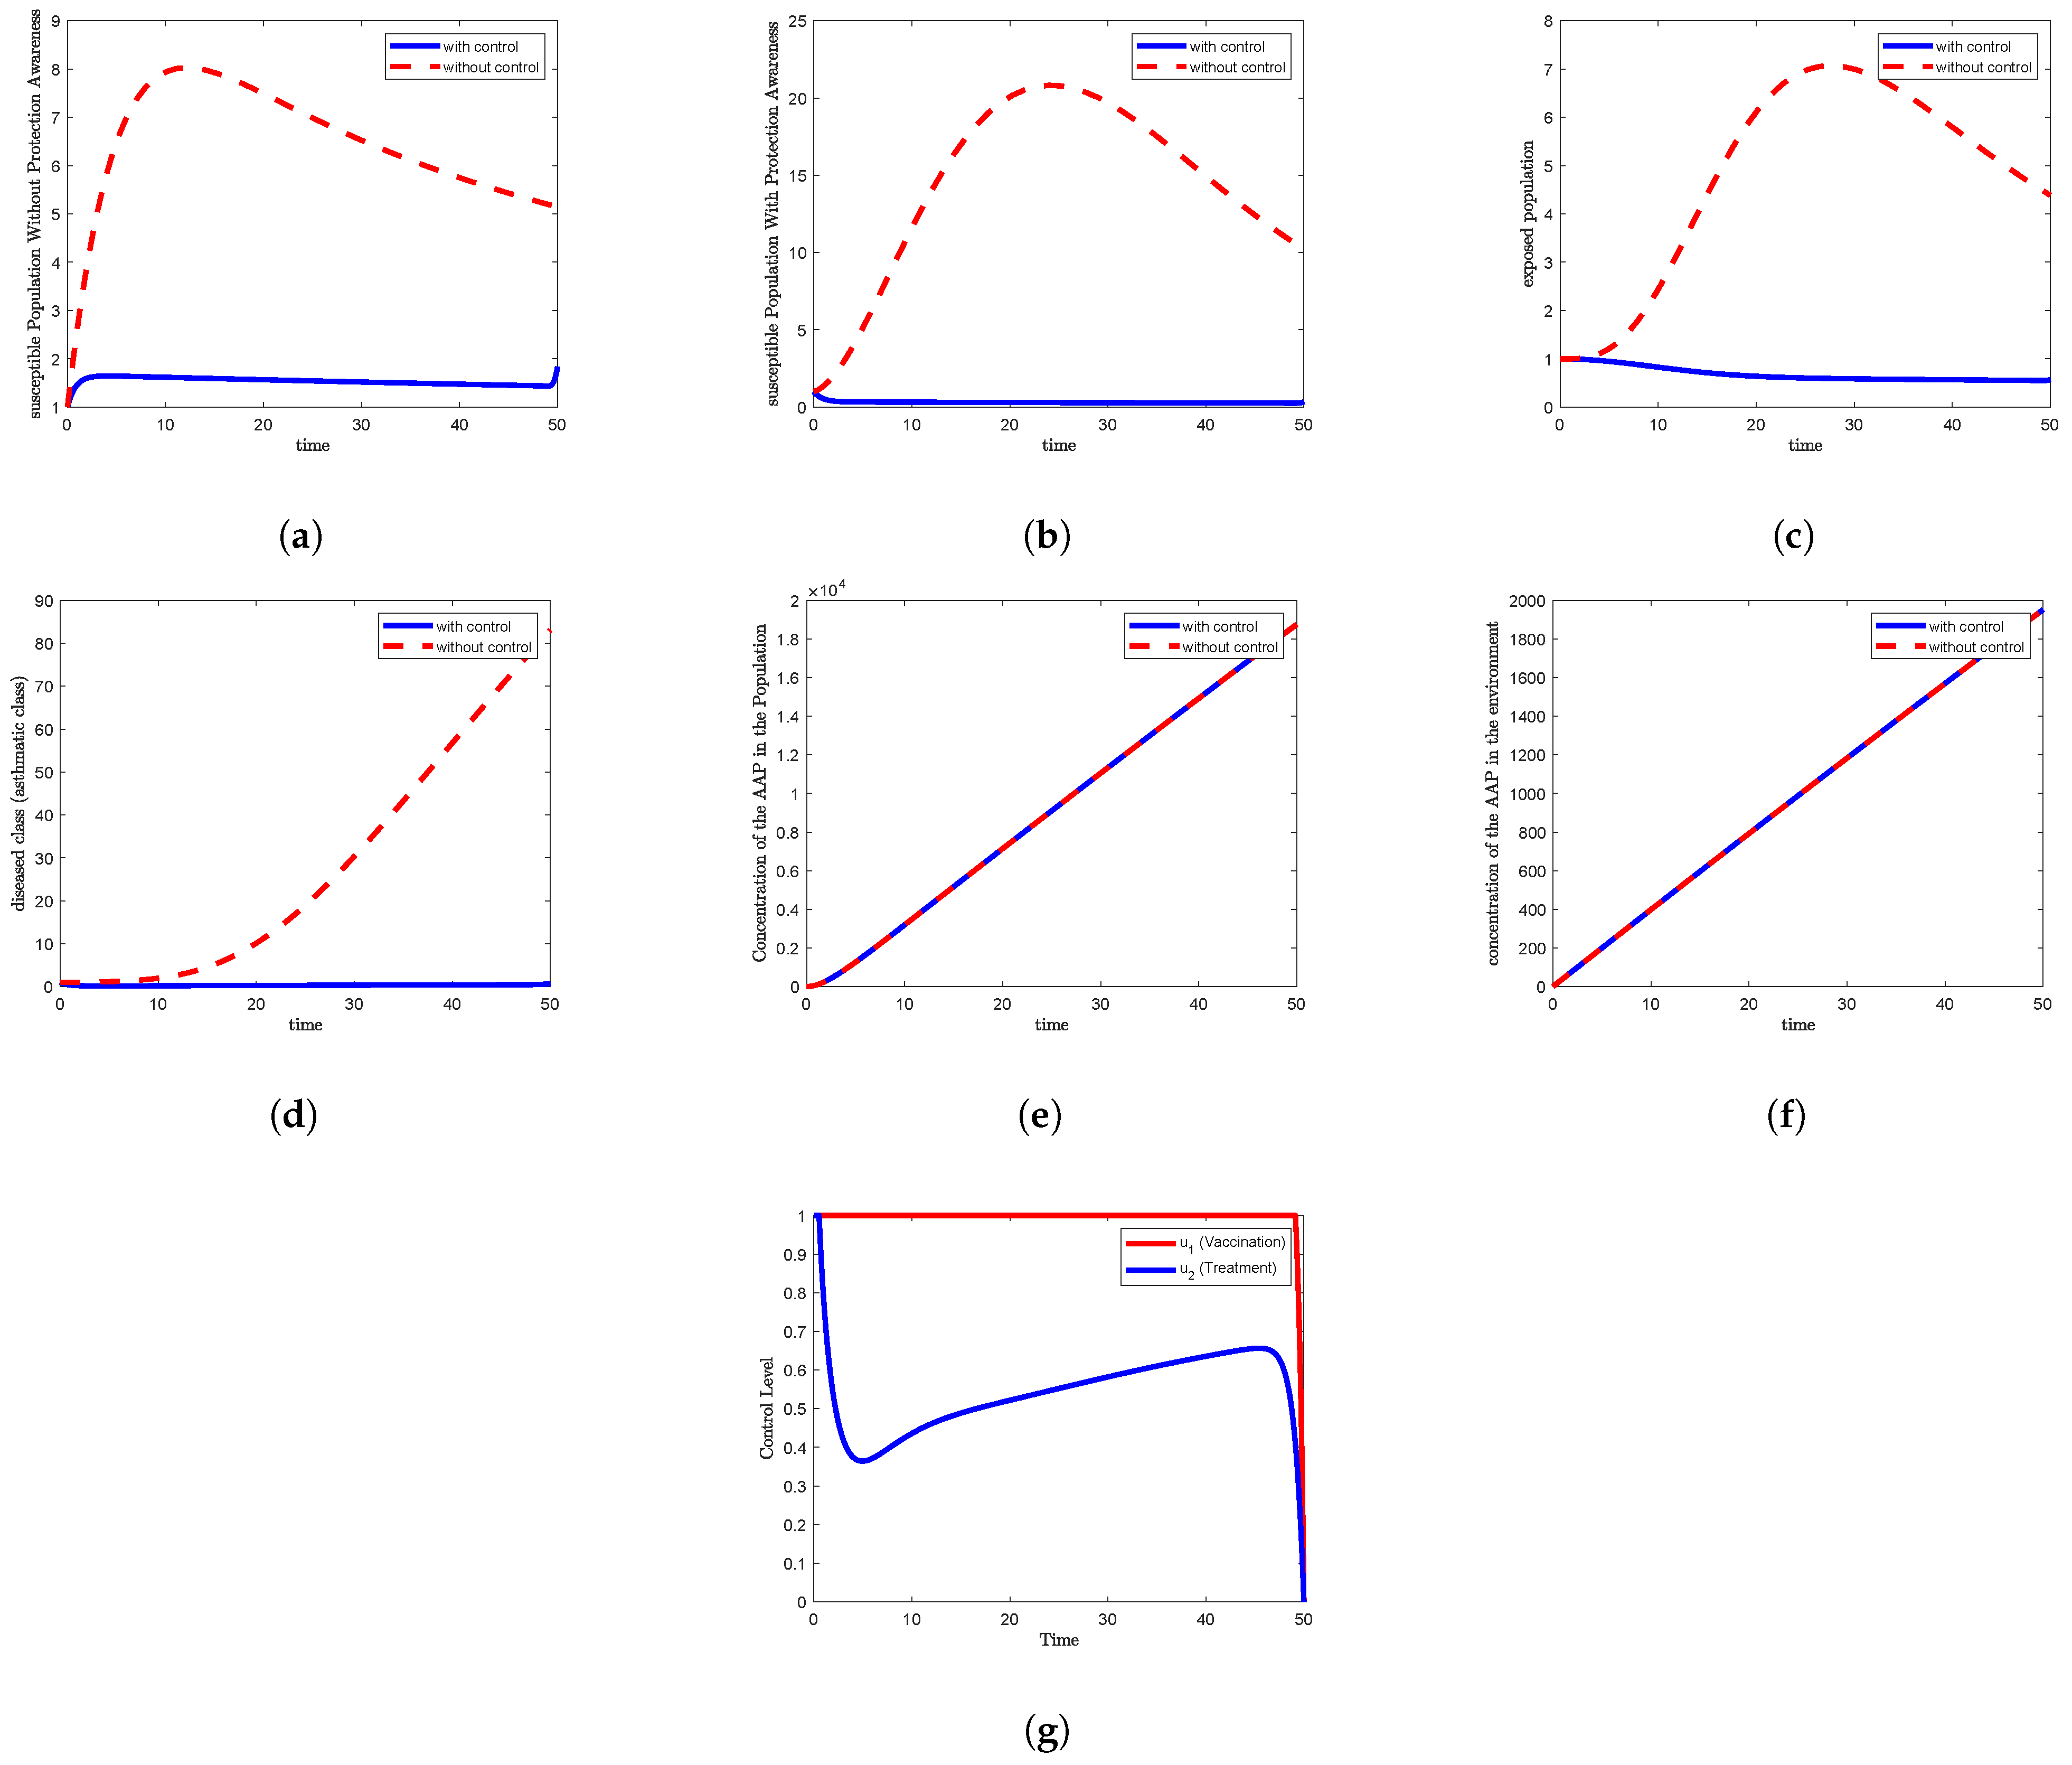
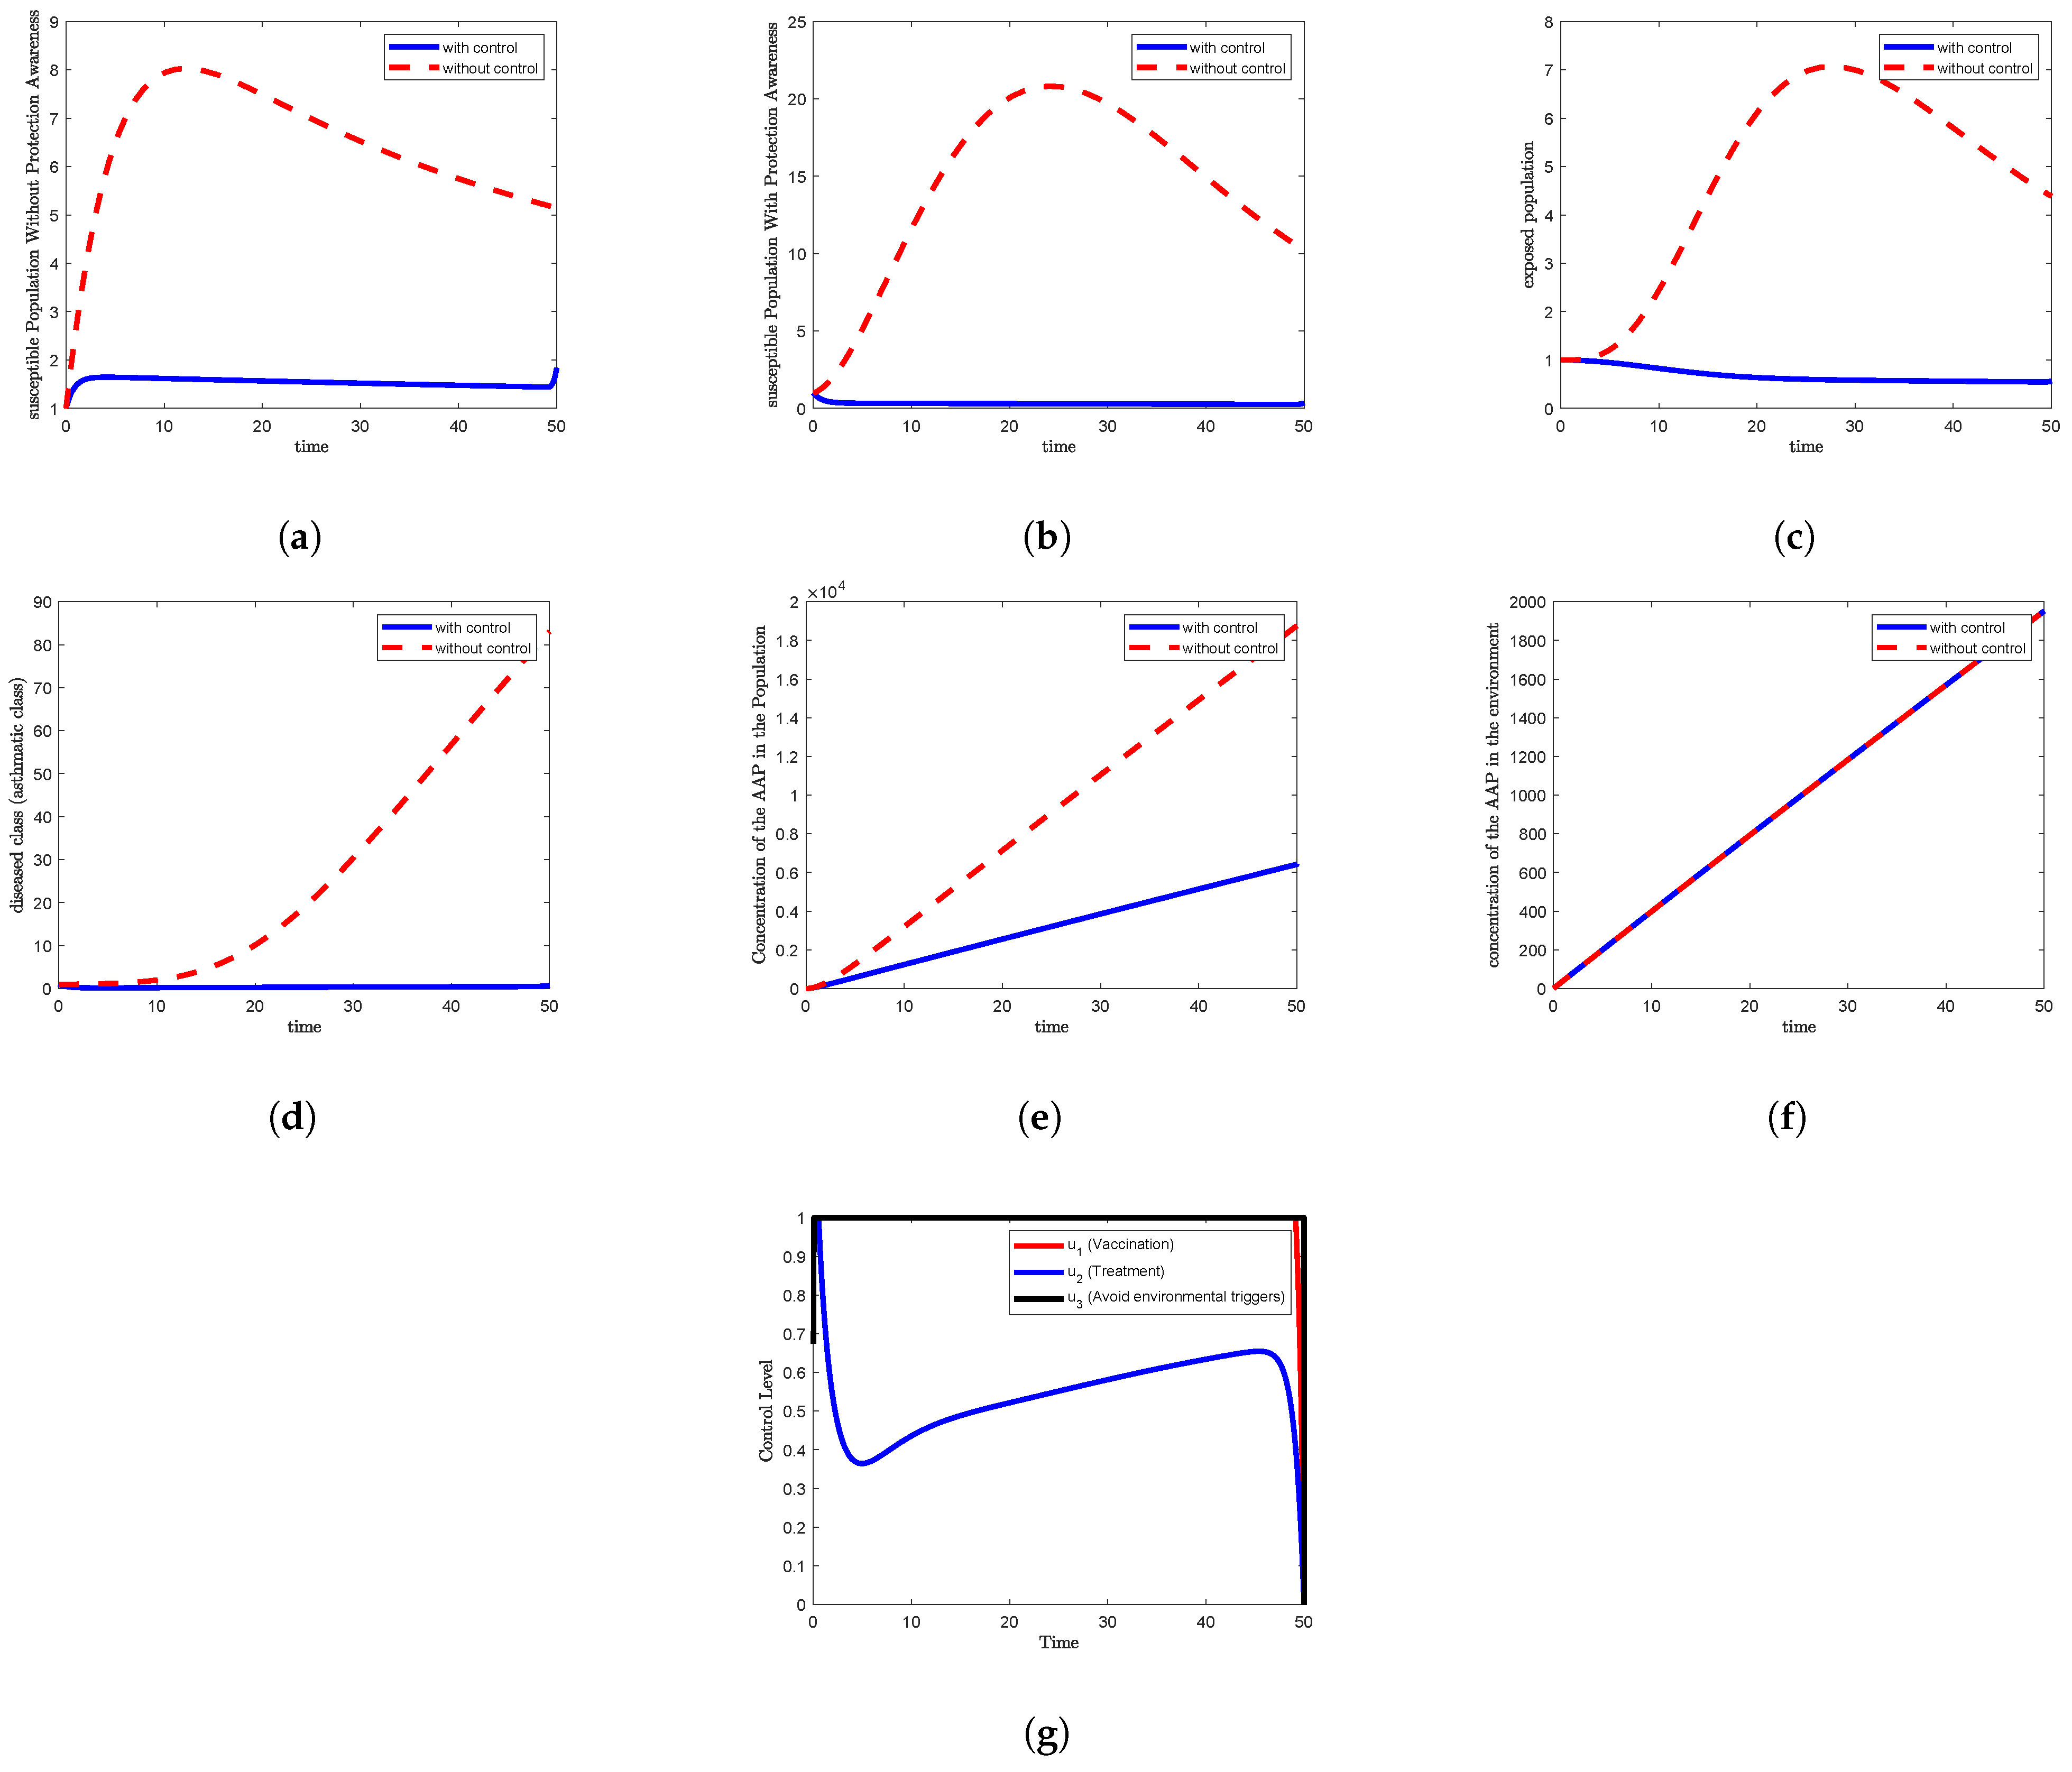
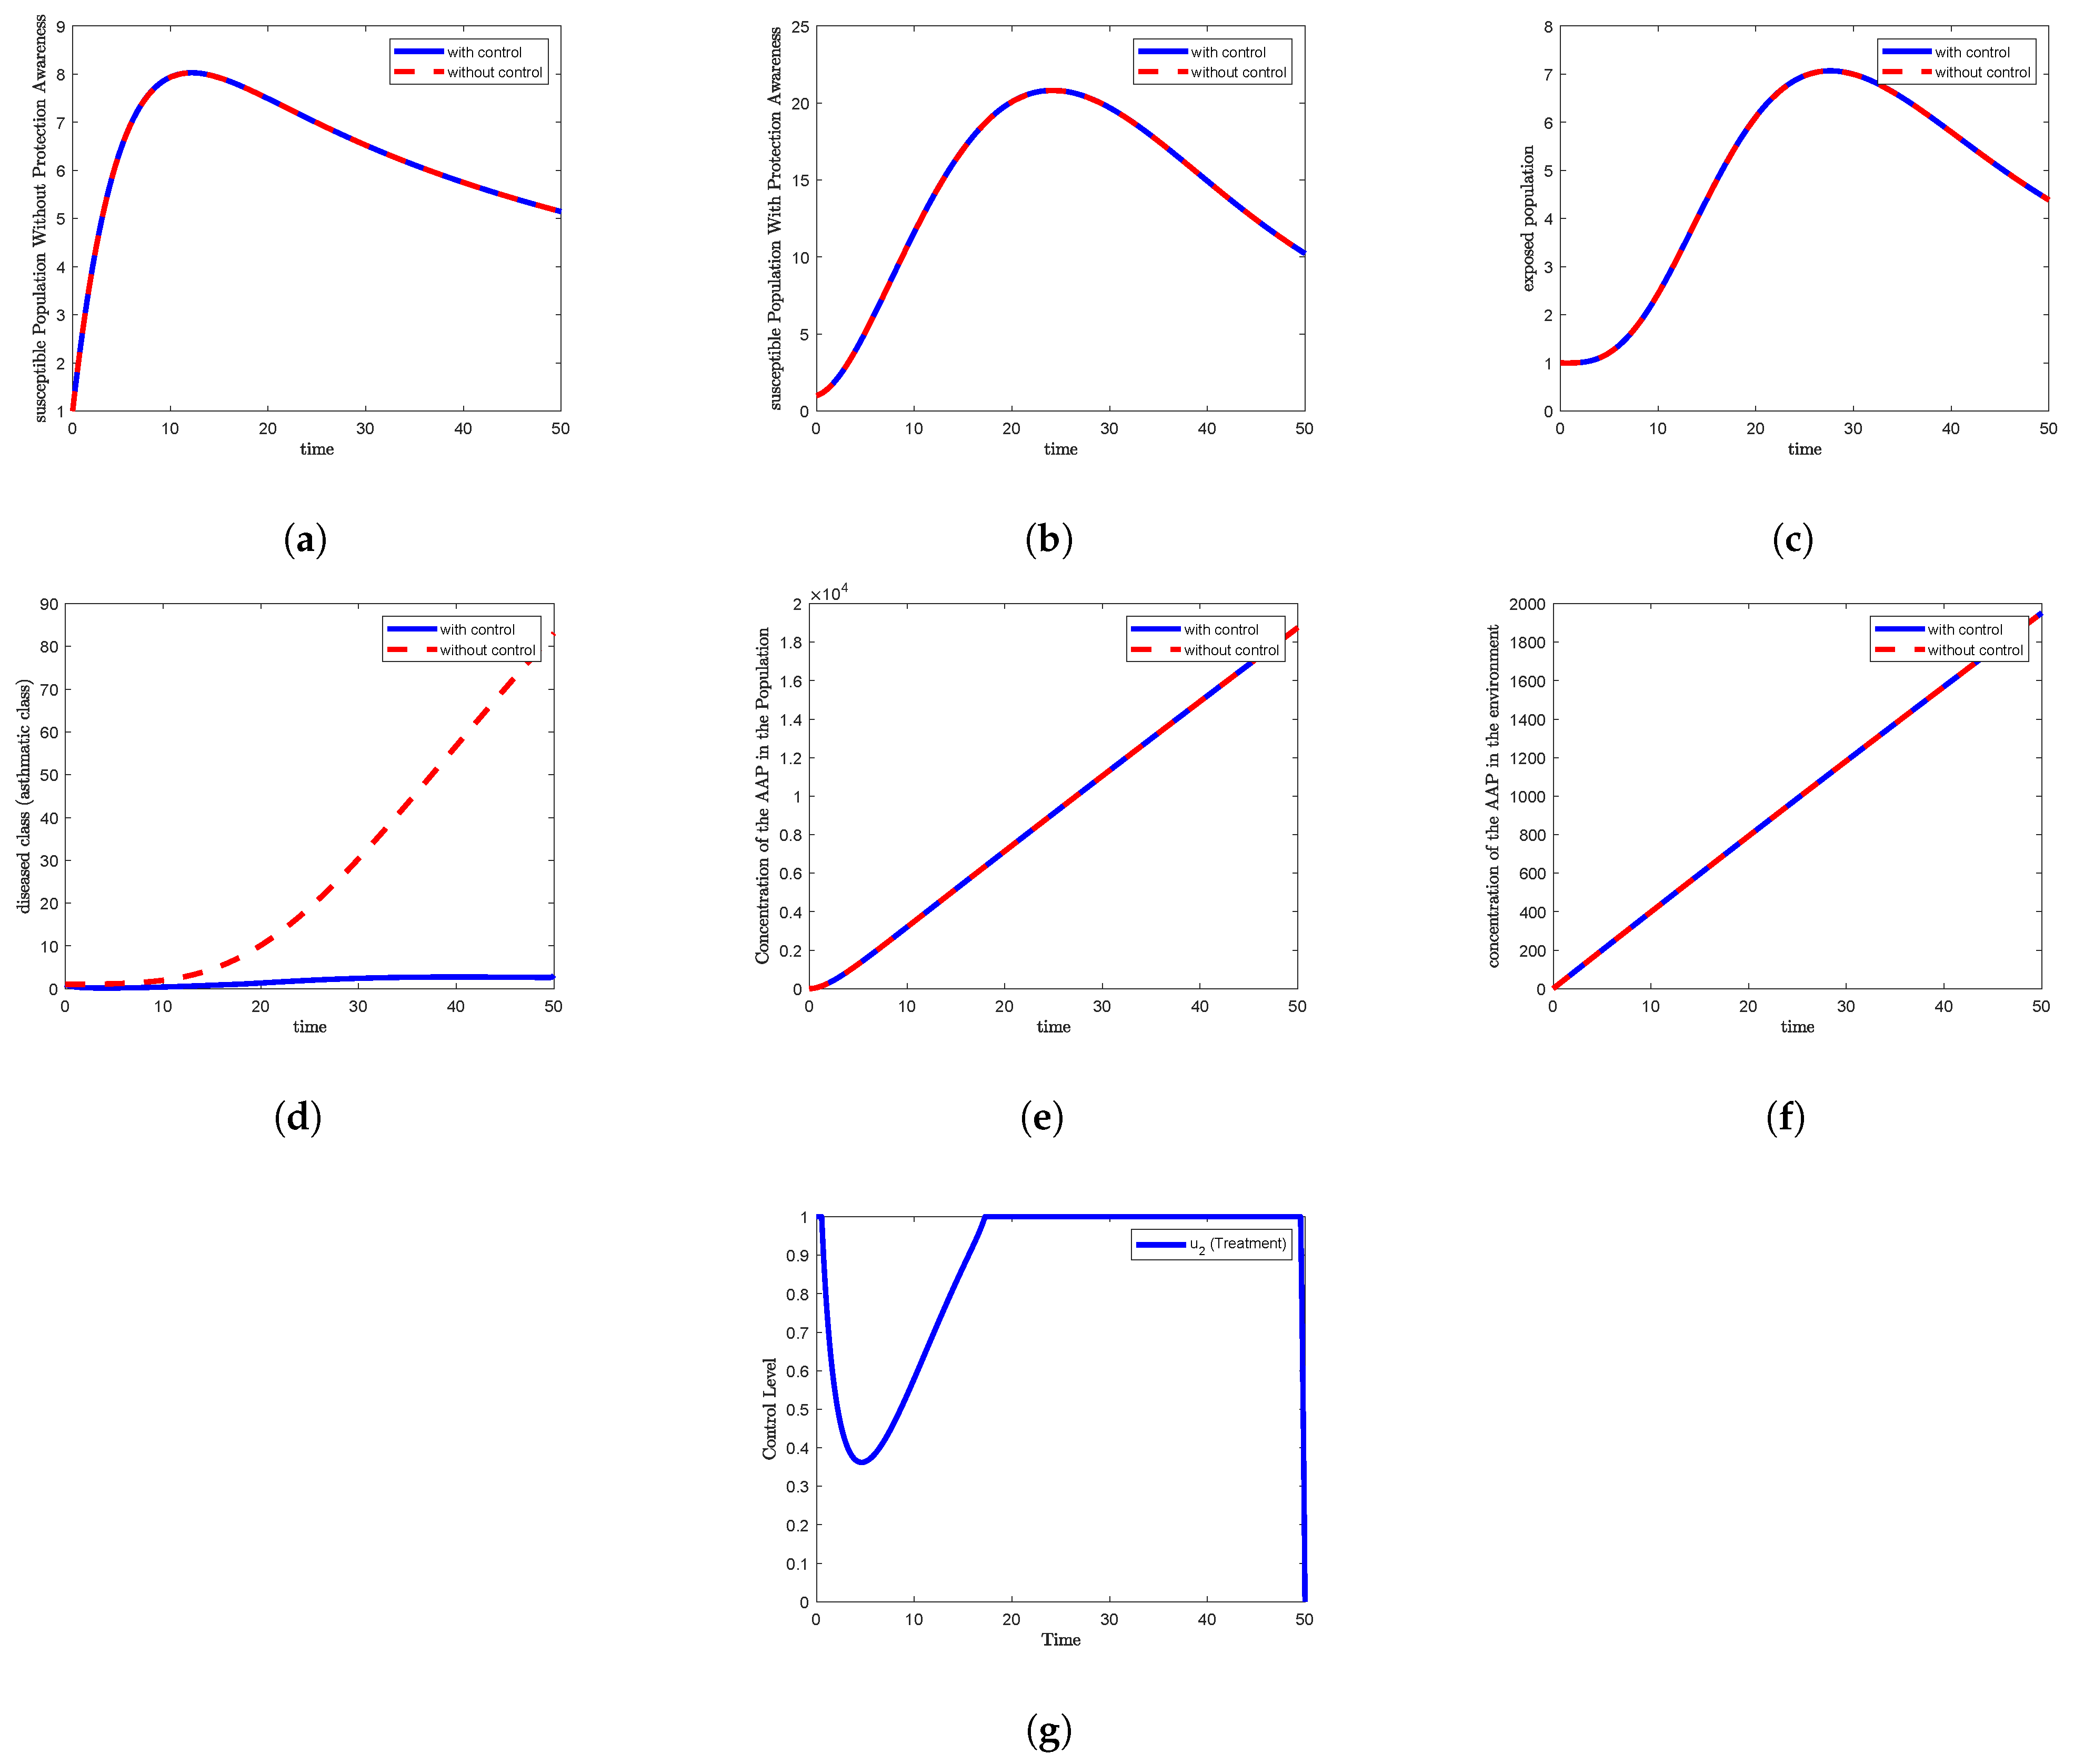
Figure 1, Figure 2, Figure 3, Figure 4, Figure 5, Figure 6 and Figure 7 illustrate the simulation results, where the following are shown with and without the application of control measures.
(a)
The time evolution of the susceptible individuals without awareness, S 1 ( t ) ;
(b)
The susceptible individuals with awareness, S 2 ( t ) ;
(c)
The exposed population, E ( t ) ;
(d)
The asthmatic (infected) population, A ( t ) ;
(e)
The concentration of desert dust within the population, C ( t ) ;
(f)
The concentration of desert dust in the environment, P ( t ) ;
(g)
The optimal control trajectory over the time interval [ 0 , 50 ] .
In Figure 1a, Figure 5a, Figure 6a and Figure 7a, which correspond to Strategy 1, Strategy 5, Strategy 6, and Strategy 7, respectively, the susceptible population without awareness S 1 ( t ) shows a slight increase under the control condition compared to the non-control scenario. Specifically, S 1 ( t ) rises to approximately 1.6 after two days, then gradually decreases to around 1.4 by day 49, and finally increases again to reach 1.8 by the end of the simulation period at day 50.
In contrast, Figure 2a, Figure 3a and Figure 4a, corresponding to Strategies 2, 3, and 4, respectively, show that the control condition closely follows the non-control condition. In this case, S 1 ( t ) rises to a peak of 8 around day 12 and then gradually declines to approximately 5.2 by the end of the study period.
Furthermore, Figure 1b, Figure 5b, Figure 6b and Figure 7b, representing the aware susceptible population S 2 ( t ) under Strategies 1, 5, 6, and 7, reveal a rapid decline under the control scenario, reaching approximately 0.4 after three days and maintaining that level through the end of the study.
Meanwhile, in Figure 2b, Figure 3b and Figure 4b for Strategies 2, 3, and 4, the control and non-control trajectories are nearly identical. Here, S 2 ( t ) increases to a peak of about 21 at day 24, followed by a gradual decline to 10 at the end of the observation period.
Figure 1d and Figure 5d, corresponding to Strategies 1 and 5, respectively, demonstrate that the asthmatic population A ( t ) remains approximately constant during the first five days, after which it begins to increase gradually, reaching a value of 10 by the end of the study period.
In Figure 2d and Figure 4d, representing Strategies 2 and 4, the control scenario shows a rapid decline in A ( t ) after two days, eventually reaching near-zero levels and maintaining this state until around day 13. Thereafter, the population begins to rise again, reaching approximately 3 by day 30 and continuing to increase until the end of the simulation.
Figure 6d and Figure 7d, corresponding to Strategies 6 and 7, respectively, reveal that under the control condition, the asthmatic population declines to nearly zero after three days and remains close to 0.5 through the rest of the simulation period.
In contrast, Figure 3d, representing Strategy 3, shows a stable trend for the first five days, after which A ( t ) increases steadily, reaching a value of approximately 83 at the end of the time interval.
Regarding the concentration of desert dust in the population C ( t ) , Figure 1e, Figure 2e and Figure 6e illustrate that the control and non-control scenarios closely follow each other, both increasing gradually to approximately 1.9 × 10 4 by the end of the simulation.
In contrast, Figure 3e, Figure 4e, Figure 5e and Figure 7e show a slower increase in C ( t ) under the control condition, reaching around 0.6 × 10 4 at the end of the simulation period.
Finally, Figure 1f, Figure 2f, Figure 3f, Figure 4f, Figure 5f, Figure 6f and Figure 7f depict the dynamics of the desert dust concentration in the environment P ( t ) across all strategies. In all cases, the control and non-control trajectories are nearly identical, with P ( t ) increasing gradually to reach approximately 1950 by the end of the study period.
In Figure 1g, Figure 5g, Figure 6g and Figure 7g, which correspond to Strategies 1, 5, 6, and 7, respectively, the vaccination control u 1 ( t ) is observed to remain at its maximum level for over 49 days before decreasing sharply to its minimum value at the end of the study period.
In Figure 2g and Figure 4g, corresponding to Strategies 2 and 4, the treatment control u 2 ( t ) initially declines rapidly to approximately 0.37 within the first four days, then rises to its peak value of 1 by day 18. It remains at this level until around day 49, after which it drops sharply to the minimum by the end of the simulation.
Similarly, in Figure 6g and Figure 7g, representing Strategies 6 and 7, the treatment control u 2 ( t ) follows a comparable trend: decreasing to about 0.37 within the first four days, then gradually increasing to reach approximately 0.65 by day 47, followed by a sharp decline to the minimum at the end of the study.
Furthermore, Figure 3g, Figure 4g, Figure 5g and Figure 7g—corresponding to Strategies 3, 4, 5, and 7—demonstrate that the control for avoiding environmental triggers u 3 ( t ) increases rapidly before the first day from an initial value of approximately 0.68 to its maximum value of 1. It then remains constant at this level throughout the simulation period (up to day 50), and subsequently drops to zero immediately after the study concludes.
From Table 3, it is evident that among the single-control strategies S 1 , S 2 , and S 3 , Strategy S 2 (treatment only) is the most effective in reducing the number of infections. This indicates that treatment is more effective than vaccination or avoidance of environmental triggers when applied individually.
Among the two-control strategies S 4 , S 5 , and S 6 , Strategy S 6 (vaccination and treatment) demonstrates the greatest reduction in disease burden, suggesting that the combination of vaccination and treatment is more effective than either treatment with environmental control or vaccination with environmental control.
Furthermore, in the case of implementing all three controls (Strategy S 7 ), we observe that the additional effect of incorporating avoidance of environmental triggers into the vaccination and treatment strategy results in only a marginal improvement, reducing infections by approximately 39 cases per 10,000 individuals.
As shown in Figure 8, the efficiency indicators exhibit slight variations among the different strategies for the asthmatic class. Strategies 6 and 7 achieve the highest efficiency values, while Strategies 1 and 5 record comparatively lower efficiencies.

6. Cost-Effective Analysis

At the beginning of this section, we employ the Average Cost-Effectiveness Ratio (ACER) to assess the cost-effectiveness of the proposed control strategies. Based on the simulation results obtained, the ACER is computed as follows [31,33,34,35]:
ACER = Total cos t incurred due to the intervention ( T c ) Total number of infections averted by the intervention ( T a ) .
The total number of infections averted during the intervention period T is given by
T a = 0 T A * ( t ) d t 0 T A ( t ) d t ,
where A * ( t ) denotes the number of infected individuals in the absence of control measures, while A ( t ) represents the number of infected individuals under optimal control [31,33,35].
The total cost associated with implementing the controls during the period T is calculated as
T c = 0 T 1 2 B 1 u 1 2 ( t ) + B 2 u 2 2 ( t ) + B 3 u 3 2 ( t ) d t .
According to this analysis, the most cost-effective strategy is the one with the lowest ACER value [31,35]. Table 3 presents the number of infections averted, the total cost incurred, and the corresponding ACER for each control strategy.
According to the (ACER) analysis presented in Table 3, Strategy S 3 exhibits the highest ACER value, estimated at 6.944033, indicating it is the least cost-effective. In contrast, Strategy S 2 has the lowest ACER value, estimated at 0.013570, and is therefore identified as the most cost-effective strategy.
Based on the ACER values, the ranking of strategies from the most to the least cost-effective is as follows:
S 2 S 6 S 1 S 4 S 7 S 5 S 3 .
In addition to the ACER analysis, this section also employs the Incremental Cost-Effectiveness Ratio (ICER), which is a key metric for comparing the economic efficiency of two competing interventions. The ICER is defined as the ratio of the difference in total costs to the difference in the total number of infections averted between two strategies and is given by the formula
ICER = C i C i 1 E i E i 1 ,
where C i and E i denote the total cost and total number of infections averted for Strategy i, respectively, and C i 1 , E i 1 represent the same quantities for the previous (less effective) strategy [31,33,34,35,36]:
I C E R = Total cos t in ( j ) - Total cos t in ( i ) Total infection averted in ( j ) - Total infection averted in ( i ) ,
where the ICER is calculated as follows:
I C E R = T c j T c i T a j T a i .
From Equation (9), it follows that
I C E R ( 1 ) = T c 1 T c 0 T a 1 T a 0 = 24.7660 0 1181.6618 0 = 24.7660 1181.6618 = 0.0210 ,
I C E R ( 2 ) = 17.76 24.77 1309.87 1181.66 = 0.0545 , I C E R ( 3 ) = 24.99 17.76 3.56 1309.87 = 0.0055 ,
I C E R ( 4 ) = 42.76 24.99 1310.07 3.60 = 0.0136 , I C E R ( 5 ) = 49.76 42.76 1182.28 1310.07 = 0.0548 ,
I C E R ( 6 ) = 25.88 49.75 1381.42 1182.28 = 0.1199 , I C E R ( 7 ) = 50.86 25.89 1381.47 1381.42 = 496.5507 .
Table 4 presents the ICER values obtained for the seven control strategies, allowing for a comparative assessment of their cost-effectiveness.
As observed from the results in Table 4, Strategy S 7 , which incorporates all three control measures—vaccination, treatment, and avoidance of environmental triggers (i.e., u 1 , u 2 , and u 3 , respectively)—is identified as the most costly and the least effective among the control strategies. Consequently, Strategy S 7 is excluded from the list of viable alternatives.
The ICER is then recalculated for the remaining six strategies as follows:
I C E R ( 1 ) = 24.76 0 1181.66 0 = 0.0210 , I C E R ( 2 ) = 17.77 24.77 1309.87 1181.66 = 0.0545 , I C E R ( 3 ) = 24.99 17.78 3.56 1309.87 = 0.0055 , I C E R ( 4 ) = 42.76 24.99 1310.07 3.60 = 0.0136 , I C E R ( 5 ) = 49.76 42.76 1182.28 1310.07 = 0.0548 , I C E R ( 6 ) = 25.89 49.76 1381.42 1182.28 = 0.1199 .
The results obtained from I C E R computations are presented in Table 5.
As shown in Table 5, Strategy S 1 , which involves vaccination control only ( u 1 ), incurs a higher cost and results in fewer infections averted compared to Strategy S 4 , which combines treatment and avoidance of environmental triggers ( u 2 and u 3 , respectively). This indicates that implementing vaccination alone is less cost-effective than the combined use of treatment and environmental trigger avoidance.
Accordingly, Strategy S 1 is excluded from the list of viable alternatives.
The ICER is then recalculated for the remaining five strategies as follows:
I C E R ( 2 ) = 17.7751 0 1309.8708 0 = 0.01357 , I C E R ( 3 ) = 24.9871 17.7751 3.5984 1309.8708 = 0.0055 , I C E R ( 4 ) = 42.76 24.99 1310.07 3.60 = 0.01360 , I C E R ( 5 ) = 49.76 42.76 1182.28 1310.07 = 0.0548 , I C E R ( 6 ) = 25.8832 49.7538 1381.4204 1182.2832 = 0.1199 .
The results obtained from the ICER analysis are presented in Table 6.
From the results presented in Table 6, it is observed that Strategy S 4 , which involves both treatment control ( u 2 ) and control of avoiding environmental triggers ( u 3 ), is more costly and less effective compared to Strategy S 2 , which employs treatment control ( u 2 ) alone.
This indicates that the combined implementation of treatment and environmental trigger avoidance controls does not offer a cost-effective advantage over treatment alone. As a result, Strategy S 4 is excluded from the list of viable alternative control strategies.
The ICER is then recalculated for the remaining four strategies as follows:
I C E R ( 2 ) = 17.7751 0.0000 1309.8708 0.0000 = 0.01357 , I C E R ( 3 ) = 24.9871 17.7751 3.5984 1309.8708 = 0.0055 , I C E R ( 5 ) = 49.7538 24.9871 1182.2832 3.5984 = 0.0210 , I C E R ( 6 ) = 25.8832 49.7538 1381.4204 1182.2832 = 0.1199 .
Table 7 presents the updated ICER values for the remaining control strategies.
Based on the results shown in Table 7, Strategy S 5 , which combines vaccination control ( u 1 ) and control of avoiding environmental triggers ( u 3 ), is found to be more costly and less effective than Strategy S 1 , which relies on vaccination control ( u 1 ) alone.
This indicates that the addition of environmental trigger avoidance to vaccination does not improve cost-effectiveness, but rather increases the total cost with reduced impact. Consequently, Strategy S 5 is excluded from the list of viable alternative strategies.
The ICER is then recalculated for the remaining three strategies as follows:
I C E R ( 2 ) = 17.7751 0.0000 1309.8708 0.0000 = 0.01357 , I C E R ( 3 ) = 24.9871 17.7751 3.5984 1309.8708 = 0.0055 , I C E R ( 6 ) = 25.8832 24.9871 1381.4204 3.5984 = 0.0007 .
Table 8 presents the updated ICER values for the three remaining strategies.
Based on the results presented in Table 8, Strategy S 2 , which relies solely on treatment control ( u 2 ), is found to be more costly and less effective than Strategy S 6 , which combines vaccination ( u 1 ) and treatment ( u 2 ) controls.
This suggests that the combined use of vaccination and treatment is more cost-effective than treatment alone. Consequently, Strategy S 2 is excluded from the list of viable alternatives.
The ICER is then recalculated for the remaining two strategies as follows:
I C E R ( 3 ) = 24.9871 0.0000 3.5984 0.0000 = 6.9439 , I C E R ( 6 ) = 25.8832 24.9871 1381.4204 3.5984 = 0.0007 .
Table 9 presents the ICER values for the final comparison between the two remaining control strategies.
From Table 9, it is evident that ICER ( 3 ) is greater than ICER ( 6 ) . The lower ICER value obtained for Strategy S 6 indicates that Strategy S 3 is strongly dominated, meaning it is both more expensive and less effective than S 6 .
Therefore, Strategy S 6 , which incorporates both vaccination control ( u 1 ) and treatment control ( u 2 ), is identified as the most cost-effective option among the seven strategies considered in this study.
This finding highlights the importance of implementing a combined control strategy that includes both vaccination and treatment in order to effectively reduce disease transmission at a minimal cost. Future public health policies should prioritize such integrated interventions, as they offer the best balance between epidemiological impact and economic feasibility.

7. Conclusions

In this study, we presented an extended S E I R -type health model that incorporates the concentration of desert dust in both the population and the environment. The model integrates biological, mathematical, economic, and control components to investigate the spread of non-communicable diseases. It is designed to accurately reflect the disease transmission dynamics in a homogeneous population, accounting for the progression from susceptibility to infection through a latent phase while also modeling the influence of desert dust concentrations—an enhancement that distinguishes it from classical compartmental models.
The model incorporates three time-dependent control functions representing key preventive interventions: vaccination ( u 1 ), treatment ( u 2 ), and avoidance of environmental triggers ( u 3 ). This formulation enables the assessment of individual interventions, combinations of two controls, and the joint implementation of all three strategies.
From a theoretical standpoint, local asymptotic stability of the endemic equilibrium was established unconditionally using Jacobian matrix analysis, confirming that all eigenvalues are strictly negative.
Pontryagin’s Maximum Principle was employed to formulate and solve the optimal control problem. This allowed for the derivation of necessary conditions to minimize the number of infections and the associated intervention costs. Seven different control strategies were numerically simulated. The results demonstrated that treatment alone outperformed vaccination and avoidance strategies when applied individually. Among the dual-control strategies, the combination of vaccination and treatment was the most effective. The addition of environmental trigger avoidance to this combination yielded only marginal improvement—approximately 39 parts per ten thousand—suggesting limited benefit in terms of additional effectiveness or cost-efficiency.
These conclusions were reinforced by a comprehensive cost-effectiveness analysis using both the Average Cost-Effectiveness Ratio (ACER) and the Incremental Cost-Effectiveness Ratio (ICER). ACER analysis identified treatment as the most cost-effective standalone intervention ( A C E R = 0.013570 ), whereas avoidance of environmental triggers had the least favorable outcome ( A C E R = 6.944033 ). ICER analysis further supported the superiority of the combined vaccination and treatment strategy ( I C E R = 0.0007 ).
Baseline parameter values for the model and desert dust concentrations were adapted from previous literature, with slight modifications to better align with the specific structure and assumptions of the current model. These adjustments were made to enhance the fidelity of the simulations while remaining grounded in empirical evidence.
The developed framework provides a strong foundation for constructing more comprehensive models that can incorporate immunity dynamics, behavioral heterogeneity, and climate-related environmental factors. Due to its flexibility and compatibility with real-world data, the model can serve as a valuable tool for policymakers seeking evidence-based guidance in designing optimal intervention strategies. Ultimately, this work highlights the critical role of mathematical modeling in public health—not only for understanding disease dynamics but also for guiding cost-effective, sustainable interventions.
Although the model is inspired by environmental conditions prevalent in Qassim, the developed framework, optimal control strategies, and cost-effectiveness analysis are applicable to a wide range of regions experiencing similar challenges in asthma management. Future extensions may tailor parameter values to specific local datasets, enabling more targeted intervention planning while maintaining the generalizability of the modeling approach.
We note that the present study is theoretical in nature, and future work may include experimental or empirical validation of the results in collaboration with healthcare practitioners.

Author Contributions

Conceptualization, Z.S.A.A. and M.E.-S.; methodology, Z.S.A.A.; software, Z.S.A.A.; validation, Z.S.A.A., M.E.-S.; formal analysis, M.E.-S.; investigation, Z.S.A.A.; resources, Z.S.A.A.; data curation, Z.S.A.A.; writing—original draft preparation, Z.S.A.A.; writing—review and editing, M.E.-S.; visualization, M.E.-S.; supervision, M.E.-S.; project administration, M.E.-S.; funding acquisition, M.E.-S. All authors have read and agreed to the published version of the manuscript.

Funding

The authors gratefully acknowledge Qassim University, represented by the Deanship of Graduate Studies and Scientific Research, for the financial support for this research under the number (QU-J-PG-2-2025-54869) during the academic year 1446 AH/2024 AD.

Data Availability Statement

All data supporting the findings of this study are available within the paper.

Conflicts of Interest

The authors declare no conflicts of interest.

References

  1. Martinez, F.D. Genes, environments, development and asthma: A reappraisal. Eur. Respir. J. 2007, 29, 179–184. [Google Scholar] [CrossRef] [PubMed]
  2. Cohen, A.J.; Brauer, M.; Burnett, R.; Anderson, H.R.; Frostad, J.; Estep, K.; Balakrishnan, K.; Brunekreef, B.; Dandona, L.; Dandona, R.; et al. Estimates and 25-year trends of the global burden of disease attributable to ambient air pollution: An analysis of data from the Global Burden of Diseases Study 2015. Lancet 2017, 389, 1907–1918. [Google Scholar] [CrossRef] [PubMed]
  3. World Health Organization. Air Pollution. 2018. Available online: https://www.who.int/data/gho/data/themes/air-pollution/who-air-quality-database/2018 (accessed on 18 December 2018).
  4. Landrigan, P.J.; Fuller, R.; Fisher, S.; Suk, W.A.; Sly, P.; Chiles, T.C.; Bose-O’Reilly, S. Pollution and children’s health. Sci. Total Environ. 2019, 650, 2389–2394. [Google Scholar] [CrossRef] [PubMed]
  5. Hansel, N.N.; Romero, K.M.; Pollard, S.L.; Bose, S.; Psoter, K.J.; Underhill, L.; Johnson, C.; Williams, D.A.; Curriero, F.C.; Breysse, P.; et al. Ambient Air Pollution and Variation in Multiple Domains of Asthma Morbidity among Peruvian Children. Ann. Am. Thorac. Soc. 2019, 16, 348–355. [Google Scholar]
  6. Lim, H.; Kwon, H.J.; Lim, J.A.; Choi, J.H.; Ha, M.; Hwang, S.S.; Choi, W.J. Short-term effect of fine particulate matter on children’s hospital admissions and emergency department visits for asthma: A systematic review and meta-analysis. J. Prev. Med. Public Health 2016, 49, 205–219. [Google Scholar] [CrossRef]
  7. Strickland, M.J.; Darrow, L.A.; Klein, M.; Flanders, W.D.; Sarnat, J.A.; Waller, L.A.; Sarnat, S.E.; Mulholland, J.A.; Tolbert, P.E. Short-term associations between ambient air pollutants and pediatric asthma emergency department visits. Am. J. Respir. Crit. Care Med. 2010, 182, 307–316. [Google Scholar] [CrossRef]
  8. Balakrishnan, K.; Dey, S.; Gupta, T.; Dhaliwal, R.S.; Brauer, M.; Cohen, A.J.; Stanaway, J.D.; Beig, G.; Joshi, T.K.; Aggarwal, A.N.; et al. The impact of air pollution on deaths, disease burden, and life expectancy across the states of India: The Global Burden of Disease Study 2017. Lancet Planet. Health 2019, 3, e26–e39. [Google Scholar] [CrossRef]
  9. Lee, Y.M.; Lee, J.H.; Kim, H.-C.; Ha, E. Effects of PM10 on mortality in pure COPD and asthma-COPD overlap: Difference in exposure duration, gender, and smoking status. Sci. Rep. 2020, 10, 2402. [Google Scholar] [CrossRef]
  10. Wang, L.; Xie, J.; Hu, Y.; Tian, Y. Air pollution and risk of chronic obstructed pulmonary disease: The modifying effect of genetic susceptibility and lifestyle. EBioMedicine 2022, 79, 103994. [Google Scholar] [CrossRef]
  11. Alaboodi, A.S.; Alshitawi, M.S.; Omar, A.F.; Alharby, A.B. Air Quality in Buraydah, Saudi Arabia. Int. J. Innov. Technol. Explor. Eng. (IJITEE) 2020, 9, 856–861. [Google Scholar] [CrossRef]
  12. Alrasheedi, S.M.; Oraibi, O.; Areeshi, A.; Alhazmi, N.; Hakami, A.; Kariri, T.; Akish, E.; Alamer, A.; Sayed, A.; Madkhali, M.; et al. Awareness of asthmatic patients to the association between the environmental risk factors and asthma exacerbation in Al-Qassim region, Saudi Arabia. Med. Sci. 2023, 27, e155ms2711. [Google Scholar] [CrossRef]
  13. Alrasheedi, S.; Alhumaidi, K.A.; Alharbi, A.M.; Aldhowyan, N.A.; Alobaid, N.M.; Alturaif, N.A.; Almatroudi, G.A.; Alkhalifah, M.S.; Alrasheedi, A.A.; Alrashdi, M.N.; et al. Relationship Between Asthma and Headache Attacks in the Qassim Region, Saudi Arabia. Cureus 2023, 15, e39784. [Google Scholar] [CrossRef]
  14. Wang, J.; Pang, J.; Liu, X. Modelling diseases with relapse and nonlinear incidence of infection: A multi-group epidemic model. J. Biol. Dyn. 2014, 8, 99–116. [Google Scholar] [CrossRef]
  15. Wang, J.; Zhang, R.; Kuniya, T. The stability analysis of an SVEIR model with continuous age-structure in the exposed and infectious classes. J. Biol. Dyn. 2015, 9, 73–101. [Google Scholar] [CrossRef]
  16. Zaman, G.; Kang, Y.H.; Jung, I.H. Stability and optimal vaccination of an SIR epidemic model. BioSystems 2008, 93, 240–249. [Google Scholar] [CrossRef] [PubMed]
  17. Zaman, G.; Kang, Y.H.; Jung, I.H. Optimal treatment of an SIR epidemic model with time delay. BioSystems 2009, 98, 43–50. [Google Scholar] [CrossRef] [PubMed]
  18. Ghosh, M. Industrial pollution and Asthma: A mathematical model. J. Biol. Syst. 2000, 8, 347–371. [Google Scholar] [CrossRef]
  19. Ram, N.; Tripathi, A. A Nonlinear Mathematical model for Asthma: Effect of Environmental Pollution. Iran. J. Optim. 2009, 1, 24–56. [Google Scholar]
  20. Agarwal, S.; Devi, S. The effect of environmental tax on the survival of biological species in a polluted environment: A mathematical model. Nonlinear Anal. Model. Control 2010, 15, 271–286. [Google Scholar] [CrossRef]
  21. Alejo, A.B.; Quesada, D.G. Modeling the association between the seasonal asthma prevalence and upper respiratory infections. Cureus 2016, 2, 1–2. [Google Scholar]
  22. Kim, Y.; Lee, S.; Kim, Y.S.; Lawler, S.; Gho, Y.S.; Kim, Y.K.; Hwang, H.J. Regulation of Th1/Th2 cells in asthma development: A mathematical model. Math. Biosci. Eng. 2013, 10, 1095–1133. [Google Scholar] [CrossRef]
  23. Lee, J.; Adler, F.R.; Kim, P.S. A mathematical model for the macrophage response to respiratory viral infection in normal and asthmatic conditions. Bull. Math. Biol. 2017, 79, 1979–1998. [Google Scholar] [CrossRef] [PubMed]
  24. Shah, N.H.; Suthar, A.H.; Pandya, P.M. Mathematical Modeling for Asthma due to Air Pollution. J. Appl. Nonlinear Dyn. 2021, 10, 219–228. [Google Scholar] [CrossRef]
  25. Jan, R.; Yüzbaşı, Ş.; Attaullah, A.; Jawad, M.; Jan, A. Fractional derivative analysis of Asthma with the effect of environmental factors. Sigma J. Eng. Nat. Sci. 2024, 42, 177–188. [Google Scholar] [CrossRef]
  26. Adeyemo, O.; Adewale, S.O.; Oladipo, A.T.; Omoloye, M.A. Analysis of mathematical model for asthma caused by the effects of environmental pollution. Sci. World J. 2024, 19, 34–49. [Google Scholar] [CrossRef]
  27. Wang, X.; Wang, X.; Guan, X.; Xu, Y.; Xu, K.; Gao, Q.; Cai, R.; Cai, Y. The impact of ambient air pollution on an influenza model with partial immunity and vaccination. Math. Biosci. Eng. 2023, 20, 10284–10303. [Google Scholar] [CrossRef]
  28. Wang, L.; Wei, F.; Jin, Z.; Mao, X.; Cai, S.; Chen, G.; Zheng, K.; Xie, J. HCV transmission model with protection awareness in an SEACTR community. Infect. Dis. Model. 2025, 10, 559–570. [Google Scholar] [CrossRef]
  29. Todorov, E. Optimal control theory. In Bayesian Brain: Probabilistic Approaches to Neural Coding; MIT Press: Cambridge, MA, USA, 2006; pp. 268–298. [Google Scholar]
  30. Jung, E.; Lenhart, S.; Feng, Z. Optimal control of treatments in a two-strain tuberculosis model. Discret. Contin. Dyn. Syst. Ser. B 2002, 2, 473–482. [Google Scholar] [CrossRef]
  31. Ghosh, J.K.; Ghosh, U.; Biswas, M.; Sarkar, S. Qualitative analysis and optimal control strategy of an SIR model with saturated incidence and treatment. In Differential Equations and Dynamical Systems; Springer: Berlin/Heidelberg, Germany, 2019; pp. 1–15. [Google Scholar]
  32. Khatun, M.S.; Biswas, M.H.A. Optimal control strategies for preventing hepatitis B infection and reducing chronic liver cirrhosis incidence. Infect. Dis. Model. 2020, 5, 91–110. [Google Scholar] [CrossRef]
  33. Berhe, H.W. Optimal control strategies and cost-effectiveness analysis applied to real data of cholera outbreak in Ethiopia’s Oromia region. Chaos Solitons Fractals 2020, 138, 109933. [Google Scholar] [CrossRef]
  34. Rodrigues, P.; Silva, C.J.; Torres, D.F. Cost-effectiveness analysis of optimal control measures for tuberculosis. Bull. Math. Biol. 2014, 76, 2627–2645. [Google Scholar] [CrossRef]
  35. Adi, Y.A.; Irsalinda, N.; Ndii, M.Z. Optimal control and cost-effectiveness analysis in an epidemic model with viral mutation and vaccine intervention. CAUCHY J. Mat. Murni Dan Apl. 2022, 7, 173–185. [Google Scholar] [CrossRef]
  36. Keno, T.D.; Makinde, O.D.; Obsu, L.L. Optimal Control and Cost Effectiveness Analysis of SIRS Malaria Disease Model with Temperature Variability Factor. J. Math. Fundam. Sci. 2021, 53, 134–163. [Google Scholar] [CrossRef]
Figure 1. Time evolution of the system under the optimal implementation of vaccination control only. Subfigures show the dynamics of (a) susceptible individuals without awareness, (b) susceptible individuals with awareness, (c) exposed individuals, (d) asthmatic (infected) individuals, (e) the concentration of desert dust in the population, (f) the concentration of desert dust in the environment, and (g) the vaccination control trajectory.
Axioms 14 00639 g001
Figure 2. Time evolution of the system under the optimal implementation of treatment control only.
Axioms 14 00639 g002
Figure 3. Time evolution of the system under the optimal implementation of avoidance of environmental triggers only.
Axioms 14 00639 g003
Figure 4. Time evolution of the system under the optimal implementation of treatment and avoidance of environmental triggers.
Axioms 14 00639 g004
Figure 5. Time evolution of the system under the optimal implementation of vaccination and avoidance of environmental triggers.
Axioms 14 00639 g005
Figure 6. Time evolution of the system under the optimal implementation of vaccination and treatment.
Axioms 14 00639 g006
Figure 7. Time evolution of the system under the optimal implementation of vaccination, treatment, and avoidance of environmental triggers.
Axioms 14 00639 g007
Figure 8. Efficiency indicators for asthmatic class.
Axioms 14 00639 g008
Table 1. Description of parameters used in the asthma model.
ParameterDescriptionValue
Λ Recruitment rate (births or inflow into the population)2
β Transmission coefficient due to exposure to desert dust0.0001
α Awareness conversion rate from S 1 to S 2 due to education and campaigns0.2
mModulation coefficient of desert dust on transmission rate0.000001
ϵ Protection efficiency of the aware susceptible population S 2 0.3
ω Mutation rate of the disease agent (e.g., allergenic strain evolution)0.1
σ Progression rate from exposed to disease due to continuous desert dust exposure0.0003
δ Asthma-induced mortality rate0.00008
ν Depletion rate of desert dust in the environment0.001
θ Clearance rate of desert dust in the human population0.5
μ Natural death rate0.0004
QRate of introduction of desert dust into the environment40
ρ Transfer rate of desert dust from environment to human population5
Table 2. Strategies and their efficiency indices of asthmatic class.
Strategy A 0 A c E . I .
S11391.2330209.435884.9460%
S21391.233083.135894.0243%
S31391.23301387.63500.2586%
S41391.233082.942694.0382%
S51391.2330208.814084.9907%
S61391.233016.138398.8400%
S71391.233016.083698.8439%
Table 3. Total number of infections averted, total cost incurred, and the corresponding ACER for each control strategy.
StrategyTotal Infections AvertedTotal CostACER
S11181.661824.76600.020959
S21309.870817.77510.013570
S33.598424.98716.944033
S41310.065842.75660.032637
S51182.283249.75380.042083
S61381.420425.88320.018737
S71381.470750.85970.036816
Table 4. Total number of infections averted, total cost incurred, and the corresponding ICER for each control strategy.
StrategyTotal Infections AvertedTotal CostICER
S11181.661824.76600.0210
S21309.870817.7751−0.0545
S33.598424.9871−0.0055
S41310.065842.75660.0136
S51182.283249.7538−0.0548
S61381.420425.8832−0.1199
S71381.470750.8597496.5507
Table 5. Number of infections averted and total cost of each strategy and I C E R .
StrategyTotal Infections AvertedTotal CostICER
S11181.661824.76600.0210
S21309.870817.7751−0.0545
S33.598424.9871−0.0055
S41310.065842.75660.0136
S51182.283249.7538−0.0548
S61381.420425.8832−0.1199
Table 6. Total number of infections averted, total cost incurred, and the corresponding ICER for each control strategy.
StrategyTotal Infections AvertedTotal CostICER
S21309.870817.77510.01357
S33.598424.9871−0.0055
S41310.065842.75660.01360
S51182.283249.7538−0.0548
S61381.420425.8832−0.1199
Table 7. Total number of infections averted, total cost incurred, and corresponding ICER for each control strategy.
StrategyTotal Infections AvertedTotal CostICER
S21309.870817.77510.01357
S33.598424.9871−0.0055
S51182.283249.75380.0210
S61381.420425.8832−0.1199
Table 8. Total number of infections averted, total cost incurred, and the corresponding ICER for each of the remaining control strategies.
StrategyTotal Infections AvertedTotal CostICER
S21309.870817.77510.01357
S33.598424.9871−0.0055
S61381.420425.88320.0007
Table 9. Total number of infections averted, total cost incurred, and corresponding ICER for each of the final control strategies.
StrategyTotal Infections AvertedTotal CostICER
S33.598424.98716.9439
S61381.420425.88320.0007
Disclaimer/Publisher’s Note: The statements, opinions and data contained in all publications are solely those of the individual author(s) and contributor(s) and not of MDPI and/or the editor(s). MDPI and/or the editor(s) disclaim responsibility for any injury to people or property resulting from any ideas, methods, instructions or products referred to in the content.