1. Introduction
Process mining is a strong discipline for extracting actionable insights regarding how business processes are implemented in reality through analyzing event logs. Process mining bridges data science methodology and business process management through enterprise information systems data, enabling physicists to identify, monitor, and optimize real business operations [
1,
2]. Trace clustering is a fundamental process mining task that uses behavioral similarity. This grouping simplifies complex models, enhances anomaly detection, and improves overall interpretability [
3]. Early approaches, such as k-means and hierarchical clustering, were limited in capturing the intricacies of real-world process data, which often contain overlapping and uncertain behavioral patterns. Standard clustering methods encounter significant challenges when analyzing real-life process data, as sequences often exhibit complex, overlapping, and unpredictable patterns [
1,
2]. Trace clustering, a core task in process mining, addresses this by grouping process instances based on behavioral similarity, enabling model simplification and the detection of anomalies [
3]. Traditional clustering techniques, such as k-means and hierarchical clustering, have been applied; however, they often fall short in interpreting the nuanced and dynamic nature of the real-world process data from information systems.
Clustering in process mining generally falls into two main categories: sequence-based and time-based approaches. Sequence-based clustering algorithms group process traces by their control-flow patterns through metric measures, including Damerau–Levenshtein, Jaccard similarity, and Longest Common Subsequence (LCS), to calculate the sequence similarity [
3]. These techniques perform well in detecting structural patterns, but they usually exclude measurements of performance differences. In contrast, time-based clustering approaches such as dynamic time warping (DTW) and k-shape, plus other time-series methods, generate clusters from process data based on temporal duration patterns, especially cycle times and inter-activity periods [
4]. Adopting these analytical methods produces essential findings; however, used separately, these methods fail to create a complete picture of process changes over time. Multiple studies show that procedural clustering results achieve better robustness by using temporal and control-flow analysis for extracting meaningful insights from noisy process environments [
2,
5].
Fuzzy clustering has attracted research attention because it provides a powerful means of handling complex data when conventional clustering methods are insufficient. Fuzzy clustering is superior to conventional clustering techniques because it allows for flexibility in allocating membership to data points within multiple clusters with varying levels of strength, making it well-suited for real-life applications [
6]. Handling vague data enhances qualitative insights because business processes inherently involve imprecise information that falls outside of predefined categories [
7]. Fuzzy C-means (FCM) is a leading fuzzy clustering tool because it provides key workflow analysis and outlier identification benefits while aiding in medical diagnosis through sophisticated process variation inspection [
8].
The ability of fuzzy clustering to distribute instances of a process across different clusters through membership degrees makes these methods appealing for overcoming current constraints. The soft clustering method provides a more accurate representation of the inherent uncertainties that arise during the execution of business processes [
9]. FCM, a widely employed method, operates within the process mining framework for performing enhanced trace clustering. This method’s unique feature supports control-flow data collection through sequences of activities, as well as the tracking of temporal dynamics through cycle times. Multiple research studies split up these two dimensions, resulting in minimal insights into process variability according to [
4].
The ability to process uncertain data and overlapping class patterns makes fuzzy clustering applicable to various medical imaging applications, computer vision systems, and anomaly detection tasks. Medical imaging professionals have implemented adaptive weighted fuzzy clustering methods that utilize intra-cluster divergence constraints to enhance MRI segmentation accuracy for precise boundary detection, as reported in [
10]. Explainable anomaly detection techniques employ fuzzy clustering to detect rare patterns in a process that delivers interpretable results suitable for fraud detection, security assessment, and industrial surveillance applications [
11]. Research shows that fuzzy clustering will dominate high-impact domains because it offers robust and interpretable clustering solutions [
12].
The process mining technologies used in event log analysis depend upon clustering capabilities for effectively grouping and analyzing process instances [
13]. Traditional clustering algorithms emphasize matching activity sequence patterns because they assume cases using equivalent sequencing will demonstrate equivalent execution behaviors. This assumption proves inadequate for process efficiency review as it overlooks vital time cycle variations [
14]. The duration of medical procedures within a healthcare workflow is consistent for all patients. Still, one patient requires 30 min, while another needs several hours to complete due to the need for diagnostic tests and restricted resources. The actual process performance becomes misinterpreted when differences in cycle times are not taken into account [
15].
The structured direction by which cases proceed through the workflow steps is defined as the process sequence and depicts the sequence of activities that govern the entire path through the workflow from beginning to end. Process sequences by themselves do not provide a complete insight into how processes function. The total case completion time or cycle time demonstrates substantial variations between equivalent process sequences because it depends on how resources are distributed and is affect by unexpected delays [
5]. Cycle time variations in manufacturing, logistics, and customer service activities directly impact efficiency evaluation, bottleneck detection, and operational performance assessment [
4]. The results derived in the context of such a careless omission would show misleading cluster assignments, as the cases share matching sequences yet display substantially different operational properties.
This work fills that void by presenting a fuzzy clustering method that balances activity sequences with cycle times. It utilizes a weighting parameter () that can be adjusted to control the relative importance of each dimension, allowing for a flexible and holistic analysis. This hybrid method enhances interpreting processes, improves anomaly discrimination, and facilitates workflow analysis for optimal results. This work presents the empirical results of using the method with real-world event logs, illustrating enhanced performance in capturing the variability of a process and detecting inefficiencies, with important practical implications for organizational decision making.
The suggested framework utilizes FCM with a distance evaluation tailored for process mining, integrating activity ordering with cycle time calculation. One of the main results of this work is the definition of a clustering method that unifies activity relationship analysis and duration, enabling the investigation of both the control-flow and timing features of traces.
Another important result is that a single process instance may represent multiple clusters with varying degrees of overlap under the FCM clustering method, capturing the real-life ambiguities of workflows. Second, a flexible weighting factor, represented as , allows users to determine the degree of control-flow data and timing data affecting cluster analysis. Lastly, the suggested framework proved capable of separating intricate variants of processes from real-life event logs from various industries during testing.
The specific contributions of this study are summarized as follows:
The study proposes a new fuzzy clustering method that utilizes both activity sequences and cycle times within a single processing framework for process mining examinations.
The model includes a variable weighting parameter () for users to manage the relationship between control-flow and time information throughout the clustering process.
The use of fuzzy C-means clustering enables process instances to be members of multiple clusters with adjustable membership strength, which depicts the actual process imprecision.
The proposed method achieves superior clustering results, as demonstrated by experimental evaluations on actual event logs, compared to previous methods that either relied solely on sequence patterns or temporal data.
Enhancement of process interpretability, bottleneck detection, and operational optimization through a more comprehensive clustering model.
2. Literature Review
The following literature review examines the related work on fuzzy clustering applications and clustering in process mining. Then, the scientific gap that this study fills is introduced.
2.1. Fuzzy C-Means Clustering (FCM)
Fuzzy clustering is unique regarding the FCM approach because of the approaches flexibility in dealing with data with overlapping categories. Although standard FCM presumes equal significance for all features, equal significance for all features often results in suboptimal performance for high-dimensional datasets [
16,
17]. Feature-weighted methods have been developed to address this issue, including variance-based, entropy-based, membership-based, and optimization-based weighting approaches.
The literature offers four basic feature-weighted fuzzy clustering approaches: variance-based approaches, entropy-based approaches, membership-based approaches, and optimization-based approaches [
10,
18]. Variance-based methods significantly contribute to clustering quality by identifying features with high overall variation, whereas entropy-based methods focus on features that minimize cluster ambiguity, as noted by [
19]. Membership-based weighting adjusts feature significance by monitoring membership variation, while optimization-based approaches utilize genetic algorithms [
20] and particle swarm optimization for dynamic feature weight modification. We chose GKFCM [
8] and VWKFC [
21] for consideration in our work due to their proven efficacy in process mining applications. The experiments presented in
Section 6.6 demonstrate that GKFCM and VWKFC enhance the compactness of the clusters, as well as their resistance to noise, but are unable to effectively manage the relationship between the sequence and time dimensions. Our proposed method bridges this gap by providing an adjustable
parameter that enhances both flexibility and the measurement of clustering quality.
Semi-supervised fuzzy clustering techniques enable researchers to integrate partial supervision by labeling data points to enhance clustering results, as noted in [
18]. The Semi-Supervised Fuzzy C-Means method based on Feature-Weight and Cluster-Weight (SSFCM-FWCW) learning method, as well as other semi-supervised fuzzy clustering techniques, combines feature-weight learning and cluster-weight learning to improve membership accuracy by minimizing the influence of useless features [
16,
22]. Researchers have expended significant effort in developing explainable fuzzy clustering methods, including SHAP values and Local Interpretable Model-agnostic Explanations (LIME), as noted in [
11]. Combining these methods yields transparent outcomes in medical image processing and financial anomaly detection, as obtaining clarity about cluster processing is crucial for achieving maximum accuracy. Fuzzy clustering enables the reliable interpretation of decision outputs, offering significant value in brain MRI segmentation and automated fraud detection [
23].
By integrating fuzzy clustering with deep learning and meta-heuristic optimization, opportunities for improvements in clustering effectiveness were created. Alternative hybrid approaches are also used to dynamically optimize feature weights using genetic algorithms (GAs), particle swarm optimization (PSO), and artificial bee colony (ABC) [
20]. These methods dynamically adjust cluster centers and feature weights, enhancing performance in medical imaging, customer analysis, and predictive modeling [
24]. Deep-learning-based fuzzy clustering, similar to CNNs over BERT, has demonstrated superior feature representation capabilities in complex datasets, thereby improving customer segmentation and predictive modeling [
25]. However, as research progresses, the clustering robustness and adaptability are expected to strengthen in real-world applications via the fusion of fuzzy clustering to reinforcement learning and quantum computing [
26].
Unsupervised learning techniques need fuzzy clustering methods to enable data points to allocate membership degrees to various clusters during soft partitioning operations [
27]. The soft clustering approach, as implemented through fuzzy C-means, proves advantageous when working with complex, overlapped datasets because it differs from k-means clustering by allowing for flexible cluster boundaries. FCM emerged in 1981 from Bezdek’s work and still represents one of today’s principal fuzzy clustering techniques because it handles non-linearly separable data [
28].
Various modifications of FCM have been developed to improve its performance in terms of noise sensitivity, computational speed, and cluster initialization processes. The Possibilistic Fuzzy C-means (PFCM) algorithm eliminates the membership value sum requirement to 1, making it more resistant to noise [
29]. Implementing kernel functions within fuzzy clustering methods enables efficient data processing in high-dimensional spaces, as noted in [
30]. Unsupervised optimal fuzzy clustering methods now optimize cluster number identification in heterogeneous data environments by avoiding pre-assumed conditions [
31].
The computational technique viewpoint-based kernel fuzzy clustering (VWKFC) combines density-based initializations with weight information granules to enhance cluster accuracy and address noisy data conditions [
30]. The method delivers improved computational operational speed and enhanced interpretability, enabling it to process extensive datasets.
Fuzzy clustering is applicable across multiple domains because it effectively models uncertain and overlapping patterns in complex datasets. Implementing fuzzy clustering in decision support systems enables adaptive reasoning abilities and real-time data classification, thereby enhancing systems related to intelligent recommendations and alertings [
30]. Medical imaging technologies receive better segmentation results through this method because it addresses unclear boundaries and intensity fluctuations [
10,
23]. Fuzzy clustering is a critical tool for monitoring industrial processes by detecting faults through its ability to model process states that transition gradually [
32]. Fuzzy clustering algorithms applied to IoT systems enhance routing performance by adjusting network conditions in dynamic environments with numerous sensors [
33]. Healthcare applications utilize fuzzy clustering to support diagnostics and predict chronic diseases through modified health state evaluation tools that more effectively detect subtle changes in patient data [
26,
34]. The wide range of applications underlines how fuzzy clustering performs effectively in various technical and decision-related situations.
Despite its widespread adoption, fuzzy clustering still faces several challenges, including determining the optimal number of clusters, which is a crucial problem for researchers. The research field presents Triple Center Relation indices as a solution to enhance cluster validation methods [
21]. Secondly, scalability remains a problem because kernel-based approaches enhance cluster flexibility by adding a substantial computing workload that affects big data implementations [
30]. Finally, integrating fuzzy clustering with reinforcement learning and quantum computing is a growing research direction that aims to enhance model adaptability and interpretability in real-world applications. Deep learning models with neural structures serve as components alongside learning algorithms that automatically modify cluster organization and determine feature significance, yielding improved results in various domains [
20,
24,
26].
The accuracy of clustering increases through variance-based weighting, which assigns higher priorities to attributes with greater cluster-wide variation for separation purposes. The emphasis of entropy-based methods is on reducing uncertainty through the selection of features that demonstrate beneficial alignment patterns within clusters. The weighting scheme based on membership degrees enables a scale-up of feature importance depending on membership variations, thereby improving cluster discrimination. The optimization process finds the optimal feature weights through dynamic searches conducted by metaheuristic algorithms, including genetic algorithms (GAs) and particle swarm optimization (PSO), to optimize clustering outcomes. Optimization-based methods offer maximum flexibility and prediction accuracy in clustering but consume more computational resources than variance-based methods, which achieve good system performance while operating efficiently.
2.2. Clustering in Process Mining
The data-driven method of process mining enables the extraction of event logs for analysis, thereby enhancing the effectiveness of real-world processes. The technology reveals operational efficiency metrics and demonstrates how organizations obey predefined models and detect anomalies [
35]. The automated discovery of real-time process analysis through process mining diverges from traditional business process modeling, where manual workflow definition rules apply [
36].
Different fields utilize fuzzy clustering techniques in decision support systems, medical imaging, and industrial process monitoring applications. Fuzzy clustering allows IoT-based systems to optimize routing in extensive sensor networks via its capability to handle unpredictable and dynamic network situations [
33]. Fuzzy clustering techniques enhance healthcare by improving health state evaluation models, resulting in more accurate diagnoses and predictive analytics for managing chronic conditions [
32].
Process mining benefits from fuzzy clustering techniques because they enhance traditional clustering analysis, allowing for the effective assessment of trace clustering variants and execution patterns. Hard clustering techniques, including k-means, present difficulties in detecting overlapping and changing information process patterns [
37]. The fuzzy clustering method allows process instances to be affiliated with multiple clusters, where the degree of membership influences their assignments.
Process analysis remains incomplete when the approach is used with either sequence-based or time-based clustering methods independently. Recorded activities with matching sequences exhibit different execution speeds due to varying system wait times and resource distribution patterns, whereas processes executing within comparable periods display structural differences. Process instance evaluation becomes more comprehensive by combining sequence-based and cycle time measures in clustering techniques. The field has recognized how multidimensional clustering techniques enhance both trace group quality assessment and variant detection performance [
4,
5]. Including process duration with sequence analysis enables researchers to more easily evaluate deviations and performance limitations when analyzing complex operational event logs.
The clustering processes create essential functionality that lets process instances (a.k.a. cases or traces) be grouped based on their comparable patterns. The technique helps users understand process behavior variations better and creates more flexible process models [
38]. Process mining clustering methods exist in two forms, sequence- and time-based approaches, which analyze distinct aspects of process behavior patterns.
2.2.1. Sequence-Based Clustering Methods
The control-flow analysis of process instances relies on sequence-based clustering methods, which examine the arrangement and execution sequences of activities. Procedure variants, together with structural irregularities, become detectable through these methods.
The Damerau–Levenshtein distance represents the fewest operations, including insertions, deletions, substitutions, and transpositions, required for converting one sequence into another [
39]. It has been effectively applied in process mining and related fields to quantify trace similarity. For example, ref. [
40] used this metric to cluster legal case sequences in Brazilian labor courts based on procedural movements. In other domains, authors introduced a measure based on the Damerau–Levenshtein distance to compare declarative process models by focusing on the structure of traces, providing insights into process model similarities [
41]. Trace clustering serves as a tool for user behavior analysis in interactive systems [
42]. Ref. [
43] used Levenshtein-based similarity for understanding customer journeys by splitting cases with high variant frequency into at least two clusters.
The similarity value of two sets, according to the Jaccard coefficient, equals the proportion of elements found in both sets to the total number of distinct set members. Refs. [
44,
45] employed this method in their respective studies, which focused on electromechanical systems grouping, time-series energy forecasting, and overall process analysis workflow creation.
Hierarchical clustering methods enable trace clustering to group instances based on their control-flow similarities. Ref. [
46] introduced an automated system using genetic programming that creates trace clustering pipelines for automation purposes. Ref. [
46] demonstrated that building an end-to-end trace clustering pipeline involves steps such as feature encoding, dimensionality reduction, distance measures, and clustering algorithms.
2.2.2. Times-Based Clustering Methods
Time-based clustering methods analyze temporal process trace data by examining duration intervals, waiting periods, and whole cycle durations simultaneously. Time-series clustering creates groups of traces by assessing their time-dependent patterns. The authors of [
47] developed a time-series clustering model based on quantum theory principles. Ref. [
45] implemented short-term load forecasting through time-series clustering solutions incorporating the Jaccard consensus. The authors of [
48] developed a single MDS-based system that supports k-means clustering with dynamic time warping and additional distance measure types.
The widely applicable algorithm known as DTW enables time-series comparison through the non-linear alignment of sequenced data points with different lengths or speed rates. The authors of [
49] developed a new distance metric that utilizes dynamic time warping to achieve an enhanced temporal domain clustering performance. The authors of [
50] developed a weighted version of DTW for clustering traffic flow patterns. The collaboration with [
51] resulted in an enhanced framework that utilizes optimized dynamic time warping with hierarchical clustering to achieve improved time-series clustering results.
2.3. Identified Research Gap
The motivation behind this study is based on addressing several gaps identified in the literature:
Many existing clustering methods in process mining handle control-flow structures independently of temporal behaviors because they fail to integrate both dimensions into an effective algorithm.
Most existing approaches fail to provide a flexible control system that dynamically tunes the relationship between process loops and pattern identifications during clustering operations.
Real-world processes exhibit natural behavioral group overlap that hard clustering techniques from traditional methods cannot properly detect and handle.
The market demands clustering algorithms that provide operational understanding and adaptability to enhance the detection of anomalies and identification of bottlenecks while optimizing workflow effectiveness.
The application of FCM for process mining by using a sequence-time weighted framework shows significant gaps in exploration.
Previous clustering techniques in process analysis have pursued either control-flow examination or temporal characteristic evaluation as individual approaches. The research by [
3] employed Damerau–Levenshtein-based control-flow alignment, whereas [
7] relied on Jaccard similarity, excluding timing aspects from their work. The research in [
4] demonstrated a time-based clustering method through dynamic time warping, yet discarded sequence structural elements. The combination of the method in [
8] with Gaussian-kernel FCM and the method in [
30] with viewpoint-based kernel fuzzy clustering enhanced cluster cohesion but failed to provide mechanisms for balancing the control-flow and timing dimensions.
The proposed novel framework creates a unified model that combines sequence and time features through a fuzzy clustering method, utilizing an adjustable
parameter. The proposed weighting control system enables users to dynamically switch between structural and performance clustering, thereby providing more interpretable results than [
8,
30].
3. Preliminaries of Fuzzy C-Means
Dunn [
52] proposed and Bezdek [
28] improved the fuzzy c-means (FCM) method, one of the most famous fuzzy clustering algorithms [
53]. FCM is a clustering algorithm that allows data points to belong to multiple clusters with varying degrees of membership. Unlike crisp clustering methods such as K-Means, FCM assigns each data point a membership value indicating its degree of association with each cluster.
Let be a dataset containing N data points, where each represents a d-dimensional feature vector. The objective of FCM is to partition X into C clusters by minimizing an objective function.
Each data point belongs to multiple clusters with a degree of membership. The membership matrix
U is defined in Equation (
1):
where
represents the membership of data point
in cluster
i, subject to the constraint in Equation (
2).
Let
be the set of cluster centers, where each
represents the centroid of the
i-th cluster. FCM minimizes the following objective function in Equation (
3).
where
is the fuzziness coefficient that controls the degree of fuzziness in the clustering and
is the Euclidean distance between data point
and cluster center
.
The minimization of
is performed iteratively using the following update rules in Equations (
4) and (
5).
4. Methodology
The FCM algorithm follows a systematic approach. It begins by randomly initializing the membership matrix U, ensuring that the sum of memberships for each data point equals 1. Next, the algorithm computes the cluster centers using the membership update rule. Following this, the membership values are updated based on the membership function. This process is repeated until convergence is reached, typically defined as when the change in the membership matrix falls below a predetermined threshold.
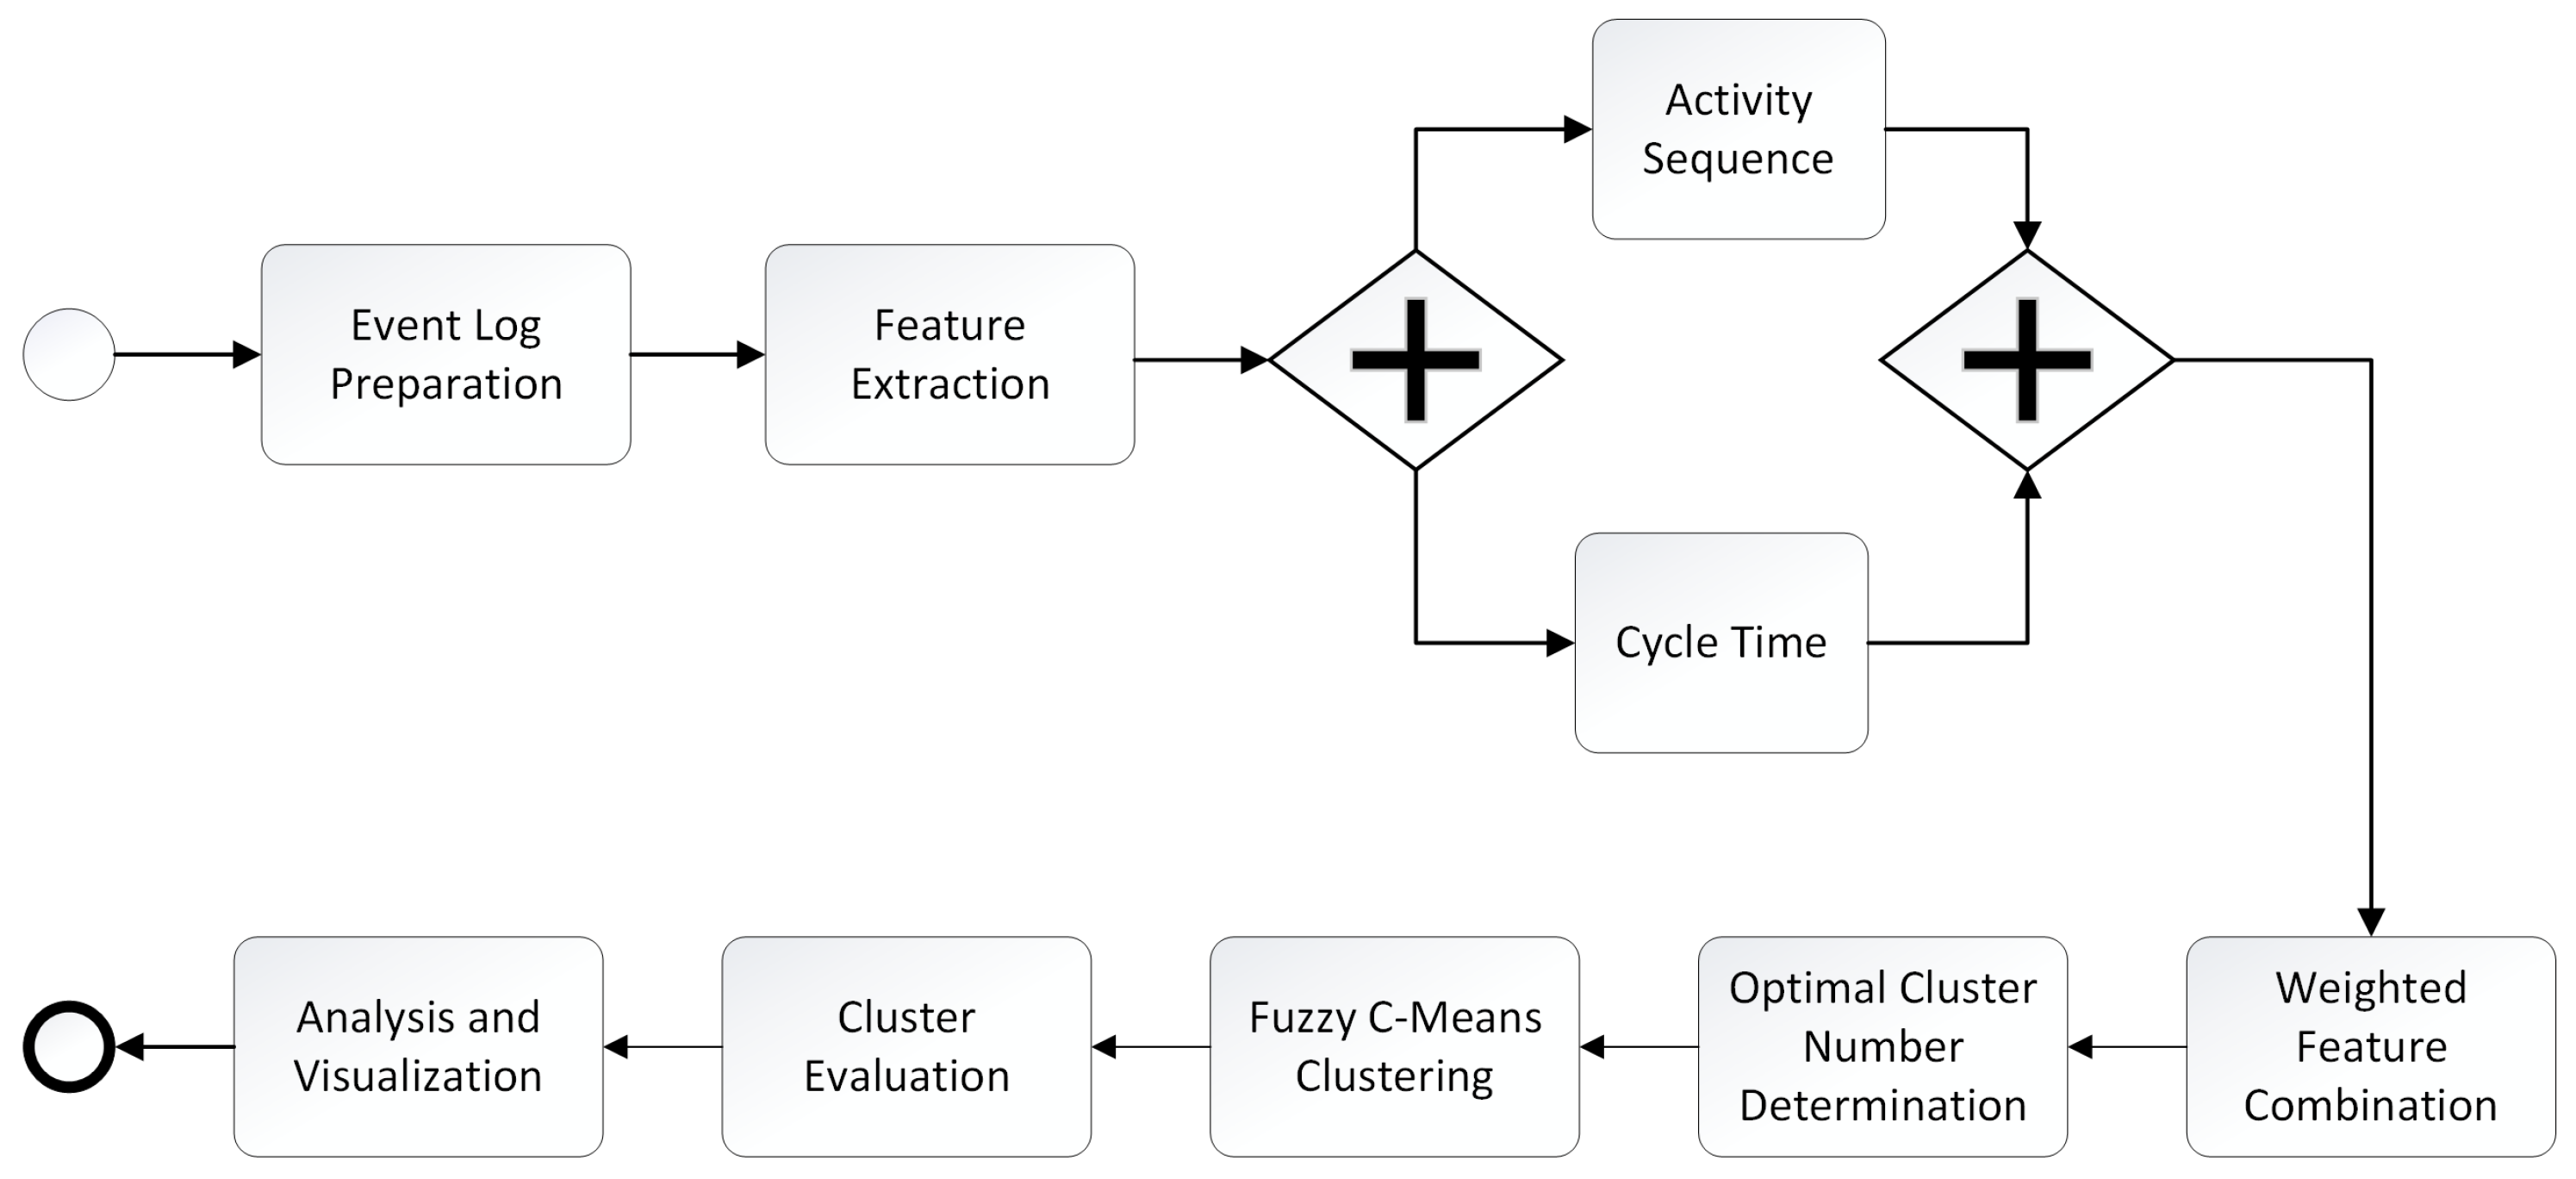
This research proposes a novel process clustering approach that integrates sequential and temporal process characteristics. The methodology leverages fuzzy c-means clustering to group process instances based on their activity sequences and cycle times. It offers a more comprehensive understanding of process behavior than traditional methods, which focus solely on one dimension.
Figure 1 describes the methodology.
The initial step involves acquiring and preparing the event log data. Event logs are imported in XES format using the PM4Py (library
https://github.com/process-intelligence-solutions/pm4py, accessed on 12 April 2025). Each event trace within the log represents a single process instance, characterized by a sequence of activities and an overall cycle time.
To prevent data quality issues from distorting the clustering results, an explicit cleansing phase is performed before TF-IDF vectorization and cycle-time normalization.
Each trace is first inspected for missing activity labels. If at least one null token is detected, the corresponding trace is removed, because the sequence-distance metrics rely on complete ordering information; fewer than 1% of cases are affected by this rule.
Attention is then turned to missing timestamps and the resulting absence of cycle-time values. When only the final timestamp is unavailable, the trace is retained and the cycle time is imputed with the median duration of its variant (the set of traces that share an identical activity sequence), provided that the variant contains at least five complete instances. Otherwise, the incomplete trace is discarded. Approximately one percent of traces undergo this treatment.
The distribution of cycle-time outliers is subsequently examined. Durations are log-transformed to reduce right-skewness, after which Tukey’s rule—values beyond the upper quartile plus 1.5 inter-quartile ranges—is applied. Observations outside this envelope are not deleted; instead, they are transformed to the nearest fence value, thereby preventing a small number of exceedingly long cases from dominating the distance computations. Roughly 2.5% of cycle-time entries are adjusted in this manner.
Very rare activity labels—tokens occurring in fewer than 0.05% of traces—are finally consolidated into a single “” symbol to limit sparsity in the TF-IDF space without erasing infrequent but potentially meaningful behavior.
The event log data are then transformed into numerical features suitable for clustering. Two key features are extracted. First, the activity sequence for each process instance is represented using Term Frequency-Inverse Document Frequency (TF-IDF) vectorization. This technique converts the sequence of activities into a numerical vector, capturing the relative importance of different activity combinations within the dataset. Character n-grams were used to vectorize the sequences. Second, the cycle time for each process instance, representing the overall duration of the process, is extracted and normalized using a standard scaler to ensure that it contributes proportionally to the clustering process.
A weighted approach is employed to combine the sequence and temporal features. An alpha parameter (
) is introduced to control the relative importance of each feature type. The hybrid distance
is calculated using Equation (
6) for any pair of traces
.
where
and
are, respectively, the TF-IDF sequence vector and the normalized cycle time of trace I.
controls the influence of activity sequences vs. cycle time. It ranges from 0 to 1, with
representing a purely sequence-based clustering and
representing a purely time-based clustering. In practice,
acts as a tunable knob that balances structural and temporal viewpoints. Following a neutral-weighting principle and preliminary experiments, the
value of 0.5 is chosen as the study’s focal point because it assigns equal importance to each dimension while still allowing sensitivity analysis around this value. Moreover, the a priori neutral assumption is that both behavioral dimensions are equally important when no domain bias exists, which mathematically corresponds to
.
Employing the elbow method in conjunction with the Silhouette score and the Calinski–Harabasz Index, the determination of the number of clusters is adaptively achieved. Three key metrics are utilized to assess the impact of cluster numbers: the Within-Cluster Sum of Squares (WCSS), the Silhouette coefficient, and the Calinski–Harabasz score. These metrics are analyzed in tandem to ensure a balance between compactness and separation within the data. The number of clusters is then adaptively set, depending on the minimum difference found.
FCM clustering is applied to the combined feature vectors to group process instances into clusters. FCM allows each process instance to belong to multiple clusters with varying degrees of membership, reflecting the inherent uncertainty and overlap in process behavior. FCM has the advantage of processing a dataset where a single data point may belong to two or more clusters. Following standard practice in FCM, the fuzziness coefficient was fixed at
, a setting that strikes a stable balance between crisp (
) and overly diffuse (
) partitions. This value was adopted in the seminal work of Bezdek [
28] and remains the default in most recent applications and software implementations [
6,
8,
29].
The quality of the resulting clusters is evaluated using the Davies–Bouldin Index (DBI) and the Silhouette score. These metrics offer insights into the separation and compactness of the clusters, enabling an assessment of the effectiveness of the proposed clustering approach.
Finally, the resulting clusters are analyzed to identify patterns and trends in process behavior. Visualization techniques, such as scatter plots, illustrate the characteristics of different clusters and highlight the relationship between activity sequences, cycle times, and cluster assignments. The proposed framework enables the representation of process instances in distinct clusters based on their temporal and sequence characteristics.
5. Illustrative Example
The dataset in
Table 1 consists of cases, or process instances, characterized by a sequence of activities and corresponding cycle times. The aim is to implement a clustering method that integrates sequence patterns and temporal dimensions, transcending traditional clustering techniques that typically analyze these dimensions in isolation.
Sequence-based FCM considers only the sequence of activities. It assigns cases with the same activity sequence (“A-B-C” or “A-C-D”) to a single cluster, regardless of variations in cycle time. It creates two clusters, including cases with A-B-C sequences (Cases 1–8) and cases with A-C-D sequences (Cases 9–14). While this approach provides insights into process structure, it overlooks variations in execution time, which can be critical for performance analysis and optimization.
Time-based FCM incorporates only cycle time. Cases with identical sequences but significantly different cycle times (“A-B-C” with 3–6 min vs. 20–24 min) are assigned to different clusters. It creates two clusters, which include cases with average cycle times of 3–6 or 18–24 min. This refinement enables differentiation based on execution efficiency but does not fully capture the interplay between sequence and cycle time.
The proposed method’s FCM simultaneously considers both sequence and cycle time, creating more granular clusters. For example, within the “A-C-D” sequence, cases with shorter cycle times (4–6 min) are grouped separately from those with significantly longer cycle times (18–21 min). This creates four clusters. Two of them are due to sequence-based categorization. Considering the time dimension for both the A-B-C and A-C-D rankings leads to two more clusters. This approach enhances the interpretability of process variations by distinguishing between structural and temporal deviations.
Integrating both sequence and temporal analysis unveils deeper insights into process performance, as cases exhibiting identical sequences but varying cycle times may indicate operational inefficiencies, bottlenecks, or discrepancies in resource allocation; by employing a dual-focused clustering method, one can discern not only structural similarities but also variances in performance, ultimately facilitating enhanced process optimization strategies and enabling the identification of process variants that are distinct both structurally and temporally and significantly contribute to root cause analysis, such as addressing the question of why certain A-C-D cases exhibit extended cycle times. This discrepancy may suggest the presence of a rework loop or variations in resource allocation not reflected solely in the activity sequence.
Furthermore, the proposed method offers control over the relative influence of activity sequences versus cycle time through a weighted distance function approach; specifically, setting enables purely sequence-based clustering, setting facilitates exclusively time-based clustering, while values between 0 and 1 allow for differential weighting of sequence and cycle time contributions to the clustering process.
6. Experimental Study
This section describes the dataset used in the experimental study, investigates the weighting between activity sequence and case duration, and compares sequence- and cycle-time-based clustering with the proposed methodology.
6.1. Dataset Description
The case study revolves around a company’s telephone repair process (
https://promtools.org/prom-6-tutorial/introduction/#running_example, accessed on 25 April 2025). The procedure begins with the registration of a telephone sent by a customer. Once registered, the phone is passed on to the Problem Detection department, where it is examined and the defect classified into one of ten possible categories. After identifying the issue, the phone is forwarded to the Repair department and the customer is notified with a letter regarding the problem.
The Repair department has two teams; one specializes in fixing simple defects, while the other handles more complex issues. However, both teams can address specific defect categories. Once a technician completes a repair, the phone is sent to the Quality Assurance department for evaluation to ensure the defect has been resolved. If the issue persists, the phone is returned to the Repair department. If the repair is successful, the case is closed and the phone is returned to the customer. The company limits the number of repair attempts for each defect to minimize delays. If a defect cannot be fixed after the allowed attempts, the case is archived and a brand-new phone is provided to the customer.
The presented dataset quantitatively characterizes an observed telephone repair process derived from event log analysis. The event log encompasses a total of 1043 distinct process instances, commonly referred to as cases. Within these cases, 7335 individual events were recorded, representing the execution of specific activities. The event log consists of eight unique activity types, indicating the tasks performed during the repair process.
Analysis of the temporal dimension reveals key performance indicators regarding process cycle time. The mean cycle time across all observed cases is 66 min, while the median cycle time is 62 min. The proximity of the mean and median suggests a relatively symmetrical distribution of cycle times. However, the slightly higher mean indicates the presence of some longer-duration cases that exert an influence on the average. The range of cycle times observed is significant, spanning from a minimum of 11 to 160 min, which highlights the considerable variability in process execution time. This suggests that time should also be considered when performing case clustering.
Further investigation into the control-flow perspective identifies dominant behavioral patterns known as process variants. Notably, three specific variants collectively account for 52.63% of all executed cases, signifying common pathways through the process model. The most frequent variant, representing 23.97% of instances, follows the sequence [‘Analyze Defect’, ‘Repair (Complex)’, ‘Inform User’, ‘Test Repair’, ‘Archive Repair’]. The second most prevalent variant (18.5% of cases) exhibits a similar structure involving complex repair. Still, it alters the sequence to [‘Analyze Defect’, ‘Inform User’, ‘Repair (Complex)’, ‘Test Repair’, ‘Archive Repair’], differing primarily in the timing of user notification relative to quality testing. The third variant, constituting 10.16% of cases, involves the simple repair pathway: [‘Analyze Defect’, ‘Inform User’, ‘Repair (Complex)’, ‘Test Repair’, ‘Archive Repair’]. These dominant variants offer insight into the most typical operational sequences for resolving simple and complex defects within the studied process. The remaining approximately 47% of cases follow less frequent (less than 10%) execution paths, involving rework loops or other deviations from these primary variants.
6.2. Experimental Environment
All experiments were conducted on a workstation equipped with an Intel Core i7-12700F CPU (8 P-cores + 4 E-cores, 25 MB cache, 4.9 GHz maximum turbo) and 32 GB of RAM, running Ubuntu 22.04 LTS (64-bit).
The source code was written in Python 3.11 and run inside a Conda 23.11 environment.
Event-log handling relied on PM4Py 2.7.4, vectorization on scikit-learn 1.4.2 (TF-IDF), and numeric processing on NumPy 1.26.4 and pandas 2.2.1.
The fuzzy C-means implementation was provided by scikit-fuzzy 0.6.0, while visualizations were generated using Matplotlib 3.8.4.
6.3. Choosing the Optimum Alpha Value
The study performed a grid search for
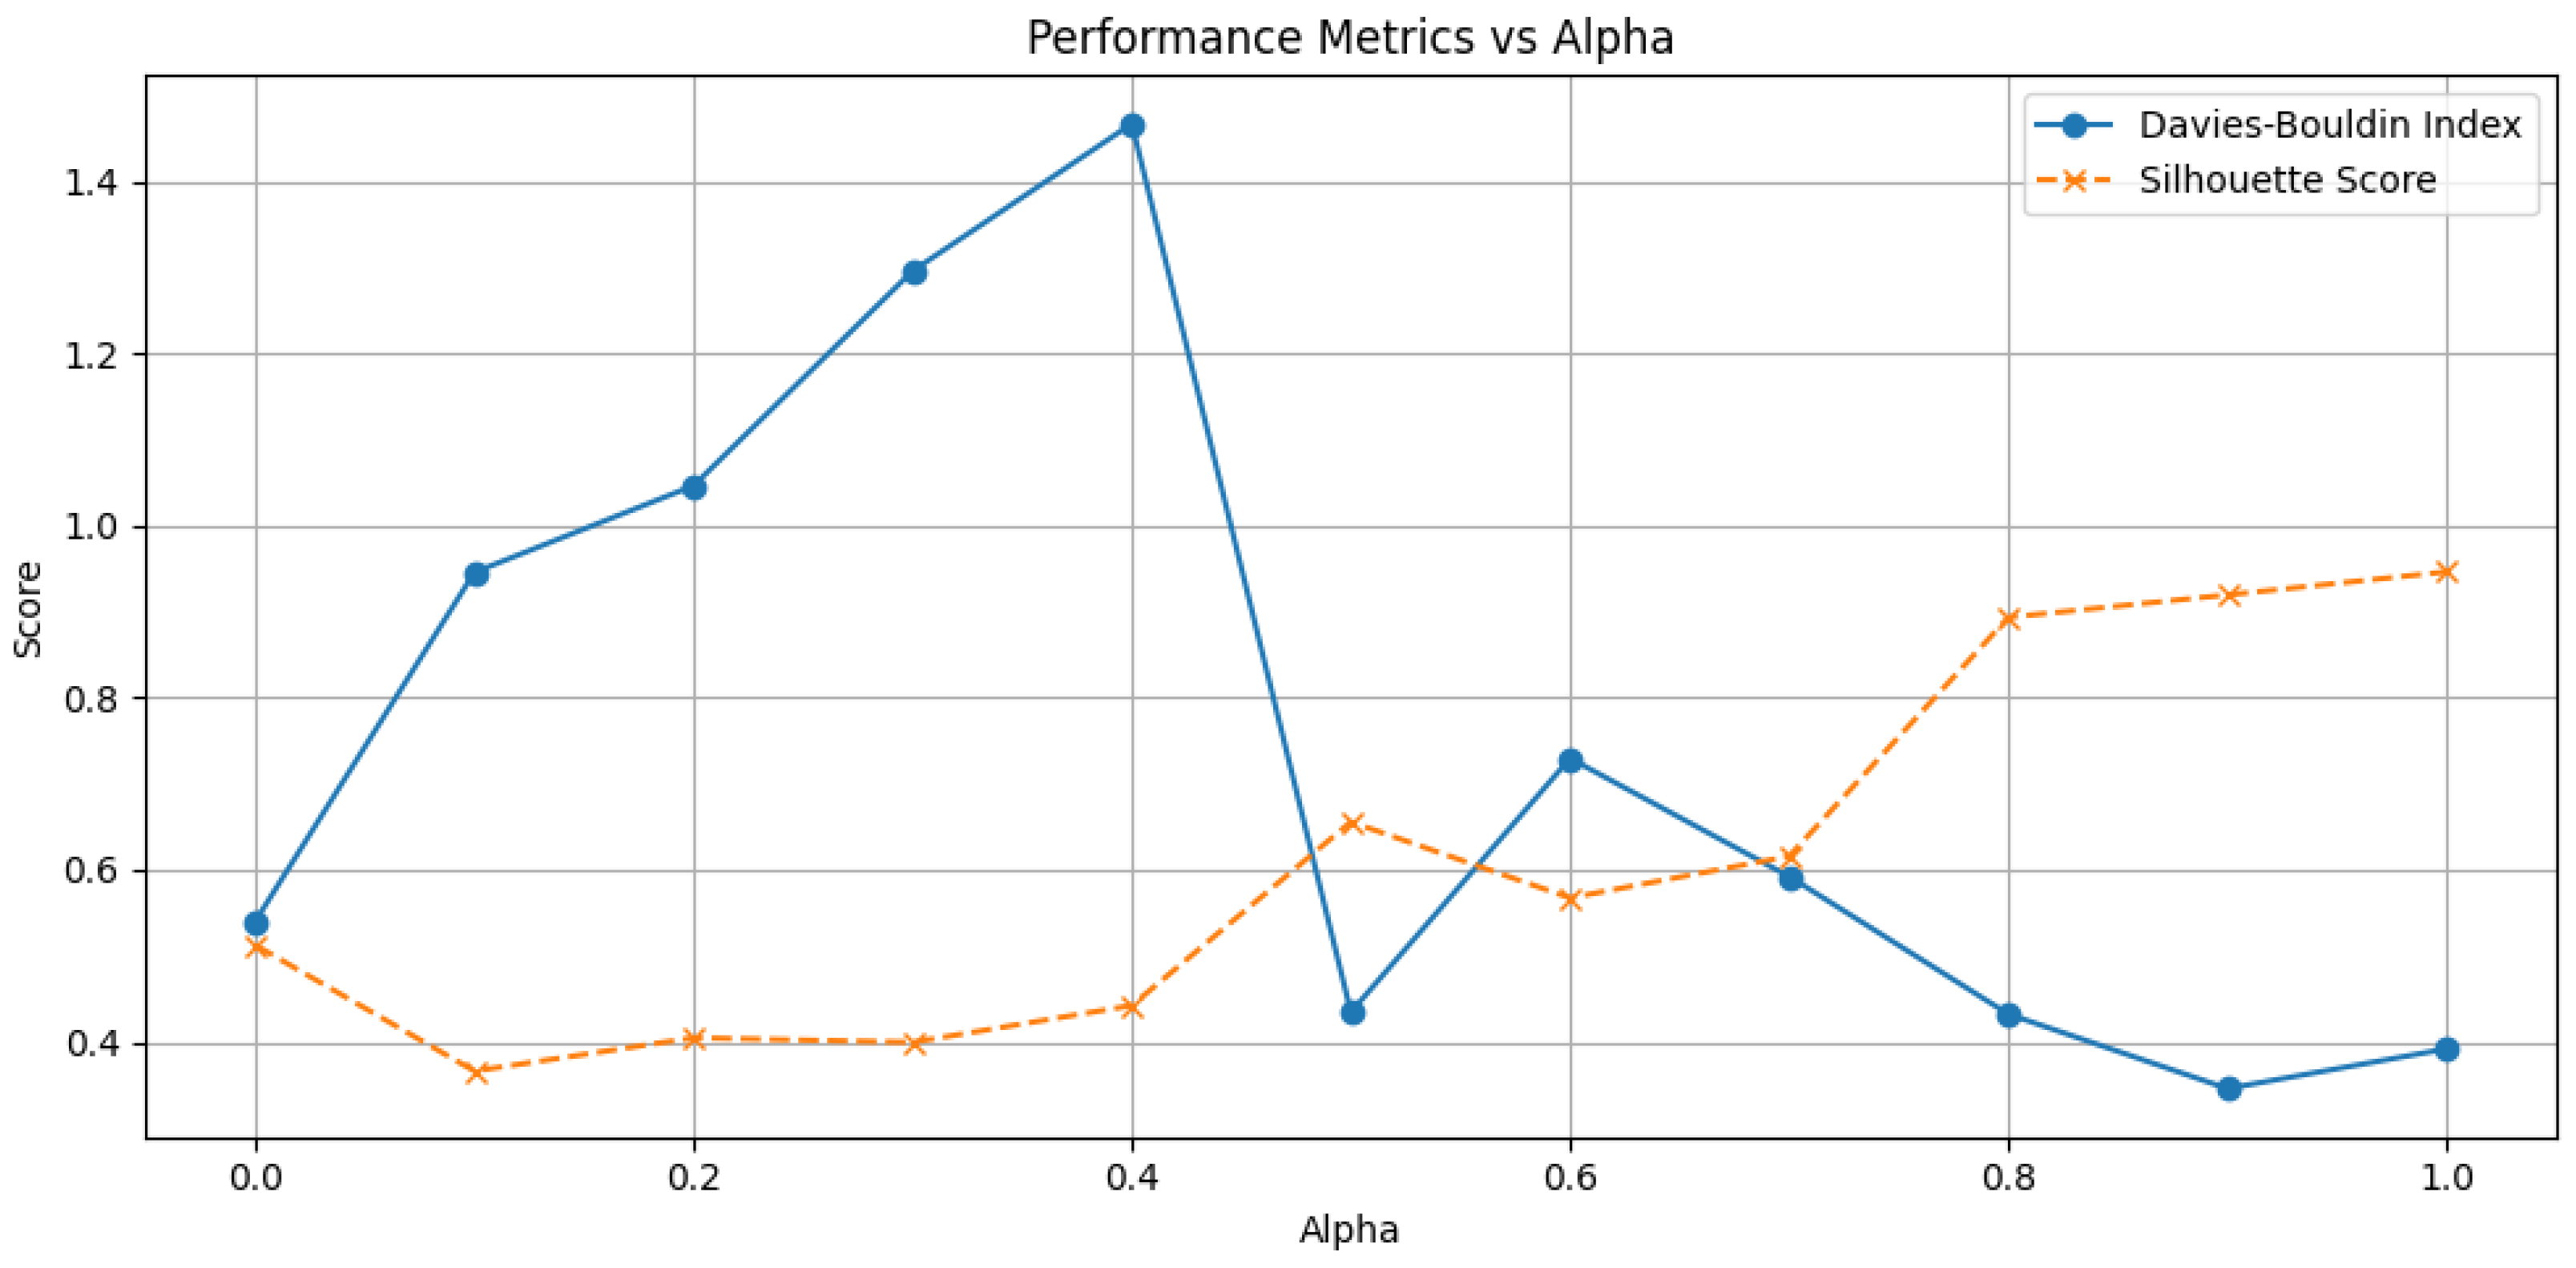
and evaluated each setting using the Silhouette score and Davies–Bouldin Index (DBI). The DBI measures cluster separation, where lower values indicate better-defined and more distinct clusters. In contrast, the Silhouette score assesses clustering quality, with higher values suggesting well-separated and compact clusters.
Figure 2 shows how varying the
parameter, which determines the weighting between activity sequence and case duration, affects clustering performance.
The analysis reveals that pure time-based clustering () resulted in 10 clusters, with a DBI of 0.4933 and a Silhouette score of 0.5456, indicating moderately well-separated clusters. As increases, clustering quality fluctuates. At , the algorithm produced only five clusters, achieving a Silhouette score of 0.7036, which suggests more compact and well-defined clusters.
The interval of 0.4 and 0.5 constitutes a transition zone in which the optimization routine switches from a time-dominated to a balanced distance structure. At , the time component still prevails and the Silhouette model’s selection step therefore favors 10 small clusters whose boundaries are driven mainly by cycle-time similarity. Although many of these clusters exhibit compact internal variance, their pair-wise separation is weak because identical activity sequences can appear in several clusters; the resulting average Silhouette score is consequently modest. Once reaches 0.5, sequence information is given equal weight; the elbow criterion collapses the 10 time-based micro-clusters into five larger but mutually well-separated groups that respect both temporal and structural differences. This coarser yet cleaner partition increases the Silhouette score by approximately 0.70. Beyond , the distance measure becomes increasingly dominated by sequence similarity; additional gains are therefore smaller and follow a smoother gradient.
Higher values (0.8–1.0), which emphasize activity sequences, yielded the best clustering performance. The best balance was achieved at , with a DBI of 0.4167 and a Silhouette score of 0.9214, indicating well-separated and compact clusters. At , where only sequence information is considered, the Silhouette score reached its highest value (0.9444). However, the DBI increased slightly to 0.7581, suggesting that while clusters were internally well-formed, some overlap might exist.
The results indicate that clustering effectiveness improves when (); however, this comes at the cost of ignoring cycle time, which reduces the ability to consider both inputs simultaneously. A more balanced approach is achieved when , where the Silhouette score increases steadily, except for a temporary drop in the next step, while the DBI decreases dramatically before experiencing a brief increase. This pattern suggests that corresponds to a local optimum, where the clustering solution effectively balances sequence and time information.
6.4. Comparison with Sequence-Based FCM
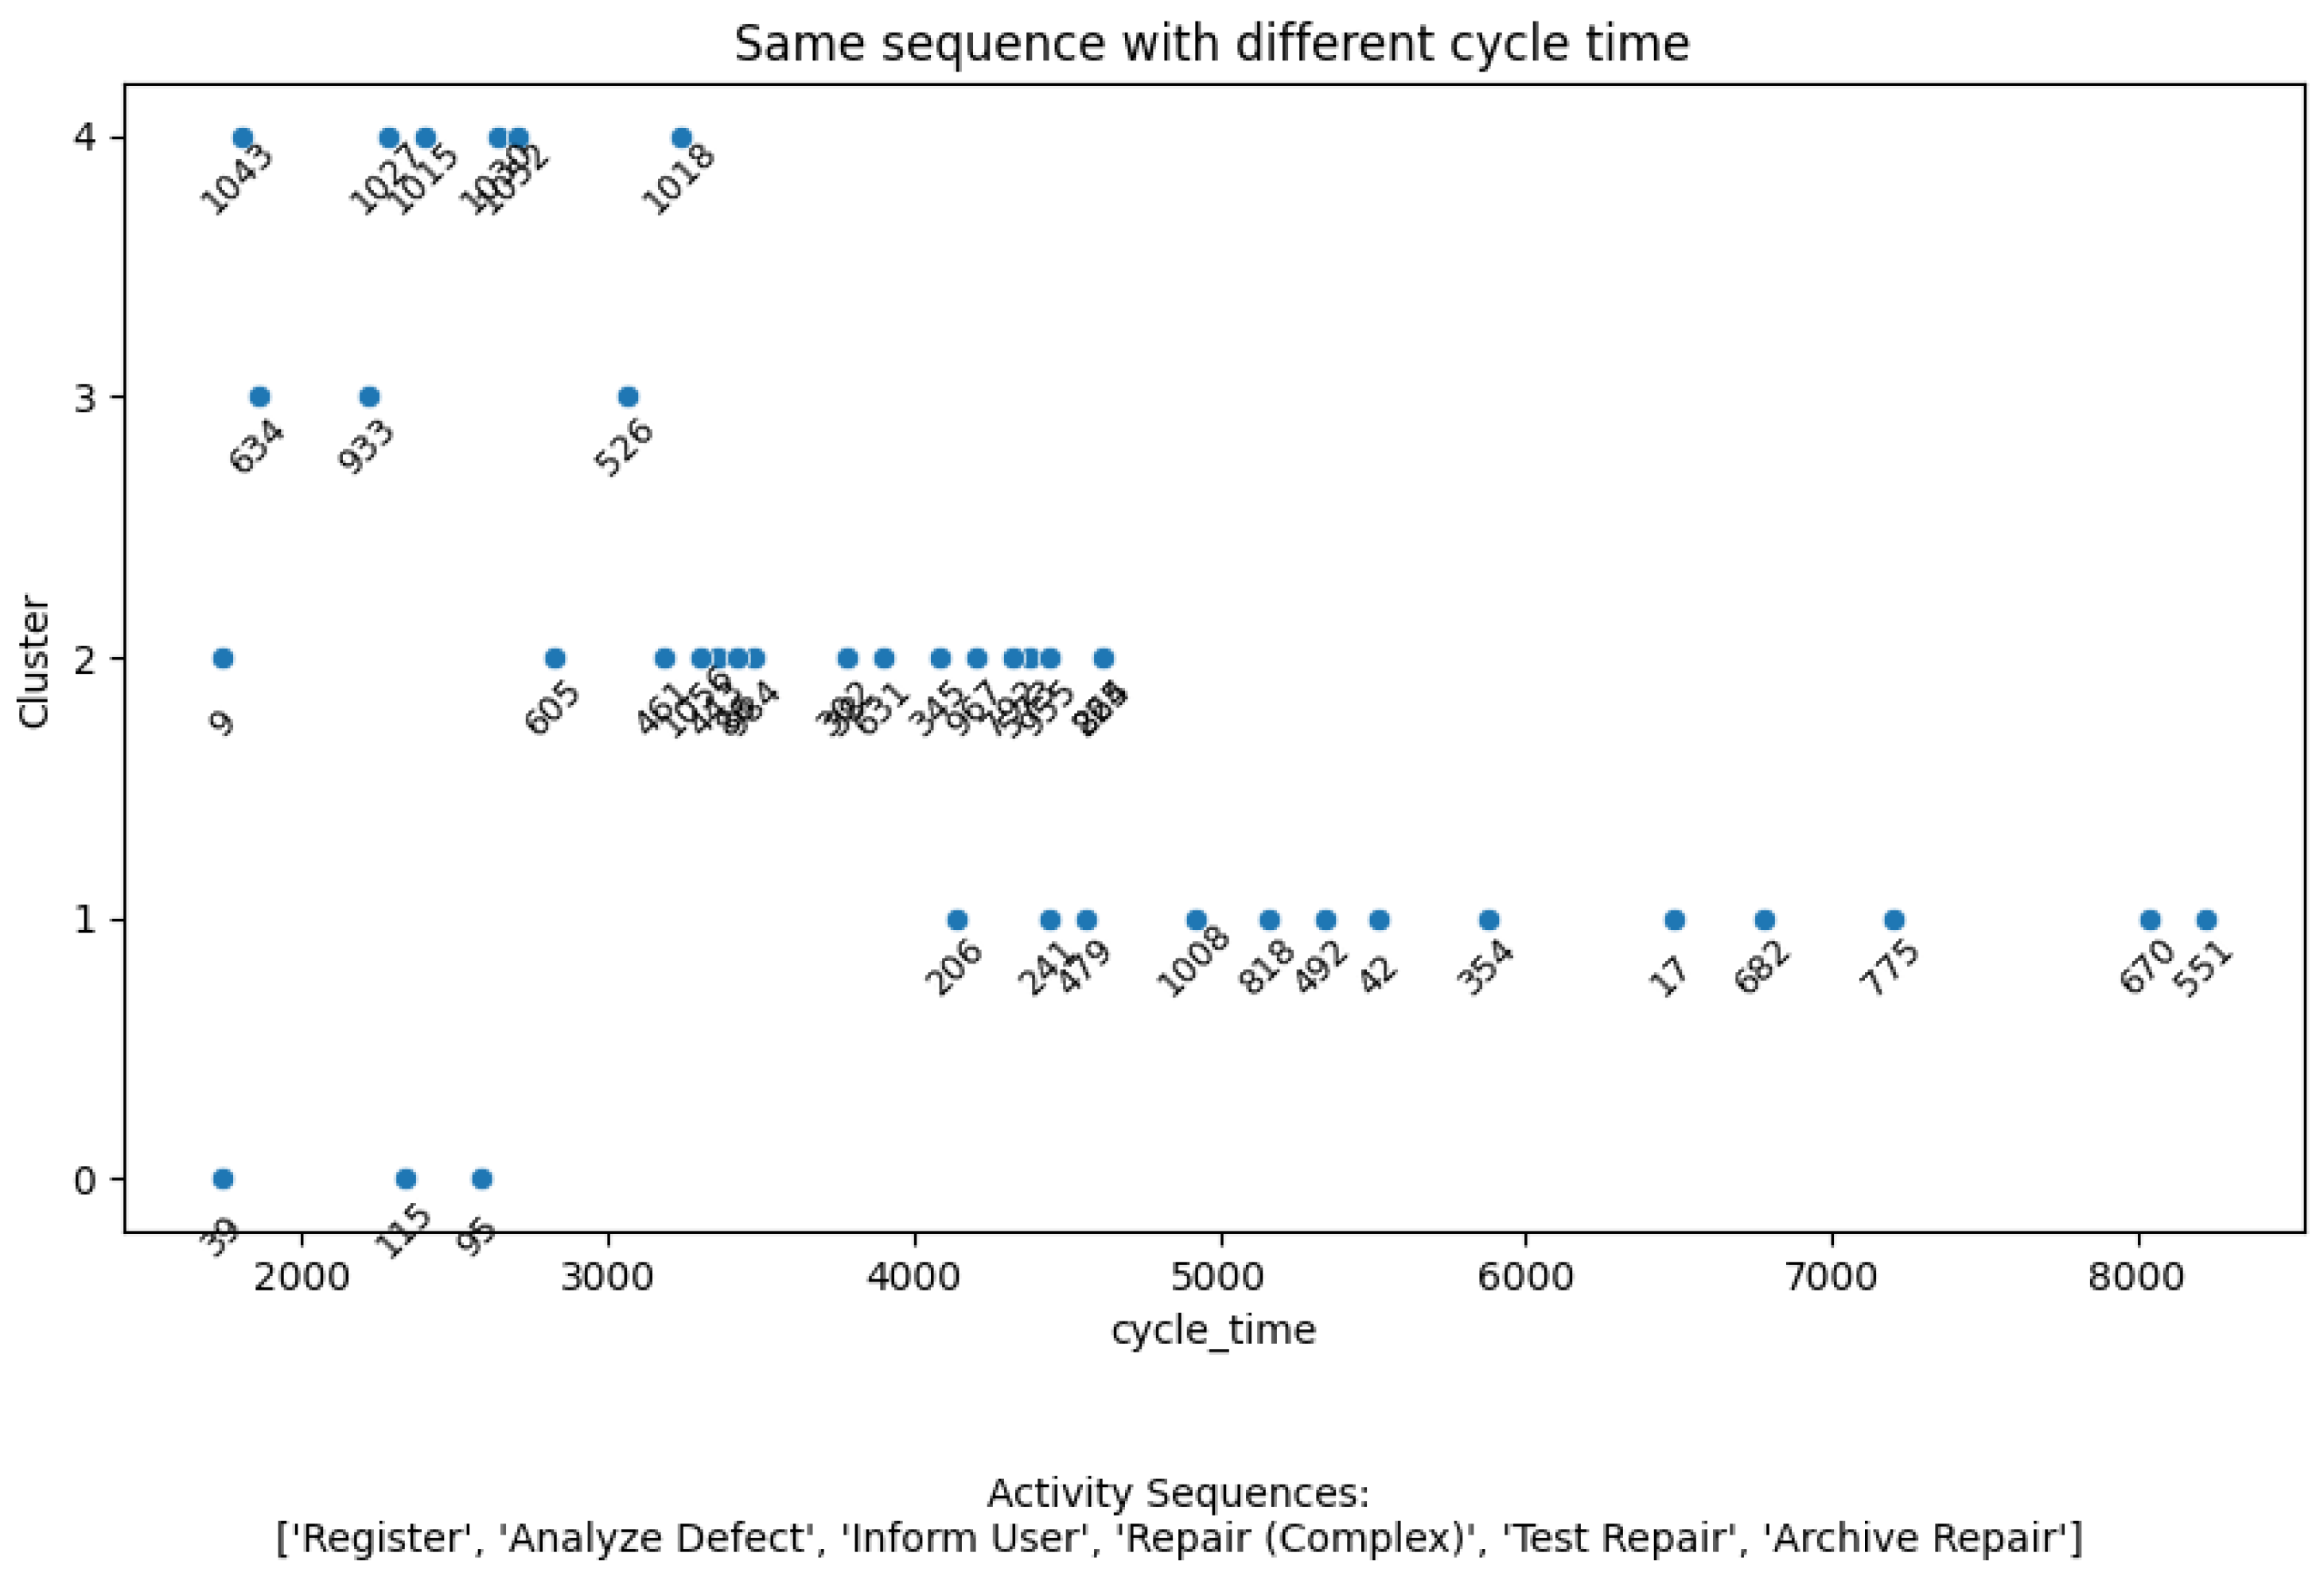
Figure 3 presents a comparative analysis between sequence-based FCM clustering (
) and a proposed method that employs a combined sequence and cycle time approach (
). It aims to highlight and explore variations in cycle time for processes that follow the same sequence of activities and to observe how these instances are grouped into clusters based on their temporal characteristics. The x-axis represents cycle time, likely measured in minutes, indicating the total time taken for a process instance. The y-axis represents the cluster assignment, with each data point belonging to one of several clusters identified by the clustering algorithm. Each point corresponds to a specific process instance. The case ID for each process instance is displayed near each data point, allowing for the identification of specific instances within the plot. There is an overlap if different cases have equal cycle times, such as case IDs 302 and 38, which each have a cycle time of approximately 3800 min. The text at the bottom indicates the activity sequence examined: Register, Analyze Defect, Inform User, Repair (Complex), Test Repair, and Archive Repair. It suggests that, despite following the same sequence of activities, the process instances vary in their overall completion time and fall into different clusters based upon this variation.
The compelling insight from this figure lies in demonstrating the enhanced discriminatory power of the proposed method. Had we solely relied on sequence-based FCM (), as the annotation implies, all process instances sharing the same activity sequence—“Register, Analyze Defect, Inform User, Repair (Complex), Test Repair, Archive Repair”—would have been grouped into a single cluster. Such an outcome would have masked the significant variations in process duration, treating all instances as homogeneous despite potentially vastly different cycle times.
However, by integrating cycle time into the clustering process (), the proposed method generates a richer, more nuanced representation of the process landscape. The observed scatter of points across multiple clusters reveals that instances with identical activity sequences are differentiated based on temporal behavior. This is crucial for understanding process inefficiencies and bottlenecks. For example, instances falling into clusters with higher cycle times may warrant further investigation to identify the factors contributing to their slower execution. The ability to distinguish process instances based on cycle time, even within a shared sequence, provides a significant advantage, enabling more targeted process optimization and improvement efforts. Thus, the proposed method unlocks insights that would remain hidden under a purely sequence-based clustering approach, highlighting its value and contribution to process mining and analysis. The distribution shows that when cycle time is considered, we can obtain a more diverse data partitioning that would not be evident if only the activity sequences were considered.
6.5. Comparison with Cycle-Time-Based FCM
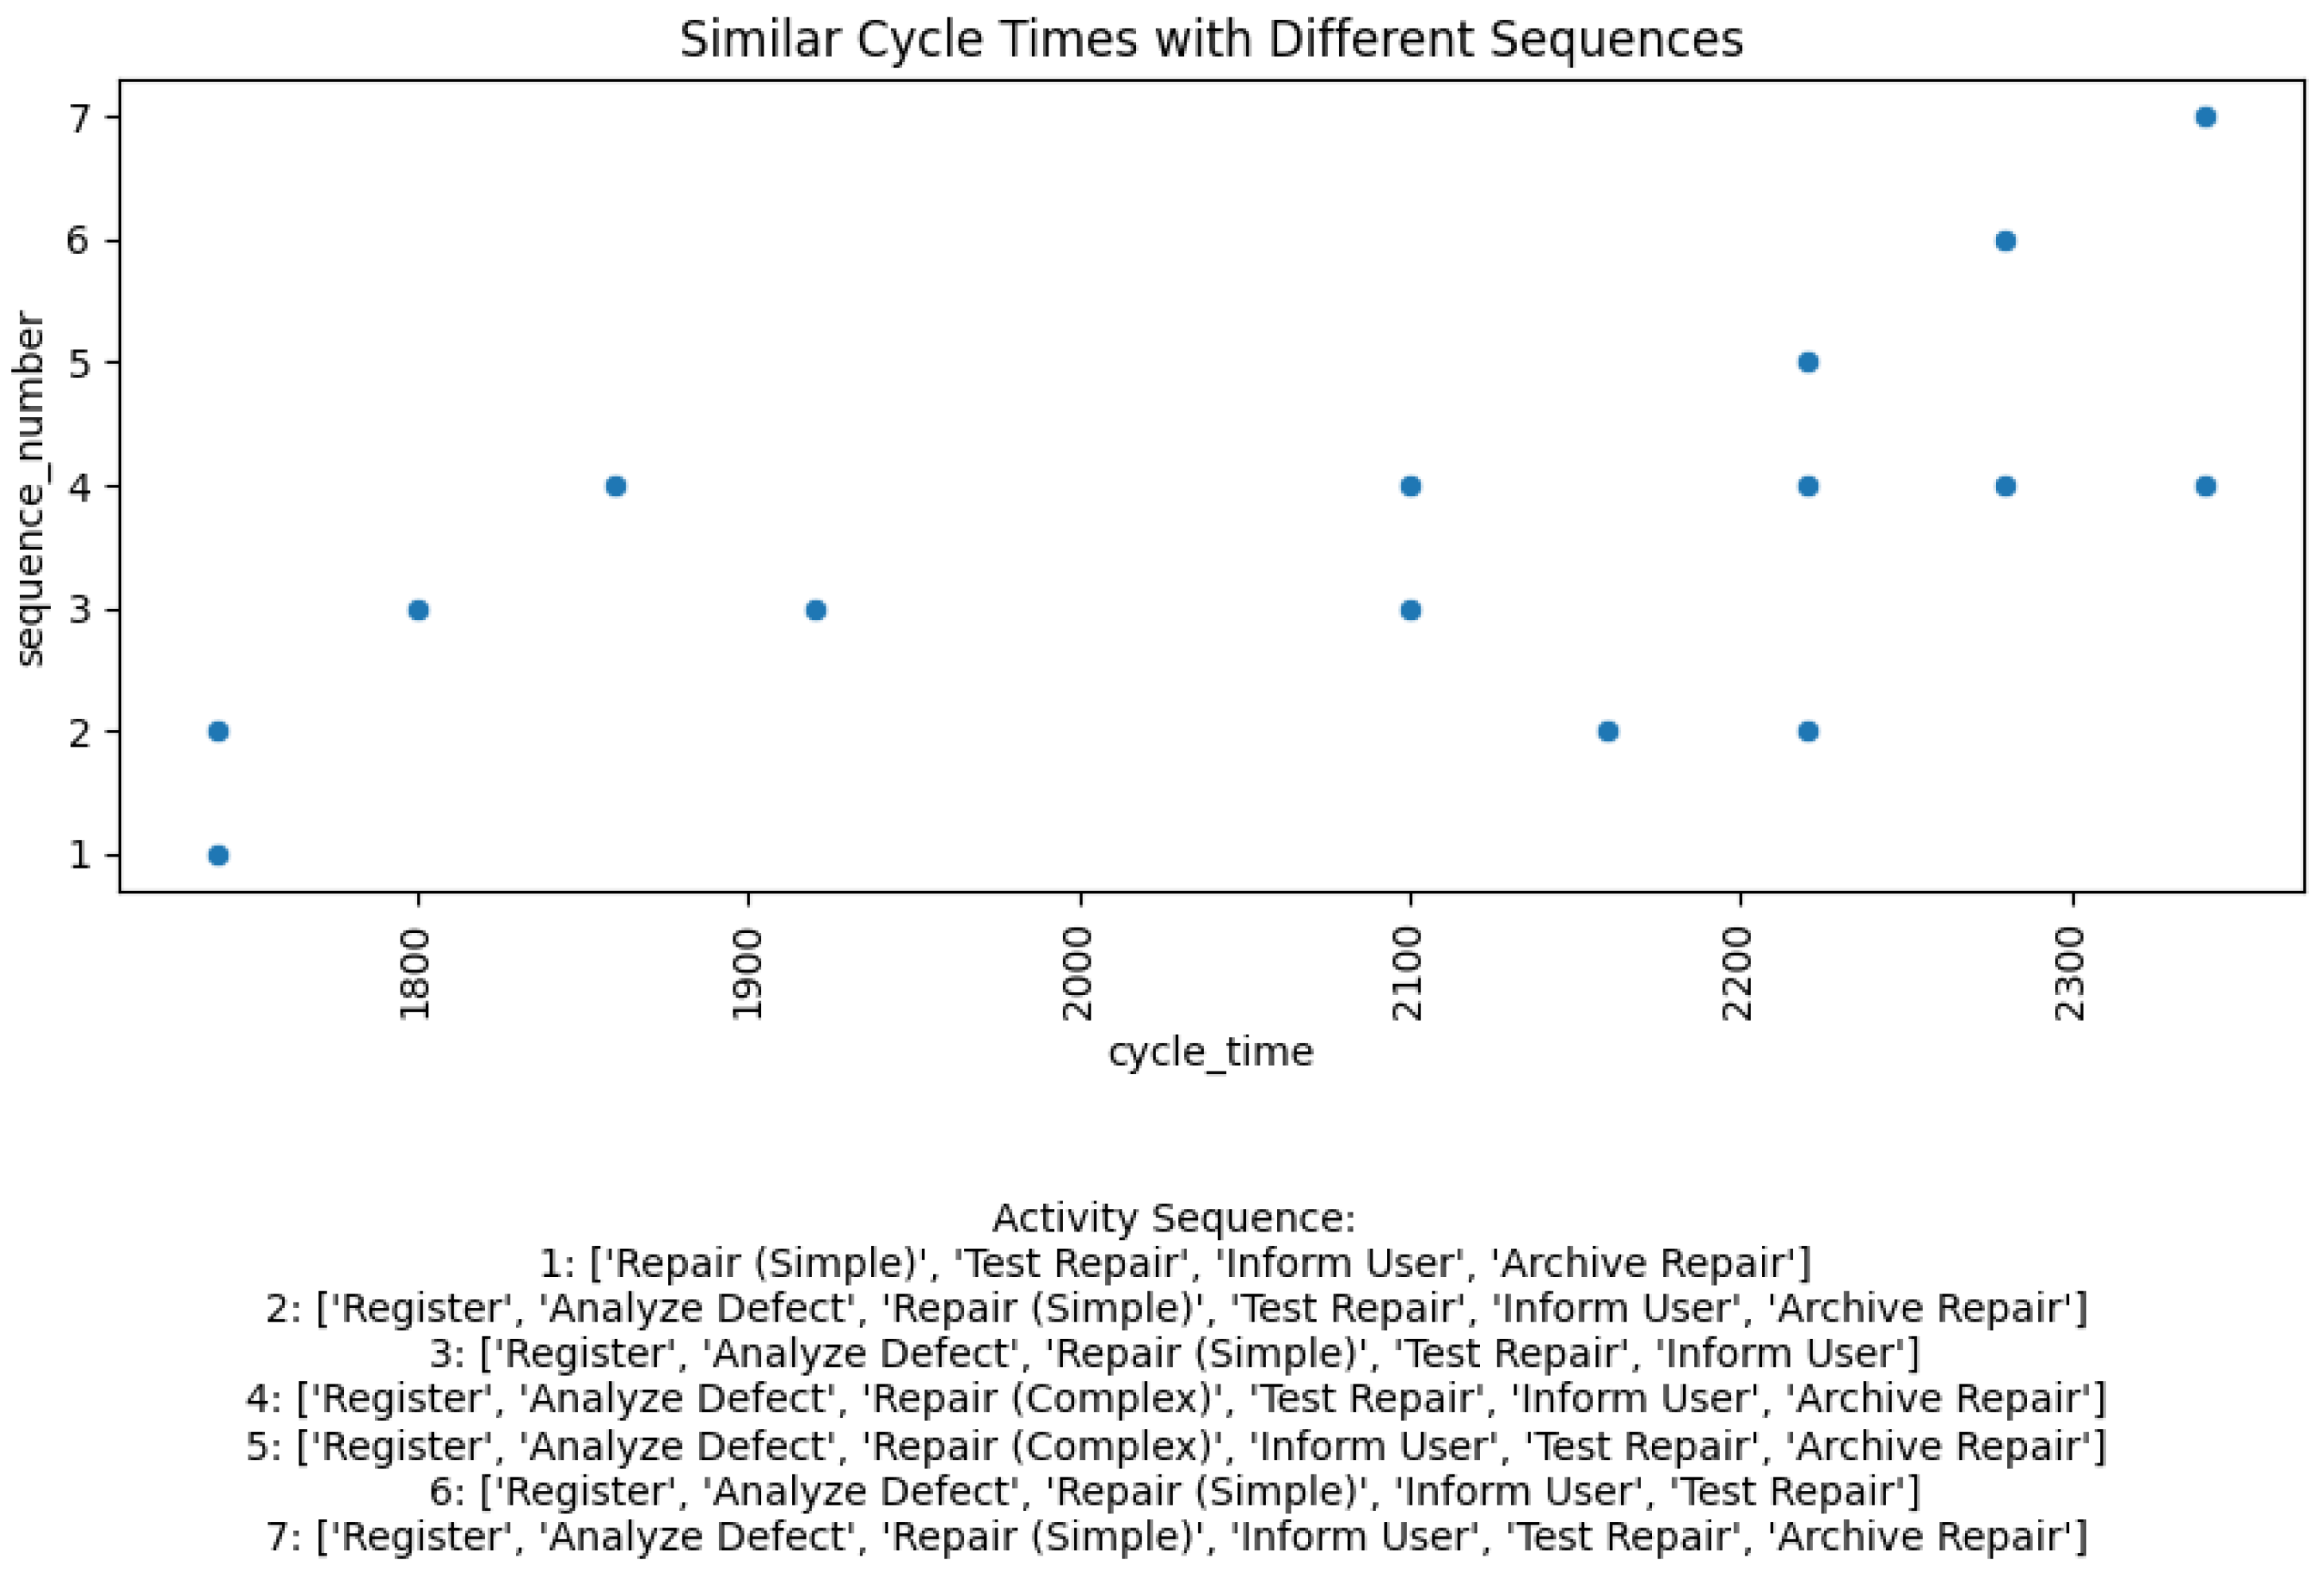
Figure 4 visualizes the relationship between cycle time and sequence number for process instances. It highlights how instances with similar cycle times are classified into clusters based on their different activity sequences. The x-axis represents the cycle time, while the y-axis indicates the sequence number, which corresponds to different activity sequences. Each point on the scatter plot represents a process instance, and the sequence number corresponds to a specific activity sequence, as detailed in the text below the plot.
The plot reveals a clustering result that effectively differentiates processes based on the combinations of activity sequences and similar cycle times. If time-based clustering alone () had been applied, all 15 process instances with similar cycle times would have been grouped into a single cluster, overlooking the variations in activity sequences. The proposed method, however, groups the process cases into seven distinct clusters. This division is crucial for a more nuanced understanding of process behavior. The ability to differentiate between instances with similar cycle times but different activity sequences enables a more refined understanding of process performance. For example, similar cycle times might result from an activity sequence that works properly, and the instances clustered together might be related to the same issue. Additionally, processes with longer cycle times could be the target of further investigation. This approach could help identify the reasons behind the cycle time differences, i.e., whether they are related to a specific activity or not. By distinguishing these instances, the method provides richer insights, enhancing process mining capabilities and enabling more targeted and effective process improvement strategies. The proposed method offers insights that would be hidden under a purely time-based clustering approach.
6.6. Computational Comparison
Table 2 gives computational efficiency results. To quantify runtime performance, all algorithms were executed on the workstation under identical single-thread settings for two event logs. One has also been used in this study to indicate the results of the proposed method. The other one involves road traffic management logs [
54]. A 10,000-trace subset of road traffic management logs was selected to ensure comparable measurements.
On the telephone repair log (1043 traces), the hybrid model finished in 1.8 s, marginally faster than both the sequence-only and time-only variants (1.9 s each). The differences correspond to less than 6% of the total and are within typical measurement noise, confirming that combining the two distance components does not introduce any noticeable overhead.
When a 10,000-trace subset of the much larger road traffic fines log was used, the same pattern emerged: 44.9 s for the proposed method versus 46.1 s (sequence only) and 45.6 s (cycle time only). Again, the hybrid distance proved slightly faster, indicating that the additional arithmetic for the second feature incurs virtually no cost at this scale.
Extrapolating linearly to the full 150,370-trace road traffic fines log, the runtime grows to about 661 s (≈11 min) for the proposed method, compared with 727 s for the sequence-only model and ≈675 s for the time-only model.
The proposed scheme matches or slightly surpasses the execution speed of both single-feature FCM baselines across small and large logs. The results underline that the richer, two-dimensional distance function is obtained at no computational penalty.
6.7. Benchmark Against Fuzzy Clustering Variants
Both the Gaussian-kernel FCM (GKFCM) [
8] and viewpoint-based kernel fuzzy clustering (VWKFC) [
30] algorithms were applied to the same two event logs (telephone repair and road traffic fines). Identical TF-IDF and cycle-time feature space were used by the proposed hybrid FCM (
). Hyperparameters were set according to the recommendations in the respective studies. The evaluation relied on the metrics already used in this study (Silhouette and Davies–Bouldin) and average intra-cluster cycle-time variance (
).
Table 3 compares the different versions of fuzzy c-means clustering algorithms. Across two event logs, higher Silhouette scores and lower Davies–Bouldin indices were obtained, indicating simultaneously tighter internal cohesion and clearer inter-cluster separation.
On both datasets, the proposed method achieved the highest Silhouette score (0.704 and 0.730, respectively) and the lowest Davies–Bouldin index (0.417 and 0.468, respectively). These twin improvements signal that the clusters formed with the combined distance are not only more compact internally but also more clearly separated from one another than those produced by GKFCM or VWKFC. In practical terms, process analysts receive a partition that is easier to interpret and less prone to overlap.
A separate look at the cycle-time dispersion within clusters reinforces this conclusion. The average intra-cluster variance dropped by 7–10% when the proposed method was used, meaning that traces grouped together by the new scheme tend to finish in more similar durations. This tighter temporal cohesion is essential when the aim is to pinpoint slow variants and bottlenecks: the clusters highlight genuinely sluggish cases rather than mixing them with faster instances that merely share the same control-flow.
These results demonstrate that the proposed scheme surpasses the most recent fuzzy clustering variants in both cluster quality and computational efficiency, thereby substantiating its claimed superiority.
7. Results and Discussion
This section presents the experimental results of the proposed fuzzy clustering approach, and its implications for process mining are discussed. The findings highlight the advantages of the fuzzy clustering method over traditional clustering techniques and demonstrate the impact of weight tuning on clustering performance.
One of the primary observations from this study is that traditional clustering methods fail to distinguish between fast and slow cases that share the same sequence of activities. This limitation occurs because conventional clustering primarily focuses on control-flow similarities without considering performance-related attributes such as execution times.
The proposed fuzzy clustering approach effectively distinguishes process variants by integrating sequence- and time-based attributes. By fine-tuning the weighting parameter (), the clustering behavior can be adjusted to emphasize structural similarities or temporal variations. The experimental results reveal several key effects of weight tuning.
First, high values result in a clustering process that primarily focuses on sequence similarity, grouping cases that follow the same activity order together regardless of any execution time differences. Conversely, low values lead to clustering that prioritizes time-based similarities, where cases with similar execution durations are clustered together even if their activity sequences differ. Finally, balanced values (around 0.5) provide an optimal trade-off, effectively capturing both control-flow similarities and performance variations and resulting in more meaningful process clusters. These findings suggest that careful selection of is crucial for obtaining meaningful clustering results and that it should be adjusted depending on the specific objectives of the analysis.
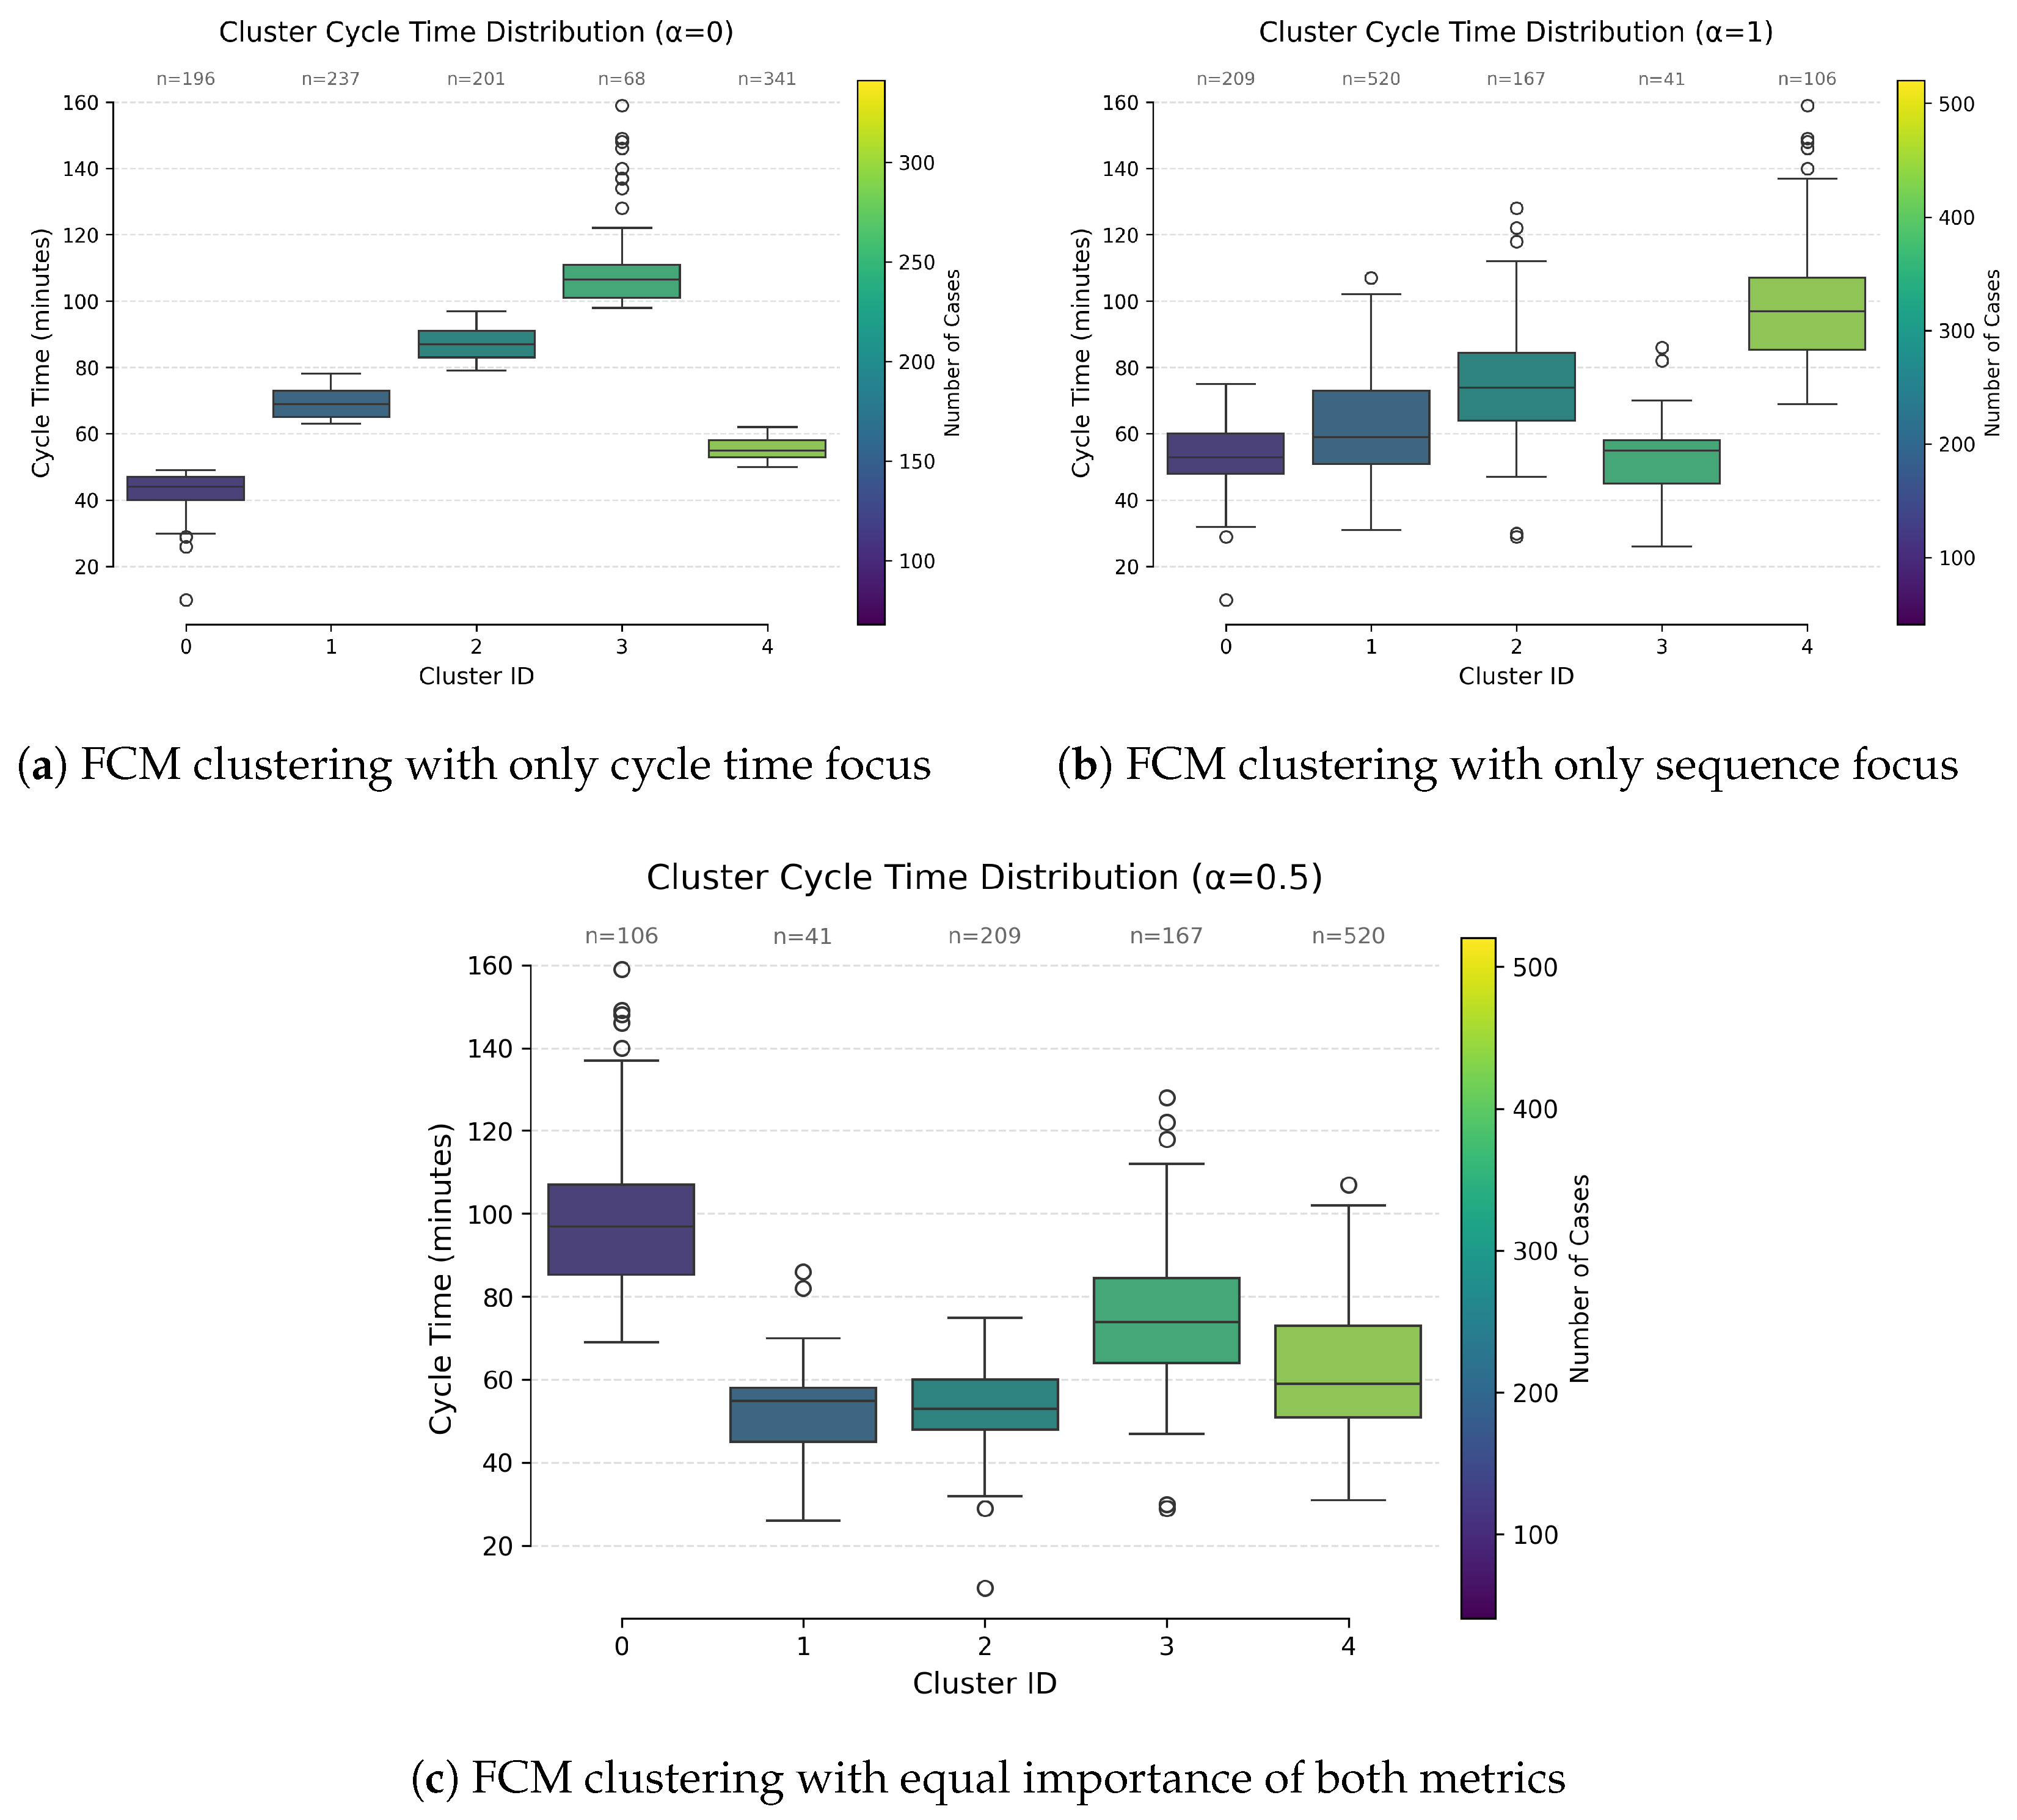
The comparative analysis of cycle time distributions across the three clustering approaches (
,
, and
) given in
Figure 5 reveals distinct patterns in process efficiency and cluster behavior, with the
method demonstrating notable improvements in granularity and practical relevance.
The composition of clusters and the distribution of cases within them vary significantly based on the chosen value. Setting to 0.5 yields a heterogeneous structure that is characterized by Cluster 4, which comprises 520 cases, alongside smaller clusters containing between 41 and 106 cases. This asymmetry is beneficial because it effectively separates high-frequency process variants from more specialized niche cases, which is crucial for enabling targeted process optimization.
Regarding cycle time performance, the method utilizing yields the most favorable results, achieving the lowest median cycle times across clusters, which generally range from 50 to 90 min. Specifically, the largest cluster in this analysis exhibits a median cycle time of approximately 60 min, with an interquartile range (IQR) of 40 to 80 min. This performance stands in sharp contrast to the other approaches.
The clustering achieved with highlights a significant, stable process stream within its largest cluster, which contains 520 cases, boasts a low median cycle time of 60 min, and exhibits a narrow interquartile range. This particular cluster represents 41% of the total cases, identifying it as the most crucial area for implementing efficiency-scaling initiatives.
Simultaneously, the smaller clusters identified by this method, exemplified by one with 41 cases and an 80-minute median cycle time, are likely indicative of infrequent edge cases that require distinct, specialized management strategies. Such clear differentiation between mainstream processes and exceptions becomes obscured when using values of 0 or 1.
The method produces clusters of varying sizes, which realistically mirrors the skewed distributions often found in real-world process logs, unlike the more artificially balanced clusters resulting from . This alignment with practical data patterns enhances the interpretability and usefulness of the findings for operational teams.
Furthermore, effectively avoiding the extreme outliers that tend to appear when using , the approach also reduces statistical noise. This is particularly beneficial for conducting more precise root cause analysis, as managing outliers is a frequent challenge in process mining applications.
The results emphasize the importance of incorporating performance-based attributes in process clustering. It is observed that traditional approaches that focus solely on control-flow structures, may overlook significant behavioral variations within the process. A more nuanced understanding of process variations can be achieved by adopting a fuzzy clustering approach, allowing clusters to be identified that reflect both execution sequences and performance differences.
Additionally, the fuzzy clustering method provides flexibility in handling process variations. Unlike crisp clustering methods, which assign cases to distinct clusters, the fuzzy approach allows cases to have partial memberships in multiple clusters. This is particularly useful in complex process environments where cases exhibit overlapping characteristics across different process variants.
8. Conclusions
This study proposes a novel fuzzy clustering method that integrates activity sequence and cycle time information to enhance process variation analysis. A weighted distance function has been introduced to balance these two factors, allowing greater flexibility in distinguishing between process variants. Experimental validation using real-world event logs demonstrated the effectiveness of this approach in capturing structural and performance-based variations within processes.
The impact of the weighting parameter () has been systematically analyzed, highlighting its crucial role in determining clustering outcomes. It has been observed that an excessive focus on either sequence similarity or time-based attributes can lead to suboptimal clusters. Instead, a balanced value for (approximately 0.5) has been shown to provide the most meaningful grouping of cases, effectively capturing both control-flow patterns and performance differences.
The clustering method offers a nuanced and actionable segmentation of process variants by harmonizing cycle time efficiency, outlier management, and cluster interpretability. Its ability to isolate a high-volume, low-variability cluster () while retaining resolution for edge cases represents a statistically and operationally superior approach compared to and . These results advocate adopting in industrial process optimization frameworks where discriminative power and scalability are critical.
The findings of this study underscore the significance of incorporating performance-based attributes in process clustering. Unlike traditional crisp clustering methods, the fuzzy clustering approach allows cases to exhibit partial memberships across multiple clusters, providing a more nuanced understanding of process behaviors.
Future research should focus on extending this approach to real-time process streams, integrating deep learning models for automated sequence pattern detection, and developing adaptive mechanisms for the dynamic tuning of . These advancements will further strengthen the applicability of fuzzy clustering in process mining, enabling more sophisticated analysis of complex business processes.


