Abstract
This study introduces a novel trigonometric-based family of distributions for modeling continuous data through a newly proposed framework known as the ASP family, where ‘ASP’ represents the initials of the authors Aadil, Shamshad, and Parvaiz. A specific subclass of this family, termed the “ASP Rayleigh distribution” (ASPRD), is introduced that features two parameters. We conducted a comprehensive statistical analysis of the ASPRD, exploring its key properties and demonstrating its superior adaptability. The model parameters are estimated using four classical estimation methods: maximum likelihood estimation (MLE), least squares estimation (LSE), weighted least squares estimation (WLSE), and maximum product of spaces estimation (MPSE). Extensive simulation studies confirm these estimation techniques’ robustness, showing that biases, mean squared errors, and root mean squared errors consistently decrease as sample sizes increase. To further validate its applicability, we employ ASPRD on three real-world engineering datasets, showcasing its effectiveness in modeling complex data structures. This work not only strengthens the theoretical framework of probability distributions but also provides valuable tools for practical applications, paving the way for future advancements in statistical modeling.
Keywords:
ASP transformation; Rayleigh distribution; moments; entropy; order statistics; maximum likelihood estimation MSC:
60E05; 62E10; 62F10; 62P30
1. Introduction
In the past few decades, the increasing complexity of real-world data has motivated researchers to develop more advanced probability distributions. While traditional models form the foundation of statistical analysis, they often lack the necessary flexibility and accuracy for modern applications. To overcome these limitations, several generalized families of distributions have been introduced, extending classical models to enhance both theoretical insights and practical applications.
One of the earliest and most fundamental techniques for generating new probability distributions was introduced by [1], who proposed the exponentiated family of distributions. The cumulative distribution function (CDF) of this family is given by:
where acts as an additional shape parameter and denotes the CDF of the baseline distribution, parameterized by .
Marshall and Olkin [2] introduced an alternative approach, known as the “Marshall and Olkin Family” of distributions, designed to modify existing models. The CDF of this family is defined as:
Odhah et al. [3] proposed a new family of distributions based on trigonometric transformations, with the CDF given by:
Additionally, Shah et al. [4] introduced a more flexible probability model using the T-X family methodology [5]. This led to the development of the New Exponent Power-X (NGEP-X) family, whose CDF is given by:
To further enhance flexibility, Mahdavi and Kundu [6] proposed the Alpha Power Transformation (APT) method, which introduces an additional shape parameter to the baseline distribution . The CDF of the APT family is given by:
Trigonometric-based transformations have gained significant attention due to their ability to alter the shape of distributions without introducing additional parameters. A notable example is the sine-G family, introduced by [7], which applies a sine transformation to the CDF of a baseline distribution. This approach enhances shape flexibility while preserving the simplicity of the original model. The CDF and PDF of the sine-G family are defined as follows:
where and represent the CDF and PDF of the baseline distribution, respectively. An extension of this method, the Exponentiated Sine-Generated Distributions, was introduced by [8] with the following CDF:
More recently, Oramulu et al. [9] introduced the sine-generalized family of distributions, whose CDF is given by:
Several researchers have explored sine-based transformations to extend classical probability distributions. For instance, Ref. [10] introduced the sine-exponential distribution, while Ref. [11] proposed the sine-Weibull distribution, enhancing the flexibility of the Weibull model. Similarly, Ref. [12] developed the sine power Rayleigh distribution, Ref. [13] studied sine-G family of distributions, Ref. [14] studied Sine Topp Leone G family of distributions, Ref. [15] derived sine modified Lindley distribution, Ref. [10] studied Sine burr xii distribution, Ref. [16] discussed the new hyperbolic sine generator with an example of Rayleigh distribution, Ref. [17] derived sine Kumaraswamy-G family of distributions, Ref. [18] considered sine generalized odd log-logistic family of distributions, and Ref. [19] investigated the sine inverse Rayleigh distribution.
A seminal example in this evolution is the Rayleigh distribution, originally introduced by [20], which has been extensively used to model skewed data, particularly in lifetime analysis. Recognizing the limitations of the classical Rayleigh model, researchers have sought to extend its framework to better capture diverse data behaviors. For instance, the two-parameter Burr type X distribution, first described by [21], marked an important step in this direction. Building on that foundation, Ref. [22] rigorously investigated and estimated the parameters of this extended model using various innovative techniques.
In parallel, Bayesian methodologies have been applied to refine parameter estimation within the Rayleigh framework. Ref. [23] examined the properties of the Half Logistic Exponentiated Inverse Rayleigh distribution and its application to lifetime data. Furthermore, Ref. [24] studied the half logistic generalized Rayleigh distribution for modeling hydrological data, while Ref. [25] focused on parameter estimation for a weighted version of the Rayleigh distribution.
Building on this framework, Ref. [26] introduced a new extension of the Rayleigh distribution, discussing its methodology, classical and Bayesian estimation, and its application to industrial data; moreover, Ref. [27] demonstrated its practical relevance by applying a flexible variation to predict COVID-19 mortality rates. More recent contributions by [28,29,30,31] have continued to explore generalized distributions and their wide-ranging applications. Moreover, Ref. [32] examined an odd Lindley power extension of the Rayleigh distribution, while Refs. [33,34] further extended the model and investigated its reliability function. Collectively, these advancements underscore the ongoing evolution of probability distribution theory, paving the way for models that are both robust and adaptable to contemporary statistical challenges.
The development of new generalized families of distributions is driven by the need for models that can effectively capture the structural complexities and variability inherent in modern datasets. Traditional distributions often fall short in accommodating the intricate patterns observed in real-world data, necessitating more flexible and adaptive frameworks. As the complexity and dimensionality of data continue to expand, there is a growing demand for probability distributions capable of modeling high-dimensional structures while maintaining interpretability and stability. Such advancements enhance the precision and reliability of statistical analyses by providing a more accurate representation of underlying stochastic processes. In this study, we introduce the ASP family of distributions, a highly adaptable and versatile class designed to address these challenges across various domains. This family extends the Sine-G distribution by integrating the classical generalized function into its probability density structure, resulting in a novel and refined mathematical formulation. The motivation behind constructing the trigonometric ASP family stems from the need for greater flexibility in extending probability distributions. Existing sine-based transformations, while effective, modify the baseline distribution without incorporating additional parameters, thereby limiting their adaptability. To overcome this limitation, we propose the ASP family, which introduces a shape parameter , providing enhanced control over skewness and kurtosis. This structural improvement allows the ASP family to capture a broader range of distributional shapes, making it a more powerful tool for statistical modeling and data analysis.
In this manuscript, we introduce a novel method the ASP transformation designed to extend the classical Rayleigh distribution (RD) and enhance its engineering applications. Our primary goal is to construct new families of distributions with increased flexibility, thereby enabling a more comprehensive analysis of real-world data. The proposed approach not only generalizes the traditional RD but also provides improved adaptability for modeling skewed data, which is particularly valuable in lifetime and reliability studies.
The selection of maximum likelihood estimation (MLE), least squares estimation (LSE), weighted least squares estimation (WLSE), and maximum product of spacings estimation (MPSE) for estimating the parameters of the ASP Rayleigh Distribution (ASPRD) is driven by their theoretical strengths, computational feasibility and practical applicability. MLE is preferred for its asymptotic efficiency, while LSE provides a simpler alternative when direct likelihood optimization is challenging. WLSE improves estimation in heteroscedastic cases, and MPSE offers stability, particularly for small samples. These methods outperform alternatives like the method of moments or Bayesian estimation, which may impose restrictive assumptions or be computationally intensive. The inclusion of these four approaches ensures a well-rounded analysis of ASPRD, reinforcing the reliability and adaptability of the proposed model in practical applications.
The paper is organized as follows. In Section 2, we present a detailed outline of the ASP transformation technique, explaining its underlying principles and the rationale behind its development. Section 3 is dedicated to introducing the ASP Rayleigh Distribution (ASPRD), where we describe its formulation and key features. The expansion of this distribution is explored in Section 4, demonstrating how the ASP transformation broadens the scope of classical models. In Section 5, we derive and discuss the statistical properties of ASPRD, highlighting its theoretical foundations and practical implications. Estimation of unknown parameters is addressed in Section 6 using the MLE, LSE, WLSE, and MPSE methods, which provides robust techniques for parameter inference. To validate our approach, Section 7 presents extensive simulation studies and Section 8 illustrates the application of ASPRD to real-life datasets. Finally, Section 9 concludes the paper by summarizing our findings and suggesting potential avenues for future research.
2. ASP Method
The CDFs of the ASP method are given as:
It is evident that is a valid CDF, provided that is a valid CDF. This holds because it satisfies the fundamental properties of CDF as:
- ;
- is a monotonic increasing function of x
- is right continuous
and the corresponding PDF is expressed as:
In Equations (10) and (11), and , respectively, represent the CDF and PDF of the base line distribution with parameter vector .
The reliability function of the ASP method is defined as:
By using the ASP approach, the hazard rate function is provided by
3. ASP Rayleigh Distribution (ASPRD)
The PDF and CDF of the Rayleigh distribution (RD) are defined as follows:
By inserting Equation (15) in Equation (10), the CDF of ASPRD is obtained as
where and are the shape and scale parameter of the model.
The corresponding PDF of ASPRD is obtained as
To analyze the asymptotic behavior of (17), we consider two cases:
- Case 1: As
For small values of x, we observe that:
Thus,
For the cosine term, we have the following
Therefore, combining all these results, we conclude the following:
- Case 2: As
For large values of x, we observe that:
Thus,
This simplifies to:
Therefore, combining all these results, we conclude the following:
Thus, the PDF of the ASPRD tends to 0 as and as . Therefore, its asymptotic behavior is such that it decays to 0 at both the left and right tails of its domain.
The reliability function of ASPRD is given by
The ASPRD hazard rate function is obtained as
To analyze the asymptotic behavior of (21), we consider two cases here as well:
- Case 1: As
For small values of x, we observe that:
Thus,
For the cosine term, we have the following
Substituting this in the numerator of (21), we have the following
For the denominator, we have the following
Therefore, combining all these results, we conclude the following:
- Case 2: As
For large values of x, we observe that:
Thus,
For the cosine term, we have the following
Therefore, the numerator simplifies to:
Thus, we conclude the following:
The density plots of the ASPRD is plotted using different combinations of shape parameter and scale parameter . The density plots have distinct shapes for varying parameter values, as seen in Figure 1.
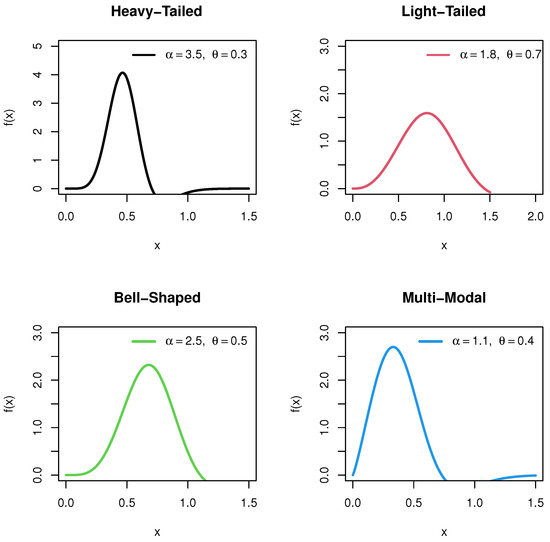
Figure 1.
Density plots of ASPRD for different combinations of shape parameter and scale parameter .
According to Figure 2, the proposed model is capable of representing datasets characterized by failure rates that are positively skewed, increasing, decreasing, constant, inverted J-shaped, and unimodal.

Figure 2.
Hazard rate plots of ASPRD for different combinations of shape parameter and scale parameter .
4. Expanded Forms of the Model
Various statistical properties can be conveniently derived using the mixture representation of the PDF and CDF of the proposed model. The expression
can be expanded as
Furthermore, the term can be written as
Similarly, the expansion for is given by
The sine term, , can be expanded as
Also, can be expanded as
As a result, the probability density function (PDF) of the proposed model can be represented in its mixture form as:
Similarly, the cumulative distribution function (CDF) can be expressed as:
5. Statistical Properties of ASPRD
Some of the mathematical properties, such as the moment, moment-generating function, conditional moments and associated measures, the entropy, and order statistics of ASPRD, are derived.
5.1. Moments
Theorem 1.
If X∼, then the moment of the ASPRD about the origin is given by:
Proof.
The moment of the ASPRD can be directly computed by expanding the PDF as given in Equation (24):
where is the PDF of the ASPRD as provided in Equation (24). Therefore,
□
We now use the method of substitution for the integrals in Equation (27).
Let
which implies
Similarly, for the second term, let,
which implies
Simplifying Equation (27) yields the following:
Here, the Gamma function is defined as:
Setting in Equation (28), the mean of the model is computed as:
Similarly for r = 2, 3, and 4 in Equation (28), the second, third, and fourth moments about the origin can be calculated.
5.2. Moment Generating Function (MGF) of ASPRD
The moments of a distribution are represented by the moment generating function (MGF). The following theorem provides the MGF for the ASPRD.
Theorem 2.
If , then the moment generating function, , is expressed as
5.3. Conditional Moments and Associated Measures
Theorem 3.
Consider a random variable X that follows the ASPRD distribution parameterized by , with its probability density function (PDF) expressed in Equation (24). Let’s represent the rth incomplete moment. Then, the following holds:
where denotes the lower incomplete gamma function.
Proof.
Upon simplification, we arrive at:
By setting in Equation (37), we obtain the first incomplete moment as follows:
□
5.3.1. Lorenz and Bonferroni Inequality Curves
The Lorenz and Bonferroni inequality curves represent significant applications of the first incomplete moment. For a given probability distribution, these curves are defined as follows:
In a similar manner, the Bonferroni inequality can be expressed as:
This leads to the following formulation for :
where the components are defined as follows:
5.3.2. Conditional Moment and Reversed Conditional Moment of ASPRD
The conditional moment of the ASPRD can be computed using the following expression:
where denotes the reliability of ASPRD at time m.
In a similar fashion, the reversed conditional moment of the ASPRD is defined as:
Thus, we can express the reversed conditional moment as:
where the components are defined as follows:
5.3.3. Mean Residual Life (MRL) and Mean Waiting Time (MWT)
The Mean Residual Life (MRL) is defined as follows:
After substituting the values from Equations (20), (29), and (38), we arrive at the expression for the mean residual life:
The Mean Waiting Time (MWT) is defined as:
Thus, we can express the Mean Waiting Time as:
where the components are defined as:
5.4. Renyi Entropy
Theorem 4.
If X∼, then the Renyi entropy of the ASPRD is given as
Proof.
The Renyi entropy, denoted as , of ASPRD can be defined as
□
Using the same procedure as in Equation (28), we obtain the final expression for Renyi entropy as
5.5. Order Statistics of ASPRD
In real-world applications incorporating data from life testing studies, order statistics are very important. Let be the order statistics with the random sample derived from the ASPRD having the PDF and CDF . Therefore, the PDF and CDF of say and for the ASPRD are derived and are expressed as:
where is the beta function.
6. Estimation
This section discusses the different estimation approaches used to estimate the unknown parameters, and , of the ASPRD.
6.1. Maximum Likelihood Estimation (MLE)
Let represent a random sample drawn from the ASPRD distribution. The parameters of the distribution are and . The logarithm of the likelihood function for the ASPRD can be expressed as:
The maximum likelihood estimates (MLEs) of and are obtained by taking the partial derivatives of Equation (43) concerning each parameter and setting them to zero. This gives us the following equations:
6.2. Least Square Estimation (LSE) and Weighted Least Square Estimation (WLSE)
Ref. [35] introduced the LSE and WLSE methods to estimate the parameters of the Beta distribution. By minimizing the least squares function concerning the unknown parameters, the parameters of the proposed model can be estimated using the least squares estimation approach, where
Similarly, to get the WLS estimate for the unknown parameters, the weighted least squares function is minimized:
6.3. Maximum Product of Spacings Estimation (MPSE)
For estimating parameters of continuous univariate distributions, the maximum product of the spacing method—first presented by [36] and then examined by [37]—offers an alternative to maximum likelihood estimation. Its consistency and connection to the Kullback–Leibler measure of information were explained by [37]. This approach is a solid choice for estimating parameters in our study since it has been demonstrated to be effective and reliable in a wider range of circumstances. For a random sample of size n from the proposed model, with the order statistics , the uniform spacings are the differences between each pair of consecutive order statistics, expressed as follows:
where and . The maximum product of spacing estimators is obtained by maximizing the following function:
where
and
By solving the nonlinear equations and , we procure the maximum product of spacing estimates for the parameters of the ASPRD model.
7. Simulated Analysis
A simulation experiment is conducted using R software (version 4.4.2.) to evaluate the efficiency of different estimation techniques using varying sample sizes like , and 350. The procedure is replicated 1000 times, and the parameters were set at and concerning the standard order . The biases, mean square errors (MSE), and mean relative errors (MRE) are determined for each scenario.
The findings from the simulation analysis are displayed in Table 1 and Table 2. We can comprehend the relative benefits and efficacy of the various estimation techniques taken into consideration in our simulation study by integrating these tables. A graphical depiction of these tabular findings is shown in Figure 3, Figure 4, Figure 5, Figure 6, Figure 7 and Figure 8, which further facilitates the interpretation of efficacy and performance of each method. These insights play a crucial role in determining which estimating method is best for upcoming applications and research projects.

Table 1.
Results of simulations for various estimation techniques with parameter combination and .

Table 2.
Results of simulations for various estimation techniques with parameter combination and .
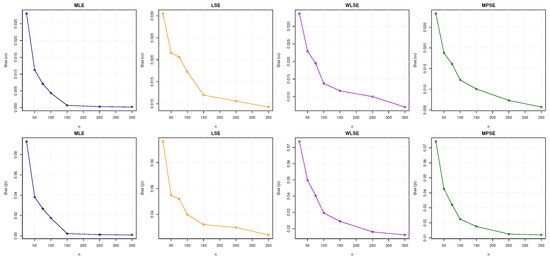
Figure 3.
Visual summary of bias values for and as reported in Table 3.
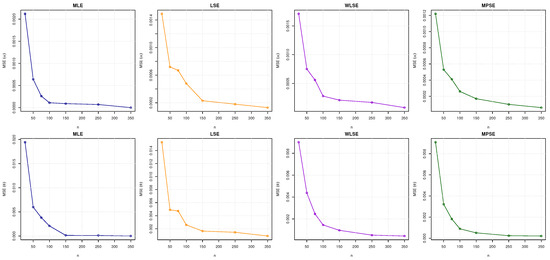
Figure 4.
Visual summary of MSE values for and as reported in Table 3.
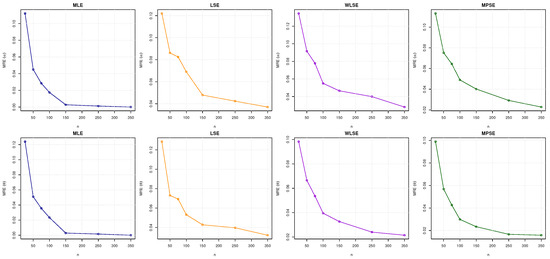
Figure 5.
Visual summary of MRE values for and as reported in Table 3.

Figure 6.
Visual summary of bias values for and as reported in Table 4.

Figure 7.
Visual summary of MSE values for and as reported in Table 4.

Figure 8.
Visual summary of MSE values for and as reported in Table 4.
Many inferences can be made from the thorough examination of the ranking tables and simulation results, including the following:
- All estimators analyzed in this research demonstrate the property of consistency. This suggests that as the sample size (n) rises, the estimators converge to the true parameter values.
- Regardless of the estimation approach employed, the bias of all estimators diminishes as sample size (n) grows. This suggests that larger sample sizes yield more precise estimates with reduced systematic errors.
- For all estimation strategies, the MSE of the estimates decreases as n increases. This implies that larger sample sizes improve the precision of the estimates by minimizing random and systematic errors.
- Regardless of the estimation approach utilized, the RMSE of all estimators decreases as n increases. This indicates that higher sample numbers lead to more precise approximations as the relative error gradually decreases.
8. Application
To illustrate the importance of the ASPRD model, we present three practical applications to evaluate the adaptability of the subject model. For comparison, multiple goodness-of-fit (GoF) metrics have been evaluated, including Akaike Information Criteria (AIC), Bayesian Information Criteria (BIC), Akaike Information Criteria Corrected (AICC) and Hannan–Quinn Information Criteria (HQIC). The optimal distribution has lower values for all GoF metrics.
Dataset 1: The first data on the breaking stress of carbon fibers of 50 mm length (GPa) are obtained from [38]. These data were used by [12] to illustrate the applications of the sine power Rayleigh distribution. The dataset is unimodal and is approximately symmetric (skewness = −0.13 and kurtosis = 3.22). The data are as follows: 3.70, 2.74, 2.73, 2.50, 3.60, 3.11, 3.27, 2.87, 1.47, 3.11, 3.56, 4.42, 2.41, 3.19, 3.22, 1.69, 3.28, 3.09, 1.87, 3.15, 4.90, 1.57, 2.67, 2.93, 3.22, 3.39, 2.81, 4.20, 3.33, 2.55, 3.31, 3.31, 2.85, 1.25, 4.38, 1.84, 0.39, 3.68, 2.48, 0.85, 1.61, 2.79, 4.70, 2.03, 1.89, 2.88, 2.82, 2.05, 3.65, 3.75, 2.43, 2.95, 2.97, 3.39, 2.96, 2.35, 2.55, 2.59, 2.03, 1.61, 2.12, 3.15, 1.08, 2.56, 1.80, 2.53.
Dataset 2: The data consist of 63 observations of the strengths of 1.5 cm glass fibers, which are obtained from [39]. This dataset was also analyzed by [32] to demonstrate the properties and applications of power exponentiated Rayleigh distribution. The dataset is unimodal and is left skewed (skewness = −0.89 and kurtosis = 3.92). The data are as follows: 0.55, 0.74, 0.77, 0.81, 0.84, 0.93, 1.04, 1.11, 1.13, 1.24, 1.25, 1.27, 1.28, 1.29, 1.30, 1.36, 1.39, 1.42, 1.48, 1.48, 1.49, 1.49, 1.50, 1.50, 1.51, 1.52, 1.53, 1.54, 1.55, 1.55, 1.58, 1.59, 1.60, 1.61, 1.61,1.61, 1.61, 1.62, 1.62, 1.63, 1.64, 1.66, 1.66, 1.66, 1.67,1.68, 1.68, 1.69, 1.70, 1.70, 1.73, 1.76, 1.76, 1.77, 1.78, 1.81, 1.82, 1.84, 1.84, 1.89, 2.00, 2.01, 2.24.
Dataset 3: Data were collected from a group of 46 patients, per year, on recurrence of leukemia who received autologous marrow. The dataset is unimodal and is positively skewed (skewness = 1.03 and kurtosis = 2.65), reported by Ahmad et al. [40], as follows: 0.0301, 0.0384, 0.0630, 0.0849, 0.0877, 0.0959, 0.1397, 0.1616, 0.1699, 0.2137, 0.2137, 0.2164, 0.2384, 0.2712, 0.2740, 0.3863, 0.4384, 0.4548, 0.5918, 0.6000, 0.6438, 0.6849, 0.7397, 0.8575, 0.9096, 0.9644, 1.0082, 1.2822, 1.3452, 1.4000, 1.5260, 1.7205, 1.9890, 2.2438, 2.5068, 2.6466, 3.0384, 3.1726, 3.4411, 4.4219, 4.4356, 4.5863, 4.6904, 4.7808, 4.9863, 5.
The potentiality of the proposed model is determined by comparing its performance with several other competitive models, namely Weighted Rayleigh Distribution (WRD) [25], Transmuted Rayleigh Distribution (TRD) [41], Exponentiated Rayleigh Distribution (ERD) [21], Rayleigh Distribution (RD) [20], Power Exponentiated Rayleigh Distribution (PERD) [32], Weibull Distribution (WD) [42], Power Rayleigh Distribution (PRD) [43], and Sine Power Rayleigh Distribution (SPRD) [12].
The findings presented in Table 3, Table 4 and Table 5 indicate that the ASPRD exhibits the lowest values for AIC, BIC, AICC, and HQIC when compared with the existing models discussed. This demonstrates that it surpasses the baseline Rayleigh distribution model and existing competing models. Figure 9, Figure 10, Figure 11 and Figure 12 compare the estimated density, P-P, survival, and TTT plots of the ASPRD model for the three datasets. In summary, the ASPRD model shows its practical applicability in real-world circumstances and is the most appropriate model for the three datasets.

Table 3.
ML estimates and model selection criteria for different models for dataset 1.

Table 4.
ML estimates and model selection criteria for different models for dataset 2.

Table 5.
ML estimates and model selection criteria for different models for dataset 3.

Figure 9.
Histogram with fitted density plots for datasets I, II, and III.

Figure 10.
P-P plots for datasets I, II, and III.
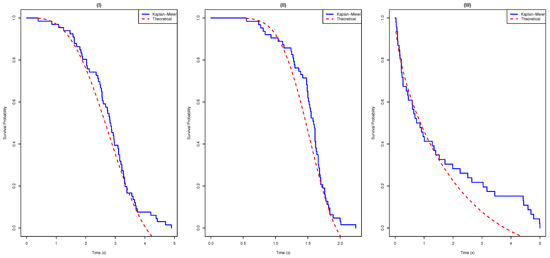
Figure 11.
Survival plots for datasets I, II, and III.
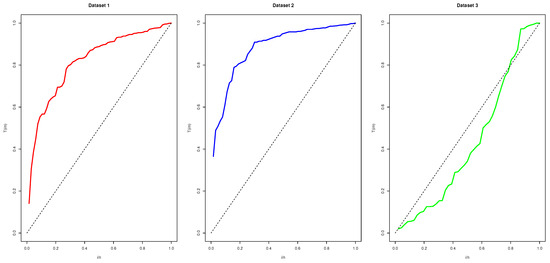
Figure 12.
TTT plots for datasets I, II, and III.
9. Conclusions
This study introduces the ASP-X family of distributions, with an emphasis on the ASP Rayleigh Distribution (ASPRD), a versatile two-parameter model intended to improve data adaptability. A comprehensive statistical examination reveals its practical benefits and structural characteristics. We evaluated the precision of the parameter estimate using four traditional estimation techniques, including MLE, LSE, WLSE, and MPSE, and showed the resilience of the model through in-depth simulations. The application of ASPRD to real-world datasets further validates its effectiveness in capturing complex data patterns. In addition to an engineering dataset, we have incorporated a medical dataset, demonstrating the model’s adaptability and versatility across diverse fields.
The study has some limitations despite its encouraging results. Like many parametric distributions, the ASPRD model may be less flexible when dealing with multimodal or strongly skewed datasets. To increase adaptability, future studies should investigate expanded models that include more form factors or hybrid estimating methods. Additionally, ASPRD’s generalizability might be further evaluated by extending it to other fields, including economics or the biological sciences. These paths will contribute to the improvement of the framework and increase the scope of its statistical modeling applications.
Author Contributions
Conceptualization, A.A.M.; Methodology, S.U.R.; Software, A.A.B.; Validation, S.P.A.; Formal analysis, A.A.B.; Investigation, S.U.R., S.P.A. and A.H.T.; Resources, T.M.J. and N.S.-A.; Data curation, A.A.B.; Writing—original draft, A.A.M.; Writing—review & editing, A.A.B. and A.H.T.; Supervision, S.P.A.; Project administration, A.H.T.; Funding acquisition, T.M.J. and N.S.-A. All authors have worked equally to write and review the manuscript. All authors have read and agreed to the published version of the manuscript.
Funding
The authors would like to acknowledge the Deanship of Graduate Studies and Scientific Research, Taif University for funding this work.
Data Availability Statement
The data supporting the findings of this study are available within the article.
Acknowledgments
The authors would like to acknowledge the Deanship of Graduate Studies and Scientific Research, Taif University for funding this work.
Conflicts of Interest
The authors declare no conflicts of interest.
References
- Mudholkar, G.S.; Srivastava, D.K. Exponentiated Weibull family for analyzing bathtub failure-rate data. IEEE Trans. Reliab. 1993, 42, 299–302. [Google Scholar]
- Marshall, A.W.; Olkin, I. A new method for adding a parameter to a family of distributions with application to the exponential and weibull families. Biometrika 2005, 92, 505. [Google Scholar]
- Odhah, O.H.; Alshanbari, H.M.; Ahmad, Z.; Khan, F.; El-Bagoury, A.a.A.H. A New Family of Distributions Using a Trigonometric Function: Properties and Applications in the Healthcare Sector. Heliyon 2024, 10, e29861. [Google Scholar]
- Shah, Z.; Khan, D.M.; Khan, I.; Ahmad, B.; Jeridi, M.; Al-Marzouki, S. A novel flexible exponent power-X family of distributions with applications to COVID-19 mortality rate in Mexico and Canada. Sci. Rep. 2024, 14, 8992. [Google Scholar]
- Alzaatreh, A.; Lee, C.; Famoye, F. A new method for generating families of continuous distributions. Metron 2013, 71, 63–79. [Google Scholar]
- Mahdavi, A.; Kundu, D. A new method for generating distributions with an application to exponential distribution. Commun. Stat. Theory Methods 2017, 46, 6543–6557. [Google Scholar]
- Kumar, D.; Singh, U.; Singh, S.K. A new distribution using sine function-its application to bladder cancer patients data. J. Stat. Appl. Probab. 2015, 4, 417. [Google Scholar]
- Muhammad, M.; Alshanbari, H.M.; Alanzi, A.R.; Liu, L.; Sami, W.; Chesneau, C.; Jamal, F. A new generator of probability models: The exponentiated sine-G family for lifetime studies. Entropy 2021, 23, 1394. [Google Scholar] [CrossRef]
- Oramulu, D.O.; Alsadat, N.; Kumar, A.; Bahloul, M.M.; Obulezi, O.J. Sine generalized family of distributions: Properties, estimation, simulations and applications. Alex. Eng. J. 2024, 109, 532–552. [Google Scholar]
- Isa, A.; Ali, B.; Zannah, U. Sine burr xii distribution: Properties and application to real data sets. Arid. Zone J. Basic Appl. Res. 2022, 1, 48–58. [Google Scholar]
- Faruk, M.U.; Isa, A.M.; Kaigama, A. Sine-Weibull Distribution: Mathematical Properties and Application to Real Datasets. Reliab. Theory Appl. 2024, 19, 65–72. [Google Scholar]
- Mir, A.A.; Ahmad, S. Modeling and Analysis of Sine Power Rayleigh Distribution: Properties and Applications. Reliab. Theory Appl. 2024, 19, 703–716. [Google Scholar] [CrossRef]
- Mahmood, Z.; Chesneau, C.; Tahir, M.H. A new sine-G family of distributions: Properties and applications. Bull. Comput. Appl. Math. 2019, 7, 53–81. [Google Scholar]
- Al-Babtain, A.A.; Elbatal, I.; Chesneau, C.; Elgarhy, M. Sine Topp-Leone-G family of distributions: Theory and applications. Open Phys. 2020, 18, 574–593. [Google Scholar]
- Tomy, L.; Chesneau, C. The sine modified Lindley distribution. Math. Comput. Appl. 2021, 26, 81. [Google Scholar] [CrossRef]
- Ahmad, A.; Alsadat, N.; Atchade, M.N.; ul Ain, S.Q.; Gemeay, A.M.; Meraou, M.A.; Almetwally, E.M.; Hossain, M.M.; Hussam, E. New hyperbolic sine-generator with an example of Rayleigh distribution: Simulation and data analysis in industry. Alex. Eng. J. 2023, 73, 415–426. [Google Scholar]
- Chesneau, C.; Jamal, F. The sine Kumaraswamy-G family of distributions. J. Math. Ext. 2020, 15, 1–33. [Google Scholar]
- Osi, A.A.; Abubakar, U.; Isma’Il, L.A. Sine generalized odd log-logistic family of distributions: Properties and application to real data. Reliab. Theory Appl. 2024, 19, 190–200. [Google Scholar]
- Ahmadini, A.A.H. Statistical Inference of Sine Inverse Rayleigh Distribution. Comput. Syst. Sci. Eng. 2022, 41, 405–414. [Google Scholar]
- Rayleigh, L. XII. On the Resultant of a Large Number of Vibrations of the Same Pitch and of Arbitrary Phase. Lond. Edinb. Dublin Philos. Mag. J. Sci. 1880, 10, 73–78. [Google Scholar] [CrossRef]
- Surles, J.; Padgett, W. Inference for Reliability and Stress-Strength for a Scaled Burr Type X Distribution. Lifetime Data Anal. 2001, 7, 187–200. [Google Scholar] [CrossRef]
- Kundu, D.; Raqab, M.Z. Generalized Rayleigh Distribution: Different Methods of Estimations. Comput. Stat. Data Anal. 2005, 49, 187–200. [Google Scholar] [CrossRef]
- Kamnge, J.S.; Chacko, M. Half logistic exponentiated inverse Rayleigh distribution: Properties and application to life time data. PLoS ONE 2025, 20, e0310681. [Google Scholar]
- Ogunde, A.A.; Dutta, S.; Almetawally, E.M. Half logistic generalized Rayleigh distribution for modeling hydrological data. In Annals of Data Science; Springer: Berlin/Heidelberg, Germany, 2024; pp. 1–28. [Google Scholar]
- Ajami, M.; Jahanshahi, S. Parameter estimation in weighted Rayleigh distribution. J. Mod. Appl. Stat. Methods 2017, 16, 14. [Google Scholar]
- Abdulrahman, A.T.; Rashedi, K.A.; Alshammari, T.S.; Hussam, E.; Alharthi, A.S.; Albayyat, R.H. A new extension of the Rayleigh distribution: Methodology, classical, and Bayes estimation, with application to industrial data. AIMS Math. 2025, 10, 3710–3733. [Google Scholar]
- Kilai, M.; Waititu, G.A.; Kibira, W.A.; Abd El-Raouf, M.; Abushal, T.A. A new versatile modification of the Rayleigh distribution for modeling COVID-19 mortality rates. Results Phys. 2022, 35, 105260. [Google Scholar]
- Mahmood, Z.; Jawa, T.M.; Sayed-Ahmed, N.; Khalil, E.; Muse, A.H.; Tolba, A.H. An extended cosine generalized family of distributions for reliability modeling: Characteristics and applications with simulation study. Math. Probl. Eng. 2022, 2022, 3634698. [Google Scholar]
- Obi, C.D.; Chukwuma, P.O.; Igbokwe, C.P.; Ibeakuzie, P.O.; Anabike, I.C. A Novel Extension of Rayleigh Distribution: Characterization, Estimation, Simulations and Applications. J. Xidian Univ. 2024, 18, 177–188. [Google Scholar]
- Khalaf, A.A.; Khaleel, M.A.; Jawa, T.M.; Sayed-Ahmed, N.; Tolba, A.H. A Novel Extension of the Inverse Rayleigh Distribution: Theory, Simulation, and Real-World Application. Appl. Math. 2025, 19, 467–488. [Google Scholar]
- Muse, A.H.; Tolba, A.H.; Fayad, E.; Abu Ali, O.A.; Nagy, M.; Yusuf, M. Modelling the COVID-19 mortality rate with a new versatile modification of the log-logistic distribution. Comput. Intell. Neurosci. 2021, 2021, 8640794. [Google Scholar]
- Bhat, A.A.; Ahmad, S.P. An Extension of Exponentiated Rayleigh Distribution: Properties and Applications. Thail. Stat. 2023, 21, 209–227. [Google Scholar]
- Anabike, I.C.; Okoro, E.S.; Igbokwe, C.P.; Ibeakuzie, P.O.; Ekemezie, D. New Extended Rayleigh Distribution: Properties, Estimation, Simulation and Application. J. Xidian Univ. 2024, 18, 179–207. [Google Scholar]
- Khaleel, A.H. Reliability Function of (1 Strength and 4 Stresses) for Rayleigh distribution. Basrah J. Sci. 2024, 42, 13–22. [Google Scholar]
- Swain, J.J.; Venkatraman, S.; Wilson, J.R. Least-squares estimation of distribution functions in Johnson’s translation system. J. Stat. Comput. Simul. 1988, 29, 271–297. [Google Scholar] [CrossRef]
- Cheng, R.; Amin, N. Estimating parameters in continuous univariate distributions with a shifted origin. J. R. Stat. Soc. Ser. Methodol. 1983, 45, 394–403. [Google Scholar]
- Ranneby, B. The maximum spacing method. An estimation method related to the maximum likelihood method. Scand. J. Stat. 1984, 11, 93–112. [Google Scholar]
- Al-Aqtash, R.; Lee, C.; Famoye, F. Gumbel-Weibull distribution: Properties and applications. J. Mod. Appl. Stat. Methods 2014, 13, 11. [Google Scholar]
- Smith, R.L.; Naylor, J. A comparison of maximum likelihood and Bayesian estimators for the three-parameter Weibull distribution. J. R. Stat. Soc. Ser. C Appl. Stat. 1987, 36, 358–369. [Google Scholar]
- Ahmad, A.; Ain, S.Q.U.; Tripathi, R.; Ahmad, A. Inverse Weibull-Rayleigh Distribution Characterisation with Applications Related Cancer Data. Reliab. Theory Appl. 2021, 16, 364–382. [Google Scholar]
- Merovci, F. Transmuted Rayleigh Distribution. Austrian J. Stat. 2013, 42, 21–31. [Google Scholar] [CrossRef]
- Lone, M.A.; Dar, I.H.; Jan, T. An Innovative Method for Generating Distributions: Applied to Weibull Distribution. J. Sci. Res. 2022, 66, 308–315. [Google Scholar] [CrossRef]
- Bhat, A.A.; Ahmad, S.P. A New Generalization of Rayleigh Distribution: Properties and Applications. Pak. J. Stat. 2020, 36, 47–56. [Google Scholar]
Disclaimer/Publisher’s Note: The statements, opinions and data contained in all publications are solely those of the individual author(s) and contributor(s) and not of MDPI and/or the editor(s). MDPI and/or the editor(s) disclaim responsibility for any injury to people or property resulting from any ideas, methods, instructions or products referred to in the content. |
© 2025 by the authors. Licensee MDPI, Basel, Switzerland. This article is an open access article distributed under the terms and conditions of the Creative Commons Attribution (CC BY) license (https://creativecommons.org/licenses/by/4.0/).