Abstract
In this article, we introduce a distribution that is an extension of the Power Maxwell (PM) distribution, which is based on the quotient of two independent random variables. These are the PM and a gamma distribution, respectively. In this way, the result is a model with greater kurtosis than the PM distribution. We study its probability density function and some properties, such as moments, asymmetry and kurtosis coefficient. An EM algorithm is proposed to estimate the parameters via the maximum likelihood method. A simulation study is carried out to study the asymptotic behaviour of our estimators. An application to a real dataset is also included.
MSC:
60E05; 62E15; 62F10
1. Introduction
A distribution that is related to the normal distribution is the slash distribution. The quotient between two independent random variables serves as its representation, one normal and the other a power of the uniform distribution. As a result, if S has a slash distribution, then
where , Z is independent of U, and . If , then the canonical slash distribution is obtained, and when , the standard normal distribution is obtained. The probability density function (PDF) of the canonical slash is
where represents the standard normal pdf expression (see [1]). This distribution’s tails are heavier than the normal distribution, indicating a higher kurtosis. Rogers and Tukey (1972) [2] and Mosteller and Tukey (1977) [3] extensively discussed the characteristics of this distribution. Kafadar (1982) [4] provided a detailed discussion on the maximum likelihood estimators of location and scale parameters. Wang and Genton (2006) [5] introduced a multivariate version of the slash distribution as well as a multivariate skew version. In a different study, Gómez et al. (2019) [6] applied this methodology to extend the Gumbel distribution and analyze environmental data.
Singh et al. (2018) [7] introduced the Power Maxwell (PM) distribution. So, it is said that X has a PM distribution if its pdf is
with and parameters. We denote this fact as .
Segovia et al. (2020) [8] recently introduced the Slashed Power Maxwell (SPM) distribution and used it for outlier data modeling. The usual quotient of the slash method was considered:
where X and U are independent, , . In 1986, Prudnikov et al. (see Equation (2.3.1.13)) [9] proposed the function introduced in Definition 1, which is crucial to obtain the new distribution’s pdf.
Definition 1.
For , , , and . Let
where is defined as in Prudnikov et al. (1986) in Equation (2.3.1.13) [9]. This integral converges for all values of γ, a, r, and s in the specified domains and will be used in the next sections since the probability density function is expressed in terms of this (for details, see Appendix A).
This paper aims to introduce a new extension of the PM distribution called the Modified Slash Power Maxwell (MSPM) distribution. In order to clarify the usefulness of our proposal, recall that the Maxwell distribution is a key model in physics, chemistry, and statistical mechanics, proposed to describe how molecular motion varies due to collisions and temperature changes in ideal gases; see [10]. The original Maxwell distribution only has a scale parameter, . The PM model proposed by Singh et al. [7] was built as the power of a Maxwell distribution. In this way, a shape parameter, , is introduced, which allows for modelling a variety of situations. However, quite often, we find a need for more general models, which are necessary to improve the description of data with heavy tails. In this sense, the slash methodology can be applied. So, our motivation lies in proposing a distribution in the outlier context when a Maxwell or PM model are candidates for describing a dataset. Some studies on slash-type distributions are [11,12,13]. There, the slash methodology was applied considering an exponential distribution at the denominator of (1). It was shown there that if q decreases, then the kurtosis of the model considered as the starting point increases. So, following this methodology, and taking as starting point the Maxwell or PM distribution, a new three-parameter model can be introduced, whose parameters hold as follows: is a scale parameter, is a shape parameter, and q is able to describe heavy right tails.
Moreover, recall that the slash methodology proposed in Reyes et al. (2013) [14], called the modified slash distribution, is not only an extension of the normal distribution with more kurtosis, it also has heavier tails than the slash distribution originally proposed in Rogers and Tukey [2] with a distribution at the denominator of (1). Thus, although another slash extension of the PM distribution has been recently introduced by Segovia et al. (2020) [8], we show that our proposal achieves heavier tails, as intended.
In addition to the previously mentioned application areas, the Maxwell, PM, and MSPM are also of interest in reliability. We highlight that in this field, by applying our proposal, non-monotone hazard rate functions can be obtained.
This paper is organized as follows. Section 2 introduces the MSPM distribution, its stochastic representation, pdf, survival, and hazard functions. These characteristics are comparable to those for the Slash Power Maxwell proposed by Segovia et al. (2020) [8]. Moments, asymmetry, and kurtosis coefficients are also discussed. Section 3 is devoted to inference. The Expectation–Maximization (EM) algorithm is applied to estimate the parameters via the maximum likelihood (ML) method. Section 4 presents a simulation study that emphasizes parameter recovery and comparison criteria. Section 5 presents an application of the MSPM distribution to real data, showing that it can be fitted to different datasets. Finally, Section 6 concludes the research by summarizing the main findings.
To conclude this section, we point out that for nonnegative data with a heavy right tail, other heavy-tailed distributions could be considered. Among others, we can cite the following: the modified slash Rayleigh, modified half-normal, and modified chi-square distributions—details can be seen in Barranco-Chamorro et al. [13]. In this paper, we focus on the comparison of MSPM to PM and SPM, in order to illustrate how the slash methodology based on the exponential distribution can provide a better fit than the one based on the distribution.
2. Materials and Methods
2.1. Stochastic Representation
Definition 2.
A random variable Z follows a Modified Slash Power Maxwell (MSPM) distribution with parameters α, β, and q if Z is obtained as
where X and Y are independent, , with mean , , , and . Equation (5) is denoted as .
2.2. Properties
The following proposition presents the pdf for the MSPM distribution, which is based on (5).
Proposition 1.
Let . Then, the pdf of Z is given by
where , , and are the parameters, and was defined in (4). Regarding the Prudnikov integral (4) shown in the pdf, the integration was performed under the cubeintegrate function of the R software 4.3.1 version. The result was saved in a function, and called for the pdf of the MSPM distribution.
Proof.
Using the representation given in (5), the Jacobian transformation can be computed. So, we have that and ; hence, and .
Then,
Hence, by marginalizing with respect to the random variable W and making the variable change , we obtain
which corresponds to the pdf of the random variable Z. □
Table 1 provides a brief comparison of for different values of z between the MSPM and SPM distribution proposed in Segovia et al. (2020) [8]. In both cases, increases when q decreases. Moreover, this table illustrates that the right tail in the MSPM is heavier.

Table 1.
Right tail comparison for different values of parameters in the and distributions.
Figure 1 shows the plot of the pdf for the MSPM model comparable to the SPM model, for and fixed and different values of q—.
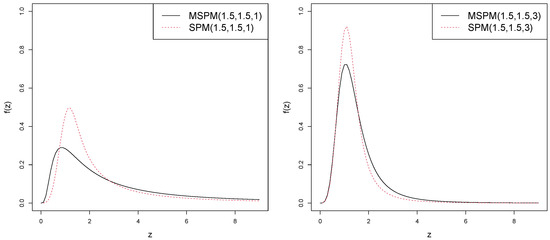
Figure 1.
Comparison plots for the pdf in MSPM and SPM models with different values of q.
Corollary 1.
Let . Then, the cumulative distribution function (CDF), survival function, and hazard function of Z are given by
Regarding the computation of the CDF of the MSPM distribution, in particular, the integration where the argument is a function of the Prudnikov integral (4), first, a R function was created for the Prudnikov integral and then vectorized with the Vectorize function in R. Afterwards, thanks to the vectorization of this R function, an usual integration procedure was carried out with the integrate function of R.
Proof.
Straightforward from the definition of these functions. □
Figure 2, Figure 3 and Figure 4 show a comparison plot of the CDF, survival function, and hazard function for the MSPM and SPM distribution for fixed and and varying q.
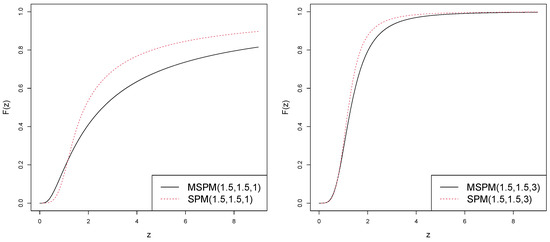
Figure 2.
Comparison plots of the CDF for the MSPM and SPM distribution.
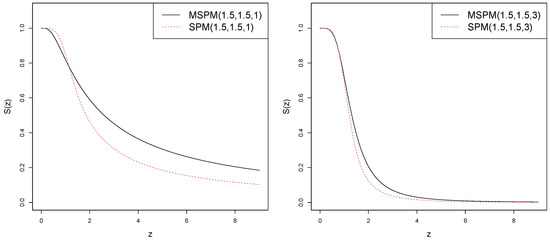
Figure 3.
Comparison plots of the survival function for the MSPM and SPM distribution.
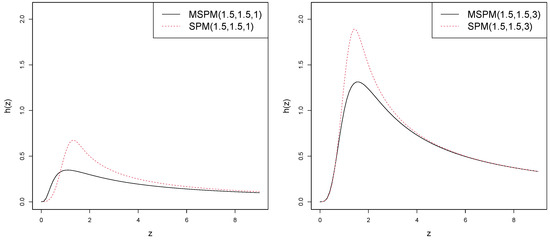
Figure 4.
Comparison plots of the hazard function for the MSPM and SPM distribution.
Proposition 2.
Let be the order statistics of a random sample , such that , for . Then, the PDF of is given by
where
and
.
Proof.
The given expression follows from the fact that
with and the PDF and CDF of ; see Balakrishnan et al. [15]. □
Corollary 2.
Let be a random sample such that , for . The pdf of the minimum and maximum are
Proposition 3.
Let . The Shannon entropy of Z is given by where , and
Proof.
It follows from ; see [16]. □
2.3. Relationships Among Distributions
Next, the asymptotic behaviour of when is studied. The subscript q is used to highlight this point: .
Proposition 4.
Let . If , then converges in law to a .
Proof.
Let . Then, by the representation given in the (5), we have that , where and . First, we study the probability convergence of to 1. We have that , where is the gamma function.
If , then . This implies that . Applying Slutsky’s lemma to [17], we obtain the result. □
Proposition 4 means that the model can be approached by a distribution when . This result along with the relationships among the MSPM and its particular cases are summarized in Figure 5.
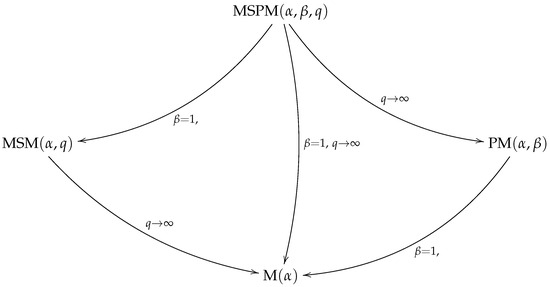
Figure 5.
Particular cases for the MSPM distribution.
2.4. Moments
Next, we present a general formula for the rth moment of the MSPM distribution and show the behavior of the asymmetry and kurtosis coefficients.
Proposition 5.
Let Then, for , the rth moment of Z is
Proof.
By using the stochastic representation for the distribution given in (5), we have
Since , for .
On the other hand, since , its -moment, denoted as , is
□
Corollary 3.
If , then
- 1.
- for ;
- 2.
- for ;
- 3.
- for ;
- 4.
- for ;
- 5.
- , for ,
where denotes the -moment of the distribution, introduced in (9).
Next, we study the asymptotic behaviour for the moment of the MSPM distribution when .
Corollary 4.
Let . Then, for fixed r,
with the -moment of the distribution.
Proof.
It follows from the representation of given in (8) and the fact that, for fixed r, . □
Proposition 6.
Let Then, the characteristic function, , can be numerically computed as
Remark 1.
The asymmetry and kurtosis coefficients can be obtained by using the following expressions:
respectively.
Corollary 5.
Let . Then, the asymmetry and kurtosis coefficients are
Remark 2.
Note that, from the expression of given in (9), we have that , where ∝ means proportional to. Therefore, and given in Corollary 5 do not depend on α. Both coefficients only function on parameters. This issue is next studied.
Figure 6 and Figure 7 provide plots for the asymmetry (left) and kurtosis (right) coefficient, as functions of in the and , respectively. The parameter is fixed at 1 due to its irrelevance. It can be appreciated that the kurtosis coefficient reaches higher values in the model. This fact is clearer in Figure 8 where the kurtosis coefficient is compared to for the (grey) and (green) distribution.
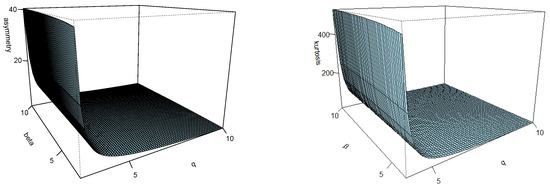
Figure 6.
Skewness (left) and kurtosis (right) for the distribution.
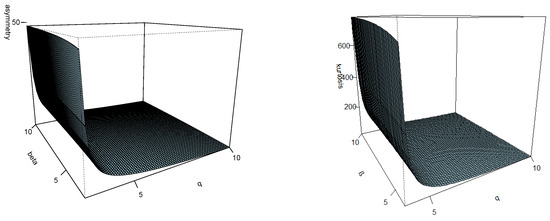
Figure 7.
Skewness (left) and kurtosis (right) for the distribution.
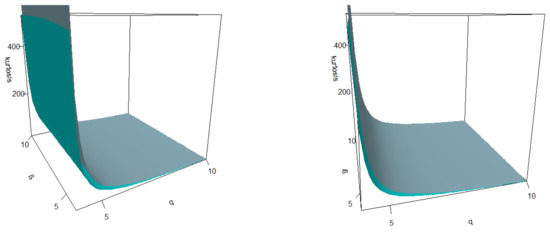
Figure 8.
Kurtosis comparison between in grey color (over) and green color (under).
3. Inference
This section focuses on the inferential aspects of the MSPM model, with parameter estimation conducted using the maximum likelihood (ML) method and EM algorithm.
3.1. ML Estimators
This subsection presents the equation necessary to find the ML estimators. Let be a random sample such that . The log-likelihood can be expressed as
where , , and . The ML estimators are obtained by maximizing the log-likelihood function given in (10). Such estimators can be computed by solving the following equations:
This system of equations must be solved numerically using an appropriate root-finding procedure. The method of moments estimator can serve as a means to obtain initial values for the iterative process. The optim routine of the R package can also be implemented to maximize the log-likelihood (10). As can be noted, Equation (11) can be complicated to solve. Hence, we propose another option for finding the ML estimators.
3.2. EM Algorithm
This subsection presents our model’s Expectation–Maximization algorithm (EM). This iterative method is used to obtain the ML estimators in statistical models. The algorithm consists of two main steps: the expectation step (E-step) and the maximization step (M-step). In the E-step, the algorithm computes the expected value of the unobserved (latent) variables given the observed data and the current estimates of the parameters. The M-step maximizes the likelihood function by updating the parameter estimates using the expected values obtained in the E-step. The EM algorithm continues its iterations between the E-step and the M-step until convergence is reached, i.e., the parameter estimates no longer significantly change. At this point, the algorithm provides the maximum likelihood estimates of the parameters [18]. First, the algorithm derivation will be presented. Afterward, a summary of the implementation will be explained.
Let be a random sample, such that , for . We will work with a reparametrization of the MSPM distribution for computational advantages. That is, by using the stochastic representation given in (5), and considering the reparametrization , we obtain
So, we have the following hierarchical model:
where is the latent variable and Z is the observable variable. Now, consider the new parameter vector ; we have the following proportionality relationship for the complete-data log-likelihood or full log-likelihood function, denoted as :
Let us denote . Then,
where
with , , and
.
Now, note that the pdf of is
which implies
Thus, the following EM algorithm can be proposed.
Step E: Calculate using (16).
Step CME-II: Update using (19).
Once some stop criteria have been completed, perform to obtain the estimators. For example, one stop criterion could be . Figure 9 shows the workflow for the EM algorithm.

Figure 9.
EM algorithm workflow for the MSPM distribution.
3.3. ML Estimators for Censored Data
Survival analysis is a branch of statistics for studying the time until a certain event occurs, commonly known as failure or survival times. There are various scenarios where such analysis can be performed, mainly used in medicine to study death time. However, there are other contexts, like engineering or social science, where survival analysis can be applied. Regarding human subjects research, it is natural to expect missing data related to the failure time—that is, some subjects will be studied only until a certain time because, for some reason, they left the study. This is known as right-censored data, formally defined as follows [19]: Let and be the time to event and censoring for the i-th individual, respectively. For each subject, we observe , and the censoring indicator . Therefore, if we assume , obtaining the random sample , then the log-likelihood function can be expressed as
where , , , and is the survival function of the MSPM distribution. The ML estimators are obtained by maximizing the log-likelihood function given in Equation (20). Such estimators can be computed by solving the following equations:
where
with and . Just as in Section 3.1, the systems of Equation (21) must be solved numerically using an appropriate root-finding procedure. The optim routine of the R package [20] can also be implemented to maximize the log-likelihood (20).
4. Simulation
In this section, a simulation study of 500 experiments was performed to study the ML estimator behavior for the MSPM distribution, with a sample size of , and five sets of parameters. The ML estimates were obtained using the EM algorithm previously described. For every sample size and parameter set, Table 2 summarizes the simulation study results by presenting the Monte Carlo mean of the ML estimates and their standard deviations (SDs). These results suggest that, as the sample size increases, the SD of the ML estimates decreases.

Table 2.
MSPM distribution simulation study summary results.
5. Application
This application analyzes a dataset on Australian athletes that was gathered to study how blood characteristics vary according to the athlete’s sport, body size, sex, and other variables. In particular, we focus on the white blood cell count (wcc). See Table 3 for descriptive analysis. There, the sample size n, the sample mean , the sample variance , the sample asymmetry coefficient , and the sample curtosis coefficient are given. Recall that and .

Table 3.
Descriptive statistics of wcc for the athlete dataset.
Three different probability models are proposed. These are the MSPM, SPM, and PM distributions. ML estimates are obtained for every model, and the fit provided with the optimal parameters is studied to the observed data. Subsequently, a comparison of fitted models is performed using well-established criteria in statistical theory, such as the Akaike Information Criterion (AIC [21]) and the Bayesian Information Criterion (BIC [22]).
AIC and BIC are metrics that evaluate the quality of a model’s fit to the data, considering both the goodness of fit and the penalty for model complexity. The preferred model will be chosen by comparing the AIC and BIC values, seeking to select the model that minimizes these metrics, which indicates a better generalization capacity of the model to fit unobserved data. See Table 4 for details, where the logarithm of the likelihood function (LLF), on which AIC and BIC are based, and these criteria are given. Note that the MSPM fit achieves a lower AIC and BIC than its competitors, which can be visually corroborated in Figure 10 and Figure 11, where it can be seen that the proposed MSPM model exhibits a better behavior compared to the other ones. As is well known, evaluating the CDF on its corresponding random variable is distributed according to Uniform. Thus, Figure 12 shows a QQ plot for each model where the CDF of each sample value is computed, given the respective ML estimators, and compared with the theoretical quantiles of the Uniform distribution. As theory indicates, if a model is well fitted, then the resulting values should follow a Uniform distribution. It can be noted how our model performs very well compared to this distribution. Additionally, the Cramer–von Mises test (see [23,24]) under such values was conducted to test the null hypothesis that they follow a Uniform distribution. See the p-value row of Table 4, showing that our proposed model definitely does not reject the null hypothesis under any usual p-value criterion [23].

Table 4.
Estimated parameters and their standard errors (in parentheses) for the MSPM, SPM, and PM models for the athlete dataset. The AIC and BIC criteria are also included.
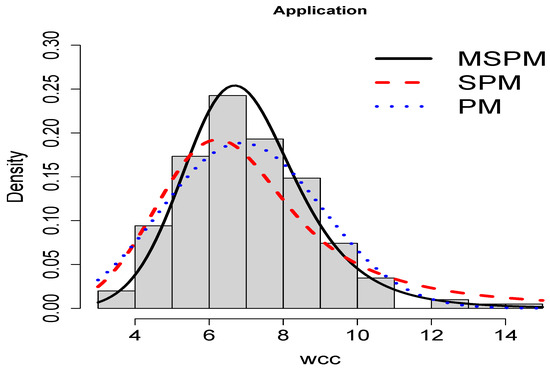
Figure 10.
Fitted models by maximum likelihood method for athlete dataset.
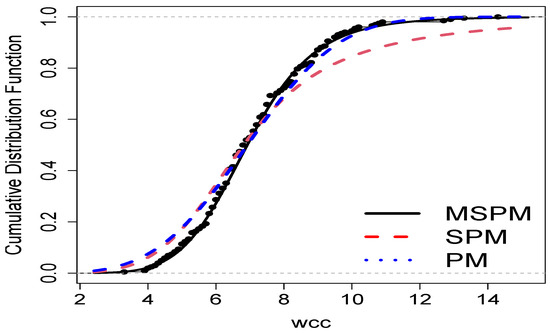
Figure 11.
Empirical and fitted MSPM cdf for the athlete dataset.
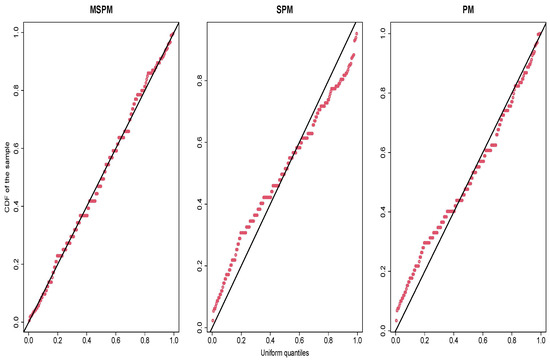
Figure 12.
QQ plot of the MSPM (left), SPM (center), and PM (right) models, where the CDFs evaluated on each sample value, given the respective estimators, are compared with the theoretical Uniform quantiles.
6. Conclusions
In this article, the Modified Slash Power Maxwell (MSPM) distribution is introduced as an enhanced version of the Power Maxwell (PM) distribution to model atypical data. The MSPM distribution is specifically designed to effectively model data outliers that exhibit higher kurtosis than the PM distribution. A detailed explanation of the MSPM distribution is presented by studying some of its properties. Results are proposed for the pdf, cdf, survival, and hazard functions of this model in terms of a hypergeometric type function. In particular, a closed-form expression of the kurtosis coefficient was obtained, allowing us an easy visualization of the kurtosis behavior depending on the parameter choice. Regarding estimation, an algorithm was proposed that leverages the expectation–maximization (EM) algorithm for precise parameter inference.
We highlight the comparison between the MSPM and the Slashed Power Maxwell (SPM) that was carried out, which reveals that the MSPM exhibits heavier tails than the PM distribution, making it well suited for modeling extreme data. This development presents a valuable asset for analyzing heavy-tailed data and holds potential applications in various domains, such as meteorology, finance, and medicine, as can be seen in the application section. To conclude, it can be stated that the MSPM represents a noteworthy progression in the field of extreme data modeling and broadens our analytical capacities across various disciplines.
Author Contributions
Conceptualization, F.A.S., Y.M.G. and H.W.G.; software, F.A.S. and H.J.G.; formal analysis, F.A.S., Y.M.G., H.W.G. and I.B.-C.; investigation, F.A.S., Y.M.G., I.B.-C. and H.W.G.; data curation; H.J.G.; writing—original draft preparation, F.A.S., Y.M.G. and H.W.G.; writing—review and editing, F.A.S., Y.M.G., H.J.G., H.W.G. and I.B.-C.; validation, H.J.G.; supervision, Y.M.G. and H.W.G.; funding acquisition, Y.M.G. and I.B.-C. All authors have read and agreed to the published version of the manuscript.
Funding
Francisco A. Segovia was funded by the National Agency for Research and Development (ANID)/Scholarship Program/Doctorado Nacional/2021-21211426. The research of I. Barranco-Chamorro was supported by the IOAP of the University of Seville, Spain.
Data Availability Statement
The datasets are available in the references given in Section 5.
Conflicts of Interest
The authors declare no conflicts of interest.
Abbreviations
The following abbreviations for distributions are used in this manuscript:
| M | Maxwell |
| PM | Power Maxwell |
| SPM | Slash Power Maxwell |
| MSM | Modified Slash Maxwell |
| MSPM | Modified Slash Power Maxwell |
Appendix A
For , , and , we have
considering that , , and are coprime integers, where , , and is the generalized hypergeometric function (see [25]), defined by
where .
References
- Johnson, N.L.; Kotz, S.; Balakrishnan, N. Continuous Univariate Distributions, 2nd ed.; Wiley: New York, NY, USA, 1995; Volume 1. [Google Scholar]
- Rogers, W.H.; Tukey, J.W. Understanding some long-tailed symmetrical distributions. Statist. Neerl. 1972, 26, 211–226. [Google Scholar]
- Mosteller, F.; Tukey, J.W. Data Analysis and Regression; Addison-Wesley: Reading, MA, USA, 1977. [Google Scholar]
- Kafadar, K. A biweight approach to the one-sample problem. J. Amer. Statist. Assoc. 1982, 77, 416–424. [Google Scholar]
- Wang, J.; Genton, M.G. The multivariate skew-slash distribution. J. Stat. Plan. Inference 2006, 136, 209–220. [Google Scholar] [CrossRef]
- Gómez, Y.M.; Bolfarine, H.; Gómez, H.W. Gumbel distribution with heavy tails and applications to environmental data. Math. Comput. Simul. 2019, 157, 115–129. [Google Scholar] [CrossRef]
- Singh, A.; Bakouch, H.; Kumar, S.; Singh, U. Power Maxwell distribution: Statistical Properties, Estimation311 and Application. arXiv 2018, arXiv:1807.01200v1. [Google Scholar]
- Segovia, F.A.; Gómez, Y.M.; Venegas, O.; Gómez, H.W. Power Maxwell distribution with heavy tails and applications. Mathematics 2020, 8, 1116. [Google Scholar] [CrossRef]
- Prudnikov, A.P.; Brychkov, Y.A.; Marichev, O.I. Integrals and Series; Gordon and Breach Science Publishers: Amsterdam, The Netherlands, 1986; Volumes 1–3. [Google Scholar]
- Maxwell, J.C. On the Dynamical Theory of Gases; Royal Society: London, UK, 1866; Volume 15, pp. 167–171. [Google Scholar]
- Reyes, J.; Iriarte, Y.A. A New Family of Modified Slash Distributions with Applications. Mathematics 2023, 11, 3018. [Google Scholar] [CrossRef]
- Castillo, J.S.; Rojas, M.A.; Reyes, J. A More Flexible Extension of the Fréchet Distribution Based on the Incomplete Gamma Function and Applications. Symmetry Math. 2023, 15, 1608. [Google Scholar]
- Barranco-Chamorro, I.; Iriarte, Y.A.; Gómez, Y.M.; Astorga, J.M.; Gómez, H.W. A generalized Rayleigh family of distributions based on the modified slash model. Symmetry 2021, 13, 1226. [Google Scholar] [CrossRef]
- Reyes, J.; Gómez, H.W.; Bolfarine, H. Modified slash distribution. Statistics 2013, 47, 929–941. [Google Scholar] [CrossRef]
- Balakrishnan, N.; Cohen, C.A. Order Statistics and Inference: Estimation Methods; Statistical Modeling and Decision Science; Elsevier Science: Amsterdam, The Netherlands, 1991. [Google Scholar]
- Jones, D. Elementary Information Theory; Clarendon Press: Oxford, UK, 1979. [Google Scholar]
- Lehman, L.E. Elements of Large-Sample Theory; Springer: New York, NY, USA, 1999. [Google Scholar]
- Dempster, A.; Laird, N.; Rubin, D. Maximum likelihood from incomplete data via the EM algorithm. J. R. Stat. Society. Ser. B 1977, 39, 1–38. [Google Scholar]
- Lawless, J.F. Statistical Models and Methods for Lifetime Data; John Wiley & Sons: Hoboken, NJ, USA, 2003. [Google Scholar]
- R Core Team. R: A Language and Environment for Statistical Computing; R Foundation for Statistical Computing: Vienna, Austria, 2024; Available online: https://www.R-project.org/ (accessed on 15 December 2024).
- Akaike, H. A new look at the statistical model identification. IEEE Trans. Auto. Contr. 1974, 19, 716–723. [Google Scholar] [CrossRef]
- Schwarz, G. Estimating the dimension of a model. Ann. Stat. 1978, 6, 461–464. [Google Scholar] [CrossRef]
- von Mises, R.E. Wahrscheinlichkeit Statistik und Wahrheit; Julius Springer: Berlin, Germany, 1928. [Google Scholar]
- Cramér, H. On the Composition of Elementary Errors. Scand. Actuar. J. 1928, 1928, 13–74. [Google Scholar] [CrossRef]
- Zörnig, P. On Generalized Slash Distributions: Representation by Hypergeometric Functions. Stats 2019, 2, 371–387. [Google Scholar] [CrossRef]
Disclaimer/Publisher’s Note: The statements, opinions and data contained in all publications are solely those of the individual author(s) and contributor(s) and not of MDPI and/or the editor(s). MDPI and/or the editor(s) disclaim responsibility for any injury to people or property resulting from any ideas, methods, instructions or products referred to in the content. |
© 2025 by the authors. Licensee MDPI, Basel, Switzerland. This article is an open access article distributed under the terms and conditions of the Creative Commons Attribution (CC BY) license (https://creativecommons.org/licenses/by/4.0/).