Abstract
An Erlang loss system, which is an queue, is a model used in various applications. In this paper, a controlled version of the process is defined. The objective is to maximize the expected time until the system is full when the service time is exponentially distributed. The control variable is the service rate. The dynamic programming equation satisfied by the value function F, from which the optimal control follows at once, is derived, and F is found explicitly when and . The problem of minimising the probability of the system being saturated is also considered.
Keywords:
M/G/s/s model; dynamic programming; first-passage time; homing problem; difference equations MSC:
93E20; 60K30
1. Introduction
In an queue, called an Erlang loss system, customers arrive according to a Poisson process of rate . The service time S can follow any distribution. There are s servers, and no room for potential customers to wait for service because the capacity of the system is also equal to s. As a result, if a customer arrives while the system is in state s, this customer is lost.
This model is used in various applications. In Smith et al. [1], it was applied to traffic distribution in cellular networks. Lee and Dudin [2] analysed the sojourn time and loss probability in a model of traffic control in communication networks.
Restrepo et al. [3] wanted to find out how to allocate a fleet of ambulances in order to keep response times to calls as small as possible. van Dijk and Kortbeek [4] computed bounds for the probability of rejection in operating theatre and intensive care unit systems.
In de Bruin et al. [5], the problem of interest was to determine the size of hospital wards. Hyytiä et al. [6] proposed a model related to an Erlang loss system to describe a single vehicle in a dial-a-ride transport system. They presented closed-form expressions for the blocking probability, the acceptance rate, and the mean sojourn time of the vehicle in the system.
Rastpour et al. [7] worked on the duration of red alerts for ambulance systems, which corresponds to times at which all ambulances are busy. Morozov et al. [8] were interested in the stability of a model for cognitive wireless networks and used a modified Erlang loss system. Finally, in Zimmerman et al. [9], the aim was to effectively manage the distribution of ventilators during the COVID-19 pandemic.
Recently, Lefebvre and Yaghoubi studied optimal control problems for queueing systems. In [10], they assumed that in the model, the server can choose between two service time distributions. The aim was to minimize the expected time needed to clear the queue of customers. In [11], there were k servers, and the objective was to determine how many servers should be used at any time to reduce the number of customers from to , where , as rapidly as possible. In both cases, the optimizer had to take quadratic control costs into account.
In this paper, we first suppose that the service time S has an exponential distribution with the parameter , so that the Erlang loss system becomes an queue. However, we assume that the parameter is actually a function, , of the number of customers in the system at time t and that the server can choose any (positive) service rate. The aim will be to determine the value of that maximizes the expected value of the time until the system is full, where k is the initial number of customers in the system. Then, we will consider the problem of minimising the probability that the system, when in equilibrium, is saturated in the interval . Finally, we will suppose that the parameter is a random variable R and compute the probability that the system (when in equilibrium) is saturated for various important distributions of R.
2. Optimal Service Rate
Let denote the number of customers at time t in an queue. We assume that . We define the random variable as follows:
In probability theory, is called the first-passage time. It is the first time that the system is full, given that there were k customers at the initial time 0. All the servers are assumed to serve at the same rate . The larger is, the longer it will take until . However, we take it for granted that serving faster is more costly for the system. More precisely, we consider the cost functional:
where and are constants and is a terminal cost function. Since is negative, a reward is received as long as the system is not full. There must therefore be a trade-off between working faster (so that is larger) and the quadratic costs thus incurred. The optimizer must also take into account the final cost . In this paper, we assume that is a constant .
When the service time S has an exponential distribution, we can use dynamic programming to determine the value of in the interval that minimizes the expected value of the cost criterion .
Many papers have been published on the optimal control of queueing systems; see, for instance, Chen and Xia [12], Su and Li [13], and Chen et al. [14]. The main difference between these papers and the present one is the fact that in our case, the final time is a random variable. Such problems are known as homing problems (see Whittle [15]). In a homing problem, the optimizer controls a stochastic process until a certain event occurs. In many applications, the final time is indeed neither fixed nor infinite, but rather random. For example, suppose that denotes the number of people suffering from a certain disease during an epidemic, and that we want to put an end to this epidemic as quickly as possible. In reality, the duration of the epidemic is obviously a random variable. Similarly, in the problem that we are studying, we cannot know how long it will take until the system is saturated.
Homing problems were first considered by Whittle [15] as n-dimensional diffusion processes. In practice, it is very difficult to find explicit and exact solutions to these problems in two or more dimensions, as this usually requires solving non-linear partial differential equations. Whittle [16] also generalised homing problems by considering a cost functional that takes into account the optimizer’s sensitivity to risk.
In Rishel [17], a homing problem for diffusion processes that can model the wear of devices was created. In addition to their papers on the optimal control of queueing systems, the author has solved homing problems for autoregressive processes ([18]) and in discrete times ([19]). In [19], the problem considered was in fact a stochastic dynamic game.
Now, we define the value function:
where “E” denotes the expected value. This function gives us the expected cost (or reward) obtained if the optimizer chooses the optimal service rate in the interval . Moreover, it satisfies the boundary condition
Remark 1.
Contrary to the problem in [10], here the problem that we study is time-invariant. Therefore, the value function depends only on the current state k. In addition, we now assume that the optimizer can choose any positive value of . In [10], there were only two possible values for the service rate.
In an queue, the random time A needed for a new customer to arrive is exponentially distributed with parameter . It follows that the probability that a customer will arrive in the interval is given by
When there are customers in the system, the time until a customer departs has an exponential distribution with the parameter . Hence,
The probability of at least two events (arrivals or departures) in any interval of length is equal to . Moreover, the random variables A and are assumed to be independent, which implies that Exp.
When , the random number of customers in the system at time is
If , we find that
Next, since has the same distribution as , we can write that
For , we find that
Making use of Bellman’s principle of optimality, we can express the expected value of the integral from to in terms of the value function at time :
We deduce from Equation (7) that
It then follows from Equation (10) that
That is,
Letting decrease to zero, we can state the following proposition.
Proposition 1.
Now, by differentiating the expression within the curly brackets in Equation (15) with respect to and setting it to zero, we find that
Corollary 1.
The optimal control can be expressed in terms of the value function as follows:
for .
Substituting the expression for in Equation (17) into the DPE, we find (after simplification) that to obtain the value function we must solve the non-linear second-order difference equation
where , subject to the boundary condition . In the remainder of this paper, we will assume that , so that .
Remark 2.
Suppose that we set for any k. That is, we consider the uncontrolled process . Then, we find that
Moreover, we can write that
where Exp for . Hence,
It follows that the value function must satisfy the inequation
2.1. The Case When
When , we find that . Equation (18) for becomes
2.2. The Case When
We now use and the following non-linear difference equations:
Making use of the mathematical software program Mathematica (https://www.wolfram.com/mathematica/online/), we find that the solution to systems (27) and (28), together with Equation (9), is
In the particular case where and , we obtain
This function of is shown in Figure 1. Notice that
which is the bound deduced from Equation (22). This result follows from the fact that when tends to infinity, the optimizer should choose for any . Similarly, with and , we obtain and .
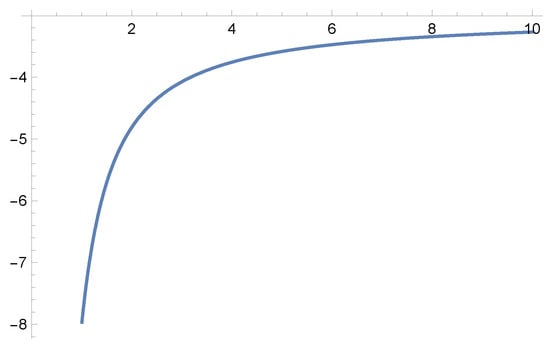
Figure 1.
Value function for when ; ; and .
The optimal controls are
3. Minimising the Probability of Saturation
When the Erlang loss system is in statistical equilibrium (or a steady state), the probability that it is in state k is given by the following (see [20]):
for . Thus, the probability that the system in equilibrium is saturated (or full), such that all the servers are busy, is
Suppose now that we start controlling the process when it is in equilibrium and that . Moreover, we assume, as in the preceding section, that the service time is an exponential random variable with parameter that depends on the state of the process, such that . We want to minimize the probability of saturation in the interval . We consider the cost functional
Proceeding as in Section 2, we obtain the following corollary to Proposition 1.
Corollary 2.
The value function satisfies the DPE
for . The boundary condition is .
Even in the case where , trying to express the optimal control in terms of the value function does not seem possible. Therefore, we will simplify the problem. Assume that the optimizer can only choose between or and cannot switch from to (or vice versa) in the interval . Then,
where or .
3.1. The Case When
Let be the event: the first transition of the process from state i is to state j. Using the fact that
we can write that
for . It follows that
Therefore, in order to determine whether is smaller when or , we must calculate
for and compare the two values of .
Suppose that , and . We must compare
The two straight lines cross at . As can be seen in Figure 2, the optimal solution is to choose for and for .
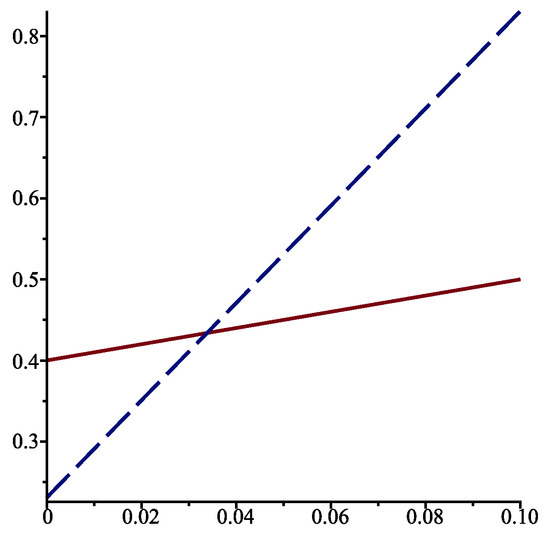
Figure 2.
for when , , (solid line), and (dotted line).
3.2. The Case When
We know that
and
With these values, we can proceed as in the case when to determine whether or is the optimal choice for . First, when , we compute
for . Let us again take , , and . We obtain
The optimal service rate is for and for ; see Figure 3.
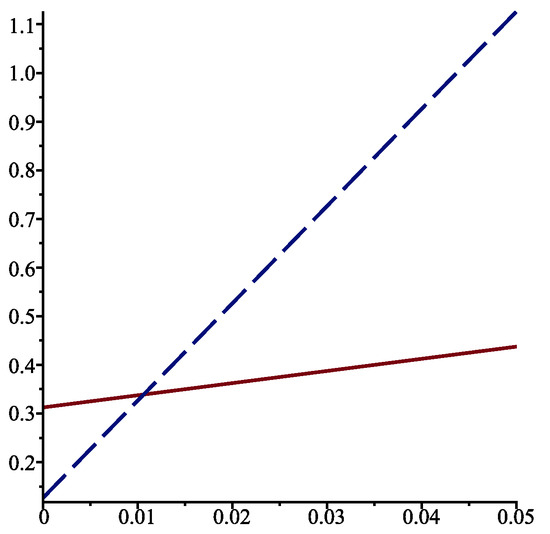
Figure 3.
for when , , (solid line), and (dotted line).
Similarly, when , we find that
This time, the optimal service rate is for and for ; see Figure 4.
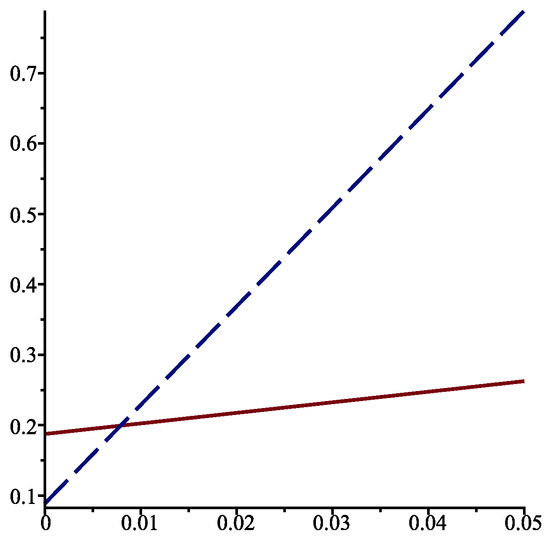
Figure 4.
for when , , (solid line), and (dotted line).
4. The Case in Which the Service Rate Is a Random Variable
To conclude this paper, we will consider the following problem: suppose that the service time S has an exponential distribution with parameter R, where R is itself a random variable. We would like to determine for which distribution of R, as it has a given expected value, the probability of saturation is minimized when the system is in equilibrium. To do so, assuming that R possesses a probability density function , we would have to minimize
under the constraints that
where is a given constant. The random variable R could be discrete, or even of mixed type, so that the density function may contain Dirac delta functions.
Instead of trying to find the function that minimizes , we will consider the most important probability distributions for R. We will treat this as a case in which and, for the sake of simplicity, set equal to 1. Moreover, we assume that . Hence, we must compute
for random variables such that
Suppose first that R is actually the constant 1. Then, we find that
Next, if R has a uniform distribution at the interval , we find that
Assume now that S has a gamma distribution with both parameters equal to , so that
We obtain , as required. If , Exp. We compute
The value of when is shown in Figure 5. We see that decreases with an increasing . For large , the limiting probability is approximately equal to 0.21.
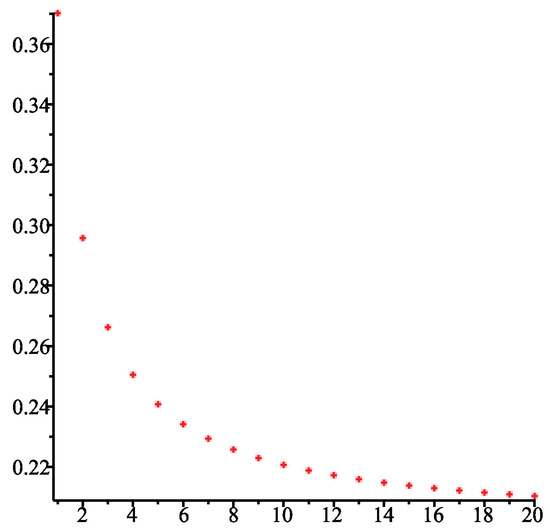
Figure 5.
Value of the probability of saturation when R has the gamma distribution defined in Equation (58), for .
Let
That is, the random variable R has a Rayleigh distribution with parameter . When , we find that . We calculate
Notice that for all the distributions considered above, the value of is larger than when .
If R is a discrete random variable taking the values 0.5 and 1.5 with probability of 1/2, we find that . When or with a probability of 1/2, where , and decreases as increases. More generally, if or , such that , the value of is greater than 1/5.
5. Conclusions
In this paper, a homing problem for an queueing model was considered. As mentioned in Section 1, this model is used in many applications. We were interested in maximising the expected time until the system becomes saturated. We were able to determine the optimal value of the service rate when the service time S has an exponential distribution, such that we are dealing with an queue. In this case, we can appeal to dynamic programming to obtain the equation satisfied by the value function. This equation is a non-linear second-order difference equation. The optimal control can be deduced from the value function.
In Section 3, we examined a related optimal control problem. However, we had to simplify the problem because it is not possible to explicitly express the optimal control in terms of the value function.
In Section 4, we wanted to minimize the probability of saturation when the service rate is a random variable R. Various types of distribution of R were considered.
In general, when the service time is not exponentially distributed, it is not possible to make use of dynamic programming. Indeed, if the probability in Equation (6) is not proportional to , theIS technique will fail. The same holds true if the random variable A does not have an exponential distribution. In those cases, another technique must be used for the queue.
Finally, we could modify the assumptions leading us to the model. For instance, the servers could serve at different rates and/or perhaps more than one customer at a time, or there could be batch arrivals, and so on.
Funding
This research was supported by the Natural Sciences and Engineering Research Council of Canada.
Institutional Review Board Statement
Not applicable.
Data Availability Statement
No new data were created or analysed in this study.
Acknowledgments
The author wishes to thank the anonymous reviewers of this paper for their constructive comments.
Conflicts of Interest
The author declares no conflicts of interest.
References
- Smith, P.J.; Sathyendran, A.; Murch, A.R. Analysis of traffic distribution in cellular networks. In Proceedings of the 1999 IEEE 49th Vehicular Technology Conference, Houston, TX, USA, 16–20 May 1999; Volume 3, pp. 2075–2079. [Google Scholar] [CrossRef]
- Lee, M.H.; Dudin, S.A. An Erlang loss queue with time-phased batch arrivals as a model for traffic control in communication networks. Math. Probl. Eng. 2008, 2008, 814740. [Google Scholar] [CrossRef]
- Restrepo, M.; Henderson, S.G.; Topaloglu, H. Erlang loss models for the static deployment of ambulances. Health Care Manag. Sci. 2009, 12, 67–79. [Google Scholar] [CrossRef] [PubMed]
- van Dijk, N.M.; Kortbeek, N. Erlang loss bounds for OT–ICU systems. Queueing Syst. 2009, 63, 253–280. [Google Scholar] [CrossRef]
- de Bruin, A.M.; Bekker, R.; van Zanten, L.; Koole, G.M. Dimensioning hospital wards using the Erlang loss model. Ann. Oper. Res. 2010, 178, 23–43. [Google Scholar] [CrossRef]
- Hyytiä, E.; Aalto, S.; Penttinen, A.; Sulonen, R. A stochastic model for a vehicle in a dial-a-ride system. Oper. Res. Lett 2010, 38, 432–435. [Google Scholar] [CrossRef]
- Rastpour, A.; Ingolfsson, A.; Kolfal, B. Modeling yellow and red alert durations for ambulance systems. Prod. Oper. Manag. 2020, 29, 1972–1991. [Google Scholar] [CrossRef]
- Morozov, E.; Rogozin, S.; Nguyen, H.Q.; Phung-Duc, T. Modified Erlang loss system for cognitive wireless networks. Mathematics 2022, 10, 2101. [Google Scholar] [CrossRef]
- Zimmerman, S.L.; Rutherford, A.R.; van der Waall, A.; Norena, M.; Dodek, P. A queuing model for ventilator capacity management during the COVID-19 pandemic. Health Care Manag. Sci. 2023, 26, 200–216. [Google Scholar] [CrossRef] [PubMed]
- Lefebvre, M.; Yaghoubi, R. Optimal service time distribution for an M/G/1 queue. Axioms 2024, 13, 594. [Google Scholar] [CrossRef]
- Lefebvre, M.; Yaghoubi, R. Optimal control of a queueing system. Optimization 2024, 1–14. [Google Scholar] [CrossRef]
- Chen, S.; Xia, L. Optimal control of admission prices and service rates in open queueing networks. IFAC-PapersOnLine 2017, 50, 928–933. [Google Scholar] [CrossRef]
- Su, Y.; Li, J. Optimality of admission control in an M/M/1/N queue with varying services. Stoch. Model. 2021, 37, 317–334. [Google Scholar] [CrossRef]
- Chen, G.; Liu, Z.; Xia, L. Event-based optimization of service rate control in retrial queues. J. Oper. Res. Soc. 2023, 74, 979–991. [Google Scholar] [CrossRef]
- Whittle, P. Optimization over Time; Wiley: Chichester, UK, 1982; Volume I. [Google Scholar]
- Whittle, P. Risk-Sensitive Optimal Control; Wiley: Chichester, UK, 1990. [Google Scholar]
- Rishel, R. Controlled wear process: Modeling optimal control. IEEE Trans. Autom. Control 1991, 36, 1100–1102. [Google Scholar] [CrossRef]
- Lefebvre, M. The homing problem for autoregressive processes. IMA J. Math. Control Inform. 2022, 39, 322–344. [Google Scholar] [CrossRef]
- Lefebvre, M. A discrete-time homing problem with two optimizers. Games 2023, 14, 68. [Google Scholar] [CrossRef]
- Ross, S.M. Introduction to Probability Models, 13th ed.; Elsevier/Academic Press: Amsterdam, The Netherlands, 2023. [Google Scholar]
Disclaimer/Publisher’s Note: The statements, opinions and data contained in all publications are solely those of the individual author(s) and contributor(s) and not of MDPI and/or the editor(s). MDPI and/or the editor(s) disclaim responsibility for any injury to people or property resulting from any ideas, methods, instructions or products referred to in the content. |
© 2025 by the author. Licensee MDPI, Basel, Switzerland. This article is an open access article distributed under the terms and conditions of the Creative Commons Attribution (CC BY) license (https://creativecommons.org/licenses/by/4.0/).