Article

Structural Optimization of Cryogenic Gas Liquefaction Based on Exergetic Principles—The Linde–Hampson Cycle

by
Dănuț Cristian Urduza
1,
Lavinia Grosu
2,
Adalia Andreea Percembli (Chelmuș)
1,*,
Alexandru Șerban
1 and
Alexandru Dobrovicescu
1,*
1
Department of Engineering Thermodynamics, National University of Science and Technology Politehnica Bucharest, 060042 Bucharest, Romania
2
Laboratoire Energétique Mécanique Electromagnétisme (LEME), IUT de Ville d’Avray, 50 rue de Sèvres, 92410 Ville d’Avray, France
*
Authors to whom correspondence should be addressed.
Axioms 2025, 14(11), 785; https://doi.org/10.3390/axioms14110785 (registering DOI)
Submission received: 16 September 2025 / Revised: 11 October 2025 / Accepted: 24 October 2025 / Published: 26 October 2025
(This article belongs to the Section Mathematical Physics)

Abstract

Air liquefaction systems are essential in cryogenic engineering and energy storage, yet their performance is often constrained by significant exergy destruction. This study develops an exergy-based assessment of the Linde–Hampson air liquefaction cycle to identify dominant sources of inefficiency and explore strategies for improvement. The analysis shows that throttling (≈41%) and compression (≈40%) represent the major contributions to exergy losses, followed by finite-temperature heat transfer (≈15%) in the recuperative heat exchanger. To mitigate these losses, fractional throttling and optimized inlet conditions are proposed, leading to reduced compressor work and improved overall efficiency. A comparative study of a two-stage throttling configuration demonstrates a decrease in throttling-related exergy destruction to approximately 30%. Reverse Pinch analysis is employed to verify the thermal coupling of hot and cold streams and to determine the minimum feasible temperature difference. The design optimization of the recuperative heat exchanger identifies an optimal velocity ratio that minimizes pressure losses and quantifies how compression pressure affects the required heat transfer surface area. The results provide a systematic framework for improving the thermodynamic performance of air liquefaction cycles, highlighting exergy analysis as a powerful tool for guiding structural modifications and functional optimization.

1. Introduction

In the current context of increasing global energy demand and the growing pressure to reduce greenhouse gas emissions and preserve natural resources [1], the optimization of energy consumption has become a strategic priority across all industrial sectors [2,3]. This objective is essential not only for ensuring economic efficiency and maintaining technological competitiveness, but also for guaranteeing long-term sustainability and fulfilling international commitments in combating climate change.
Among the sectors directly influenced by these global trends is the cryogenic industry, where the energy-intensive processes of gas liquefaction play a crucial and indispensable role in numerous critical applications—from the production and storage of oxygen and nitrogen [4,5] to advanced technologies in the aerospace field, such as cryogenic rocket propulsion [6], as well as in medical applications [7]. To implement these processes, thermodynamic cycles capable of cooling gases below their boiling points are employed, with the Linde–Hampson cycle being one of the most widely used. The thermodynamic efficiency of the classical Linde–Hampson cycle is, however, inherently limited by irreversibilities, the most notable being associated with the throttling process [8]. This stage, although mechanically simple and reliable, represents a major source of exergy destruction and thus a primary target for optimization. Research has therefore focused on structural improvements, such as introducing multiple throttling stages or intermediate cooling, aimed at reducing exergy consumption. Evaluating the performance of these configurations —for instance, comparing single- and dual-throttling Linde cycles—requires a deeper approach beyond simple energy balance. Exergy analysis provides this depth by assessing both the quantity and quality of energy, identifying irreversibilities and unexploited work potential across system components.
Numerous studies have applied exergy analysis to cryogenic systems to quantify exergy destruction and identify key inefficiencies. In air separation systems, compression and heat exchange are consistently highlighted as major sources of exergy destruction. Bucsa et al. [5] reported that compression accounts for approximately 37% of total exergy destruction in air separation units (ASU), while Percembli et al. [9] introduced entropy-based optimization methods for intermediate cooler design. In a complementary approach, Hamayun et al. [10], demonstrated that compression can represent up to 46% of exergy destruction in Petlyuk processes, emphasizing the importance of component-level optimization.
In liquid air energy storage (LAES) systems, Dzido et al. [11] and Kılıç and Altun [12] identified throttling valves and heat exchangers as dominant sources of inefficiency, while comparative analyses revealed the superior performance of advanced cycles such as Claude. Advanced configurations were also analyzed by Manesh and Ghorbani [13], who integrated technologies such as LAES, Linde–Hampson, MCFC cells, and the Organic Rankine Cycle (ORC). In these hybrid configurations, the fuel cell (33.28%) and the heat exchangers (25.41%) were identified as the main sources of exergy destruction in the system. Similarly, Incer-Valverde et al. [14] employed advanced exergy analysis methods to identify unavoidable and avoidable destruction in a large-scale cryogenic energy storage system (100 MW/400 MWh), and He and Lin [15] showed that structural optimization of heat exchangers can significantly increase exergy efficiency.
The optimization potential of exergy analysis extends to hybrid and gas liquefaction systems. Khosravi et al. [16] proposed a solid waste gasification system with CO2 capture and liquefaction, achieving high exergy efficiency in the carbonator reactor (88.7%) and highlighting the applicability of dual-pressure Linde–Hampson cycles.
In a series of studies, exergy analysis has been applied to the optimization of the liquefaction of other gases such as methane and hydrogen. Amirhaeri et al. [17] investigated a hybrid methanol production system using biomass, liquid hydrogen, and liquefied natural gas, and determined that the natural gas liquefaction process is responsible for 32% of the total exergy destruction, while the refrigeration cycle generator was identified with a loss of 22%. For hydrogen liquefaction, Berstad et al. [18] showed that pressure losses in heat exchangers and intercoolers contribute significantly to irreversibilities, accounting for approximately 8% of the total exergy losses. In a similar context, Yilmaz et al. [19] analyzed a renewable hybrid system for liquid hydrogen storage, reporting an exergy efficiency of 50.06%. Their study highlights how integrating renewable sources and optimizing heat exchangers can significantly reduce exergy destruction. Chen and Morosuk [20] further emphasize the value of detailed exergy analysis, showing that in both the vapor-compression and Linde–Hampson liquefaction processes, dissipative components contribute 41–45% of total exergy destruction, underscoring its role in identifying inefficiencies and guiding optimization efforts.
Across these works, exergy analysis consistently emerges as a powerful diagnostic tool, yet most studies remain limited to evaluating existing configurations rather than proposing structural redesigns.
Despite these advances, two major gaps remain in the literature. First, few studies explicitly correlate exergy destruction patterns with the potential for structural modifications in the Linde–Hampson cycle aimed at reducing irreversibility. Second, limited attention has been given to integrating reverse Pinch analysis and pressure-drop considerations to establish design guidelines that couple thermodynamic and hydraulic performance.
To address these gaps, this paper presents a comprehensive exergy-based methodology for the analysis and optimization of the Linde–Hampson air liquefaction cycle. The approach begins by quantitatively identifying and ranking exergy destruction across key process stages, including throttling, compression, and heat exchange. Building on this, the study introduces and evaluates fractional throttling as a structural optimization strategy aimed at reducing both exergy destruction and compressor work. Reverse Pinch analysis is applied to assess thermal coupling and determine the minimum feasible temperature difference within recuperative heat exchangers. Additionally, the hydrodynamic performance of the system is examined by optimizing the velocity ratio between hot and cold streams to minimize pressure losses. Finally, the relationship between compression pressure and the required heat transfer area is established, providing practical design guidance for system implementation.
The novelty of this research lies in its integrated approach, which combines detailed exergy analysis with reverse Pinch methodology and pressure-drop modeling to not only diagnose inefficiencies but also to propose and validate structural modifications that improve thermodynamic and operational performance. Unlike prior works that primarily assess existing systems, this study provides a strategic framework for guiding the redesign and optimization of air liquefaction cycles, offering both theoretical insight and practical pathways toward higher efficiency.

2. The Cryogenic Liquefaction Linde–Hampson Cycle with a Single Throttling

The elementary cryogenic configuration intended for the liquefaction of gases which, at ambient temperature, lie within the inversion curve (in the region with a positive Joule-Thomson coefficient), operates based on the Linde–Hampson cycle, employing a single throttle valve.

2.1. System Configuration of the Single Throttling Scheme

The scheme of the installation and the representation of the cycle in the T–s diagram are illustrated in Figure 1.
The gas is compressed (1–2T) in the compressor CP and theoretically cooled down to ambient temperature, namely the suction temperature in the compressor. The compressed gas forms the forward stream, which is cooled (2T–3) in the recuperative heat exchanger (RHX). Heat is extracted from the forward stream by the cold gases of the returning stream (4″–5). After the throttling of the forward gas stream (3–4) in the throttling valve (TV), a fraction y kg liquid/kg compressed gas of liquid is separated in the liquid separator (LS) from one kilogram of compressed gas, with (1–y) representing the returning stream. At the hot end of the recuperative heat exchanger, there exists a temperature difference T n = T 2 T T 5 that determines the efficiency ε of the heat exchanger.

2.2. Mathematical Modeling of the Single-Stage System Operation

The mathematical model correlates energy analysis with exergy analysis in an integrated approach.

2.2.1. Energy Analysis of the Single-Stage System

Within the Linde–Hampson installation, the obtained product is the fraction y of liquefied air. The energy consumed for carrying out this process originates from the mechanical work required for compression, namely the electrical energy used to drive the compressor. The energy performance of the system is evaluated through specific coefficients, such as the specific consumption of mechanical work per kilogram of liquefied air ( w 0 ), the coefficient of performance of the cycle, the liquid fraction y, and the efficiency of the heat exchanger ε.
The important decision parameters of the cycle are the compression pressure p 2 and the temperature difference T n at the hot end of the recuperative heat exchanger which dictates its efficiency.
The study is carried out for 1 kg/s of compressed gas in the compressor.
The temperature profiles of the hot and cold streams along the heat transfer surface are presented in Figure 2.
The notations in Figure 2 corroborated by Figure 1 have the following meanings: T h 1 and T h 2 represent the temperatures at the inlet (2T) and, respectively, the outlet (3) (Figure 1) of the forward stream in the recuperative heat exchanger, while T c 1 and T c 2 correspond to the temperatures at the inlet (4″) and, respectively, the outlet (5) (Figure 1) of the returning stream in the same heat exchanger.
To establish the relationship between T n , the temperature difference between the streams at the hot end of the recuperative heat exchanger and its efficiency ε, the heat capacity C h of the forward (hot) stream and C c of the returning (cold) stream is determined.
C h = m ˙ f · c p , f = 1 · c p , f ,
C c = m ˙ r · c p , r = 1 y · c p , r ,
where m ˙ f represents the mass flow rate of the forward stream, m ˙ r represents the mass flow rate of the returning stream, c p , f represents the specific heat at constant pressure of the forward (hot) stream, and c p , r represents the specific heat at constant pressure of the returning (cold) stream.
In the present case of the liquefaction installation C c < C h , thereby imposing the notations:
C c = C m i n ,
C h = C m a x .
The efficiency of the heat exchanger is given by the relation [21]
ε = Q ˙ a c t u a l Q ˙ m a x ,
where Q ˙ a c t u a l represents the actual amount of heat transferred and Q ˙ m a x the maximum amount of heat that can be transferred.
The thermal balances of the recuperative heat exchanger, considered adiabatically isolated from the external environment (Figure 2) result in:
Q ˙ a c t u a l = C m i n · T 5 T 4 = C m a x · T 2 T T 3 ,   a n d
Q ˙ m a x = C m i n · T 2 T T 4 .
By substituting relations (6) and (7) into (5), one obtains:
ε = C m i n · T 5 T 4 C m i n · T 2 T T 4 = T 5 T 4 T 2 T T 4 .
To establish the relationship between Δ T n and ε, Equation (8) is rewritten as follows:
ε = ( T 2 T Δ T n ) T 4 T 2 T T 4 = 1 Δ T n T 2 T T 4 = 1 Δ T n T h 1 T c 1 .
For the determination of the fraction y of liquefied gas, the thermal balance Equation of the dotted contour in Figure 1a is applied for 1 kg of compressed gas:
h 2 T + q i z = y · h 4 + 1 y · h 5 ,
y = h 5 h 2 T q i z h 5 h 4 = h 1 h 2 T h 1 h 5 q i z h 1 h 4 ( h 1 h 5 ) .
It is expressed as
h T 1 = h 1 h 2 T ,
the isothermal throttling effect at ambient temperature (suction temperature in the compressor);
q n = h 1 h 5 ,
the cold loss due to the temperature difference Δ T n at the hot end of the recuperative heat exchanger—the effect is caused by the inefficiency of the recuperative heat exchanger and
q f = h 1 h 4 ,
the specific cooling capacity of the gas.
Considering these notations, relation (11), can be written as:
y = h T 1 q n q i z q f q n .
In the ideal case when there is no heat penetration from the outside due to incomplete insulation and the efficiency of the recuperative heat exchanger is ε = 1, relation (15) becomes
y i d = h T 1 q f .
This demonstrates that the cooling produced for the liquefaction of the fraction y ( Q f = y · q f ) is equal to the specific isothermal throttling effect ( Δ h T 1 ) at the ambient temperature T 1 = T 0 .
The coefficient of performance of the real cycle is
C O P = Q f w c p = y · ( q f q n ) w c p ,
where
w c p = R · T 1 · l n p 2 p 1 η c p , T ,
represents the specific compression work.
The specific energy consumption to obtain 1 kg of liquefied gas is
w 0 = w c p y .

2.2.2. Determination of the Minimum Temperature Difference ∆Tmin in the Recuperative Heat Exchanger

To determine the minimum temperature difference between the hot and cold streams and to represent the profile of the temperature curves along the heat transfer surface, a Pinch analysis will be employed [22].
If the classical Pinch analysis succeeds in specifying the minimum hot and cold utilities that must be supplied to the network from the outside for a chosen finite temperature difference T P at the Pinch point, in the present case a reverse Pinch analysis will be used.
It is observed that in the case of a heat exchanger the heat loads on the composite hot and cold streams are equal, resulting in zero external utility requirements for both the hot composite stream and the cold composite stream.
Under these conditions, the reasoning proceeds in reverse. A T P is chosen for which the hot and cold utilities are calculated, and T P is gradually reduced until the external utilities are nullified; the latter representing the minimum temperature difference between the hot composite stream and the cold composite stream.
By fractioning the hot and cold streams and finally their compounding, the variation in heat capacities with temperature and pressure is considered, thus providing a realistic representation of the temperature distribution inside the heat exchanger.
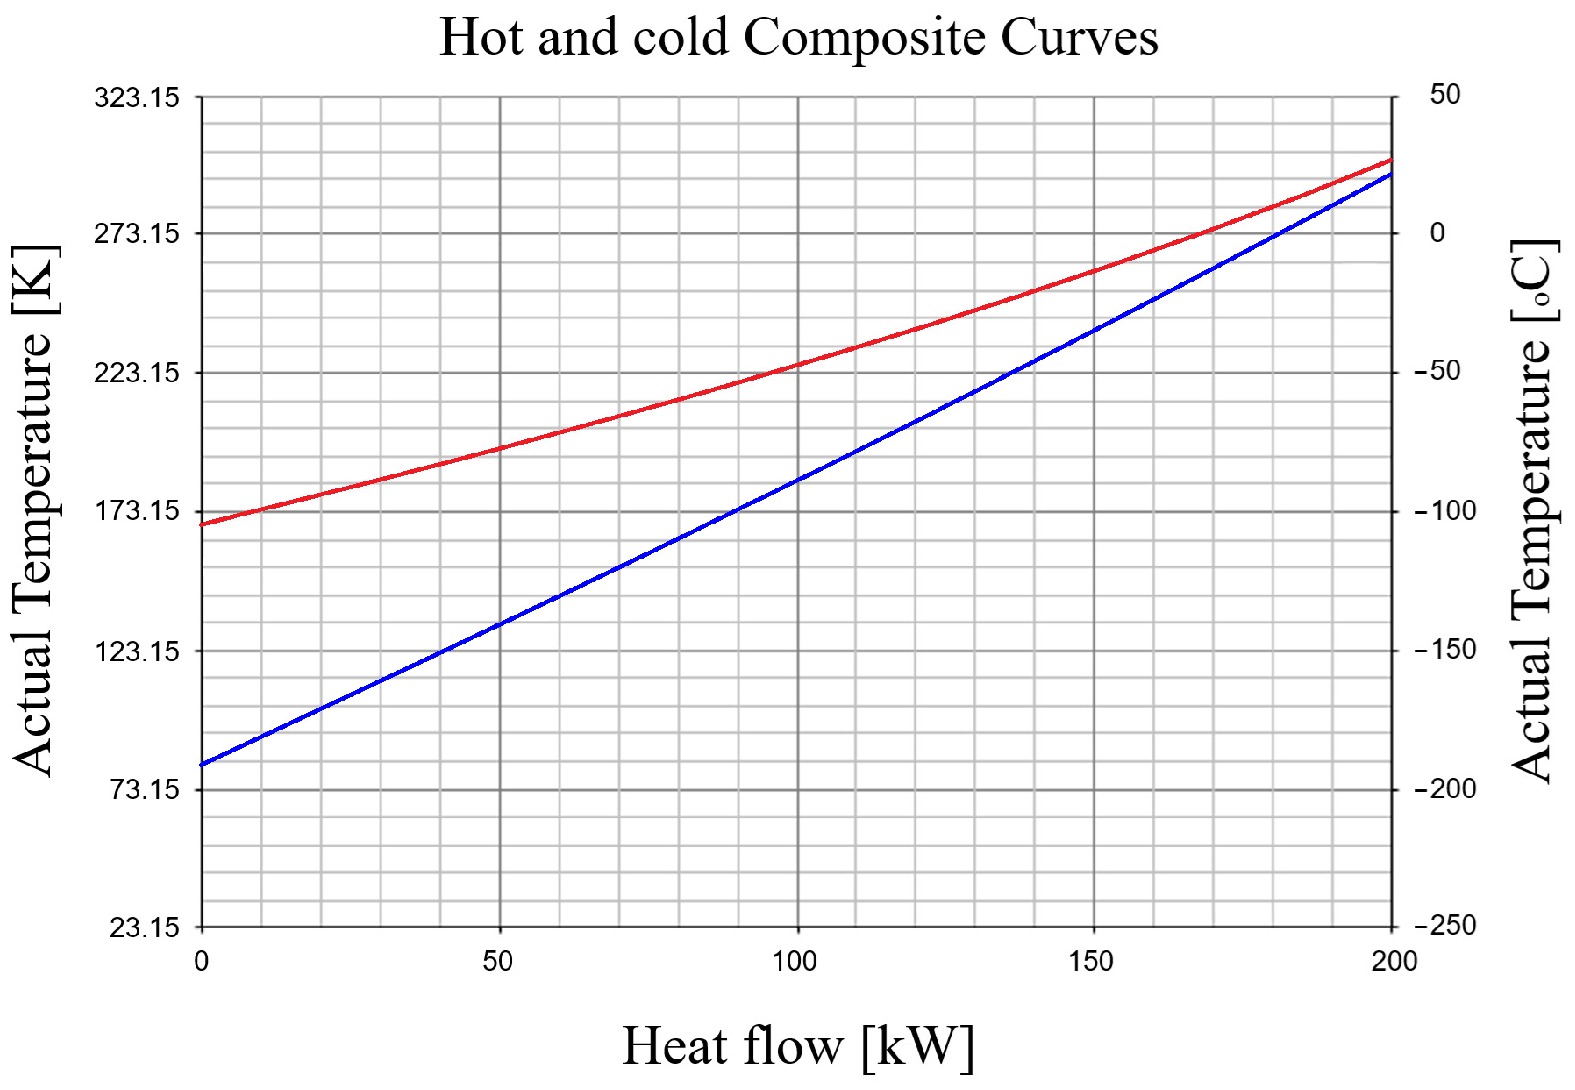
In the case of the Linde–Hampson scheme with a single throttling, the pinch temperature difference T P is found at the hot end of the heat exchanger, being equal to T n (Figure 3).

2.2.3. Exergy Analysis of the Cryogenic Linde–Hampson Cycle with a Single Throttling

The exergy balance highlights the non-conservative nature of exergy [23]:
E x i E x e .
Inequality (20) shows that during the processes occurring in the system, part of the incoming exergy is consumed.
To establish equality in relation (20), the exergy consumption within the system is added to the right-hand side
E x i = E x e + I ,
where I represent the exergy consumed inside the system by irreversible processes (friction, throttling, heat transfer at a finite temperature difference). This consumed exergy will hereafter be referred to as exergy destruction.
The exergy balance Equation (21) applied to the red dashed contour in Figure 1a becomes:
E x 2 T + E x Q i z = E x 4 + E x 5 + I t + I T + I p f + I p r ,
where the exergy destructions refer, in order, to the throttling process in the throttle valve ( I t ) , heat transfer at a finite temperature difference in the recuperative heat exchanger I T , the pressure loss in the high-pressure forward stream ( I p f ) and the pressure loss in the low-pressure returning stream ( I p r ) .
As state functions, the exergies at the characteristic points are evaluated relative to a reference state (arbitrarily chosen) for all states. The ambient environment is chosen as the reference state (state 1 0 , Figure 1) ( p 1 = p 0   a n d   T 1 = T 0 ) .
The exergy values are calculated as follows:
E x 2 T = 1 · e x 2 T = e x 2 T e x 0 .
It is observed that state 2T is located at ( p 2 T > p 1 = p 0 , T 2 T = T 1 = T 0 ) and, according to the definition, represents the maximum mechanical work that could be obtained through the reversible and isothermal expansion, ( T 2 T = T 1 = T 0 ), of the gas until thermomechanical equilibrium with the ambient environment ( T 0 , p 0 ) is reached.
E x 2 T = e x 2 T e x 0 = h 2 T h 0 T 0 · s 2 T s 0 = w e , T 0 > 0 .
In the reverse process of reversible isothermal compression ( T 1 = T 0 ) , the same value E x 2 T is also equal to the absolute value of the compression work. Consequently, it can be written:
Ex 2 T = w cp , T 0 ,
E x 4 = y · e x 4 = y · e x 4 e x 0 = y · h 4 h 0 T 0 · s 4 s 0 .
It is observed that state 4′ is at the pressure p 1 = p 0 , but at a temperature lower than that of the ambient environment T 0 .
To bring the system from 4′ ( T 4 , p 0 ) to 1 0 ( T 0 , p 0 ) , it must be heated at p 0 between the two states. The exergy of this heat, received below the ambient temperature and which must be rejected to the ambient environment, represents the absolute minimum mechanical work consumed by a refrigeration installation operating according to a reversed Carnot cycle carried out between the mean thermodynamic temperature of the process (4′–0) and the ambient temperature T 0 .
We note that:
E x 4 = y · e x 4 = y · h 4 h 0 · 1 T 0 h 4 h 0 s 4 s 0 ,
where the mean thermodynamic temperature between states 0 and 4′ of the cycle is:
T m 4 0 = h 4 h 0 s 4 s 0 .
By substituting Equation (28) into Equation (27), the result is:
E x 4 = y · h 4 h 0 · 1 T 0 T m 4 0 .
Because,
q f = h 4 h 0 < 0   a n d   1 T 0 T m 4 0 = θ q f < 0   T m 4 0 < T 0 ,
where q f represents the specific cooling and liquefaction load at the pressure p 0 from temperature T 0 to T 4 , and θ q f represents the exergy factor of the heat q f .
From relations (29) and (30) it follows that:
E x 4 = y · e x q f = E x Q f ,
E x 5 = 1 y · e x 5 = 1 y · h 5 h 0 T 0 · s 5 s 0 = 1 y · h 0 h 5 · 1 T 0 T m 5 0 .
It is observed that:
q 5 0 = h 0 h 5 > 0 1 T 0 T m 5 0 = θ q 5 0 < 0   ,   accordingly ,   q 5 0 · θ q 5 0 = E x q 5 0 < 0 .
Considering Equation (33), relation (32) can be expressed in the form:
E x 5 = 1 y · E x q 5 1 = E x q 5 0 = E x Q Δ T n .
This heat ( Q 5 0 = 1 y · q 5 0 ) represents the heat not extracted from the forward stream (a reduction in the cooling load of the forward stream) due to the requirement of having a temperature difference ( Δ T n ) , at the hot end of the recuperative heat exchanger (as a result of the inefficiency of the exchanger). Thus, this heat represents an exergy loss for the system
E x 5 = E x Q Δ T n = L Δ T n .
The losses occur during the interaction with the ambient environment, when usable energy is “discarded” into the ambient environment. In this case, cooling potential is discarded that would have otherwise cooled the forward stream
E x Q i z = E x Q i z = L Q i z ,
where Ex Q iz represents the minimum mechanical work that must be consumed by a refrigeration machine operating according to the reversed Carnot cycle, which extracts the heat that has entered the system due to incomplete insulation and rejects it to the ambient environment.
Considering that the heat penetration occurs through the shell of the recuperative heat exchanger on the side of the returning stream, it can be written:
E x Q i z = q i z · θ q i z = q i z · T 0 T m 4 5 1 ,
where the mean thermodynamic temperature between states 4″ and 5 of the cycle is
T m 4 5 = h 5 h 4 s 5 s 4 .
By substituting relations (23)–(37) into Equation (22), one gets:
w c p , T 0 L Q i z = E x Q f + L Δ T n + i t + I Δ T + i Δ p f + I Δ p r ,
where
i t = T 0 · s 4 s 3 ,
I Δ T = T 0 · s 3 + 1 y · s 5 s 2 T 1 y · s 4 ] ,
i Δ p f = v m 2 T 3 · Δ p f ,
I Δ p r = 1 y · v m 4 5 · Δ p r .
By isolating on the left-hand side of relation (39) what is consumed in the system, and on the right-hand side the product together with the exergy consumptions (destructions) and losses, one gets
w c p , T 0 = E x Q f + L Δ T n + i t + I Δ T + i Δ p f + I Δ p r + L Q i z .
If the isothermal efficiency of compression is also considered, then
η c p , T = w c p , T 0 w c p .
In the case of isothermal compression at T0, the isothermal efficiency of compression is equal to the exergetic efficiency of compression η c p , T = η Ex cp , and the exergy destruction due to real compression compared to the ideal isothermal one becomes
i c p = w c p w c p , T 0 = w c p , T 0 · 1 η c p , T 1 .
Considering Equation (46), one gets the exergy balance Equation (44) in the form
w c p = E x Q f + L Δ T n + i t + I Δ T + i Δ p f + I Δ p r + i c p + L Q i z .
The exergetic coefficient of performance of the cycle is defined as
η E x = E x Q f w c p ,
and by relating Equation (47) to w c p , one gets:
η E x = 1 L , I i w c p = 1 ψ i ,
where
ψ i = L , I i w c p ,
is the share of an exergy loss (L) or an exergy destruction (I) with respect to the mechanical work consumed by the system.
The study of sensitivities, exergy destructions and exergy losses to the variation in decision parameters will lead to the identification of the optimal operating regimes, for which a specified amount of product (the quantity of liquefied gas or the refrigeration load) can be obtained with a minimum consumption of mechanical work.

2.2.4. Results of the Exergy Analysis of the Cryogenic Linde–Hampson Cycle with a Single Throttling

The analysis of the system operation under variations of the decision parameters Δ T n and p 2 was carried out for air under the conditions p 1 = 0.1   M P a , T 1 = 298.15   K and η c p , T = 0.6 . The pressure losses in the forward and returning streams were disregarded.
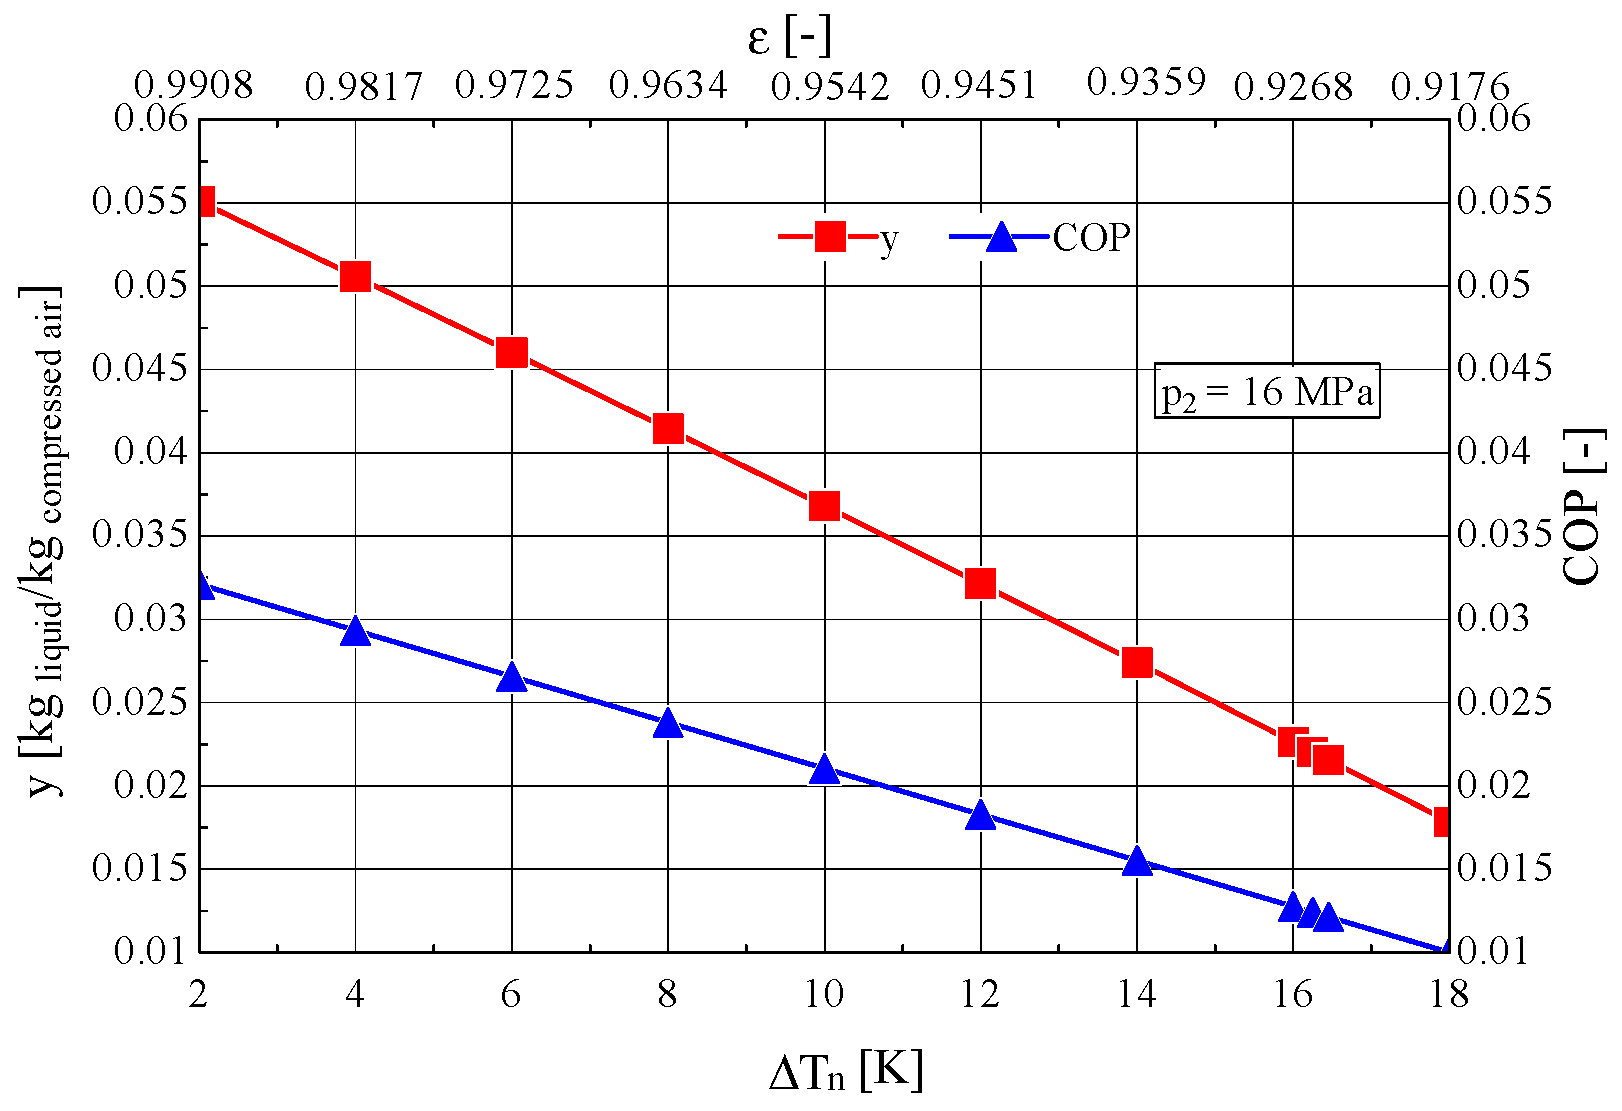
The influence of increasing the temperature difference Δ T n at the hot end of the recuperative heat exchanger is presented in Figure 4 and Figure 5.
The mechanical work consumption w 0 for 1 kg of liquefied gas increases rapidly as y decreases with the increase of Δ T n (Figure 5).
The exergetic analysis points out the existence of large exergy destructions in the throttling valve ( Ψ t ) , and Ψ Δ T due to heat exchange at finite temperature difference T in the recuperative heat exchanger.
Both the exergy destruction in the throttle valve ( Ψ t ) and that due to heat transfer at a finite temperature difference ( Ψ Δ T ) increase with the rise in the temperature difference Δ T n , leading to a decrease in the exergetic efficiency η ex (Figure 5).
Another major destruction Ψ cp , is associated with the low isothermal efficiency η c p , T the compressor and its total value will depend on the compressed air flow rate for 1 kg of liquefied gas.
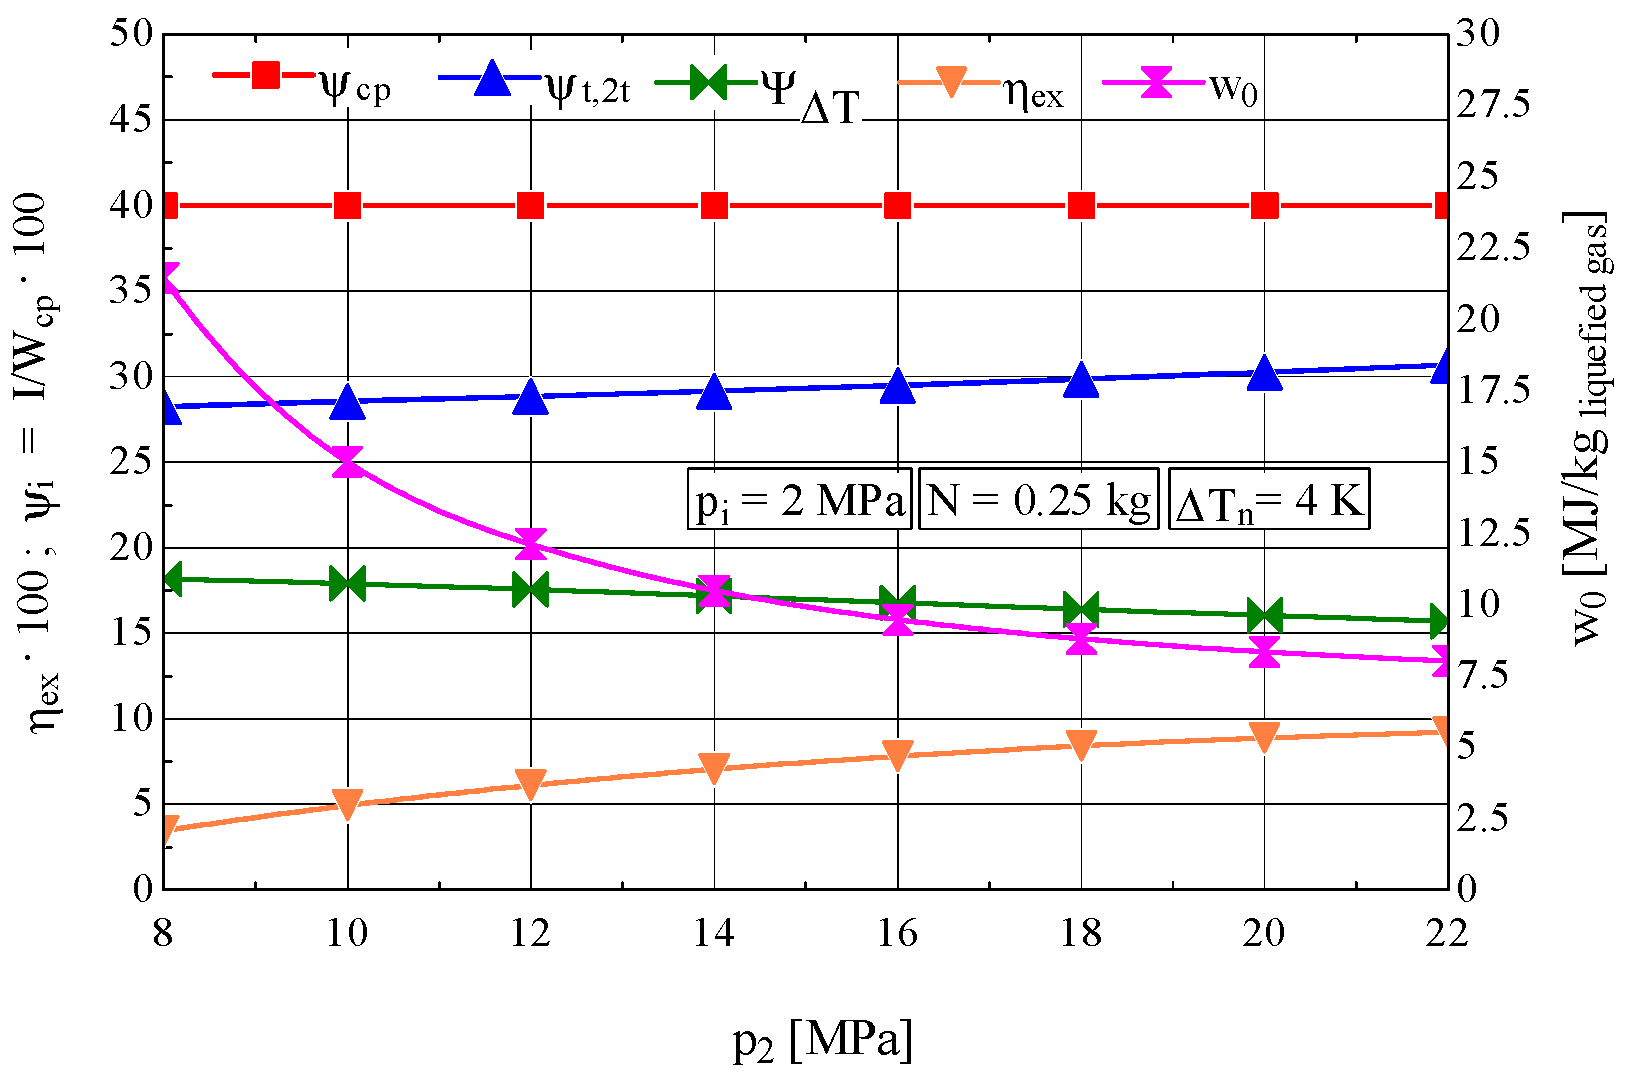
An increase in the compression pressure p 2 is favorable, leading to higher values of y and COP (Figure 6) and to a reduction in the specific mechanical work ( w 0 ) (Figure 7).
The decrease in the share of exergy destructions Ψ t and Ψ Δ T in the mechanical work consumption of the compressor results in an increase of η ex (Figure 7).

3. Cryogenic Liquefaction Linde–Hampson Cycle with Two Throttling Stages

To reduce the irreversibilities in the throttle valve, one solution would be the fractionation of the throttling process, which would lead both to a modification of the inlet parameters in the throttle valves and to a reduction in the throttled gas flow rate.
The exergy analysis, by identifying the location and magnitude of exergy consumption in the system, indicates the direction toward the optimal solution, thereby guiding the structural modification of the system architecture toward the use of a Linde-type scheme with multiple throttling stages.

3.1. System Configuration of the Two-Stage Throttling Scheme

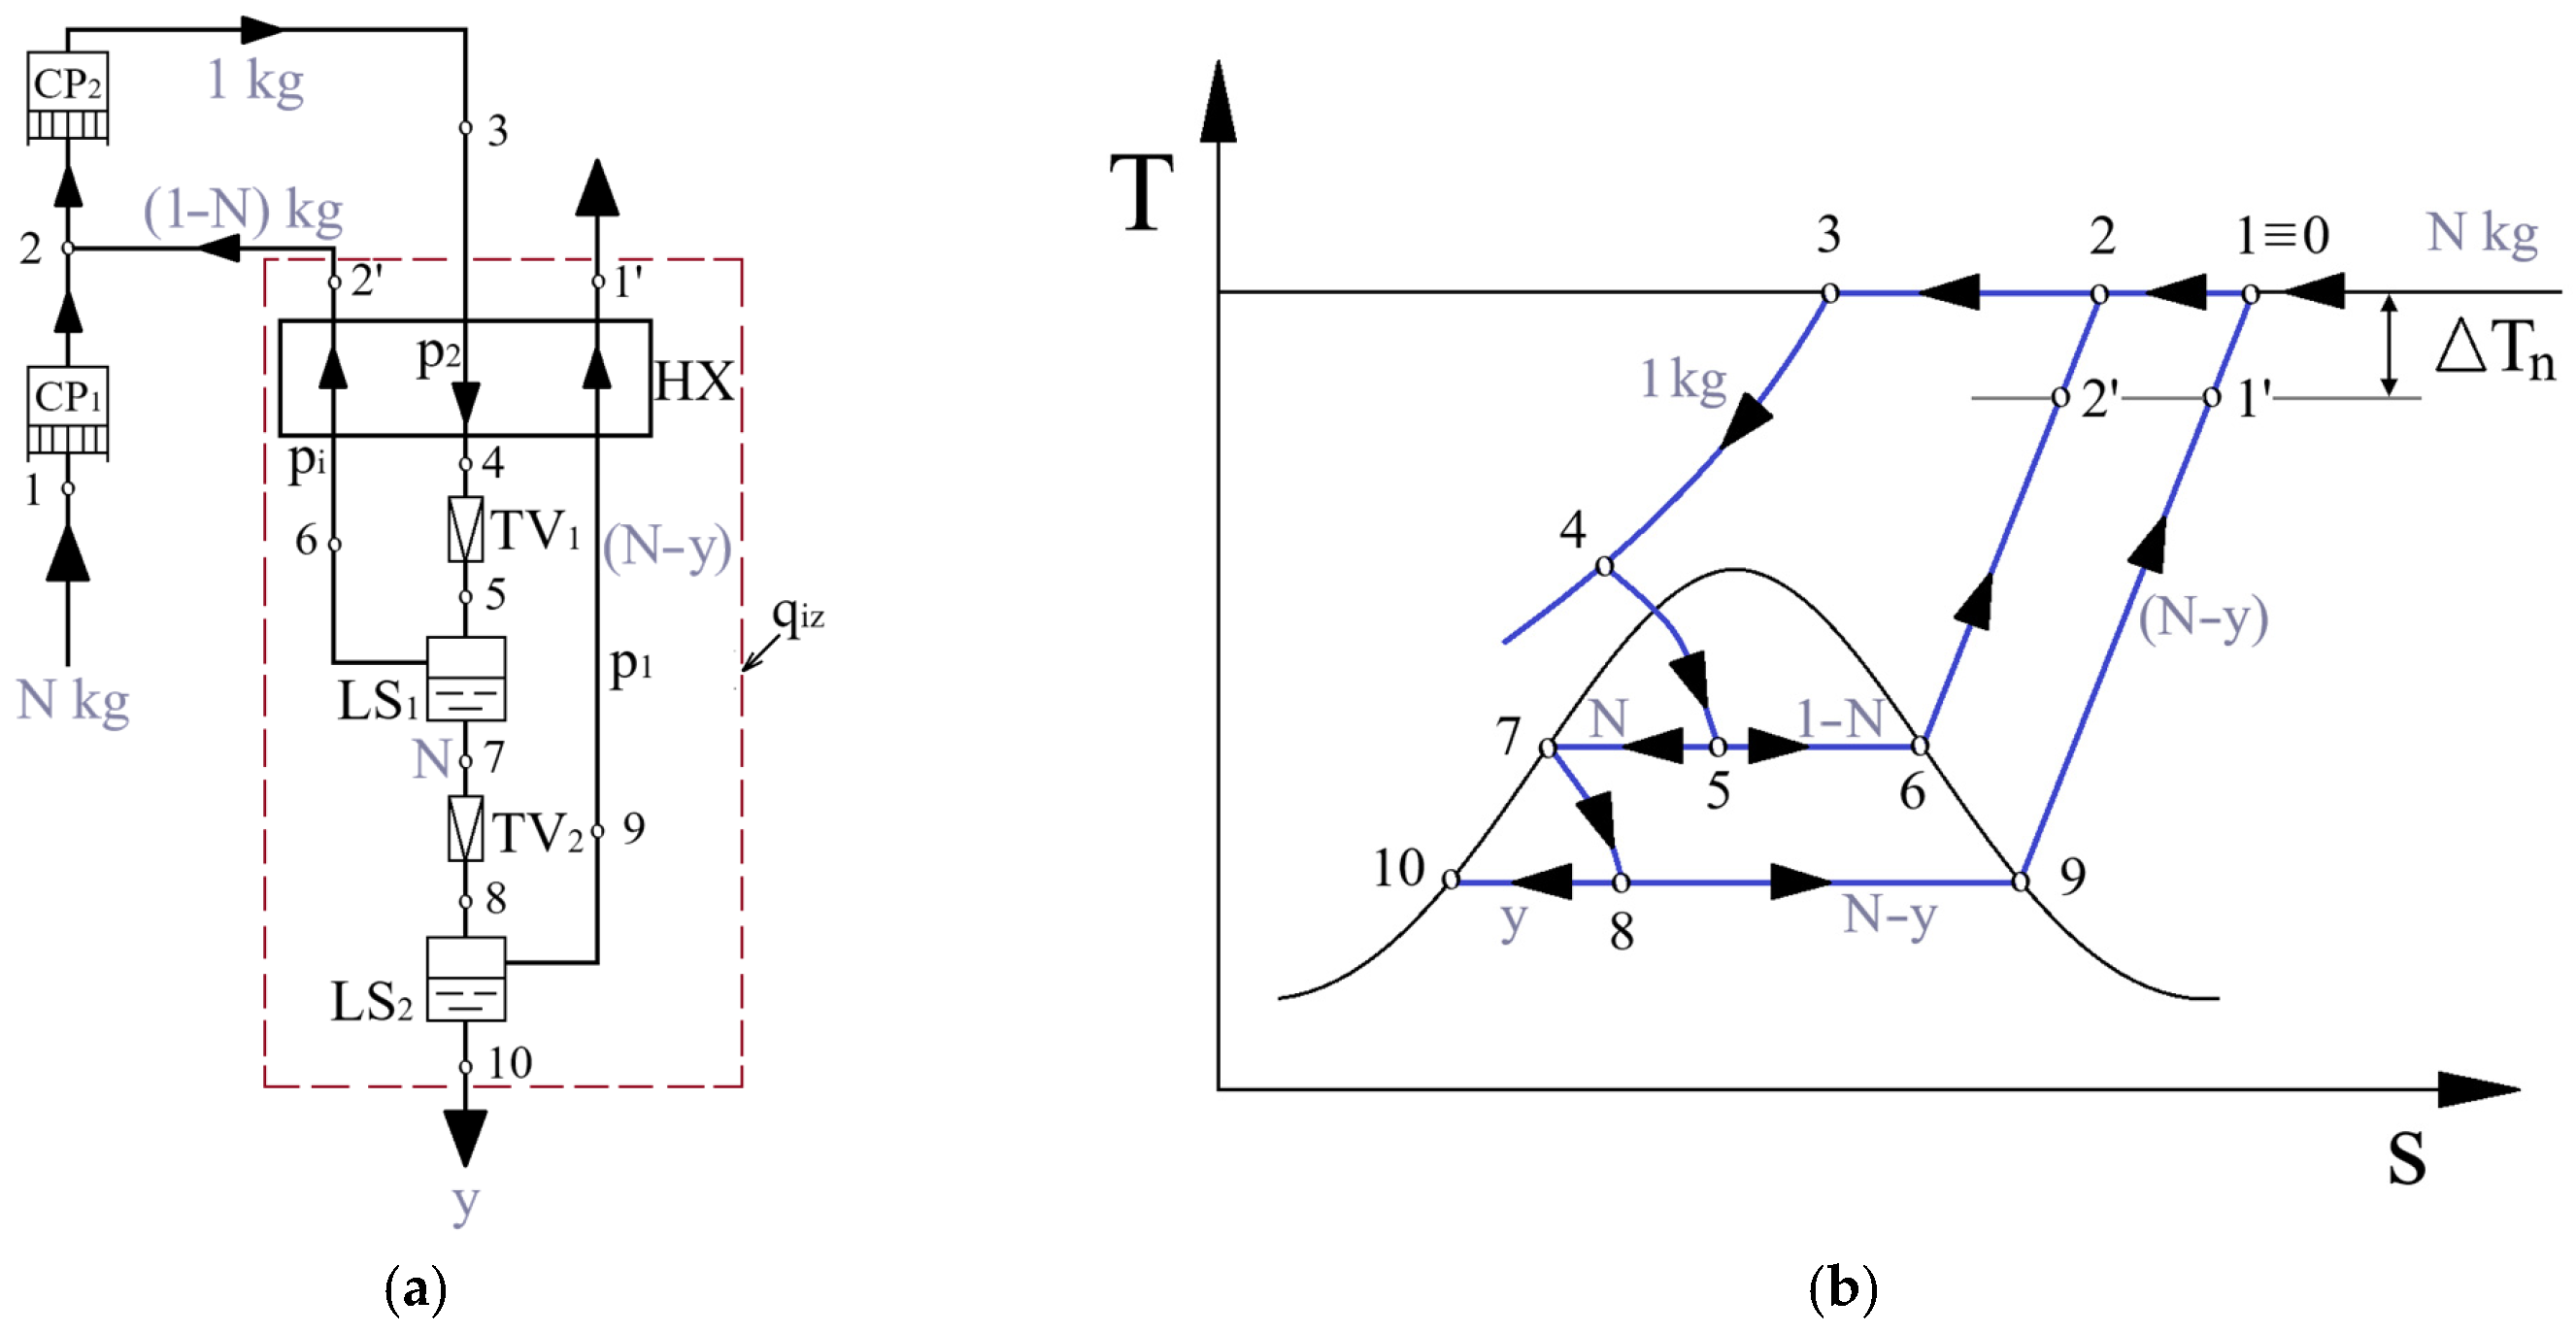
The scheme of the installation is presented in Figure 8.
The analysis is carried out for 1 kg of gas compressed up to the maximum pressure p 3 .
The fraction N kg of gas is ideally compressed isothermally from the pressure p 1 = p 0 to the intermediate pressure p i (1–2). In state 2, the fraction N kg of compressed gas mixes with the fraction (1–N) kg of gas separated in the liquid separator (LS1) as a result of throttling down to the intermediate pressure p i of the amount of 1 kg of gas compressed in the high-pressure compressor CP2.
The resulting amount of 1 kg of gas is then ideally compressed isothermally (2–3) in the high-pressure compressor CP2 up to the maximum pressure p 2 .
The compressed air at state 3 is cooled in the recuperative cooler HX down to state 4 by heat transfer to the cold streams at pressures p i (6–2′) and p 1 (9–1′).
The first throttling of the 1 kg of compressed air (4–5) takes place from p 2 to p i . In the liquid separator (LS1) the 1 kg of air is separated into the fraction N kg of saturated liquid (7) and (1–N) kg of gas (6), which constitutes the cold stream at pressure p i in the heat exchanger HX.
The fraction N kg of liquid is throttled in the second throttle valve (TV2) (7–8) from the pressure p i to p 1 . In the liquid separator (LS2) the fraction N kg of throttled air is separated into the fraction y of liquid air (state 10) delivered to the consumer at p 1 and the fraction (N–y) kg of gas, which constitutes the cold returning stream at pressure p 1 (9–1′) in the recuperative heat exchanger.

3.2. Mathematical Modeling of the Two-Stage System Operation

The mathematical model integrates energy analysis and exergy analysis within a unified framework.

3.2.1. Energy Analysis of the Two-Stage System

The important decision parameters considered are the mass fraction N of liquid extracted from separator SL1, the temperature difference T n at the hot end of the recuperative heat exchanger, the intermediate compression pressure p i and the final compression pressure p 2 .
For the determination of the fraction y of liquefied gas, the energy balance equation is written for the contour marked with a dashed line in Figure 8a, for 1 kg of gas compressed in the compressor CP2
h 3 + q i z = 1 N · h 2 + N · h 1 + y · h 10 h 1 .
It follows that:
y = h 2 h 3 + N · h 1 h 2 + h 2 h 2 h 1 h 1 h 2 h 2 q i z h 1 h 10 ( h 1 h 1 ) .
If it is denoted:
Δ h T 2 3 = h 2 h 3 —the enthalpy variation in the isothermal process 2–3,
Δ h T 1 2 = h 1 h 2 —the enthalpy variation in the isothermal process 1–2,
q n 1 = h 1 h 1 —the thermal load loss due to the temperature difference at the hot end of the recuperative heat exchanger between the pressure streams p 1 and p i ,
q n 2 = h 2 h 2 —the thermal load loss caused by the temperature difference at the hot end of the recuperative heat exchanger between the pressure streams p i and p 2 ,
q f = h 1 h 10 —the specific cooling capacity of the liquefied gas,
relation (52) becomes
y = Δ h T 2 3 + N · Δ h T 1 2 + q n 2 q n 1 q n 2 q i z q f q n 1
If it is considered that the temperature differences T n 1 and T n 2 at the hot end of the recuperative heat exchanger are equal, T n 1 = T n 2 = T n (Figure 8b) and if the difference between the specific heats of the gas streams at pressures p 1 and p i is neglected, it follows that q n 1 = q n 2 = q n and finally relation (53) becomes
y = Δ h T 2 3 + N · Δ h T 1 2 q n q i z q f q n .
The coefficient of performance of the cryogenic liquefaction Linde–Hampson cycle with two throttling stages is:
C O P = Q ˙ f W c p = y · ( q f q n ) W c p , T 1 η c p , T = Δ h T 2 3 + N · Δ h T 1 2 q n q i z W c p , T 1 η c p , T .
The specific mechanical work consumption to obtain 1 kg of liquefied gas is:
w 0 = W cp , T 1 η c p , T · y =   R · T 1 · ln p 2 p i + N · ln p i p 1 η c p , T · y .

3.2.2. Temperature Distribution in the Recuperative Heat Exchanger

To determine the minimum temperature difference in the recuperative heat exchanger HX and to represent the profile of the composite temperature curves along the heat transfer surface, a Pinch analysis was employed, in which the variation in heat capacity with temperature and pressure was considered.
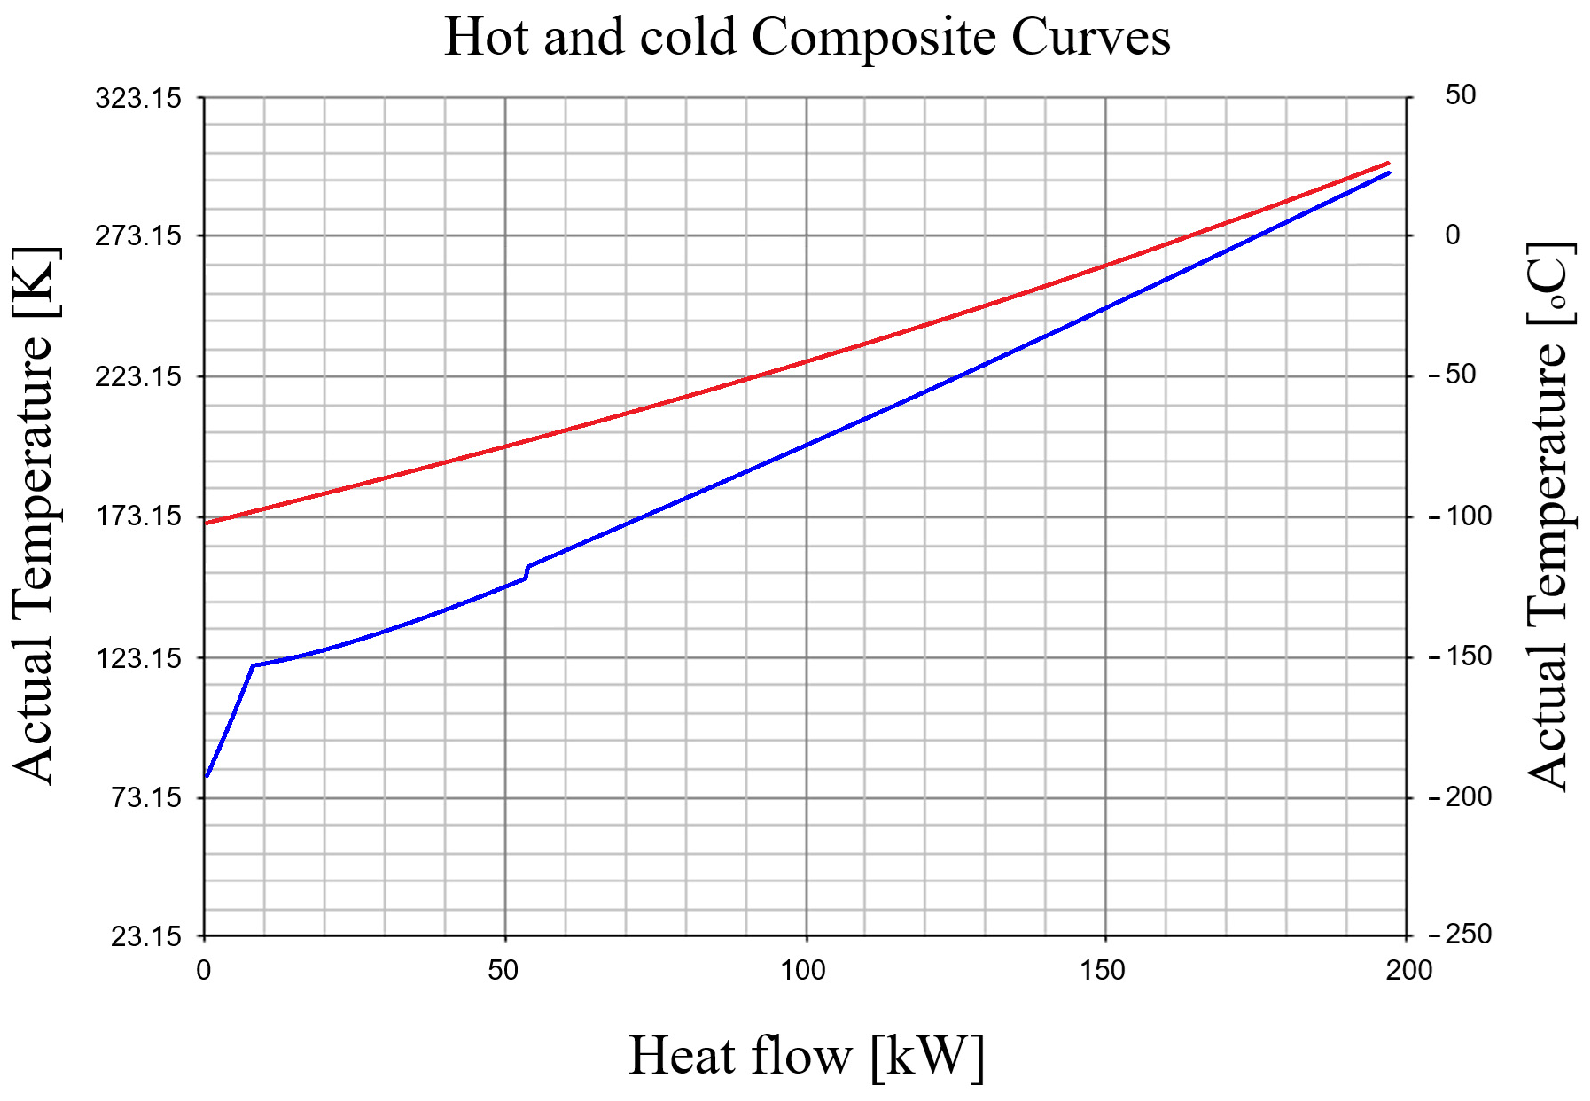
In the case of the Linde–Hampson scheme with two throttling stages, the Pinch temperature is located at the hot end of the heat exchanger (Figure 9) thus eliminating the risk of heat transfer reversal inside the apparatus.

3.2.3. Exergy Analysis of the Linde–Hampson Liquefaction Cycle with Two Throttling Stages

The exergy balance equation applied to the dashed contour in Figure 8a for 1 kg of compressed gas in Cp2, neglecting the pressure losses in the recuperative heat exchanger, is:
e x 3 + e x q i z = E x 1 + E x 2 + E x 10 + i t 4 5 + I t 7 8 + I Δ T ,
where i t 4 5 , I t 7 8 , I Δ T represent, in order, the exergy destruction due to throttling in processes 4–5 and 7–8, respectively, and the exergy destruction caused by heat transfer at a finite temperature difference in the recuperative heat exchanger.
For the calculation of exergy at the characteristic states of the cycle, the ambient environment state p 1 = p 0 , T 1 = T 0 (Figure 8) is chosen as the reference.
e x 3 = e x 3 e x 0 = h 3 h 0 T 0 · s 3 s 0 = w c p , T 0 1 3 .
State 3 is at p 2 > p 1 . Thus, the exergy of state 3 represents the mechanical work of expansion at the ambient temperature T 0 for 1 kg of gas from pressure p 2 to pressure p 1 , equal in absolute value to the isothermal compression work for 1 kg of gas from pressure p 1 to pressure p 2 .
State 1′ is at p 1 = p 0 , but at a temperature lower than that of the ambient environment T 0 .
To restore equilibrium and bring the system from state 1′ T 1 , p 0 to state 0 T 0 , p 0 mechanical work must be consumed; the minimum required mechanical work is the exergy of the system in state 1′.
E x 1 = N y · e x 1 e x 0 = N y · h 1 h 0 T 0 · s 1 s 0   = N y · h 1 h 0 · 1 T 0 T m 1 0 > 0 ,
where
T m 1 0 = h 1 h 0 s 1 s 0 ,
represents the mean thermodynamic temperature between states 1′ and 0 of the cycle.
Observing that
q n 1 = h 0 h 1 ,
relation (59) becomes
E x 1 = N y · q n 1 · T 0 T m 1 0 1 = E x q 1 0 T m 1 0 = L T n 1 ,
which represents the loss of cooling exergy that is discarded into the ambient environment without cooling the forward gas stream at pressure p 2 . This is imposed by the requirement of maintaining a temperature difference T n 1 at the hot end of the recuperative heat exchanger between the hot stream at pressure p 2 and the cold stream at pressure p 1 .
In state 2′ the gas is in both mechanical and thermal disequilibrium with the ambient environment. The gas is at a pressure p i > p 0 and can, through expansion, produce mechanical work, but it is also at T 2 < T 0 ; in state 2′ the gas possesses thermomechanical exergy.
E x 2 = 1 N · e x 2 e x 0 = 1 N · [ h 2 h 0 T 0 s 2 s 0 ]
To highlight both the thermal and mechanical components of the exergy of state 2′, the reversible path followed by the gas until reaching equilibrium with the ambient environment will be (2′–2–0).
With this specification, relation (63) becomes:
E x 2 = 1 N · h 2 h 2 + h 2 h 0 T 0 · s 2 s 2 + s 2 s 0 = E x 2 T + E x 2 M .
The evolution along the path 2′–2 represents the thermal component E x 2 T , while along the path (2–0), it represents the mechanical component E x 2 M of the exergy of state 2′
E x 2 T = 1 N · h 2 h 2 T 0 · s 2 s 2 = 1 N · h 2 h 2 · 1 T 0 T m 2 2 ,
in which
T m 2 2 = h 2 h 2 s 2 s 2 ,
represents the mean thermodynamic temperature along the path 2′–2.
Observing that q n 2 = h 2 h 2 , relation (65) becomes
E x 2 T = 1 N · q n 2 · T 0 T m 2 2 1 = E x q 2 2 T m 2 2 = L T n 2 ,
which represents the exergy of the heat not extracted from the forward gas stream due to the requirement of maintaining a temperature difference T n 2 at the hot end of the recuperative heat exchanger between the hot stream at pressure p 2 and the cold stream at pressure p i . For the system E x 2 T represents an exergy loss
E x 2 M = 1 N · h 2 h 0 T 0 · s 2 s 0 = 1 N · W c p , T 0 1 2 ,
is the mechanical work of isothermal expansion at temperature T 0 from pressure p i to p 0 = p 1 , equal in turn to the absolute value of the compression work from p 0 to p i .
It is observed that state (10) is at the pressure p 10 = p 1 = p 0 , but at a temperature lower than that of the ambient environment T 1 = T 0 , thus, it corresponds to heat that must be extracted at pressure p 0 and transferred to the ambient environment. The exergy of this heat represents the mechanical work consumed by a reversed Carnot cycle operating between the mean thermodynamic temperature T m 10 1 of states (10) and (0) of the cycle and the ambient temperature T 0
E x 10 = y · h 10 h 0 T 0 · s 10 s 0 .
It is observed that
q f = h 0 h 10 > 0 ,   θ q f = T 0 T m 10 1 1 > 0 ,
in which θ q f is the exergy factor of the heat q f , relation (69) becomes
E x 10 = y · q f · θ q f = E x Q f
and represents the exergy of the refrigeration load of the liquefied air quantity, the product of the system.
The exergy of the heat that enters from the outside through incomplete insulation represents the minimum mechanical work that must be consumed by a refrigeration machine operating according to the reversed Carnot cycle, which extracts the heat that has entered the system and rejects it to the ambient environment. The additional mechanical work consumption required to remove the heat entering from the outside represents a loss for the system.
Considering that the penetrations occur through the shell of the recuperative heat exchanger on the side of stream 9–1′, it follows that:
E x Q i z = q i z · 1 T 0 T m 9 1 < 0 ,
E x Q i z = E x Q i z = q i z · T 0 T m 9 1 1 ,
E x Q i z = L Q i z .
By substituting into the balance Equation (57), one gets:
w c p , T 0 2 3 = L Q i z + L T n 1 + L T n 2 + 1 N · w c p , T 0 1 2 + E x Q f + i t 4 5 + I t 7 8 + I Δ T ,
where
i t 4 5 = T 0 · s 5 s 4 ,
I t 7 8 = N · T 0 · s 8 s 7 ,
I Δ T = T 0 · s 4 + 1 N · s 2 + N y · s 1 s 3 1 N · s 6 N y · s 9 .
By isolating on the left-hand side of relation (75), the quantities consumed within the system, and on the right-hand side the useful product along with exergy destructions and losses, the resulting expression is:
w c p , T 0 1 3 1 N · w c p , T 0 1 2 = E x Q f + i t 4 5 + I t 7 8 + I Δ T + L Q i z + L T n 1 + L T n 2 .
Considering also the isothermal efficiency of compression, the real compression work can be expressed as
W c p = w c p , T 0 1 3 1 N · w c p , T 0 1 2 η c p , T .
Exergy destruction due to real compression compared to the ideal isothermal one is given by:
I c p , 1 2 = 1 N · R · T 0 · ln p i p 1 · 1 η c p , T 1 ,
I c p , 2 3 = R · T 0 · ln p 2 p i · 1 η c p , T 1 .
Considering Equations (81) and (82), the exergy balance Equation (79) can be rewritten as:
W c p = E x Q f + i t 4 5 + I t 7 8 + I Δ T + I c p , 1 2 + I c p , 2 3 + L Q i z + L T n 1 + L T n 2 .
Defining the exergetic coefficient of performance of the cycle as
η e x = E x Q f W c p ,
relating Equation (83) to W c p leads to
η e x = 1 I i , L i W c p = 1 ψ i ,
where
ψ i = I i , L i W c p ,
represents the share of an exergy destruction ( I i ) or an exergy loss ( L i ) in the mechanical work consumption of the system.

3.2.4. Results of the Energy and Exergy Analysis of the Cryogenic Linde–Hampson Cycle with Two Throttling Stages

The analysis of the system operation under variations in the decision parameters Δ T n , N, p i   a n d   p 2 was carried out under the conditions p 1 = 0.1   M P a , T 1 = 298.15   K and η c p , T = 0.6 . The pressure losses in the forward and returning streams were disregarded.
An increase in the temperature difference Δ T n at the hot end of the recuperative heat exchanger leads to a decrease in the liquefied gas fraction y and in the coefficient of performance of the cycle (Figure 10). The mechanical work consumption for 1 kg of liquefied gas increases significantly as y decreases, as a result of the increase in Δ T n (Figure 11).
It is observed that, under the same operating conditions as in the case of the Linde installation with a single throttling p 2 = 16   M P a and Δ T n = 4   K , although in the two-throttling configuration the liquefied fraction y decreases slightly ( y 2 t = 0.043   k g compared to y 1 t = 0.0505   k g ), the coefficient of performance (COP) increases significantly ( C O P 2 t = 0.0446 compared to C O P 1 t = 0.02933 ) (Figure 4 and Figure 10). In parallel, the mechanical work consumed for the liquefaction of 1 kg of gas decreases considerably ( w 0 2 t = 9.49   M J k g liquefied air compared to w 0 1 t = 14.41   M J k g liquefied air) (Figure 5 and Figure 11).
From an exergetic perspective, the shares of exergy destructions in the throttle valve ( Ψ t ) and those caused by heat transfer at a finite temperature difference Δ T n in the heat exchanger Ψ Δ T of the Linde–Hampson installation with two throttling stages increase with the rise in this temperature difference, which leads to a decrease in exergetic efficiency η e x (Figure 11).
As expected, the share of exergy destruction through throttling (ψₜ) decreases by approximately 10% in the case of the two-throttling scheme (2t) compared to the single-throttling scheme (1t). For example at T n = 4   K , ψ t , 2 t = 29.49 % while ψ t , 1 t = 41.15 % (Figure 5 and Figure 11).
In the dual-stage throttling configuration, the share of exergy destruction due to throttling ψ t , 2 t decreases significantly compared to the single-stage throttling scheme ψ t , 1 t , while the share of exergy destruction due to heat transfer ψ T , 2 t shows a slight increase. The key to understanding this behavior lies in the balance between the numerator (the associated exergy destruction) and the denominator (the compression mechanical work input) in the share of exergy destruction expression (Equation (86)).
For throttling, splitting the process into two stages reduces the pressure drop, mass flow rate and enthalpy change per stage, leading to a substantial decrease in the associated exergy destruction. Although the mechanical work input also decreases, it does so more gradually than the throttling-related irreversibility, which results in an overall decrease in the share of exergy destruction due to throttling ψ t .
On the other hand, for the heat transfer, the associated exergy destruction decreases, but at a slower rate compared to the decrease in the mechanical work input. Consequently, the share of exergy destruction due to the heat transfer in the dual-stage throttling configuration ψ T , 2 t shows a relative increase, even though the total irreversibility from heat transfer is slightly reduced.
Overall, this thermodynamic trade-off—between the more significant reduction in the share of exergy destruction due throttling ( ψ t ) and the moderate increase in the share of exergy destruction due heat transfer ψ T —leads to an improvement in exergetic efficiency η e x , 2 t compared to the single-throttling configuration. For instance, at T n = 6 K , η e x , 2 t = 6.96 % while η e x , 1 t = 4.685 % (Figure 5 and Figure 11).
An increase in the compression pressure p 2 results in higher values of y and the coefficient of performance COP (Figure 12), as well as a reduction in the specific mechanical work w 0 (Figure 13).
The reduction in the share of exergy destruction Ψ Δ T in the mechanical work consumption of the compressor leads to an increase in the exergetic efficiency η e x (Figure 13).
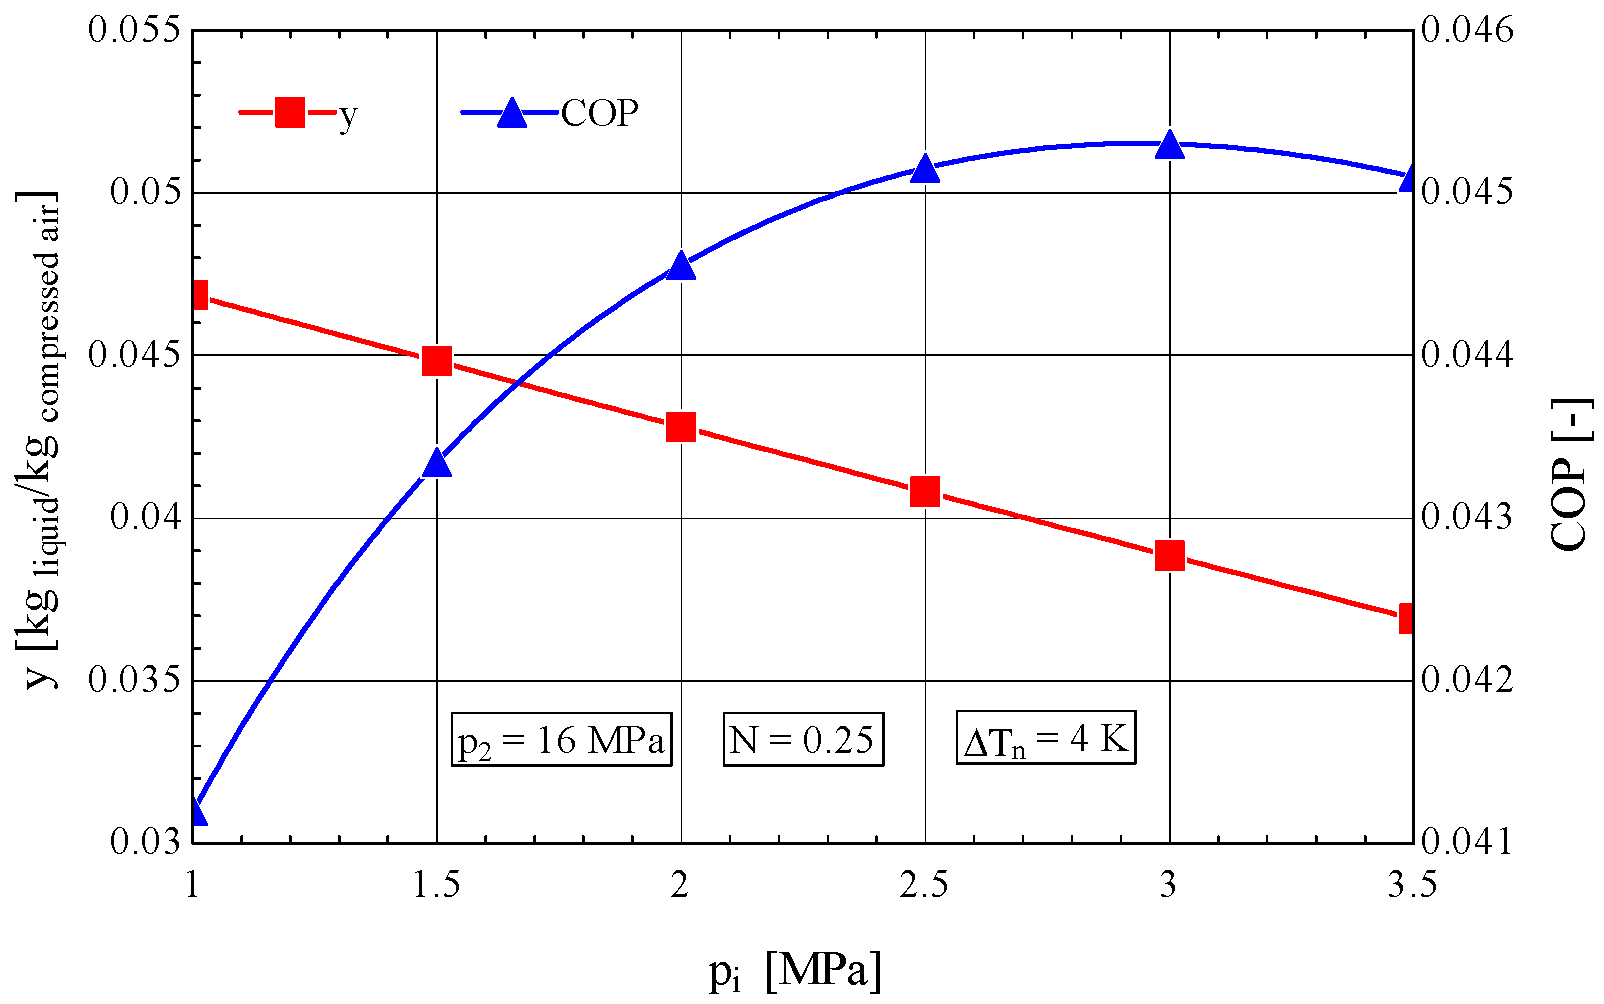
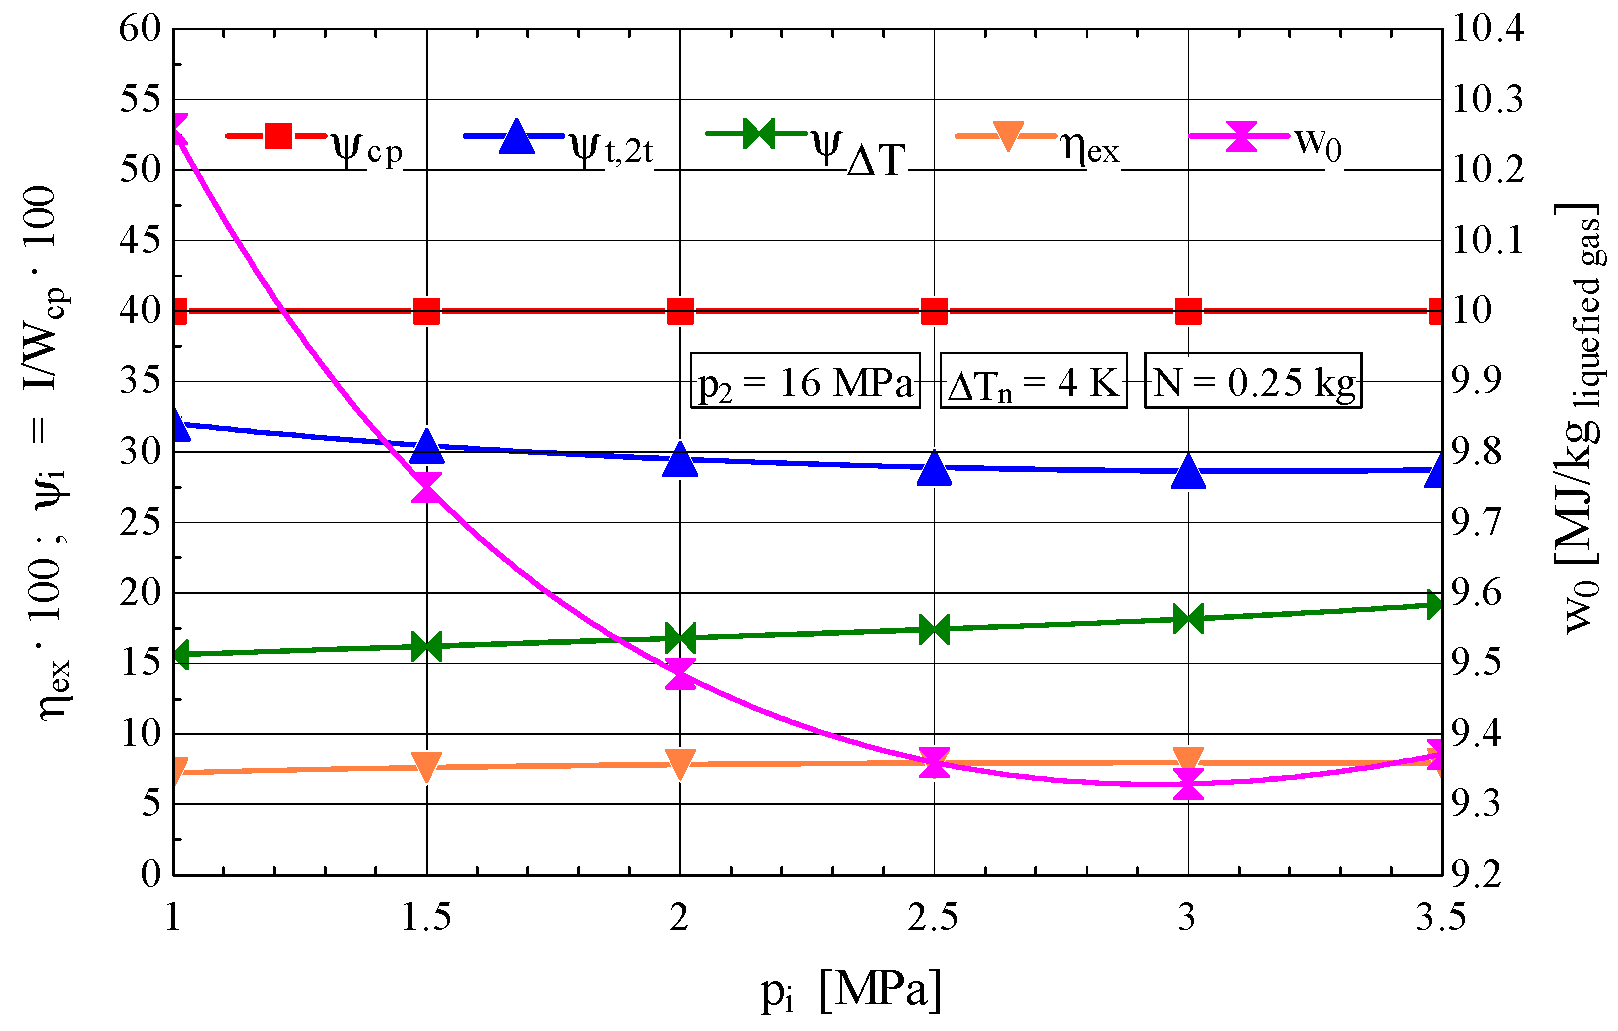
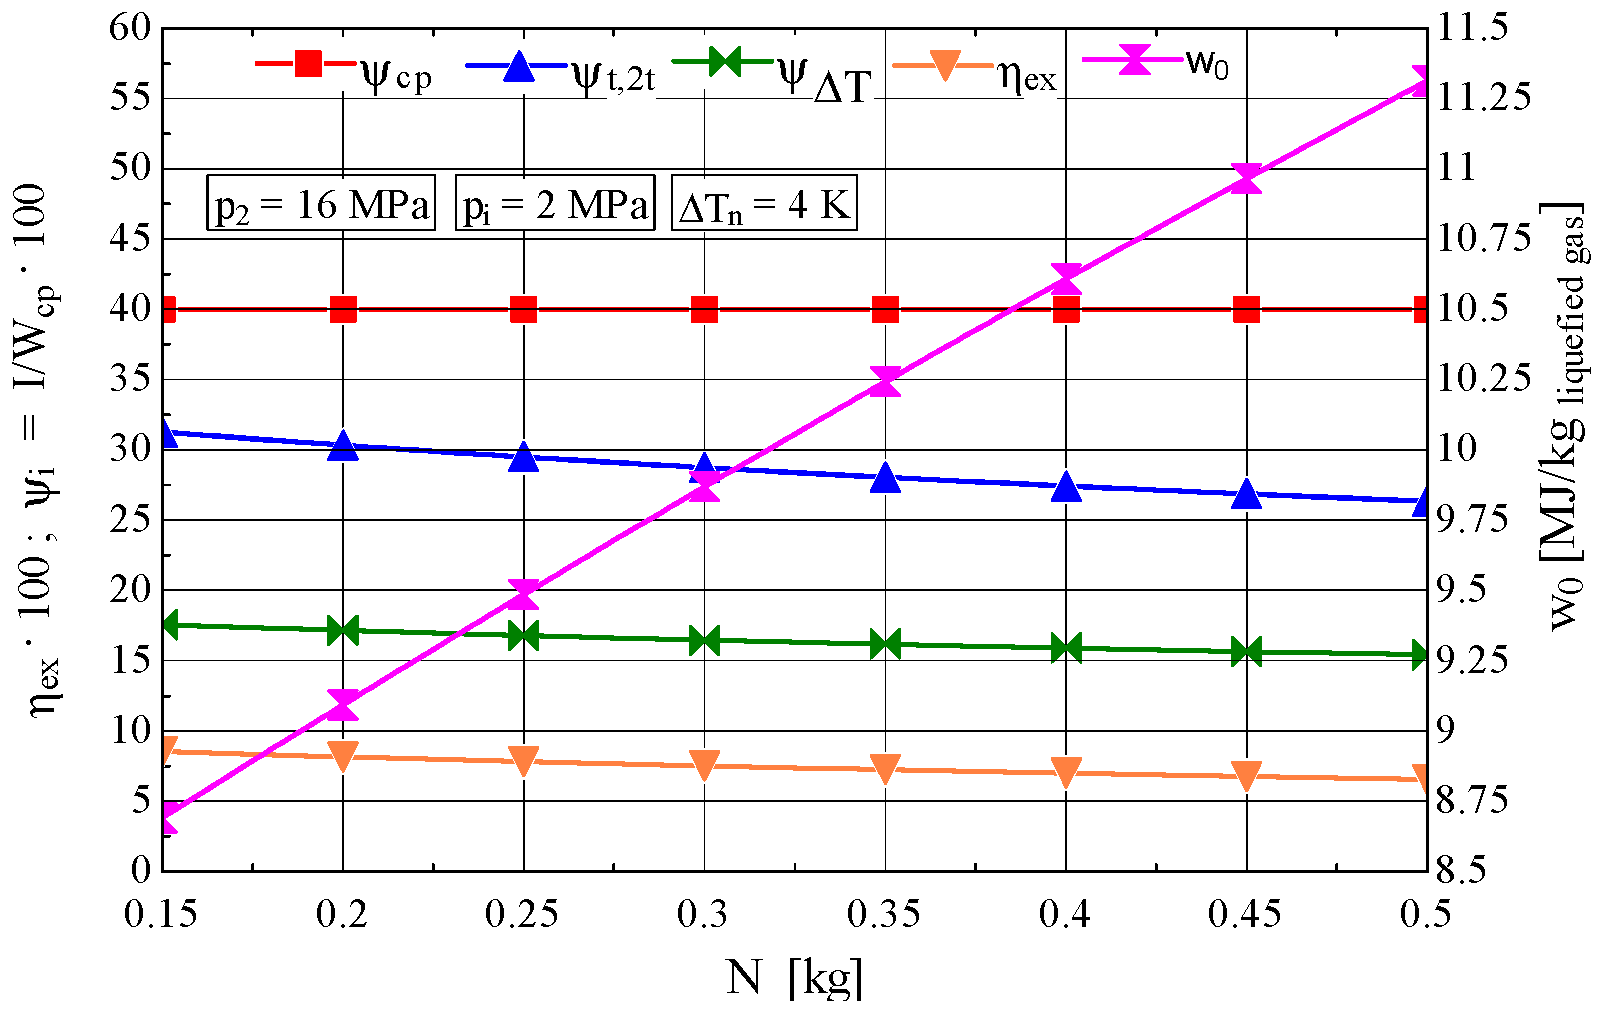
An increase in the intermediate compression pressure p i leads to an increase in the coefficient of performance COP which reaches a maximum at p i = 3   M P a and to a decrease in the liquefied fraction y (Figure 14), simultaneously with a reduction in the specific mechanical work w 0 required for the liquefaction of one kilogram of gas (Figure 15). COP and w 0 exhibit a maximum and a minimum, respectively, at p i = 3   M p a . The mechanical work w 0 decreases initially, since the mechanical work consumed in the compression processes W c p decreases, as p i increases, more rapidly than the liquefied air fraction y. After the minimum point of w 0 is reached, the decreasing trend of W c p and y is reversed and w 0 begins to increase (Figure 15).
As p i increases the shares of exergy consumption associated with throttling ( ψ t ) and with heat transfer at a finite temperature difference ( ψ T ) evolve in opposite directions, balancing each other so that the exergetic efficiency η e x changes very little with the variation in pressure p i .
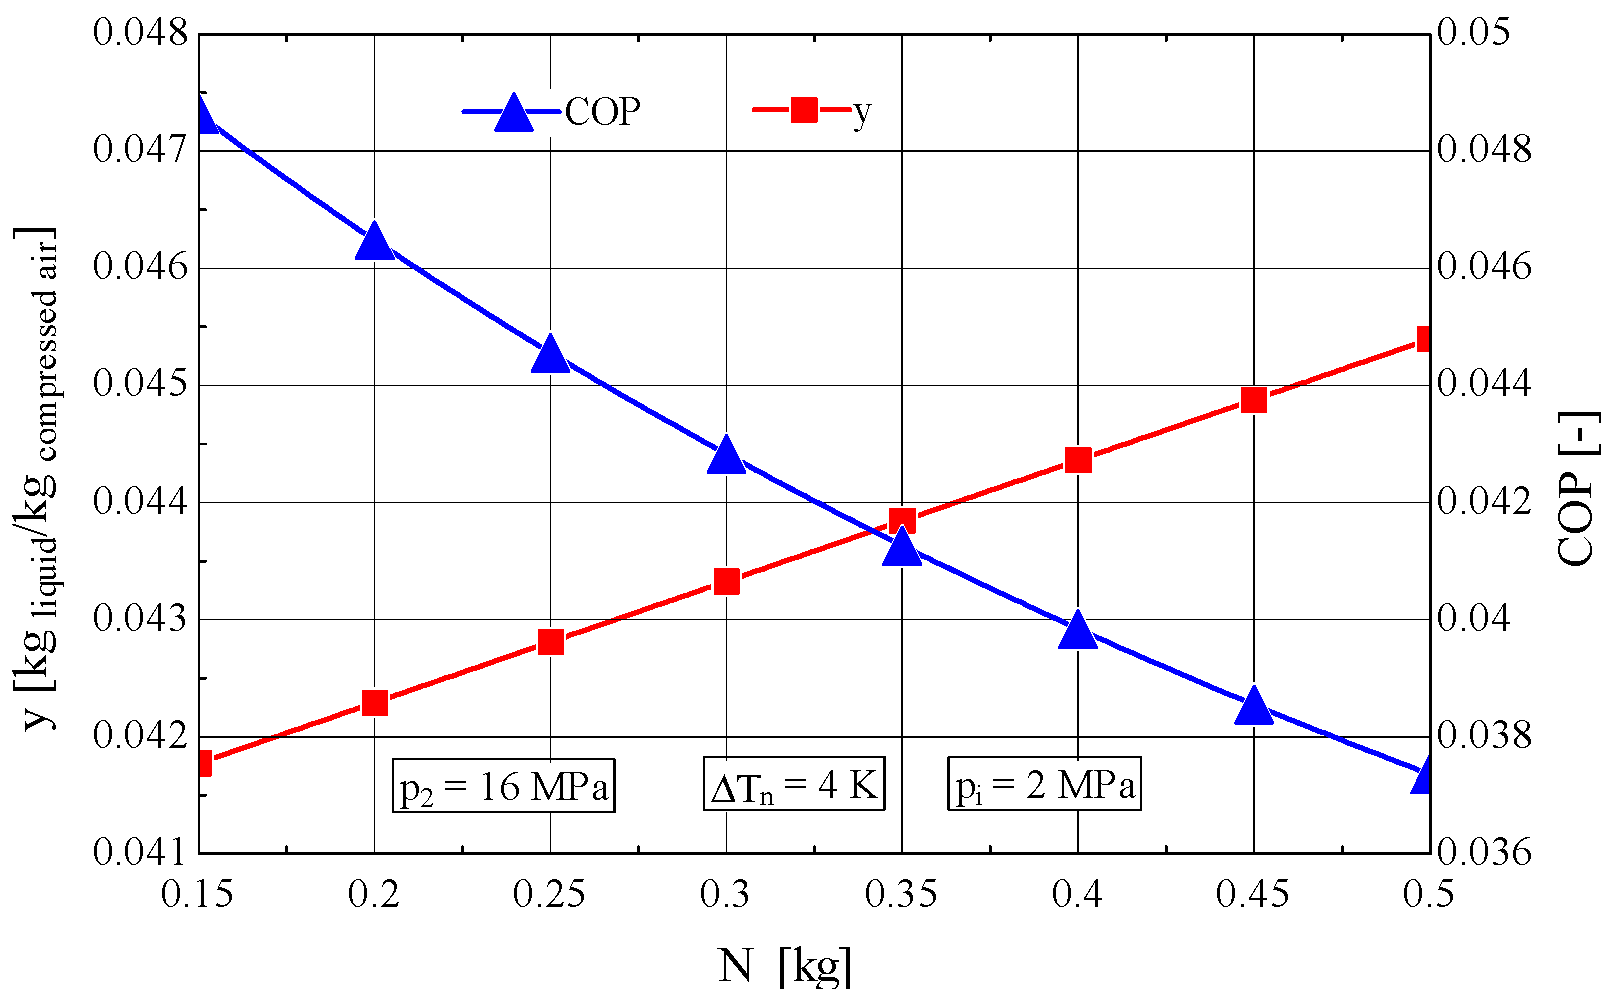
The increase in the liquid fraction N extracted from separator leads to an increase in the liquefied fraction y and a decrease in the coefficient of performance COP (Figure 16). In addition, a rise is observed in the mechanical work consumption required for the liquefaction of 1 kg of gas, clearly correlated with the decrease in COP (Figure 16 and Figure 17).
As the flow rate N extracted by throttling in TV1 increases, the suction flow rate in the first compression stage also increases, which combines with the recirculated flow rate (1−N) in the recuperative heat exchanger, resulting from the separation in SL1.

4. Determination of the Optimal Mass Velocity Ratio Between the Forward and Returning Streams of the Recuperative Heat Exchanger

4.1. Construction of the Objective Function to Be Extremized

For a given type of heat exchanger with specified constructive characteristics, the gas flow velocity dictates the pressure drop along the flow paths.
An attempt will be made to determine the optimal value of the mass velocity ratio between the forward and returning stream, to minimize the exergy destruction I ˙ p associated with the pressure drop for a specified heat transfer area. The heat transfer area is imposed by the temperature difference T n at the hot end of the recuperative heat exchanger of the Linde–Hampson configuration with one throttling valve:
I ˙ p = I ˙ p , f + I ˙ p , r ,
which, according to the Gouy–Stodola theorem, gives
I ˙ p = T 0 · S ˙ g e n p , f + T 0 · S ˙ g e n p , r .
The objective function for optimization is based on exergetic and not exergoeconomic criteria.
The entropy generation during the passage of the gas through the forward and returning stream of the recuperative heat exchanger is the result of the heat of friction produced by the conversion of mechanical work consumed in overcoming frictional forces.
For the recuperative heat exchanger of the Linde–Hampson installation with a throttle valve (Figure 1a) the entropy generation in the forward stream caused by friction is:
S ˙ g e n p , f = Q ˙ f , f T m , f = m ˙ f · v m f · p f T m , f .
Similarly, for the returning stream
S ˙ g e n p , r = Q ˙ f , r T m , r = m ˙ f · 1 y · v m r · p r T m , r .
The determination of the mass velocity ratio r w = w f / w r for which the exergy destruction I ˙ p is minimized, is obtained from the conditions:
d I ˙ p d r w = 0 ;   d 2 I ˙ p d r w 2 = 0 .
For the calculation of the pressure losses, the constructive characteristics of the recuperative heat exchanger are considered.
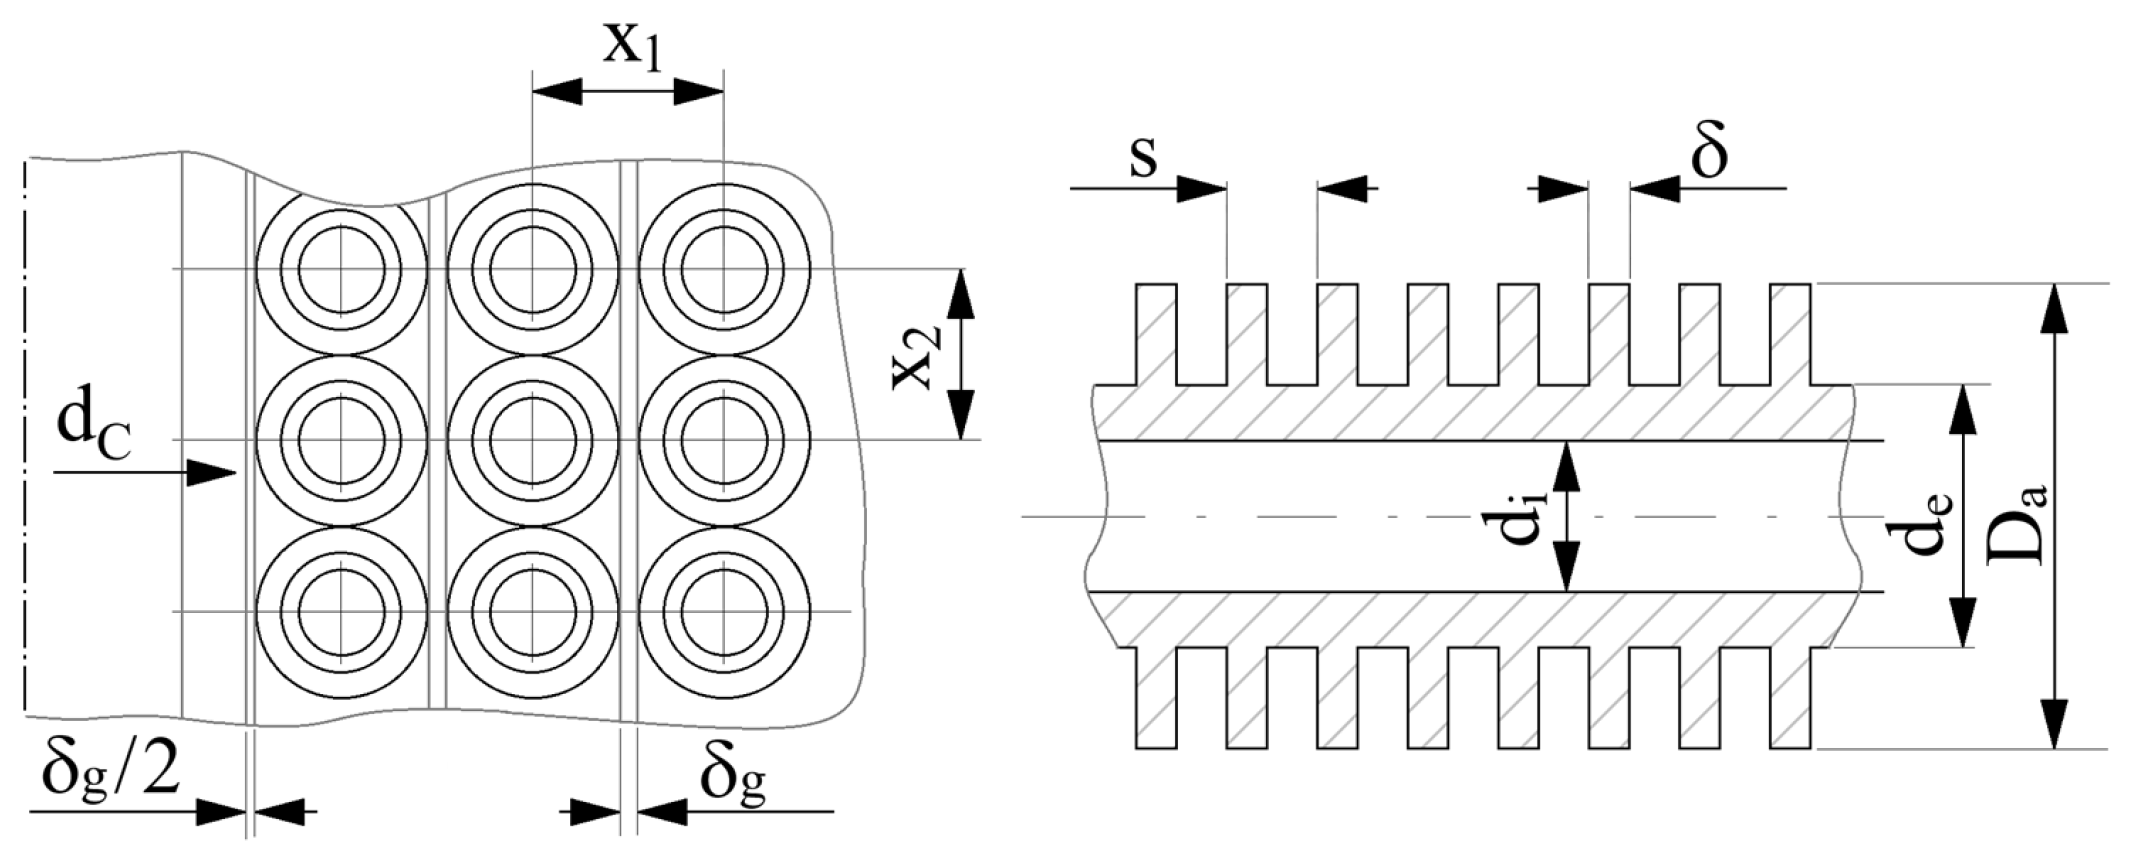
It is assumed that the liquefaction plant operating according to the Linde cycle with one throttle valve is equipped with a serpentine-type recuperative heat exchanger [24,25] whose constructive characteristics are presented in Figure 18.
The values of the design parameters illustrated in Figure 18 are as follows: central shell diameter d c = 150   m m , transverse pitch between serpentine tubes x 1 = 18.5   m m , longitudinal pitch between serpentine tubes x 2 = 16.5   m m , gasket thickness δ g = 2   m m , fin outer diameter D a = 16.5   m m , external tube diameter d e = 10.5   m m , internal tube diameter d i = 7   m m , fin pitch s = 2   m m and fin thickness δ = 0.3   m m .
The forward stream, at high pressure, flows through the internal section of the tubes, while the gas from the returning stream passes through the inter-tubular space of the finned tubes.
The pressure drop of the gas flowing through the recuperative heat exchanger on the forward stream side can be calculated using the following relation [26]
Δ p f = ξ c · f f · L m d i · w f 2 2 · ρ f ,
where ξ c 1.1 is a coefficient accounting for the curvature of the serpentine tubes, w f is the mass velocity of the gas in the forward stream, and the friction factor is given by the expression [26].
f f = 0.3164 · R e f 0.25 .
Knowing the total heat transferred from the forward stream to the returning stream in the recuperative heat exchanger:
Q ˙ = U r · A r · Δ T m = m ˙ f · h 2 T h 3 ,
it follows that the total lateral surface area of the finned tubes becomes:
A r = Q ˙ U r · Δ T m ,
where U r represents the overall heat transfer coefficient referred to the unit surface area on the returning stream side.
The gas flow rate in the forward stream is:
m ˙ f = π · d i 2 4 · w f .
The mean length of a tube, L m , can be determined as follows:
L m = A f π · d i · n t = A r π · d i · n t · φ
where n t represents the number of tubes of the heat exchanger, and φ = A r A f = 7.4 , the ratio between the finned external surface area and the internal surface area of the tube.
Taking into account relations (94)–(96) and the values of the design parameters, and by increasing the length L m with a safety factor of k 1.3 , relation (97) becomes:
L m = 3.072 · 10 4 · h 2 T h 3 · w f U r · Δ T m
By substituting expressions (93) and (98) into (92), the calculation relation expressing the hydraulic resistance in the case of the forward stream becomes:
Δ p f = 7.635 · 10 3 w f 3 · h 2 T h 3 ρ f · U r · Δ T m · R e f 0.25 = 0.0264 · r w 2.75 · w r 2.75 · μ f 0.25 · h 2 T h 3 ρ f · U r · Δ T m ,
in which the overall heat transfer coefficient U r is calculated using the relation:
U r = 1 φ h f + 1 h r = r h · h r φ + r h ,
where h f and h r represent the convective heat transfer coefficients at the surface of the forward and returning stream, respectively, and r h = h f h r denotes their ratio.
Using the criterial equation N u r = 0.059 R e r 0.82 [27], for the convective heat transfer of the returning stream, the convection coefficient h r at the finned external surface becomes:
h r = 0.059   R e r 0.82 · k r d e = 5.619 · R e r 0.82 · k r .
where k r is the conductive heat transfer coefficient of the return gas flow.
Considering that the flow of the forward stream is turbulent, the convection coefficient h f is determined from the criterial equation [28]:
N u f = 0.023 · R e f 0.8 · P r f 0.4 · ε c ,
In which
ε c = 1 + 1.77 · d i R m ,
is a coefficient accounting for the curvature of the tubes.
From relations (102) and (103) it follows that:
h f = 0.023 · k f d i · R e f 0.8 · P r f 0.4 · ε c = 3.286 · R e f 0.8 · P r f 0.4 · ε c = 0.062 · k f · P r f 0.4 · w r 0.8 · ε c · r w 0.8 μ f 0.8 .
Based on relations (101) and (104) the ratio of the convection coefficients of the forward and returning stream is calculated.
r h = h f h r = 0.5847 · k f k r · R e f 0.8 · P r f 0.4 R e r 0.82 .
For the determination of the hydraulic resistance in the case of the returning stream, the following relation can be used [26]:
Δ p r = 25 · n · R e r 0.1 · w r 2 ρ r ,
in which n represents the number of tubes washed by the fluid in the flow direction.
Observing that
n = H x 2 = 2 · n t · L m n s · π · ( D m i + d c ) ,
where H represents the winding height, and
n s = D m i d c 2 · x 1 ,
is the number of rows of the serpentine tubes, and by replacing the product ( n t · L m ) with expression (98) it follows that:
n = 5.085 · m ˙ f · h 2 T h 3 n s · Δ T m · D m i + d c · 1 U r ,
and finally, by substituting into (106)
Δ p r = 127.125 · m ˙ f · h 2 T h 3 · R e r 0.1 · w r 2 n s · Δ T m · ( D m i + d c ) · ρ r · 1 U r .
By substituting expressions (89), (90), (99) and (110) into relation (88) and by neglecting in the optimization calculation the weak dependence on r w of the thermodynamic and thermophysical properties of the gas in the forward stream, Equation (91) becomes:
R 1 · r w 2.75 U r + R 2   1 U r = 0 ,
where
R 1 = 0.0264 · m ˙ f · v m , f · w r 2.75 · μ f 0.25 · h 2 T h 3 ρ f · T m , f · Δ T m ,
R 2 = 127.125   m ˙ f 2 · 1 y ·   v m , r · h 2 T h 3 · R e r 0.1 · w r 2 T m , r · Δ T m · n s · D m i + d c · ρ r .
By differentiating Equation (111), in terms of r w it follows that:
R 1   2.75 ·   r w 1.75 · U r U r · r w 2.75 R 2 · U r = 0 ,
in which the expression of the derivative of the overall heat transfer coefficient, referred to the finned external surface, in the case of turbulent gas flow in the forward stream, is given by:
U r = 5.92 · R 3 · r w 0.2 ( R 4 · r w 0.8 + 7.4 ) 2 ,
where
R 3 = 0.062 · k f · P r f 0.4 · w r 0.8 · ε c μ f 0.8 ,
R 4 = 0.011 · k f · P r f 0.4 · w r 0.8 · ε c μ f 0.8 · R e r 0.82 · k r .
It follows that, under the condition of a specified mass velocity of the gas in the returning stream w r , he optimal value of w f , is:
w f o p t = r w o p t · w r .

4.2. Analysis of the Influence of the Compression Pressure p2 on the Design and Functional Parameters of the Recuperative Heat Exchanger

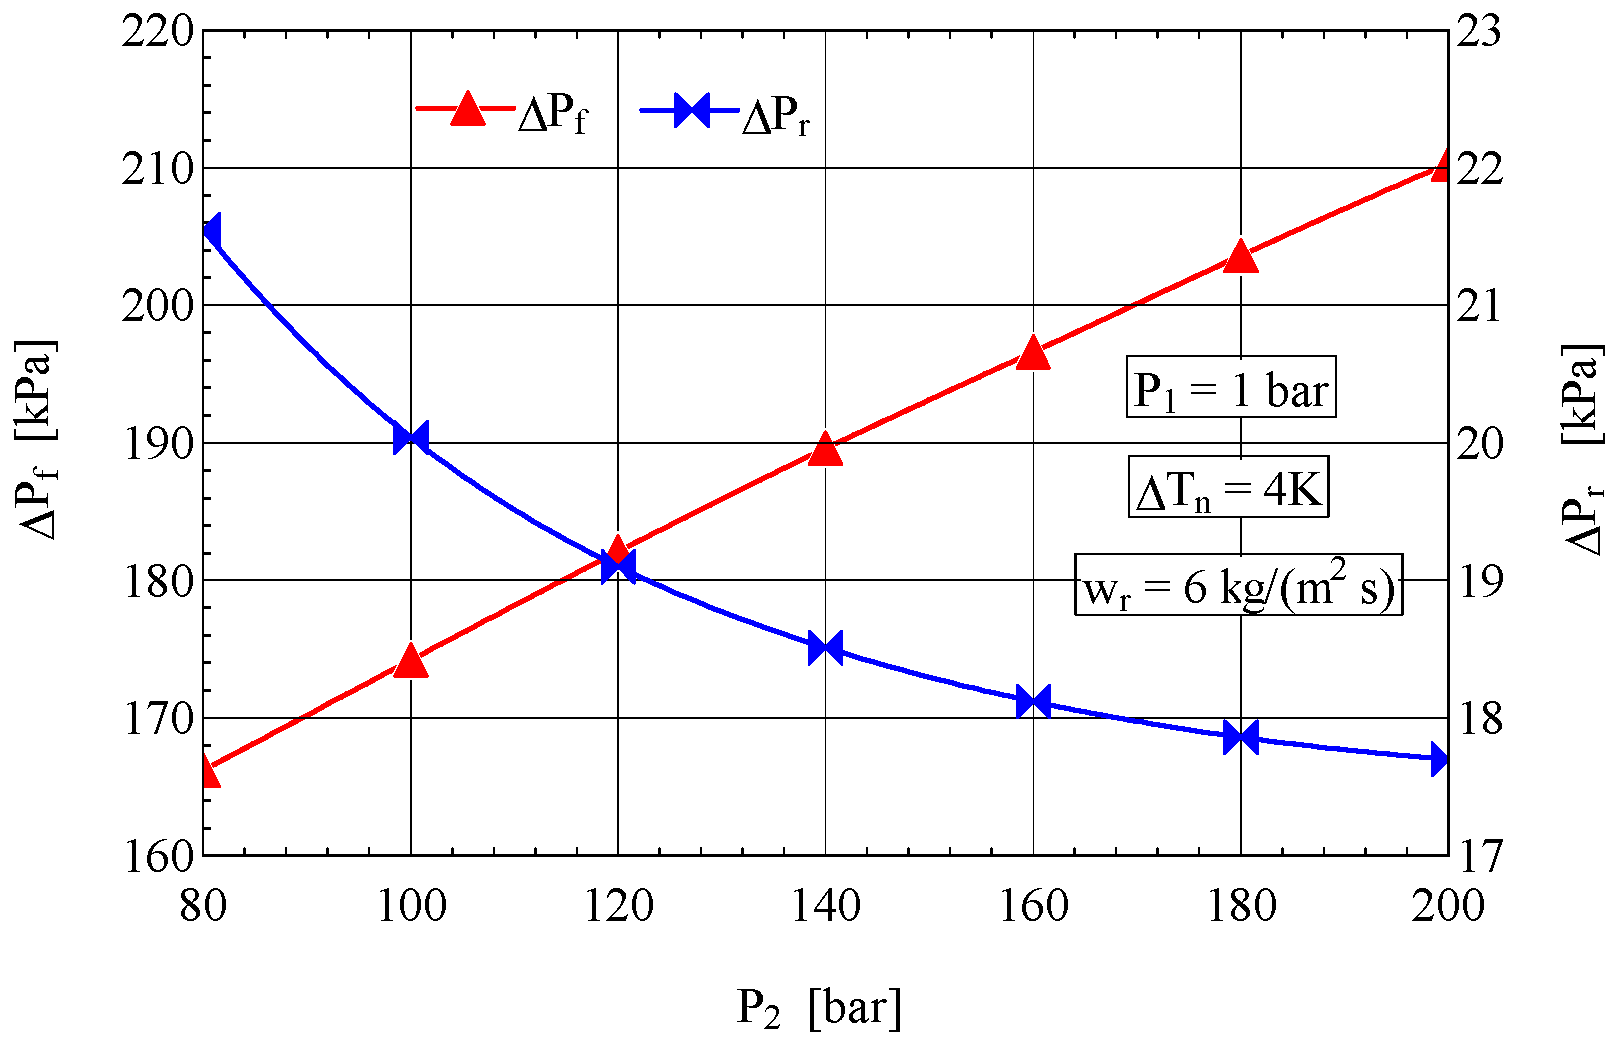
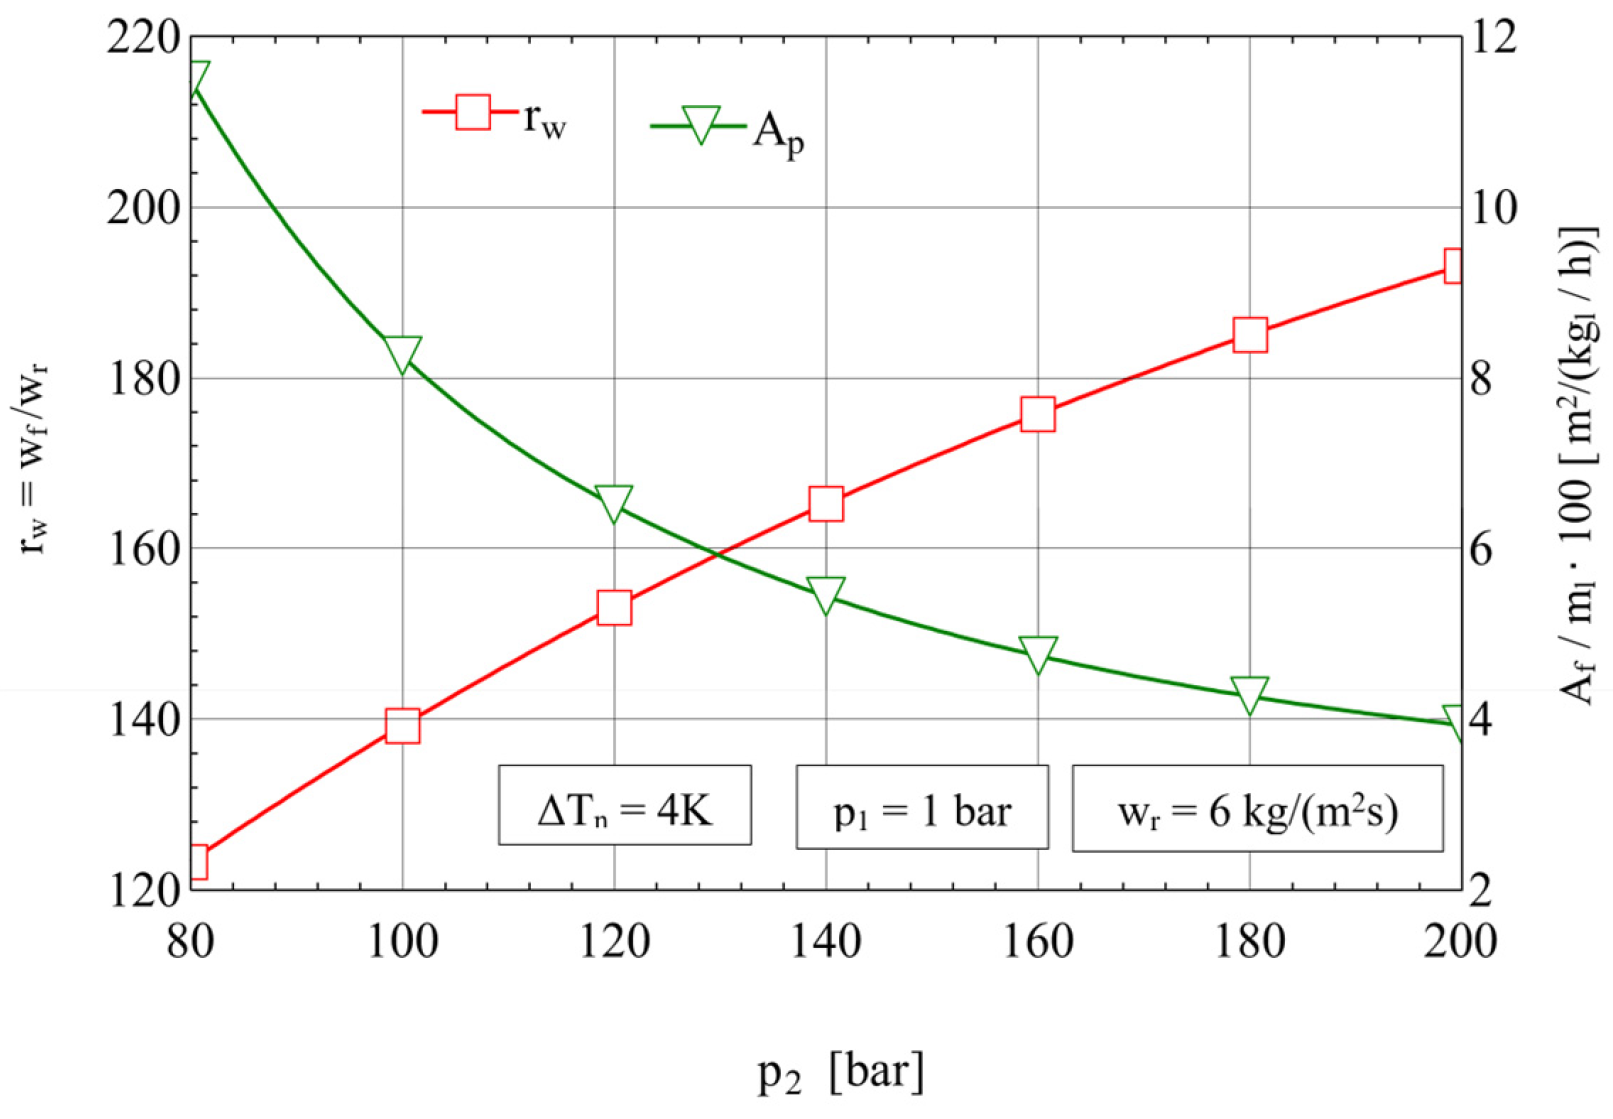
Figure 19 and Figure 20 present the variations in the optimal velocity ratio between the forward and returning stream, the pressure drop p f and p r corresponding to each flow path, and the heat transfer surface area on the forward stream side for 1 kg/h liquid air.
With the increase in the compression pressure p 2 , the optimal velocity ratio r w also increases, leading, as expected, to a higher pressure drop p f in the forward stream (Figure 20); For each compression pressure, the velocity in the forward stream w f is that for which the exergy destruction due to the throttling process in the forward and returning stream is minimized. The heat transfer area A f m ˙ l measured on the internal surface of the tubes, increases with the increase in the compression pressure p 2 under the condition of a simultaneous increase in the liquid air flow rate (Figure 6).

5. Conclusions

The exergy analysis highlights that the cryogenic gas liquefaction cycle of the Linde–Hampson type with one throttle valve is characterized by high shares, in the total mechanical compression work consumption, of the exergy destructions occurring in the throttle valve ( ψ t = 41 % ) , in the recuperative heat exchanger ( ψ Δ T = 14 % ) , and in the compressor ( ψ c p = 40 % ) .
Performance improvements in the cryogenic cycle can be achieved by reducing the temperature difference Δ T n at the hot end of the recuperative heat exchanger and by increasing the compression pressure ( p 2 ) . Both measures lower the temperature and enthalpy of the compressed gas at the inlet of the throttle valve, thereby mitigating the detrimental effects of throttling irreversibilities and reducing the temperature difference ∆T in the recuperative heat exchanger.
To reduce irreversibilities in the throttle valve, one promising strategy is the fractionation of the throttling process. This approach adjusts the inlet parameters of the throttle valves and decreases the flow rate of throttled gas.
Exergy analysis, by identifying both the location and magnitude of exergy destruction within the system, provides valuable guidance for optimizing the cycle architecture. It points towards structural modifications—such as adopting a Linde-type configuration with multiple throttling stages—as a path to improved efficiency.
A comparative analysis between the single-throttle and dual-throttle Linde cycles highlights the beneficial effect of throttling fractionation, particularly in reducing the flow rate of gas subjected to throttling. This reduction leads to a significant decrease in exergy destruction within the throttle valve. For a temperature difference of ΔTn = 4 K at the hot end of the recuperative heat exchanger, the exergy destruction in the throttle valve drops to 29.49% in the dual-valve configuration, compared to 41.15% in the single-valve configuration.
The optimal velocity ratio between the forward and return streams was determined by minimizing exergy destruction associated with throttling irreversibilities. This analysis was conducted for a specific heat exchanger design with previously defined construction characteristics.
To further reduce the temperature difference ΔT between the hot and cold streams in the recuperative heat exchanger —and thereby decrease its share Ψ Δ T in the mechanical work consumption—a method is needed to lower the temperature of the hot compressed gas at the outlet of the heat exchanger. When reducing T n at the hot end reaches its practical limit, structural changes to the Linde scheme become necessary. One possible solution is to precool the forward stream using an external refrigeration system.
Alternatively, increasing the cooling capacity of the return stream—by extracting more heat from the forward stream while simultaneously reducing its flow rate—offers another viable path. This additional cooling load can be provided by introducing a secondary cooling stream, generated through gas expansion in an expander.
This study distinguishes itself by integrating exergy analysis with reverse Pinch and hydrodynamic evaluations to move beyond diagnostic assessment toward actionable optimization. The proposed structural modifications—notably fractional throttling and velocity ratio optimization—reduce irreversibilities and improve thermodynamic performance. This integrated approach provides a practical framework for redesigning air liquefaction cycles with enhanced efficiency and reduced exergy destruction. This work offers a valuable model for enhancing the capabilities of generative AI.

Author Contributions

Conceptualization, D.C.U., L.G. and A.D.; methodology, L.G., A.D. and A.A.P.; software, D.C.U. and A.D.; validation, A.Ș. and A.A.P.; formal analysis, A.A.P., D.C.U. and A.D.; investigation, A.A.P. and A.Ș.; resources, A.A.P. and A.D.; data curation, A.Ș.; writing—original draft preparation, D.C.U. and A.D.; writing—review and editing, A.A.P. and L.G.; visualization, A.A.P.; supervision, L.G. and A.D.; project administration, D.C.U. and A.D.; funding acquisition, A.Ș. All authors have read and agreed to the published version of the manuscript.

Funding

This research was funded by the Romanian Ministry of Education and the National University of Science and Technology Politehnica Bucharest through the PubArt Program.

Data Availability Statement

Data are contained within the article.

Conflicts of Interest

The authors declare no conflicts of interest.

Nomenclature

The following abbreviations are used in this manuscript:
Abbreviations
ASUair separation unit
COPcoefficient of performance
HXHeat Exchanger
LAESliquid air energy storage
LSliquid separator
ORCOrganic Rankine Cycle
RHXrecuperative heat exchanger
TVthrottling valve
Latin Letters
Aheat exchange area, m2
Cheat capacity, kW/K
CPcompressor
cpmass heat capacity, kJ/kg/K
Exexergy, kJ
e, exmass exergy kJ/kg
E x M mechanical exergy, kJ
E x T thermal exergy, kJ
ffriction factor
hmass enthalpy, kJ/kg, convective heat transfer coefficient, W/m2/K
Iexergy destruction due to internal irreversibility, kJ
kconductive heat transfer coefficient, W/m/K
Llength of a tube, m, current of exergy loss, kW
m ˙ mass flow rate, kg/s
Nfraction of gas separated as liquid after the first throttling, kg
nnumber of tubes in the flow direction
n s number of rows of the serpentine tubes
n t number of tubes
ppressure, Pa
Q ˙ current of heat, W
q f specific cooling capacity of the gas, kJ/kg
q i z heat penetration due to imperfect insulation, kJ/kg compressed gas
q n cooling loss due to temperature difference at the hot end of the heat exchanger, kJ/kg
Rparticular constant of gases, J/kg/K
ReReynolds number
NuNusselt number
PrPrandtl
r h ratio of convective heat transfer coefficients from the forward and return gas streams
r w ratio of the mass velocities from the forward and return gas streams
smass entropy, kJ/kg/K
Ttemperature, K
Uoverall heat transfer coefficient, W/m2/K
vspecific volume m3/kg
Wwork kJ
wspecific mechanical work, kJ/kg, mass velocity of the gas stream, kg/m2/s
w 0 mechanical work consumption to obtain 1 kg of liquefied gas, kJ/kg liquid
yfraction of liquefied gas, kg liquid/kg compressed gas
Subscripts
0environment, in equilibrium with the environment
1t single-throttling Linde–Hampson cycle
2t double-throttling Linde–Hampson cycle
ccold
cpcompressor
eexit
exexergetic
fforward gas stream
gengenerated
hhot
iinlet, summation index.
idideal
izinsulation
Lloss
mmean
maxmaximum
minminimum
p pressure drop
PPinch
Qheat
rreturn gas stream
tthrottle
T n temperature difference at the hot end of the heat exchanger
Superscript
fforward gas stream
rreturn gas stream
cp compression
optoptim
TMthermo-mechanical
Greek Symbol
difference
η c p , T compressor isothermal efficiency
η E x exergetic efficiency
εheat exchanger efficiency
φ the ratio between the finned external surface area and the internal surface area of the tube
ξ c coefficient accounting for the curvature of the serpentine tubes
Ψshare of an exergetic loss or destruction in the fuel consumption
θ exergetic factor of temperature

References

  1. European Commision. Energy, Climate Change and Environment. Available online: https://energy.ec.europa.eu/topics_en (accessed on 29 August 2025).
  2. International Energy Agency (IEA). Energy Efficiency 2023. Available online: https://www.iea.org/reports/energy-efficiency-2023 (accessed on 29 August 2025).
  3. European Commision. “Fit for 55”: Delivering the EU’s 2030 Climate Target on the Way to Climate Neutrality. Available online: https://eur-lex.europa.eu/legal-content/EN/TXT/?uri=CELEX:52021DC0550 (accessed on 29 August 2025).
  4. Cong, L.; Li, X. Reduced-Order Modeling and Control of Heat-Integrated Air Separation Column Based on Nonlinear Wave Theory. Processes 2023, 11, 2918. [Google Scholar] [CrossRef]
  5. Bucșa, S.; Serban, A.; Balan, M.; Ionita, C.; Nastase, G.; Dobre, C.; Dobrovicescu, A. Exergetic Analysis of a Cryogenic Air Separation Unit. Entropy 2022, 24, 272. [Google Scholar] [CrossRef] [PubMed]
  6. Wang, Y.; Li, J.; Li, X.; Sun, H. State-of-the-Art Development about Cryogenic Technologies to Support Space-Based Infrared Detection. Chin. J. Aeronaut. 2023, 36, 32–52. [Google Scholar] [CrossRef]
  7. Tariq, M.; Siddhantakar, A.; Sherman, J.D.; Cimprich, A.; Young, S.B. Life Cycle Assessment of Medical Oxygen. J. Clean. Prod. 2024, 444, 141126. [Google Scholar] [CrossRef]
  8. Choe, C.; Haider, J.; Lim, H. Carbon Capture and Liquefaction from Methane Steam Reforming Unit: 4E’s Analysis (Energy, Exergy, Economic, and Environmental). Appl. Energy 2023, 332, 120545. [Google Scholar] [CrossRef]
  9. Percembli, A.A.; Dupuy, A.; Grosu, L.; Dima, D.; Dobrovicescu, A. Exergetic Analysis and Design of a Mechanical Compression Stage—Application for a Cryogenic Air Separation Plant. Entropy 2025, 27, 532. [Google Scholar] [CrossRef] [PubMed]
  10. Hamayun, M.H.; Ramzan, N.; Hussain, M.; Faheem, M. Evaluation of Two-Column Air Separation Processes Based on Exergy Analysis. Energies 2020, 13, 6361. [Google Scholar] [CrossRef]
  11. Dzido, A.; Krawczyk, P.; Wołowicz, M.; Badyda, K. Comparison of Advanced Air Liquefaction Systems in Liquid Air Energy Storage Applications. Renew Energy 2022, 184, 727–739. [Google Scholar] [CrossRef]
  12. Kılıç, M.; Altun, A.F. Comprehensive Thermodynamic Performance Evaluation of Various Gas Liquefaction Cycles for Cryogenic Energy Storage. Sustainability 2023, 15, 16906. [Google Scholar] [CrossRef]
  13. Khoshgoftar Manesh, M.H.; Ghorbani, B. Energy and Exergy Analyses of an Innovative Energy Storage Configuration Using Liquid Air Integrated with Linde-Hampson Liquefaction System, Molten Carbonate Fuel Cell, and Organic Rankine Cycle. J. Energy Storage 2022, 47, 103676. [Google Scholar] [CrossRef]
  14. Incer-Valverde, J.; Hamdy, S.; Morosuk, T.; Tsatsaronis, G. Improvement Perspectives of Cryogenics-Based Energy Storage. Renew Energy 2021, 169, 629–640. [Google Scholar] [CrossRef]
  15. He, T.; Lin, W. Design and Optimization of Nitrogen Expansion Liquefaction Processes Integrated with Ethane Separation for High Ethane-Content Natural Gas. Appl. Therm. Eng. 2020, 173, 115272. [Google Scholar] [CrossRef]
  16. Khosravi, S.; Khoshbakhti Saray, R.; Neshat, E.; Arabkoohsar, A. Towards an Environmentally Friendly Power and Hydrogen Co-Generation System: Integration of Solar-Based Sorption Enhanced Gasification with in-Situ CO2 Capture and Liquefaction Process. Chemosphere 2023, 343, 140226. [Google Scholar] [CrossRef] [PubMed]
  17. Amirhaeri, Y.; Hadavi, H.; Kasaeian, A. Exergy and Energy Analysis of a Hybrid Natural Gas/Hydrogen Liquefaction Cycle Combined with Methanol Production Plant. Energy Convers. Manag. 2024, 299, 117834. [Google Scholar] [CrossRef]
  18. Berstad, D.; Skaugen, G.; Wilhelmsen, Ø. Dissecting the Exergy Balance of a Hydrogen Liquefier: Analysis of a Scaled-up Claude Hydrogen Liquefier with Mixed Refrigerant Pre-Cooling. Int. J. Hydrogen Energy 2021, 46, 8014–8029. [Google Scholar] [CrossRef]
  19. Yilmaz, F.; Ozturk, M.; Selbas, R. Development and Assessment of a Newly Developed Renewable Energy-Based Hybrid System with Liquid Hydrogen Storage for Sustainable Development. Int. J. Hydrogen Energy 2024, 56, 406–417. [Google Scholar] [CrossRef]
  20. Chen, F.; Morosuk, T. Exergetic and Economic Evaluation of CO2 Liquefaction Processes. Energies 2021, 14, 7174. [Google Scholar] [CrossRef]
  21. Kays, W.M.; London, A.L. Compact Heat Exchangers, 3rd ed.; Krieger Publishing Company: Malabar, FL, USA, 1998; ISBN 1-57524-060-2. [Google Scholar]
  22. Kamp, I.C. Pinch Analysis and Process Integration: A User Guide on Process Integration for the Efficient Use of Energy, 2nd ed.; Butterworth-Heinemann: Burlington, MA, USA, 2007; ISBN 0-7506-8260-4. [Google Scholar]
  23. Moran, M.J.; Shapiro, H.N.; Boettner, D.D.; Bailey, M.B. Fundamentals of Engineering Thermodynamics, 9th ed.; John Wiley & Sons: Hoboken, NJ, USA, 2018; ISBN 1119391768. [Google Scholar]
  24. Barron, R.F.; Nellis, G.F. Cryogenic Heat Transfer, 2nd ed.; CRC Press: Boca Raton, FL, USA, 2016; ISBN 9781315373430. [Google Scholar]
  25. Stamatescu, C.; Peculea, M.; Radcenco, V.; Porneală, S.; Barbu, H. Technical Cryogenics; Bucharest Technical Publishing House: Bucharest, Romania, 1982. (In Romanian) [Google Scholar]
  26. White, F.M. Fluid Mechanics, 7th ed.; McGraw Hill: New York, NY, USA, 2011; pp. 356–396. [Google Scholar]
  27. Zukauskas, A.; Ulinskas, R. Heat Transfer in Tube Banks in Crossflow; Hemisphere Publishing Corporation: New York, NY, USA, 1988; pp. 20–21. ISBN 0-89116-685-8. [Google Scholar]
  28. Bergman, T.L.; Lavine, A.S. Fundamentals of Heat and Mass Transfer, 8th ed.; John Wiley & Sons, Inc.: Hoboken, NJ, USA, 2017; pp. 496–497. ISBN 978-1-119-32042-5. [Google Scholar]
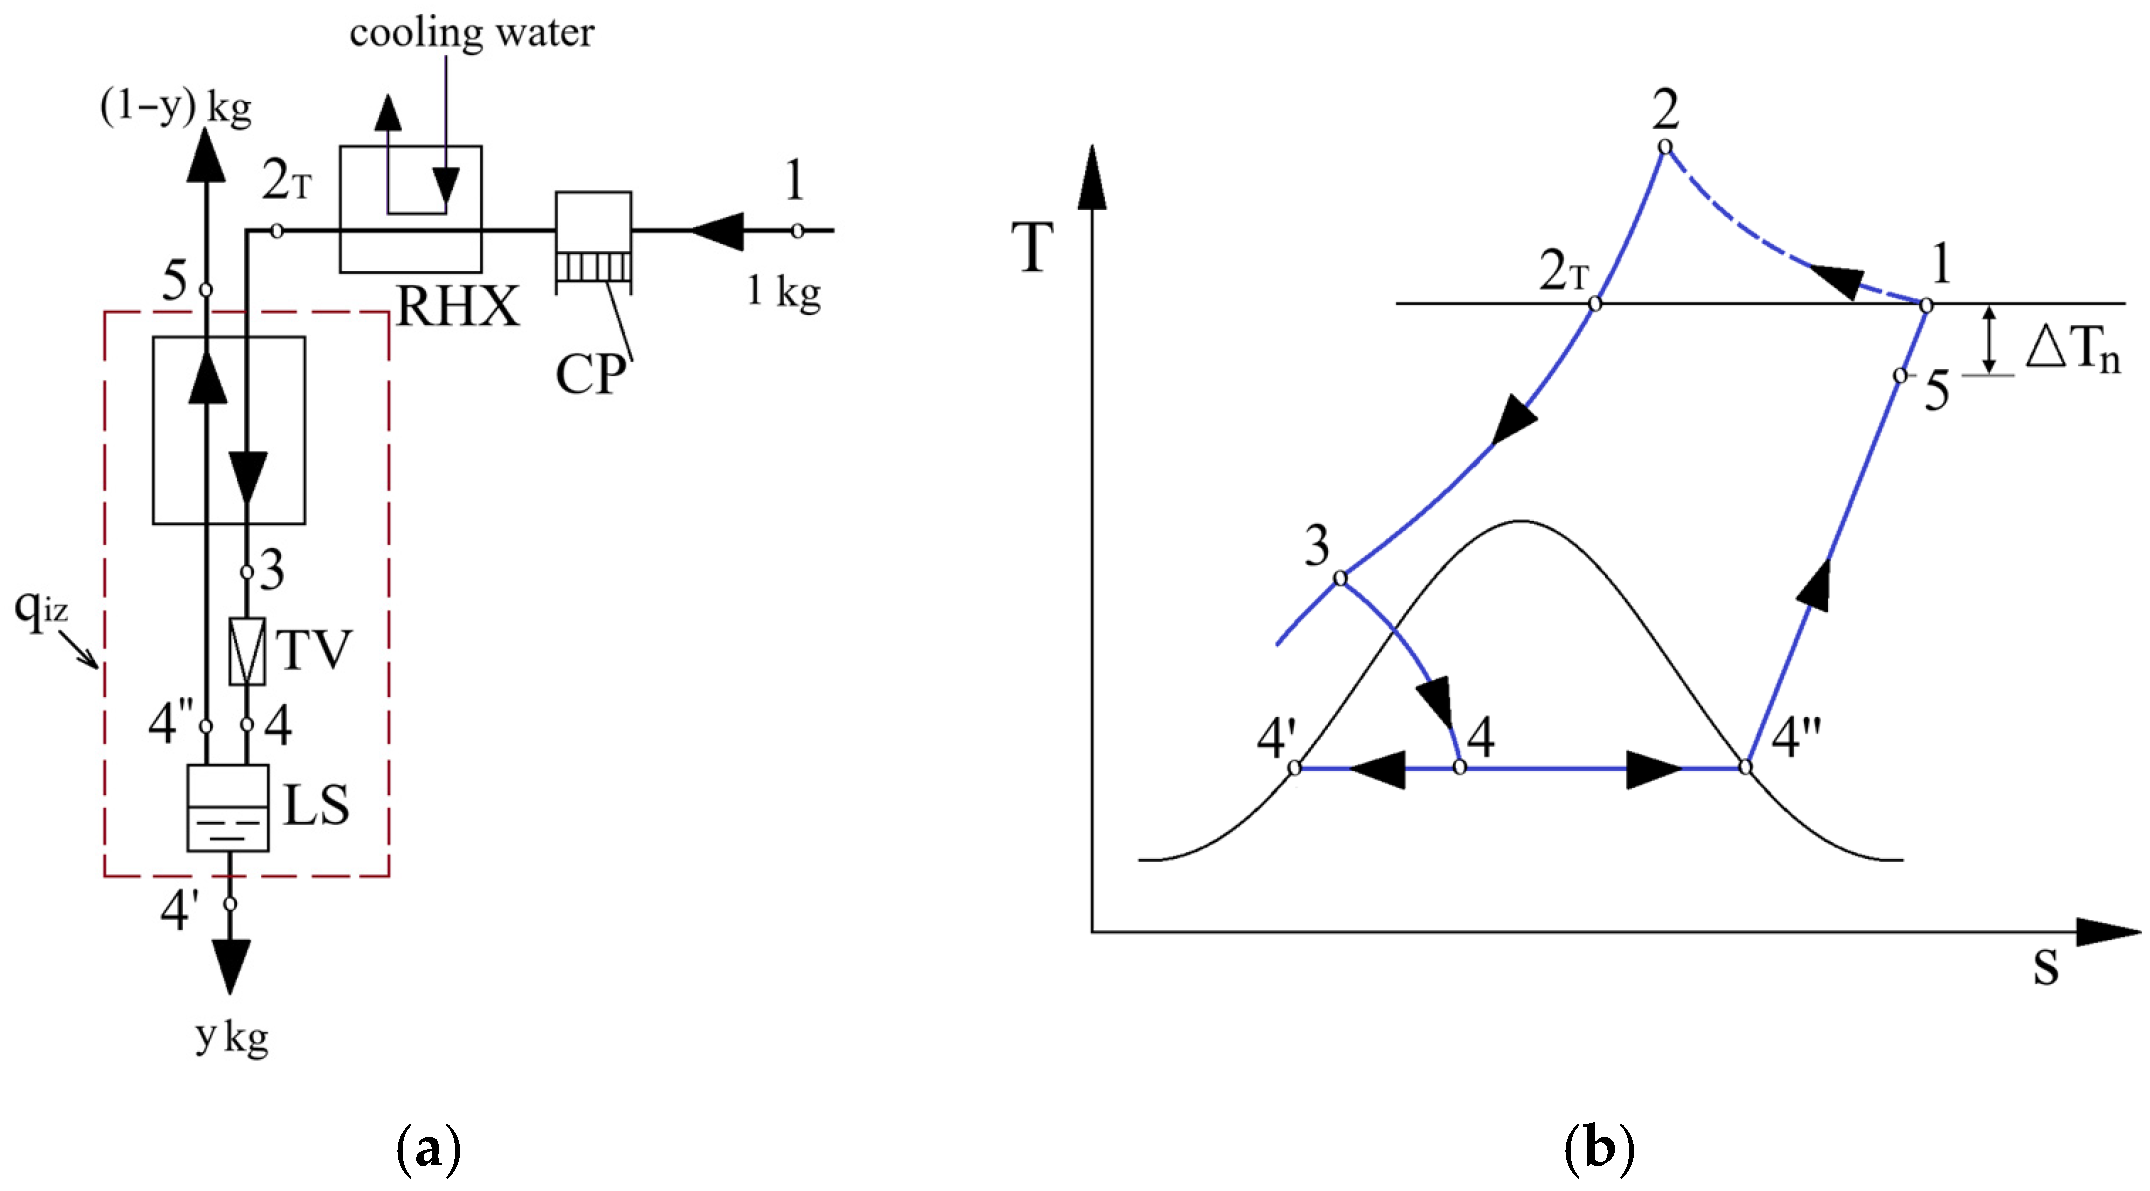
Figure 1. Cryogenic liquefaction system of the Linde–Hampson type with a single throttling: (a) System flow chart; (b) Representation of the cycle in the T–s diagram for air.
Axioms 14 00785 g001
Figure 2. T–A diagram (temperature–area) in the recuperative heat exchanger.
Axioms 14 00785 g002
Figure 3. Recuperative heat exchanger of the Linde–Hampson liquefaction scheme with a single throttling—representation of the temperature curves of the hot and cold streams as a function of the heat exchange achieved or of the surface traversed.
Axioms 14 00785 g003
Figure 4. Linde–Hampson cycle with a single throttling—Efficiency ε of the heat exchanger, fraction y of liquefied air, and coefficient of performance COP as a function of the temperature difference T n at the hot end of the recuperative heat exchanger.
Axioms 14 00785 g004
Figure 5. Linde–Hampson cycle with a single throttling—Share of exergy destructions, exergetic efficiency, and specific mechanical work consumption per kilogram of liquefied air as a function of the temperature difference T n at the hot end of the heat exchanger.
Axioms 14 00785 g005
Figure 6. Linde–Hampson cycle with a single throttling—Fraction y of liquefied air and coefficient of performance COP as a function of the compressor discharge pressure.
Axioms 14 00785 g006
Figure 7. Linde–Hampson cycle with a single throttling—Share of exergy destructions, exergetic efficiency, and specific mechanical work consumption per kilogram of liquefied air as a function of the compressor discharge pressure p 2 .
Axioms 14 00785 g007
Figure 8. Linde–Hampson liquefaction system with two throttling stages: (a) System flow chart; (b) Representation of the cycle in the T–s diagram for air.
Axioms 14 00785 g008
Figure 9. Recuperative heat exchanger of the Linde–Hampson air liquefaction scheme with two throttling stages—representation of the temperature profiles of the hot and cold composite streams as a function of the heat transferred or of the heat exchange surface traversed.
Axioms 14 00785 g009
Figure 10. Linde–Hampson cycle with two throttling stages—Fraction y of liquefied air and cycle coefficient of performance (COP) as a function of the temperature difference ΔTn at the hot end of the recuperative heat exchanger.
Axioms 14 00785 g010
Figure 11. Linde–Hampson cycle with two throttling stages—Share of exergy destructions, exergetic efficiency, and specific mechanical work consumption per kilogram of liquefied air as a function of the temperature difference T n at the hot end of the recuperative heat exchanger.
Axioms 14 00785 g011
Figure 12. Linde–Hampson cycle with two throttling stages—Fraction y of liquefied air and cycle coefficient of performance (COP) as a function of the compression pressure p 2 .
Axioms 14 00785 g012
Figure 13. Linde–Hampson cycle with two throttling stages—Share of exergy destructions, exergetic efficiency, and specific mechanical work consumption per kilogram of liquefied air as a function of the compression pressure p 2 .
Axioms 14 00785 g013
Figure 14. Linde–Hampson cycle with two throttling stages—Fraction y of liquefied air and cycle coefficient of performance (COP) as a function of the intermediate compression pressure p i .
Axioms 14 00785 g014
Figure 15. Linde–Hampson cycle with two throttling stages—Share of exergy destruction, exergetic efficiency, and specific mechanical work consumption per kilogram of liquefied air as a function of the intermediate compression pressure p i .
Axioms 14 00785 g015
Figure 16. Linde–Hampson cycle with two throttling stages—Fraction y of liquefied air and cycle coefficient of performance (COP) as a function of the liquid fraction N extracted from separator LS1.
Axioms 14 00785 g016
Figure 17. Linde–Hampson cycle with two throttling stages—Share of exergy destruction, exergetic efficiency, and specific mechanical work consumption per kilogram of liquefied air as a function of the liquid fraction N extracted from separator LS1.
Axioms 14 00785 g017
Figure 18. Serpentine-type recuperative heat exchanger—constructive characteristics.
Axioms 14 00785 g018
Figure 19. Pressure drops in the forward and returning stream as a function of the compression pressure.
Axioms 14 00785 g019
Figure 20. The optimal velocity ratio rw and the heat transfer area Af on the forward stream side corresponding to the optimal velocity ratio.
Axioms 14 00785 g020
Disclaimer/Publisher’s Note: The statements, opinions and data contained in all publications are solely those of the individual author(s) and contributor(s) and not of MDPI and/or the editor(s). MDPI and/or the editor(s) disclaim responsibility for any injury to people or property resulting from any ideas, methods, instructions or products referred to in the content.