Abstract
By anchoring the lower rollers and dynamically adjusting the upper roller’s downfeed of a pyramid roll bender, one can achieve the precise bending of a workpiece into a desired planar form characterized by variable curvature. To ensure the seamless processing of individual cross sections without impinging upon adjacent areas, critical roller spacings are identified through theoretical mechanics analyses. The reaction force exerted on the top roller is calculated by integrating the desired curvature into the elastoplastic constitutive equation and subsequently deriving a dynamic adjustment of the downfeed from quasi-static finite element simulations. This preliminary downfeed protocol undergoes refinement to mitigate discrepancies between the targeted and the actual curvatures. Numerical instances demonstrate that the application of roller configurations, as outlined herein, yields a product profile that closely mirrors the intended curve. This congruence can be further improved with an additional iteration; however, subsequent iterations are seen to yield negligible improvements, indicating a rapid convergence of this algorithm.
Keywords:
roll bending; non-uniform curvature; elastoplastic bending; processing design; Euler-Bernoulli beam MSC:
68U07
1. Introduction
The roll bending process represents a prevalent plastic deformation technique whereby metal rods or sheets are contoured to attain a predefined curvature [1]. Traditionally, roller positions remain static throughout the operation, ultimately reaching an equilibrium state over time. Conversely, by dynamically modulating roller positions during the operation, one aspires to govern the resultant radius on a real-time basis. This method facilitates the fabrication of diverse non-circular convex profiles without the requirement for multiple molds, thereby offering considerable appeal.
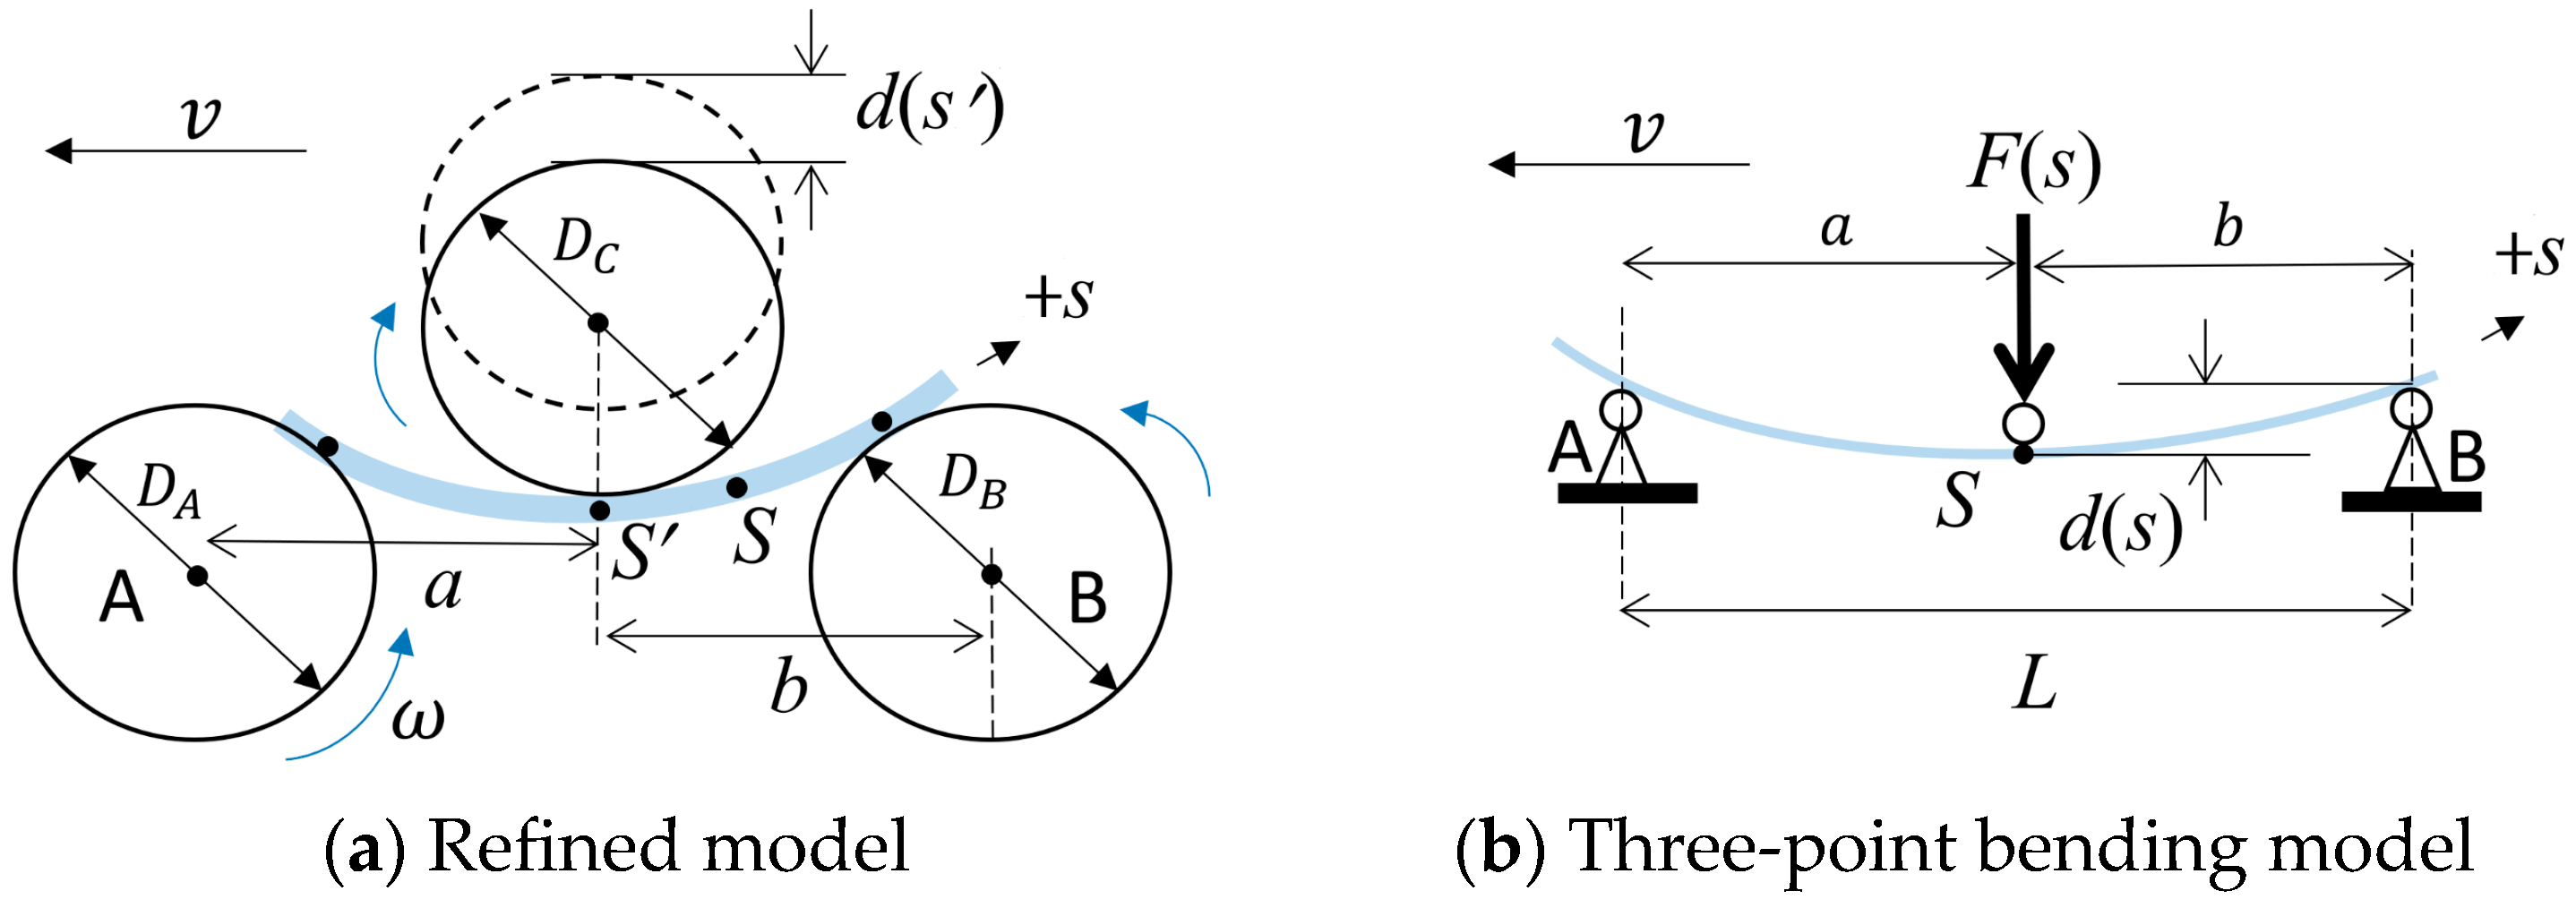
In developing a model to determine the dynamic positioning of rollers for a specified target profile, establishing the correlation between roller positions and the resulting radii is crucial. Numerous reduced-complexity models have been suggested in the literature to ascertain these relationships under steady-state conditions, characterized by unchanging process parameters and constant output curvature radii. Bassett and Johnson [2] pioneered analytical solutions for determining the set-up parameters of three-roll bending by presuming a bilinear distribution of bending moments across the deformation zone. Jannerup and Hansen [3] achieved workpiece deflection by employing a power-law stress–strain relation. Yang and Shima [4] offered predictions for the output curvature of the three-roll bending process through a detailed model, as depicted in Figure 1a. Hua et al. [5] examined the evolution of the plastic band depth, axial stress, and curvature throughout various phases of the multi-pass four-roll bending process, taking into account the shifting of contact points. In contrast, Shin et al.’s three-point bending model [6], illustrated in Figure 1b, omitted the consideration of the contact point shift; their findings corroborate this simplification’s validity for minimal goal curvatures through comparative analyses with finite element simulations. Gandhi and Raval [7] investigated the influence of bottom roller diameters in a symmetrical three-roll bending setting. Expanding upon this, Zhang et al. [8] integrated the role of friction in their study of the pre-bending phase in an asymmetrical three-roll process. Recently, Salem et al. [9] constructed an analytical framework to estimate the requisite forces and power for the pinch-type three-roll bending operation. Wang et al. [10] accounted for shifts in the neutral layer during the four-roll bending process of Z-section profiles. Moreover, the profile and stress distribution of the bending workpiece can also be predicted by some of the latest models [11,12]. Nevertheless, due to the reliance on oversimplified assumptions, analytical models may fall short of capturing the complex deformation behavior of materials throughout the dynamic bending process.
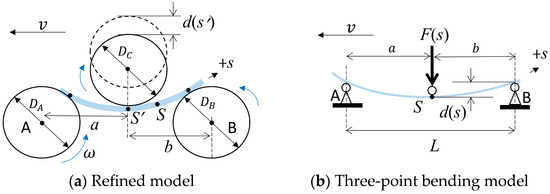
Figure 1.
Three-roll bending models.
Correspondingly, the finite element (FE) simulation, emerging as an efficient and effective tool, has been widely applied to investigate the roll bending process and extract critical information, such as the bending force and curvature of the bending workpiece [1,13,14], stress–strain state [15,16], and roller displacement [17,18]. Particularly, Feng and Champliaud [17] conducted simulations on pinch-type three-roll bending for thin sheets, validating their results against experimental data. Shin et al. [6] evaluated the FE simulations using different elements, recommending the use of plane elements as they are more suitable. Ktari et al. [18] established the relationship between the output radii and rollers’ positions through a series of plane stress simulations. Fu et al. [19] demonstrated a strong concordance between the plane strain simulations and analytical solutions derived from the three-point bending model. Tran et al. [20] examined the evolution of strain on the workpiece surface, with their simulation results corroborating those obtained from strain gauge measurements. Kagzi and Raval [14] developed FE models incorporating 3D solid elements to capture roller deformation during processing. Shim et al. [21] modeled the forming process of thin-walled pipes, proposing a dual-stage forming strategy to mitigate cross-sectional distortion. Kim et al. [22] explored discrepancies between FE solutions and analytical calculations, advocating for the introduction of a calibration factor to refine FE predictions. As the process parameters and desired output curvature become variable, their interrelationship grows increasingly complex, complicating the design of the bending process. Previous studies often simplify this dynamic scenario into a succession of steady-state phases. Chen et al. [23] recommend approximating the smooth target curve with a sequence of circular arcs, each processed as if in constant curvature bending scenarios. Hu et al. [24] explored the roll bending of non-circular Al-Li alloy profiles using FE simulations that adopt the circular arc approximation method. Huang et al. [25] assessed how to manage the transition zones where consecutive arcs converge. In the transition zone, the system is not in a steady state, which would result in a potential deviation of the output radius from the intended curvature [4,14]. Groth et al. [26] observed that the degree of fluctuation within transition zones hinges on the chosen process parameters and introduced an algorithm to articulate the contour of products created by three-roll push bending. They further postulate that the design of target profiles should aim to diminish these curvature fluctuations [27]. Sasaki et al. [28] advanced an analytical framework to ascertain roller positions within transition zones, which was successfully applied to shape a metal wire into eyeglass frames featuring both arcs and linear segments. However, previous endeavors to approximate the desired curve through arc-approaching methods and employing scant circular segments yielded inadequate approximations, while excessive segments led to the unwieldy management of transition zones.
In the present study, we propose a novel method, grounded in the elastoplastic theory, to deduce roller positions for the planar three-roll bending of non-circular profiles. We consider a pyramid-type three-roll bender with fixed bottom rollers and a vertically adjustable top roller. The roller configuration is thus defined by three parameters: the fixed inter-roller distances a and b, along with the time-varying top roller downfeed d, as depicted in Figure 1. We propose a straightforward strategy for determining these parameters. Its fundamental premise is to ensure that throughout the bending process, each material cross section of the workpiece undergoes a monodirectional loading–unloading cycle, with its maximum bending moment aligning with the intended plastic curvature.
The remainder of this paper is organized as follows. Section 2 delineates the parameter design scheme based on the elastoplastic Euler–Bernoulli beam theory and introduces the conditions under which it is aptly applied. Section 3 presents a numerical instance that exemplifies the functionality of the proposed scheme. Section 4 discusses the optimization of the preliminary design. Section 5 summarizes the concluding remarks.
2. Methodology
2.1. Assumptions and Definitions
For the sake of simplicity, several assumptions have been made regarding the three-roll bender and workpiece: (1) the workpiece is initially in the form of a linear, slender rod or a thin sheet composed of uniform material; (2) the curvature at any point along the target profile is smooth and nonzero; (3) the distances between rollers, denoted as a and b, are much greater than both the top roller’s downfeed d and the size of the cross section; (4) the effects of inertia and shear force on the deformation of the workpiece are negligible. Given these premises, the model of a three-point bending Euler beam (illustrated in Figure 1b) is applicable, and the displacement of contact points between the rollers and the workpiece can be disregarded [2,6,7].
The region between the two bottom rollers is referred to as the deformation zone, whose span length is given by . is the material arc coordinate along the centroidal axis of the workpiece, and the positive direction is the opposite of the feed direction (Figure 1). The feed rate is denoted by . denotes the goal curvature of the workpiece at , and and are the reaction force and the downfeed of the top roller when section is right under it, respectively (Figure 1b). represents the bending moment on the section at coordinate s when section is right under the top roller, whose expression can be obtained by a simple statics analysis [2],
In accordance with the elastoplastic Euler beam theory, if a cross section, s, of a beam undergoes a unidirectional bending process, the resultant residual curvature is dictated solely by the maximum bending moment it encounters, i.e., determined by . Therefore, to make the workpiece obtain its goal curvature , it is sufficient to ensure that section experiences the “right” maximum loading in the roll bending process, i.e.,
where the bending moment–plastic curvature relation is determined by the constitutive law.
The challenge now is to ascertain the positioning of the rollers, given the goal curvature and the material’s constitutive relation , in such a way that Equation (2) is fulfilled for any conceivable coordinate s.
2.2. Critical Roller Distances
A reasonable hypothesis posits that a section s undergoes its maximum bending moment when directly beneath the top roller. If this is the case, then Equation (2) can be satisfied by simply setting , i.e., letting the force exerted on the top roller be
We now demonstrate the validity of this conjecture on the condition that the distances between the top roller and the bottom rollers fulfill the inequality:
Theorem 1.
Each section undergoes its maximum bending moment exclusively when positioned directly beneath the top roller provided that the distances between the rollers conform to Equation (4).
When substituting Equation (3) into Equation (4), . According to the definition of , . Thus, in order to prove Equation (2), we only need to show that . In fact, for a given section , any arc length coordinate falls into one of the following three categories:
Case 1: . In this case, the partial derivative of Equation (1) leads to
Note that in the roll bending process, is always positive. If , obviously, Equation (5) is greater than zero; otherwise, , and by amplification and minification, one obtains
where the second inequality is a direct deduction of Equation (4). In either condition, . In other words, increases monotonically with increasing , and thus, in this case.
Case 2: . An argument analogous to the previous case leads to
It implies that decreases with increasing and thus, .
Case 3: . By definition, through Equation (1), .
In summary, regardless of the category that is classified into, the relationship of consistently holds. This affirms that our design will fulfill Equation (2) for any cross section s.
In addition, Equation (4) suggests that the distances between the top roller and the bottom rollers should not be excessively large. In fact, this stipulation is also necessary to prevent interference during the processing of neighboring cross sections with distinct target curvatures. While the proof of the necessity is straightforward, it is not included here. Thus, Equation (4) essentially establishes a critical upper boundary for the roller distances a and b to ensure the workpiece can be shaped into the desired form. Beyond Equation (4), factors such as the process efficiency, the practical parameter limits of the bender, and the applicability of the small deflection assumption should also be taken into account before definitively determining the roller distances for practical applications.
2.3. Roller Position Design
In practice, the downfeed d is favored over the downward force F applied by the top roller as the operational parameter due to its more precise controllability. Therefore, we should convert the top roller force design to the downfeed design . This conversion can be achieved by solving an elastoplastic bending problem. According to a previous discussion, when section touches the top roller, the plastic curvature of a preceding section ( is the goal curvature , but a succeeding section is still in the loading phase, and its current plastic curvature is given by the inverse function of the constitutive law, i.e., . Thus, at the moment when section touches the top roller, the total curvature of the sections in the span is given by,
where is the elastic bending stiffness. In a small deflection condition, is equal to approximately twice the derivative of the deflection, i.e.,
Subsequently, the deflection at the top roller is obtained through two integrals of Equation (9). By resolving this equation for each potential section s, the time-varying downfeed design d(s) can be established.
Nonetheless, it has been observed in practice that the downfeed derived through this method does not perform satisfactorily, as will be illustrated subsequently. One contributing factor is that the integration procedure is highly sensitive to the span length L, and the accuracy is compromised due to the neglect of the contact point shifts. Additionally, the Euler beam model disregards out-of-plane stress, which diverges from reality since the rollers often clamp the workpiece to inhibit lateral movement or warping.
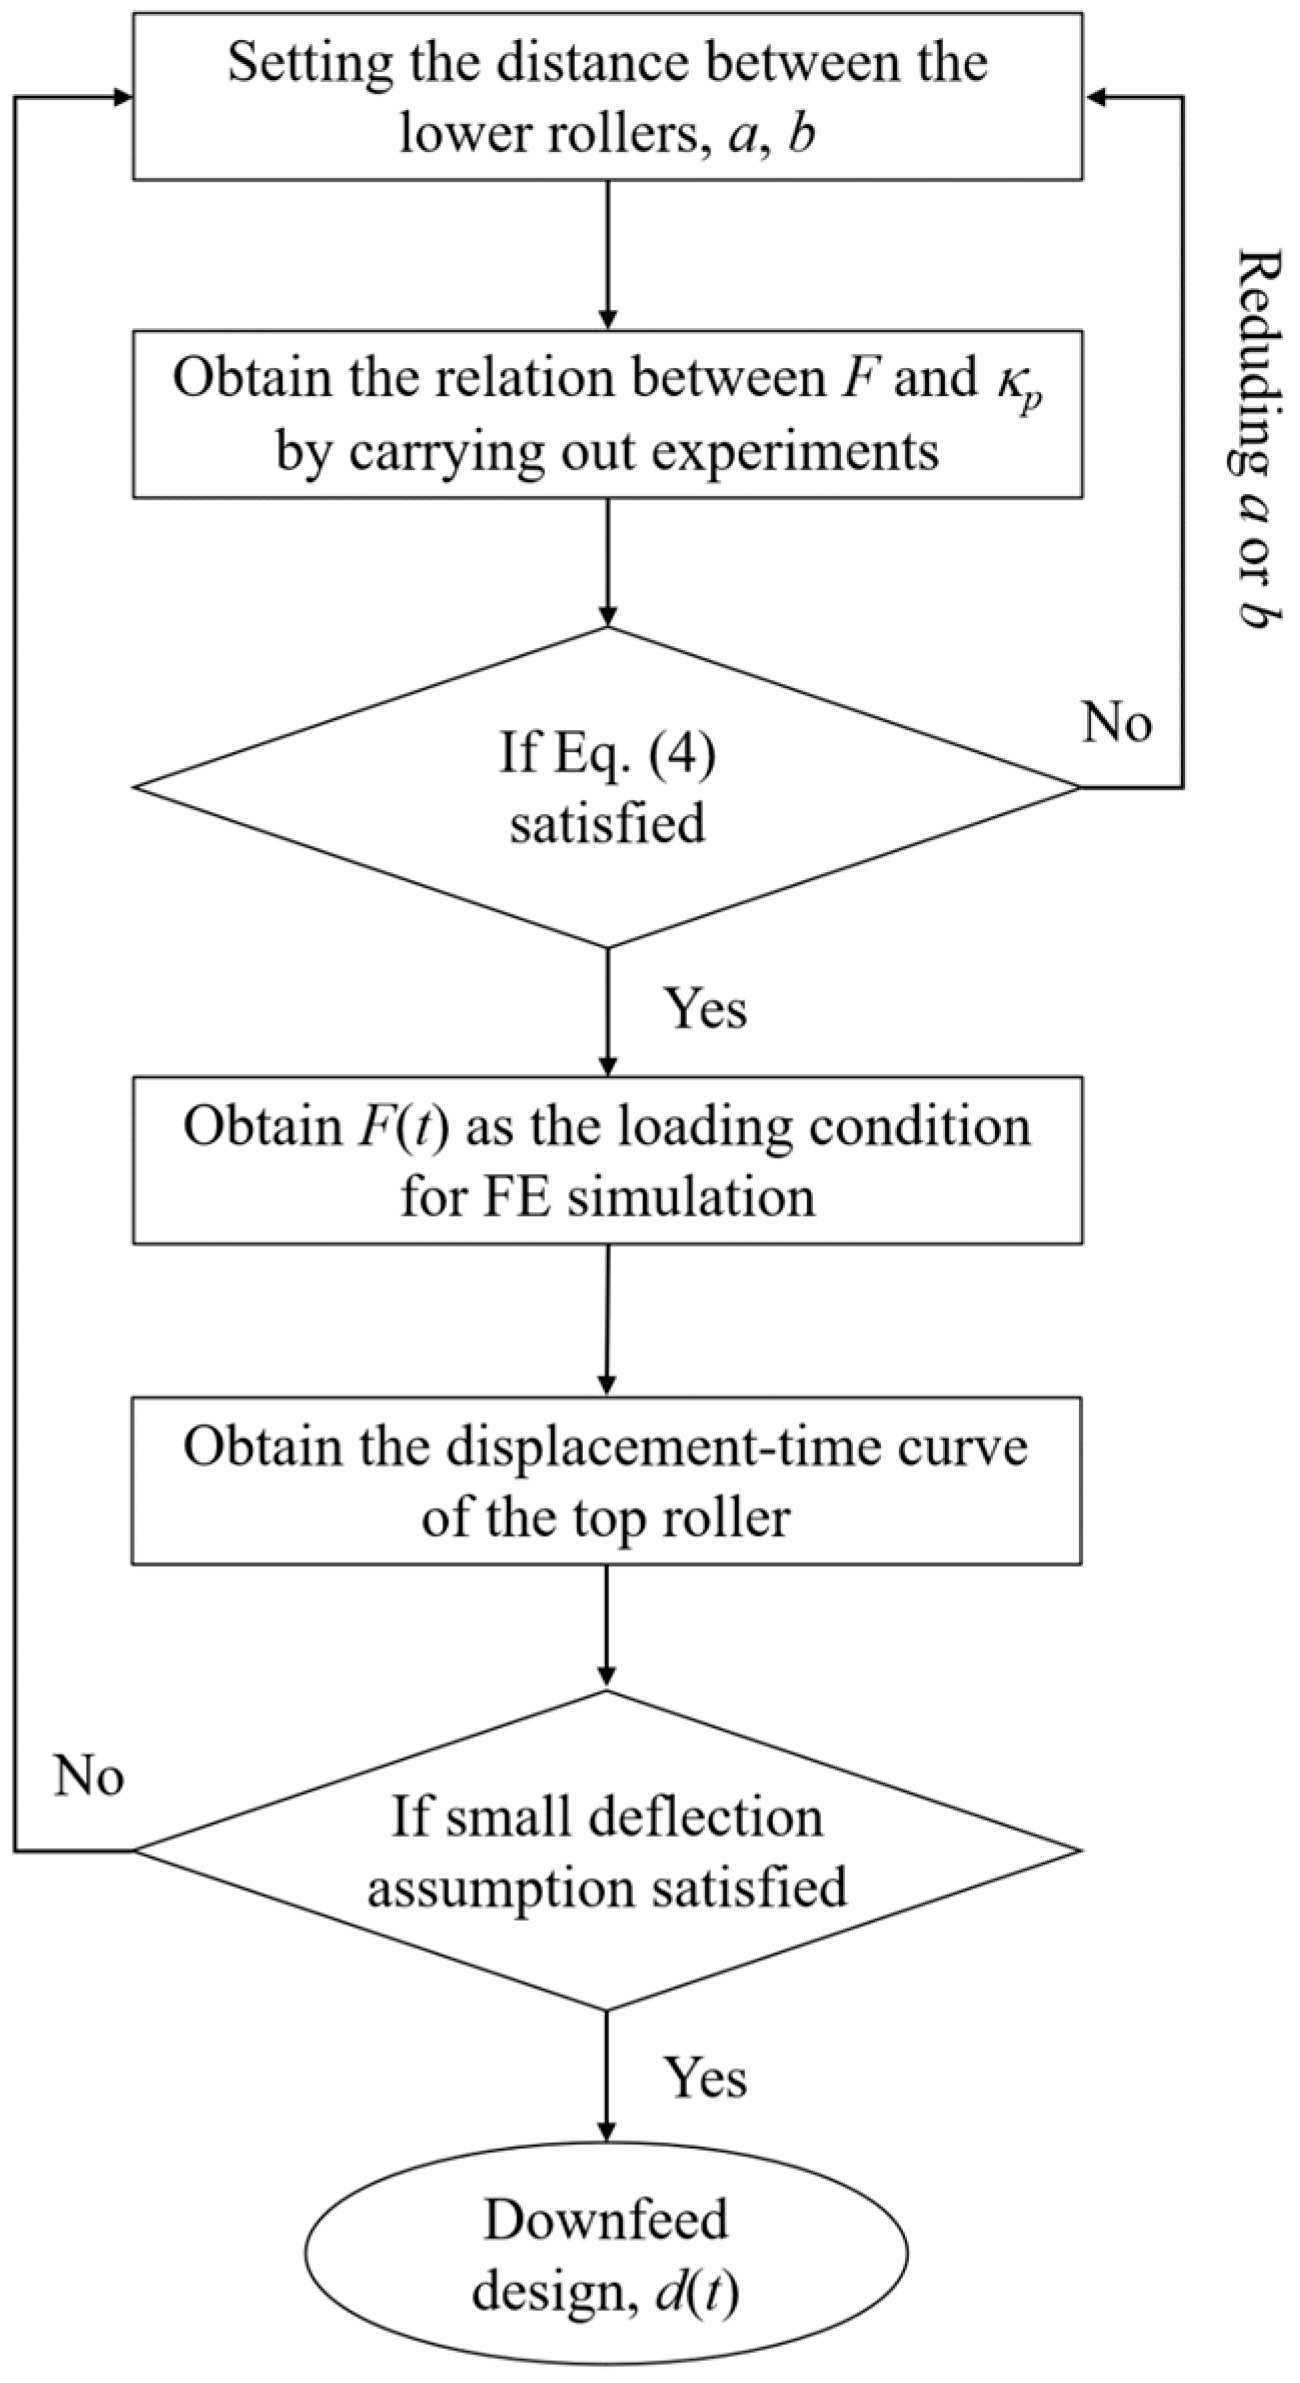
To incorporate these effects without resorting to a more complex model, we make a slight modification to the constitutive law. Subsequently, a finite element (FE) simulation is used to determine d(s) once F(s) has been established. The detailed workflow, as shown in the Figure 2 flowchart of the downfeed design, is described as follows:
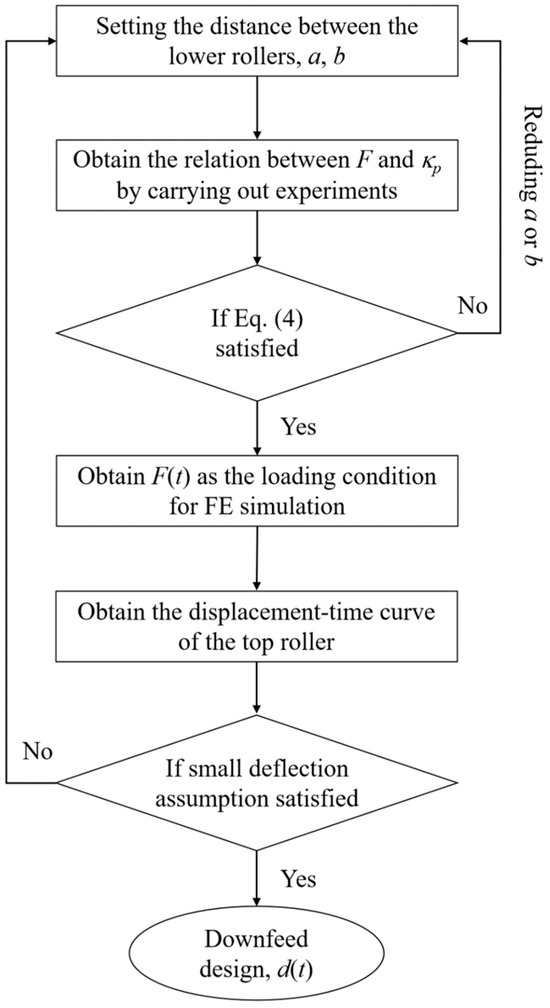
Figure 2.
The flowchart of the downfeed design.
First, select the rollers’ diameters and distances that might be suitable.
Then, conduct constant-load roll bending experiments with the selected bender parameters. Find out the relation between the steady-state output curvature and the top roller’s reaction force . Modify the bending constitutive law by replacing the true bending moment with a nominal one, whose definition is .
Next, let the top roller force be given by Equation (3) and check if Equation (4) is satisfied. If not, go back to the first step and reduce the roller distances; otherwise, the force is expressed as a function of time by replacing the arc length with , where is the feed rate, is the time, and is the time when section meets the top roller.
Finally, conduct a quasi-static FE simulation with the previously obtained force as the loading condition. The resulting displacement–time curve of the top roller is the downfeed design d(t) that we seek. Its maximum value should be examined to ascertain the validity of the small deflection assumption.
By employing this workflow, the influence of contact point shifts and out-of-plane stress is incorporated in an implicit manner.
3. Numerical Examples
To illustrate the efficacy of our roller position design scheme, we examine two goal curves to which the workpieces must conform. The first is a semi-elliptical shape with semi-axes measuring 3 m and 2 m in length, respectively. Its equation is
The second is a segment of an Archimedean spiral:
where is the polar radius.
For simplicity, in both cases, the workpiece parameters are identical. The cross section is square with the size of . The material is elastic–perfectly plastic, with a Young’s modulus of , a Poisson’s ratio of , and a yield strength of . The roller distances of the three-roll bender are , and the diameters of the rollers are . As shown in the workflow (Figure 2), we will first establish the relation between the top roller force and the output curvature through steady-state numerical experiments.
3.1. Steady-State Roll Bending Tests
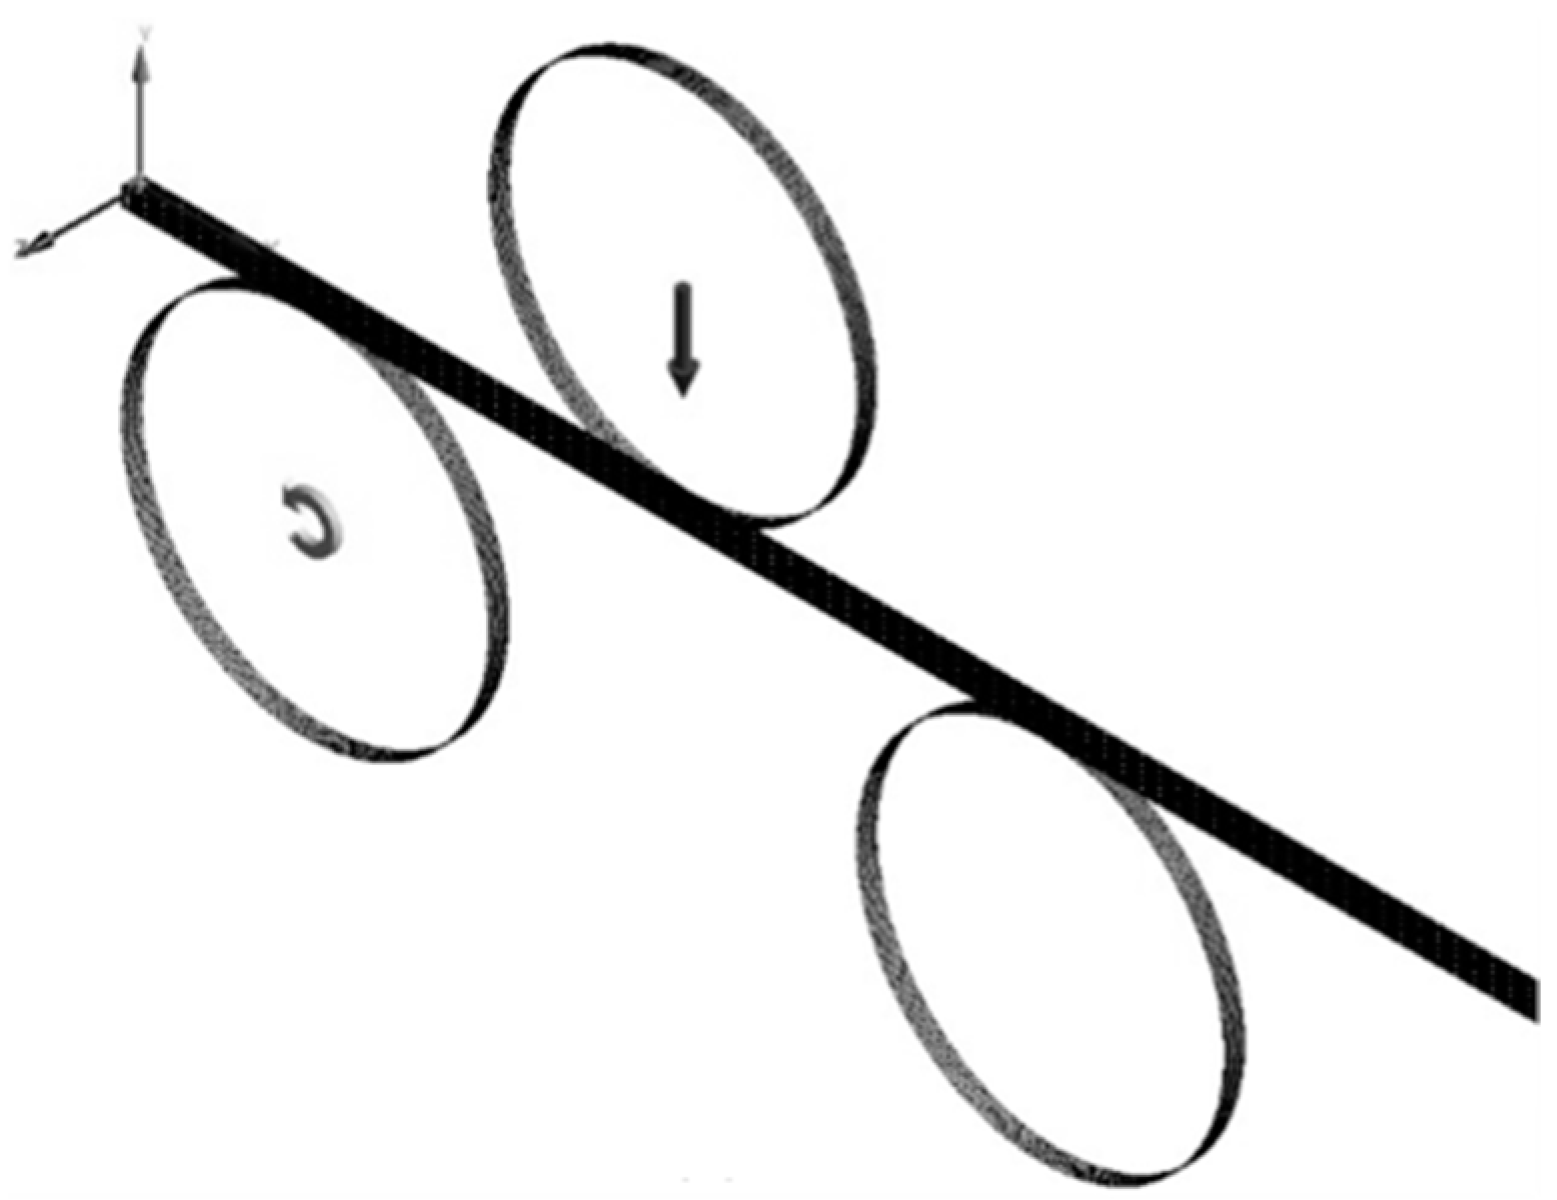
Initially, the modified constitutive relation between the bending moment and plastic curvature, denoted as , should be established by the numerical simulations of constant-load roll bending. To that end, a corresponding FE model is built in ANSYS Workbench 18.0, as shown in Figure 3. The workpiece is meshed using SHELL181 elements with 10 integral points through thickness, while the rollers are models as rigid cylindrical shells. The mesh size is about 1 mm. To simulate the interaction between the workpiece and rollers, surface-to-surface contact pairs are established, assuming a frictional coefficient of 0.2. The contacts are treated by the augmented Lagrangian method, with the consideration of the workpiece thickness. The bending process consists of two phases: in the static bending phase, the force applied on the top roller gradually rises up to a constant value (Figure 4a); in the subsequent dynamic bending phase, the left roller starts to rotate at a constant angular velocity of , pulling the workpiece towards the left. The simulation ends once the downward displacement of the roller stabilizes and ceases to change. To avoid the influence of transition fluctuations, the initial segment of the output is subsequently disregarded (Figure 4a). A circle arc is then fitted to the remaining portion of the output segment to determine the resultant curvature (Figure 4b). By conducting tests with varied forces applied by the top roller, we derive the nominal constitutive relationship , which can be very closely approximated by a quartic polynomial (Figure 4c). The actual bending moment, as measured in ANSYS, is also presented in Figure 4c. It is observable that the actual bending moment is considerably lower than the nominal one, since the latter incorporates the effects of contact point shifts.
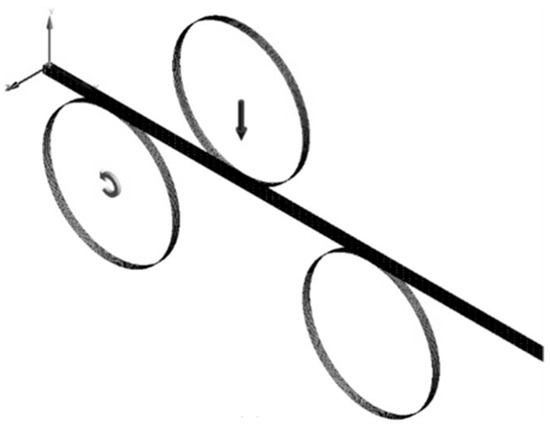
Figure 3.
Three-roll bending model in ANSYS 18.0.

Figure 4.
The results of the constant-force roll bending experiments. (a) Load and response curve (F = 570 N). (b) Circle fits to output segments. (c) Bending moment vs. output curvature.
3.2. Downfeed Design for Case 1
The local curvature of the target semi-elliptical shape can be determined by differentiating the Equation (3), as shown in Figure 5a. Figure 5a shows the required peak bending moments of cross sections along the curve which are determined by substituting the desired local curvature into the modified relation. The top roller force is defined by Equation (3), and then its relative change rate is calculated with respect to the arc length (), as shown in Figure 5b. It is evident that Equation (4) is satisfied, thereby fulfilling the prerequisite of the proposed design scheme.

Figure 5.
The diagrams used in the downfeed design for Case 1. (a) The desired curvature and corresponding bending moment vs. the arc length. (b) The relative force change vs. the arc length. (c) The designed force/downfeed vs. time.
The time-varying load, derived by substituting into , is shown in Figure 5c. An initial cut-off time of is set to avoid the influence of transition fluctuations at the beginning of the process. A quasi-static FE simulation is performed using the designed top-roller force as the load. The model and mesh remain consistent with those used in the previous steady-state tests. Finally, the downfeed–time curve of the top roller is obtained from the simulation, as presented in Figure 5c. It is worth noting that throughout the entire roll bending process, the maximum deflection in the span remains smaller than 12 mm, i.e., 3% of the span length, thereby validating the applicability of the small deflection assumption employed.
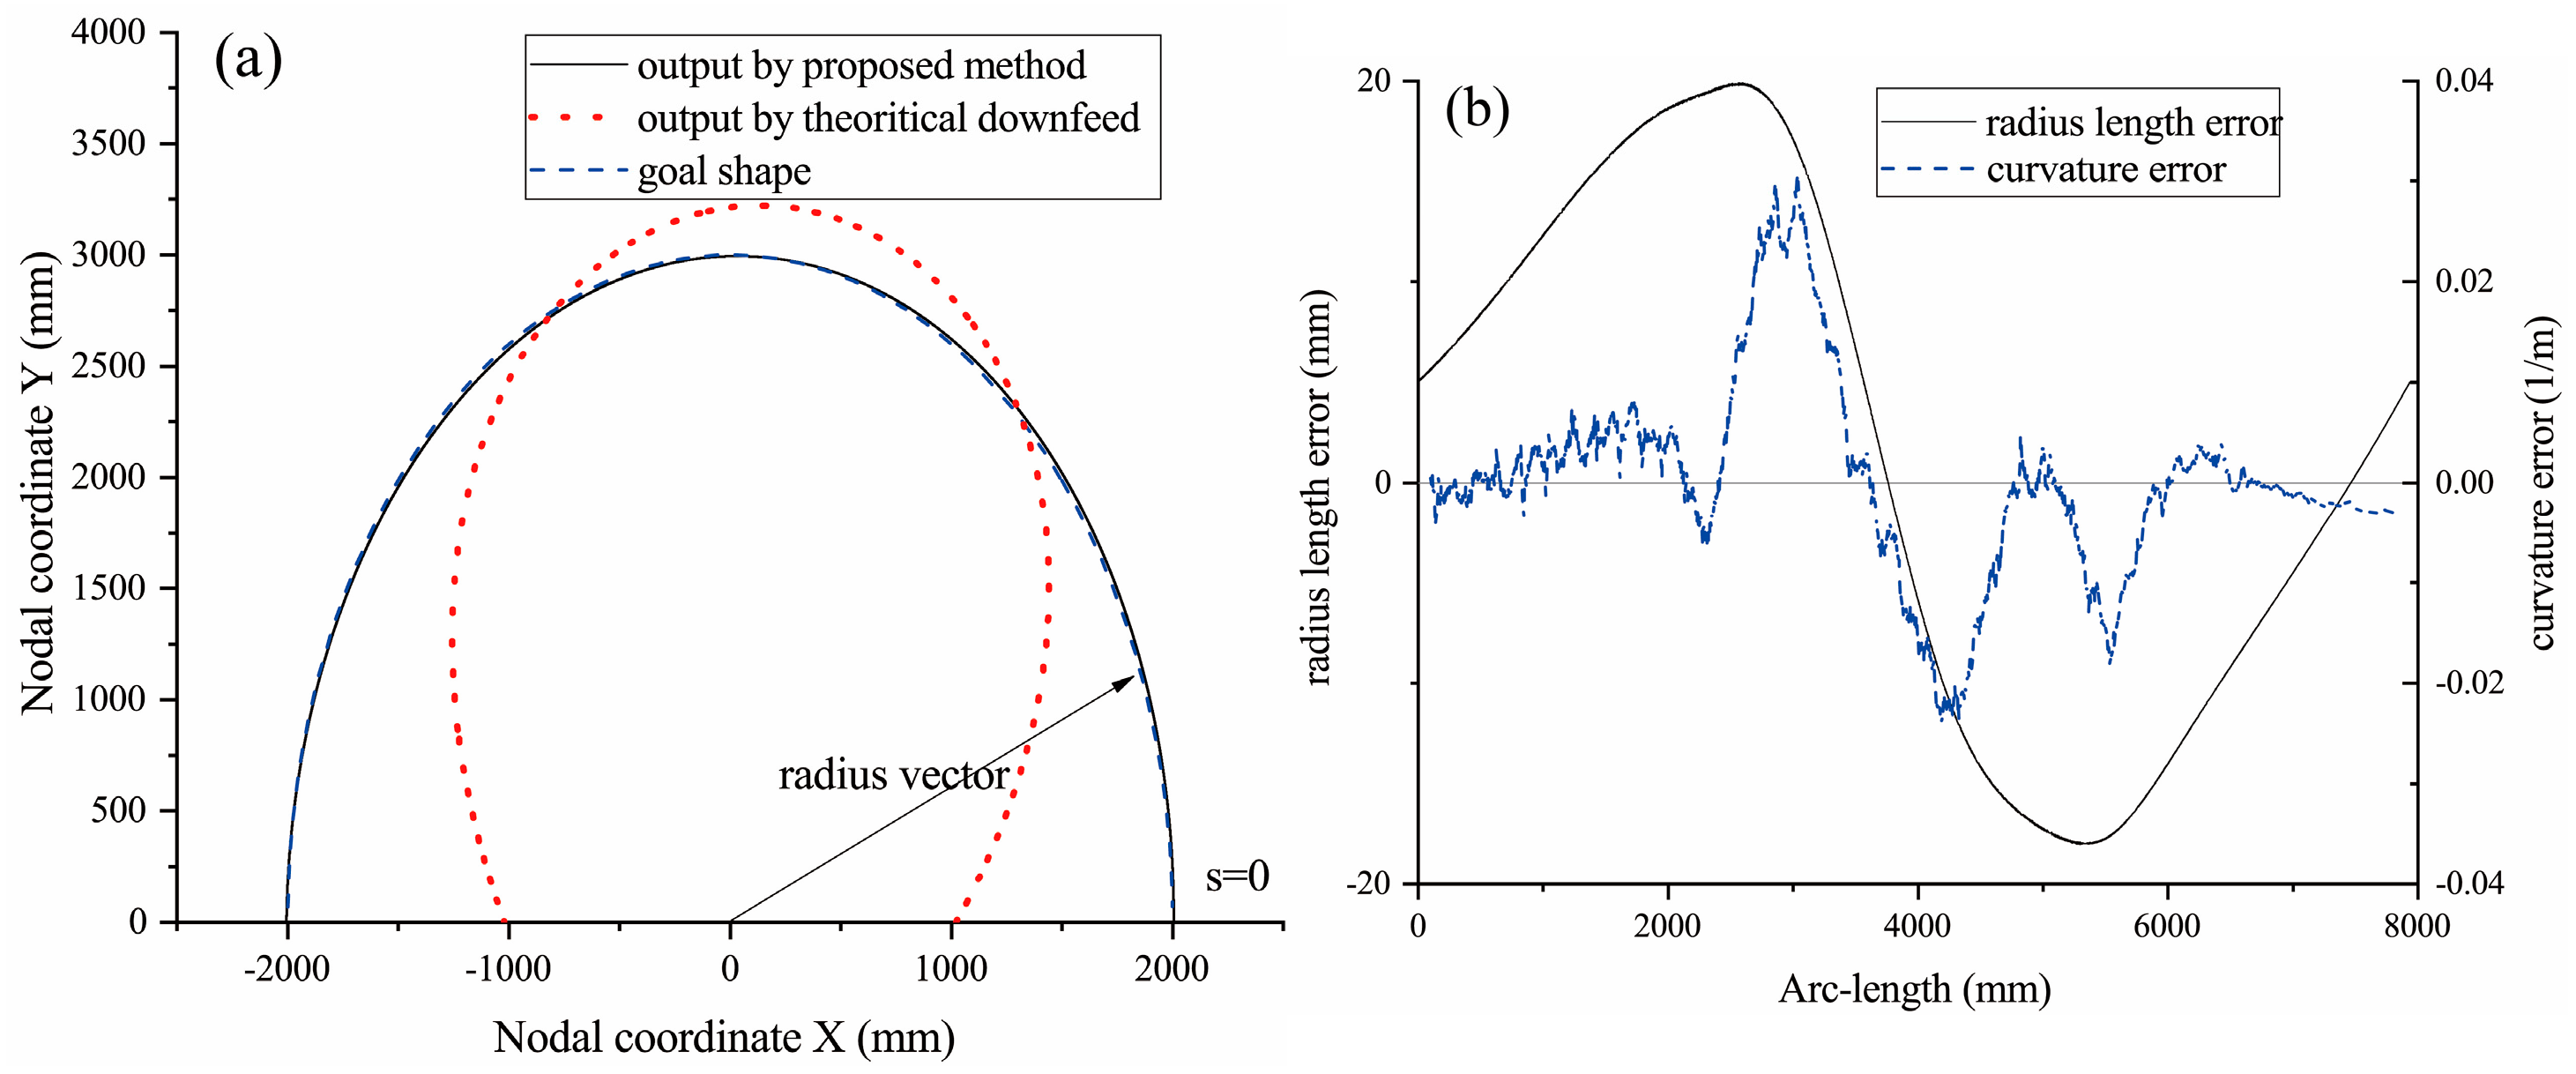
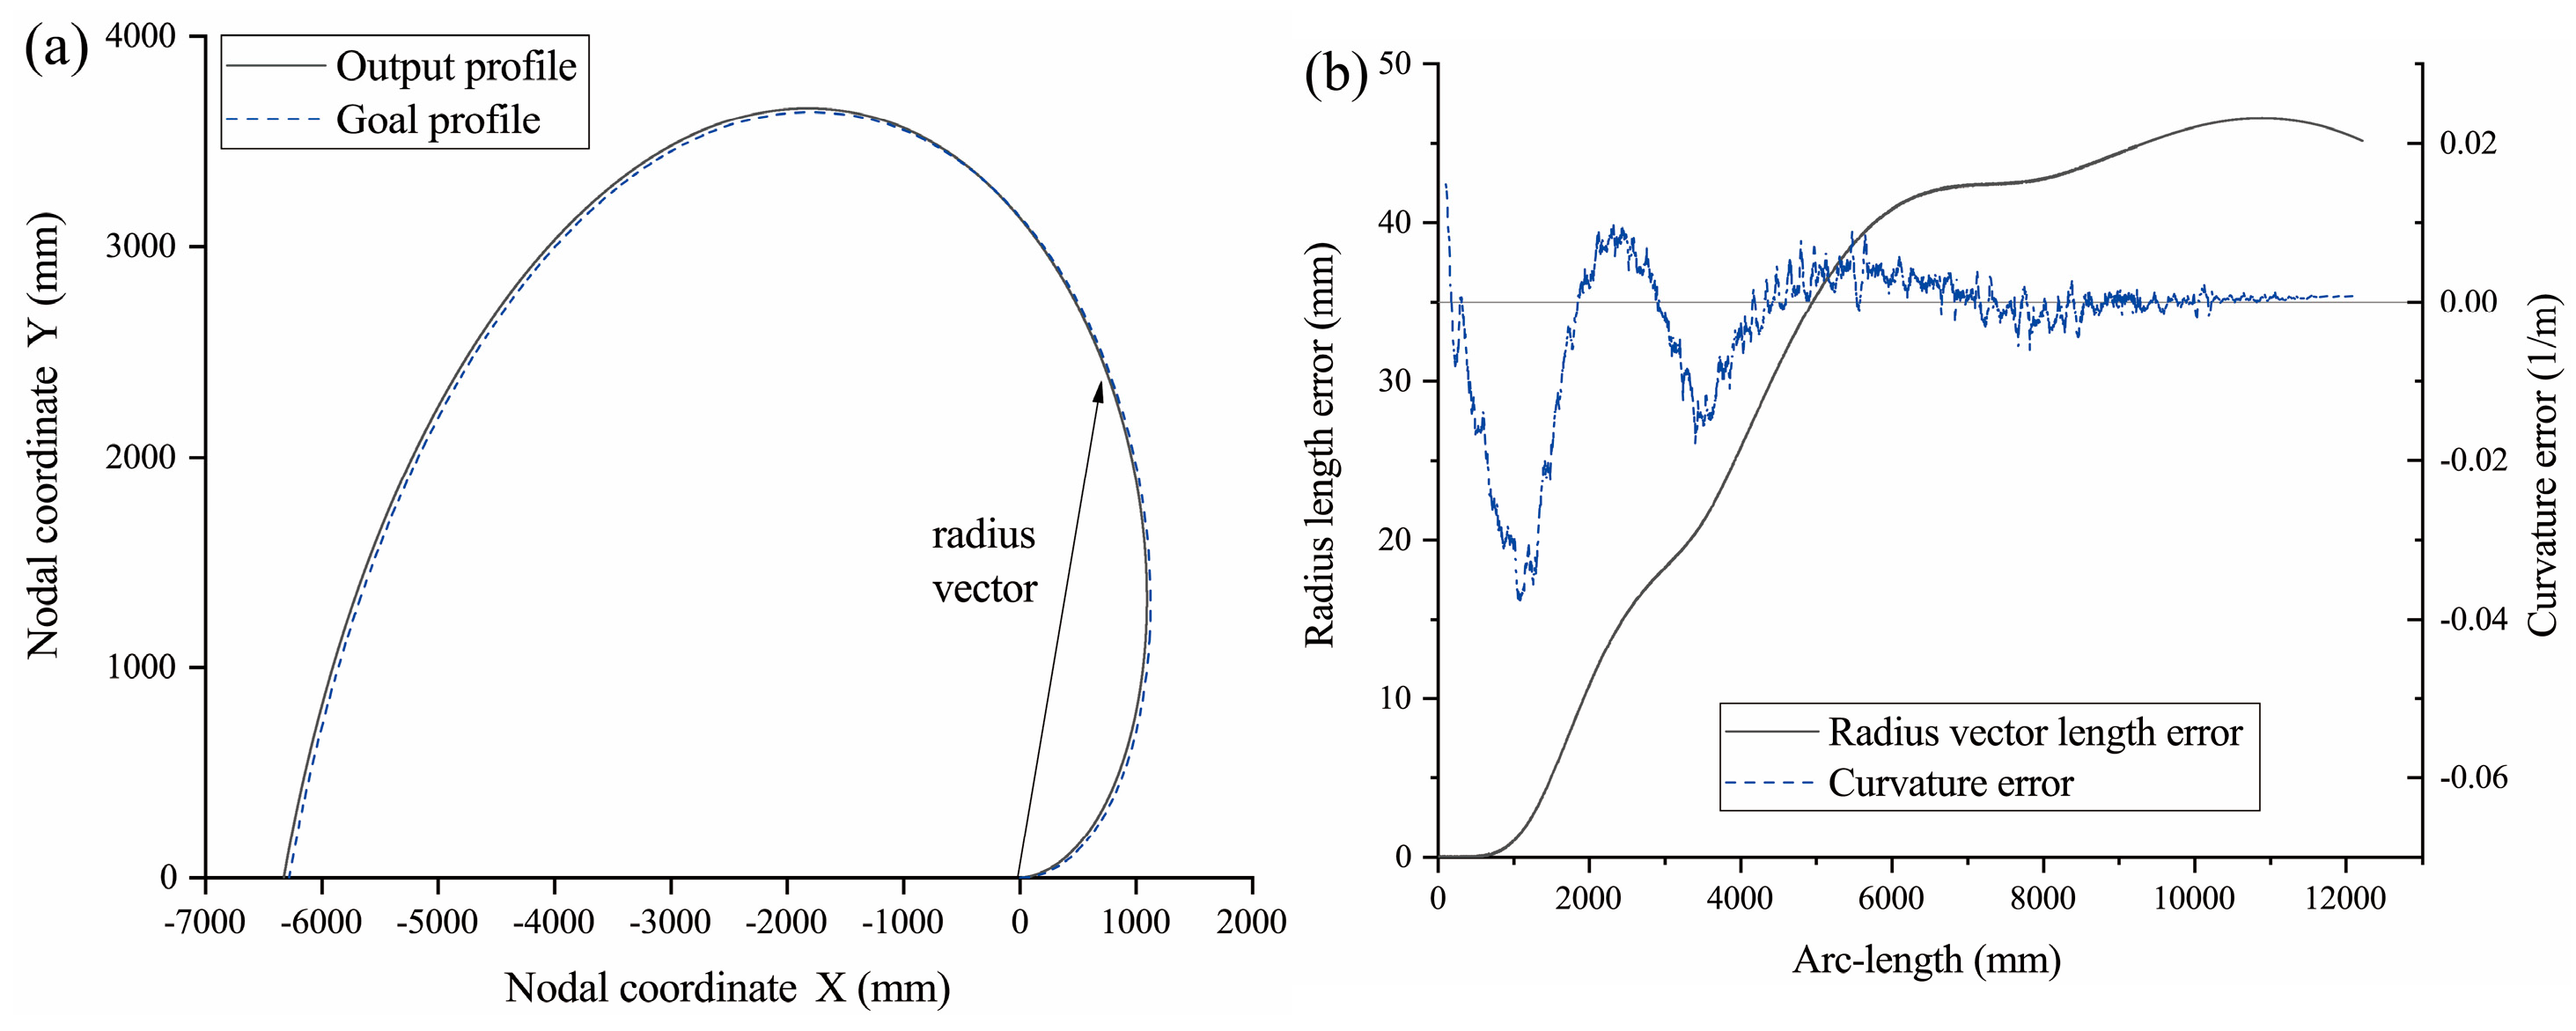
The centroidal axis of the output workpiece is compared with the goal profile, as shown in Figure 6a, where the two ends of the output workpiece are aligned along the X-axis and symmetrically positioned with respect to the Y-axis. It is evident that the output centroidal axis closely matches the goal curve.
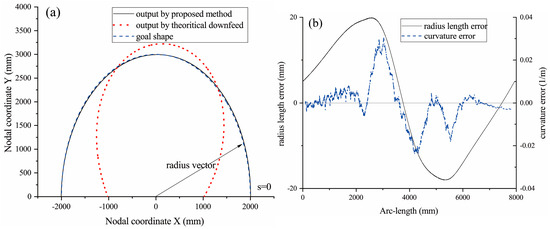
Figure 6.
Simulation results obtained by employing designed downfeed for Case 1. (a) Centroidal axis of output segment. (b) Absolute errors of radius vector length and curvature.
The macro difference between the output and goal shapes can be quantified by measuring the error of the polar radius length from the origin to the corresponding points on the two curves (as indicated by the arrow in Figure 6a). It is observed that the maximum difference is smaller than 20 mm, approximately 1% of the radius vector length. To assess the local error, the resultant curvature of any section is calculated by fitting a circle to its neighborhood (, ) and then comparing it with the goal curvature obtained in the same manner. The maximum error is approximately 0.03/m, nearly 7% of the desired curvature, as shown in Figure 6b. These errors are reasonably small, indicating that the proposed roller positions lead to the expected output.
For comparison, another top roller downfeed design, obtained by integrating Equation (9) twice, is also presented in Figure 5c. This integrated downfeed is notably greater than the downfeed determined using the FE simulation. Consequently, the shape of the output workpiece achieved using the integrated downfeed deviates significantly from the desired one, as illustrated in Figure 6a. Hence, the proposed scheme is clearly more preferable.
3.3. Downfeed Design for Case 2
The workflow is the same as in Case 1. The goal curvature can be derived from the Equation (4). The diagrams used in the design procedure are shown in Figure 7, and it is apparent that Equation (4) is also satisfied. The displacement obtained using the FE simulation exhibits significant fluctuations at the beginning of the roll bending process, which then smoothens out after (Figure 7c). This fluctuation is the reason for setting up a cut-off time . Clearly, a highly fluctuating downfeed design is not practical for industrial applications. Since the initial part of the workpiece will be discarded, the downfeed curve before is typically flattened in practice (Figure 7c).

Figure 7.
Diagrams used in downfeed design for Case 2. (a) Desired curvature and corresponding bending moment vs. arc length. (b) Relative force change vs. arc length. (c) Designed force/downfeed vs. time.
Another simulation is then conducted using the flattened downfeed curve as the prescribed displacement of the top roller. The centroidal axis of the output segment is compared against the goal curve in Figure 8a. The start point of the segment is positioned at the origin in Figure 8a, and the end point lies on the X-axis. Generally, the output centroidal axis aligns well with the goal curve. The span length along the X-axis is 6328 mm, slightly greater than the designed length of 6283 mm.
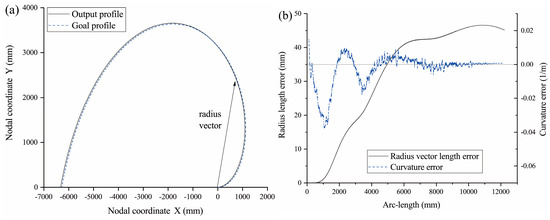
Figure 8.
Simulation results obtained by employing designed downfeed for Case 2. (a) Centroidal axis of output segment. (b) Absolute errors of radius vector length and curvature.
The radius length error and curvature error are evaluated in the same manner as in Case 1, as shown in Figure 8b. The radius length error increases with the arc length, with a maximum of about 45 mm, i.e., less than 1% of the radius. The maximum curvature error is approximately 0.04/m, which is 5% smaller than the designed value. Generally speaking, the preliminary downfeed design is deemed acceptable.
4. Further Improvement
The numerical examples demonstrate that the proposed design scheme can yield reasonably good results on the first attempt. To further enhance the output workpiece quality, the time-varying downfeed can be further refined based on the preliminary design. One simple approach to reduce error is to compensate for the difference between the output and goal curvatures. This involves increasing the load on the top roller where the output curvature is too small and reducing the force where it is too large. The adjustment amount can be determined by utilizing the relation obtained in Figure 4c:
This updating process can be conducted iteratively until no further improvement is achieved.
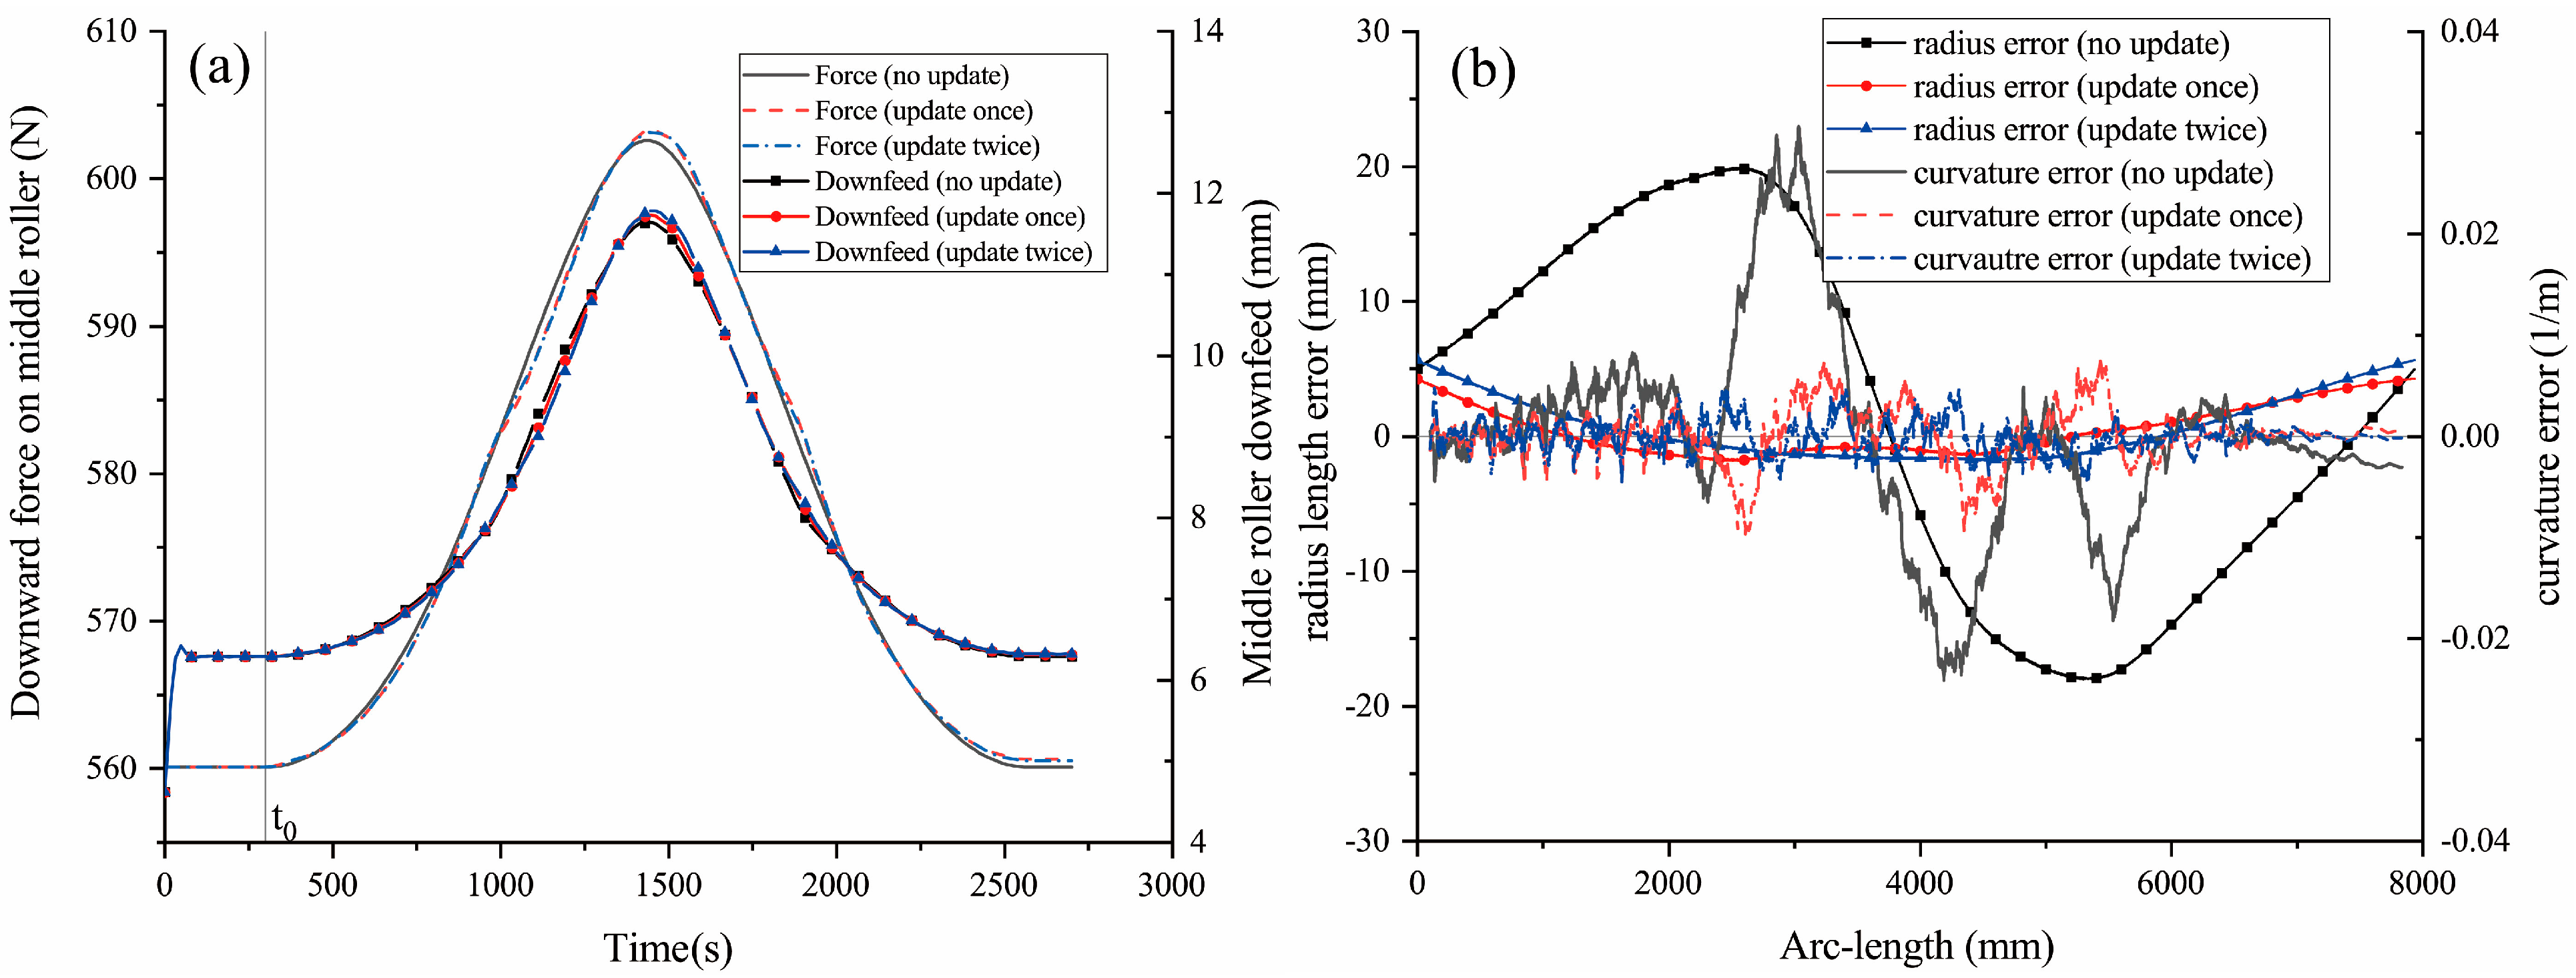
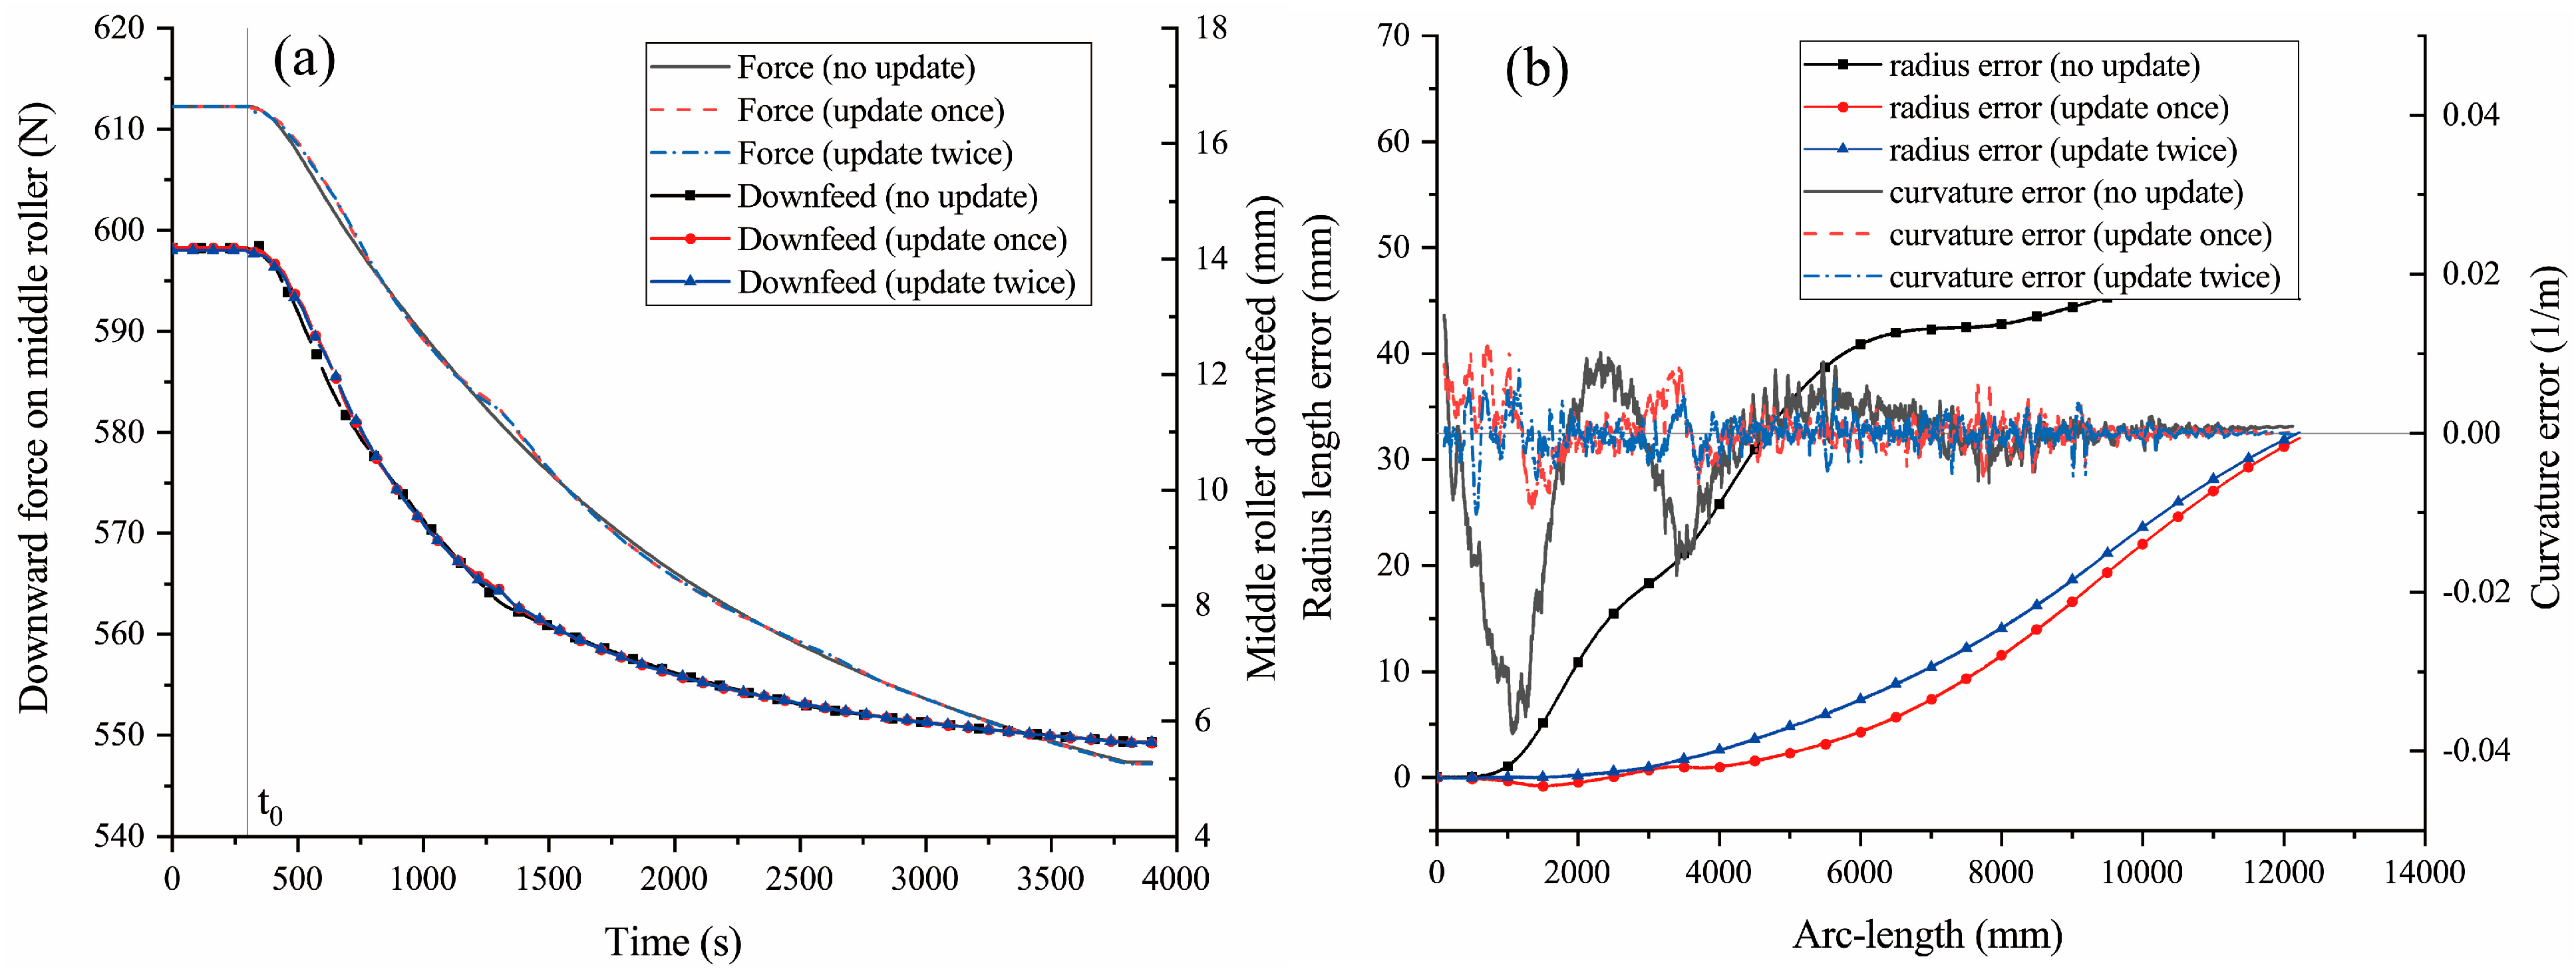
The updated force and displacement design for the first case are presented in Figure 9a. A comparison reveals slight differences between the designs before and after updating. Following the initial update, the maximum error of the radius vector length decreases from 20 mm to 5 mm, while the maximum error of curvature decreases from 0.03/m to 0.01/m, as shown in Figure 9b. However, the second iteration shows limited improvement. Although the maximum curvature error is further reduced by half, the radius length error increases. Given that the local curvature error has been fluctuating evenly around zero, additional iterations are omitted to prevent the displacement curve from becoming excessively fluctuated and overdesigned. Thus, iterating only once is deemed sufficient for our case. A similar conclusion can be drawn for the update of Case 2, as demonstrated in Figure 10.
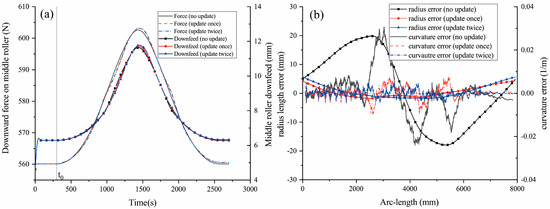
Figure 9.
Update of Case 1. (a) Designed force and downfeed updates. (b) Radius vector length and local curvature errors.
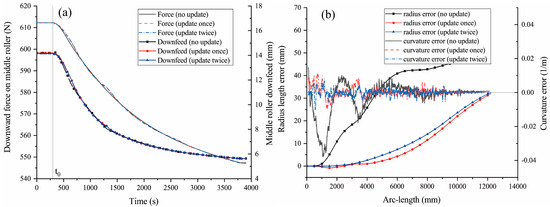
Figure 10.
Update of Case 2. (a) Designed force and downfeed updates. (b) Radius vector length and local curvature errors.
5. Conclusions
Many studies have been conducted on the design of roll bending process parameters over the past few decades. These studies have introduced sophisticated models, and the solutions obtained have closely matched the experimental results. However, it is worth noting that in these studies, typically only the steady-state phase of the process was considered.
Ideally, the roll bending process can be adapted for non-circular profiles by dynamically adjusting the roller positions. However, designing the parameters becomes significantly more challenging due to their time-varying nature. In this study, we aimed to tackle this issue by initially developing our approach based on a simplified model, specifically a three-point Euler beam model. The proposed approach can also be applied to more sophisticated models, such as those used in the study of steady-state bending, although this may require more time and effort.
In the unidirectional bending of an elastoplastic Euler beam, the output curvature of a cross section is primarily determined by the maximum bending moment it experiences. Thus, it is sufficient to ensure that each section experiences the correct maximum bending moment. However, a section’s maximum bending moment depends on its loading history, which can be influenced by the processing of neighboring sections. In this study, we demonstrated that such interference does not occur if the roller distances are small enough, satisfying Equation (4). Consequently, the final curvature of any cross section is determined by the downward force exerted on it by the top roller. The time-varying force boundary condition derived in this manner is then transformed into an essential displacement boundary condition by using FE simulation. The displacement design can be further refined by compensating for the error between the resultant and the desired local curvatures.
Numerical examples are provided to demonstrate and evaluate the design method. The output segments are observed to closely match the goal profiles from the initial attempt. A single update substantially improves the results. However, further iterations would lead to the load curve becoming too fluctuating for practical implementation, offering only marginal improvements in our specific cases.
Author Contributions
Conceptualization, Z.Z. (Zijun Zheng); Methodology, Z.Z. (Zijun Zheng); Validation, J.S. and C.L.; Formal analysis, C.L.; Investigation, Z.Z. (Zijun Zheng), J.S., Z.Z. (Ziying Zhang) and C.L.; Writing—original draft, Z.Z. (Zijun Zheng); Writing—review & editing, J.S. and Z.Z. (Ziying Zhang); Supervision, Z.Z. (Zijun Zheng) and Z.Z. (Ziying Zhang); Funding acquisition, Z.Z. (Zijun Zheng) and Z.Z. (Ziying Zhang). All authors have read and agreed to the published version of the manuscript.
Funding
This work was primarily supported by the National Natural Science Foundation of China (grant numbers 12402294) and additionally supported by the Science and Technology Research Program of Chongqing Municipal Education Commission (Grant Nos. KJQN202101117 and KJQN202301130) and the Natural Science Foundation of Chongqing (Grant No. cstc2021jcyj-msxmX0010).
Data Availability Statement
The original contributions presented in the study are included in the article, further inquiries can be directed to the corresponding author.
Conflicts of Interest
The authors declare no conflict of interest.
References
- Wang, Y.; Zhao, L.; Cui, X.; Zhu, X. Research on numerical simulation and process parameters of three-roll bending based on thickness characteristics of extra-thick plate. Adv. Mech. Eng. 2019, 11, 1687814019847861. [Google Scholar] [CrossRef]
- Bassett, M.; Johnson, W. The bending of plate using a three-roll pyramid type plate bending machine. J. Strain Anal. Eng. Des. 1966, 1, 398–414. [Google Scholar] [CrossRef]
- Jannerup, O.; Hansen, N. Modelling of Elastic-Plastic Bending of Beams Using a Roller Bending Machine. J. Eng. Ind. 1979, 101, 304–310. [Google Scholar] [CrossRef]
- Yang, M.; Shima, S. Simulation of pyramid type three-roll bending process. Int. J. Mech. Sci. 1988, 30, 877–886. [Google Scholar] [CrossRef]
- Hua, M.; Lin, Y. Large deflection analysis of elastoplastic plate in steady continuous four-roll bending process. Int. J. Mech. Sci. 1999, 41, 1461–1483. [Google Scholar] [CrossRef]
- Shin, J.; Lee, J.; Kim, Y.; Yim, H. Mechanics-based determination of the center roller displacement in three-roll bending for smoothly curved rectangular plates. KSME Int. J. 2001, 15, 1655–1663. [Google Scholar] [CrossRef]
- Gandhi, A.H.; Raval, H.K. Analytical and empirical modeling of top roller position for three-roller cylindrical bending of plates and its experimental verification. J. Mater. Process. Technol. 2008, 197, 268–278. [Google Scholar] [CrossRef]
- Zhang, Z.-Q.; Song, J.-L.; Fu, J.-H.; Li, Y.-T.; Guo, Y.-N. A Refined Model of Three-roller Elastoplastic Asymmetrical Pre-bending of Plate. J. Iron Steel Res. Int. 2014, 21, 328–334. [Google Scholar] [CrossRef]
- Salem, J.; Champliaud, H.; Feng, Z.; Dao, T.-M. Experimental analysis of an asymmetrical three-roll bending process. Int. J. Adv. Manuf. Technol. 2016, 83, 1823–1833. [Google Scholar] [CrossRef]
- Wang, A.; Xue, H.; Saud, S.; Yang, Y.; Wei, Y. Improvement of springback prediction accuracy for Z-section profiles in four-roll bending process considering neutral layer shift. J. Manuf. Process. 2019, 48, 218–227. [Google Scholar] [CrossRef]
- Wei, Z.; Wu, C. A new analytical model to predict the profile and stress distribution of tube in three-roll continuous retained mandrel rolling. J. Mater. Process. Technol. 2022, 302, 117491. [Google Scholar] [CrossRef]
- Jing, Y.; Kong, D.; Sun, Q.; Zhao, Y.; Meng, X.; Song, Z. Analysis of the roll bending process of profile. J. Braz. Soc. Mech. Sci. Eng. 2023, 45, 373. [Google Scholar] [CrossRef]
- Gavrilescu, I.; Boazu, D.; Stan, F. Estimating of Bending Force and Curvature of the Bending Plate in a Three-Roller Bending System Using Finite Element Simulation and Analytical Modeling. Materials 2021, 14, 1204. [Google Scholar] [CrossRef] [PubMed]
- Kagzi, S.; Raval, H. An analysis of forces during three roller bending process. Int. J. Mater. Prod. Technol. 2015, 51, 248–263. [Google Scholar] [CrossRef]
- Huang, X.; Yu, G.; Zhao, J.; Mu, Z.; Zhang, Z.; Ma, R. Numerical simulation and experimental investigations on a three-roller setting round process for thin-walled pipes. Int. J. Adv. Manuf. Technol. 2020, 107, 355–369. [Google Scholar] [CrossRef]
- Neto, D.M.; Martins, J.M.P.; Oliveira, M.C.; Menezes, L.F.; Alves, J.L. Evaluation of strain and stress states in the single point incremental forming process. Int. J. Adv. Manuf. Technol. 2016, 85, 521–534. [Google Scholar] [CrossRef]
- Feng, Z.; Champliaud, H. Modeling and simulation of asymmetrical three-roll bending process. Simul. Model. Pract. Theory 2011, 19, 1913–1917. [Google Scholar] [CrossRef]
- Ktari, A.; Antar, Z.; Haddar, N.; Elleuch, K. Modeling and computation of the three-roller bending process of steel sheets. J. Mech. Sci. Technol. 2012, 26, 123–128. [Google Scholar] [CrossRef]
- Fu, Z.; Tian, X.; Chen, W.; Hu, B.; Yao, X. Analytical modeling and numerical simulation for three-roll bending forming of sheet metal. Int. J. Adv. Manuf. Technol. 2013, 69, 1639–1647. [Google Scholar] [CrossRef]
- Tran, H.; Champliaud, H.; Feng, Z.; Dao, T.-M. Analysis of the asymmetrical roll bending process through dynamic FE simulations and experimental study. Int. J. Adv. Manuf. Technol. 2014, 75, 1233–1244. [Google Scholar] [CrossRef]
- Shim, D.-S.; Kim, K.-P.; Lee, K.-Y. Double-stage forming using critical pre-bending radius in roll bending of pipe with rectangular cross-section. J. Mater. Process. Technol. 2016, 236, 189–203. [Google Scholar] [CrossRef]
- Kim, K.; Kim, M.K.; Cho, W. An analytical model of roll bending steel pipe formed by three rollers. Int. J. Adv. Manuf. Technol. 2019, 104, 4039–4048. [Google Scholar] [CrossRef]
- Chen, P.; Xue, H.; Wang, J. Uniform-curvature arc approximation algorithm and its implementation of CNC roll-bending for Z-shaped variable curvature profiles. Mater. Sci. Technol. 2014, 22, 68–73. (In Chinese) [Google Scholar]
- Hu, Z.; Chen, M.; Xie, L. Variable curvature roll-bending for 2099 A1-Li alloy profile. J. Plast. Eng. 2016, 23, 82–87. (In Chinese) [Google Scholar]
- Huang, S.; Chen, L.; Tian, H.; Shi, P. Study on the influential factors of profile roll bend-ing springback. J. Plast. Eng. 2017, 24, 117–123. (In Chinese) [Google Scholar]
- Groth, S.; Engel, B.; Langhammer, K. Algorithm for the quantitative description of freeform bend tubes produced by the three-roll-push-bending process. Prod. Eng. 2018, 12, 517–524. [Google Scholar] [CrossRef]
- Groth, S.; Frohn, P.; Engel, B. Product planning system for manufacture-oriented modeling of freeform bend tubes produced by three-roll-push-bending. Procedia Manuf. 2019, 34, 10–18. [Google Scholar] [CrossRef]
- Sasaki, Y.; Otsu, M.; Matsumura, M.; Morishita, K.; Tanaka, T.; Yagi, H.; Sekine, Y.; Asakawa, M. Deriving Position of Bending Roll in Roll Bending of Titanium Alloy Wire for Glasses Frame. Procedia Eng. 2014, 81, 257–262. [Google Scholar] [CrossRef][Green Version]
Disclaimer/Publisher’s Note: The statements, opinions and data contained in all publications are solely those of the individual author(s) and contributor(s) and not of MDPI and/or the editor(s). MDPI and/or the editor(s) disclaim responsibility for any injury to people or property resulting from any ideas, methods, instructions or products referred to in the content. |
© 2024 by the authors. Licensee MDPI, Basel, Switzerland. This article is an open access article distributed under the terms and conditions of the Creative Commons Attribution (CC BY) license (https://creativecommons.org/licenses/by/4.0/).

