Article

Conditional Tail Expectation and Premium Calculation under Asymmetric Loss

by
Enrique Calderín-Ojeda
1,2,*,
Emilio Gómez-Déniz
2 and
Francisco J. Vázquez-Polo
2
1
Centre for Actuarial Studies, University of Melbourne, Melbourne, VIC 3010, Australia
2
Department of Quantitative Methods in Economics and TIDES Institute, University of Las Palmas de Gran Canaria, 35017 Las Palmas de Gran Canaria, Spain
*
Author to whom correspondence should be addressed.
Axioms 2023, 12(5), 496; https://doi.org/10.3390/axioms12050496
Submission received: 28 February 2023 / Revised: 4 May 2023 / Accepted: 15 May 2023 / Published: 19 May 2023

Abstract

:
In this paper, we calculate premiums that are based on the Conditional Tail Expectation (CTE) and asymmetric loss functions to account for the risk of both underestimation and overestimation losses. After selecting an appropriate loss function, the premium is calculated as the quantity minimizing an objective function related to the conditional tail expectation of the loss. The premium satisfies desirable properties, i.e., it is a coherent risk measure, and it helps the practitioner to quantify the global risk of the insurer. Finally, this methodology is applied to quantify the risks associated to the total claims amount that are modelled via composite models and comparisons with the usual risk measures, i.e., Value-at-Risk (VaR) and Tail Value-at-Risk (TVaR) are carried out.

1. Introduction

In insurance and finance, risk measures are used to find appropriate provisions and capital requirements to avoid insolvency. Since the risks are usually modelled as non-negative and continuous random variables, measuring risk is equivalent to establishing a correspondence between the space of random variables and R + . In general, a positive real number (i.e., the premium) is the price paid periodically to the insurance company by the insureds for covering their risk. In this paper, our interest lies in risk measures that measure the upper tails of the distribution functions associated with the risk since the more dangerous the risk is, the larger must be the risk measure. Finding appropriate risk measures is also a crucial aspect in premium calculation. Among the different types of risk measures, the coherent risk measures have been traditionally used in actuarial science since they satisfy interesting properties, see for example [1,2,3,4]; among others. Within financial economics, there are many ways to describe risk, and each method of measuring risk will be able to cover specific features. A traditional way to describe a risk is in terms of a coherent risk measure which is a function that considers translational invariance, monotonicity, homogeneity and subadditivity. Most experienced investors and actuaries have used a coherent risk measure in their usual practice. These risk measures that satisfy these mathematical properties can be very useful for determining the amount of risk an investment could incur. A premium is the payment that an insured makes for total or partial cover against a risk. A premium principle is a procedure to assign a premium to a risk, say X a positive real number. Formally speaking, it is a functional H , that assigns to any risk X, a positive real number H ( X ) , the premium for taking the risk X (see [5]). For that we assume a loss function L : R 2 R assigning to the pair ( x , P ) R 2 , the loss sustained by the policyholder who is charged a premium P for taking the risk X, and x is the realization of a risk X. Then H ( X ) , is determined in such a way that the expected loss is minimised. In this paper, we are deriving premiums via an asymmetric loss function. The use of asymmetric loss functions in actuarial statistics is, as far as we know, limited to [6,7] who introduced the weighted balanced loss function proposed by Zellner [8] (pp. 371–390) into the credibility theory setting, and the credibility estimators with a general 0-1 loss function, respectively. The weighted balanced loss function is a generalization of the weighted loss function [5] and has been applied in other scenarios in [9,10]. For a theoretical study about asymmetric loss functions, it is advisable to read the work of [11].
One of the most popular choices among the coherent risk measures is the Conditional Tail Expectation (CTE) that coincides with the Tail Value-at-Risk (TVaR) for continuous random variables (see [12,13]). This risk measure can be obtained as a distorted expectation following the methodology of [14]. Here, following the work of [15], we derive a methodology for charging a fair premium based on coherent risk measures and asymmetric loss functions to account for the risk of both underestimation and overestimation losses. Once the loss function is established, the risk measure technique is applied to calculate the global risk of the insurer by solving a minimization problem. Then, the premium is obtained as the amount minimising the risk of the insurer’s loss. Finally, this methodology is applied to explain the risks associated to the total claims amount in the collective risk model. We model the losses via composite models which have received a lot of attention in the recent actuarial literature to describe insurance loss data when the claims faced by insurers are a mixture of moderate and large claims (see [16,17,18], among others). Another advantage of composite models is that for a good deal of the available models, there exist analytical expressions for some important risk measures such as Value-at-Risk (VaR) and TVaR (see [19]). As an application, we use the composite lognormal-Lomax (CLL) model to calculate the premiums obtained by using this technique. Comparisons are made with the premiums calculated applying the usual CTE or TVaR.
The remainder of this paper is structured as follows. In Section 2 we provide a procedure for calculating the optimal premium when the risk measure is the CTE and an asymmetric loss function is considered. Some risk measures of composite models are examined in Section 3. A specific example of composite model is provided in Section 4, the CLL model. Numerical applications using a real dataset are studied in Section 5 and final comments are given in Section 6.

2. Premium Calculation Minimizing the CTE under Asymmetric Loss

We now define the risk-adjusted optimal premium as the amounts P ^ X , α and δ ^ X , α minimizing the conditional tail expectation of the loss function, i.e., CTE ( L ( x , P ) ) . Note that these quantities depend on the probability level α , with 0 < α < 1 , and the risk X with distribution function F X ( · ) and density function f X ( · ) .
Firstly, to make the paper self-contained, we need to define the Value-at-Risk (VaR) and the Conditional Tail Expectation (CTE) see for example Chapter 5 in [20].
Definition 1.
Giving a probability level α ( 0 , 1 ) , the Value-at-Risk (VaR) is the lowest amount δ 0 , such that with probability α, the loss will not exceed δ, that is,
V a R α ( P ) = min { δ R + : Pr ( L ( x , P ) δ ) α } .
Definition 2.
The associated Conditional Tail Expectation (CTE) is the conditional expectation above that quantity δ,
C T E α ( P ) = 1 1 α L ( x , P ) V a R α ( P ) L ( x , P ) f X ( x ) d x .
Following Theorem 2 in [12], by using the convex and continuously differentiable function with respect to the two variables
V ( P , δ ) = δ + 1 1 α 0 ( L ( x , P ) δ ) + f X ( x ) d x ,
and that the minimization of this function produces a pair ( P ^ X , α , δ ^ X , α ) such that P ^ X , α uniquely minimizes CTE α ( P ) , and δ ^ X , α , if unique, give the value VaR α ( P ^ X , α ) . In (1), ( L ( x , P ) δ ) + = L ( x , P ) δ if L ( x , P ) δ and ( L ( x , P ) δ ) + = 0 if L ( x , P ) δ .
Let us consider the following asymmetric loss (see [5])
L ( x , P ) = γ ( x P ) + + ( 1 γ ) ( x P ) ,
for some γ , such that 0 γ 1 . The loss function (2) gives rise to a premium which is the γ -quantile of the risk X, i.e., the percentile premium principle. For the case γ = 1 , L ( x , P ) = ( x P ) + , the maximal loss function is obtained (see for instance [7]). It is associated with maximal loss sustained by the policyholder who takes the premium P and is faced with the outcome x of some risk X. For the case γ = 0 , L ( x , P ) = ( x P ) = ( P x ) + . It is associated with maximal loss sustained by the insurance company who offers the premium P and is faced with the outcome x of some risk X.
By selecting this asymmetric loss, the loss is not only measured in monetary units but also under appropriate values of the weight γ we can distinguish between the insurer’s loss and and the loss of the insured. Another advantage of asymmetric loss functions is that they apply a different penalty to different directions of the loss; in this case facilitating the calculations in situations where the costs associated with the overestimation are different from the costs linked to the underestimation. Moreover, as the claims distributions usually used to describe the costs are positively skewed, by using this loss function, the associated premiums for large values of γ guarantees that the premium associated to this loss function will exceed the net premium.
Proposition 1.
If L ( x , P ) = γ ( x P ) + + ( 1 γ ) ( x P ) for some γ, such that 0 γ 1 then ( P ^ X , α , δ ^ X , α ) minimizes (1) if and only if they are solutions of the following set of equations
F X ( P δ ) = 1 α 2 ( 1 γ ) , F X ( P + δ ) = 1 1 α 2 γ .
Proof. 
Minimizing the function (1), is equivalent to minimize
V ( P , δ ) = δ + 1 1 α P + δ γ ( x P δ ) f X ( x ) d x + 0 P δ ( 1 γ ) ( P x δ ) f X ( x ) d x .
Now
P + δ γ ( x P δ ) f X ( x ) d x = γ P + δ F ¯ X ( x ) d x ,
and
0 P δ ( 1 γ ) ( P x δ ) f X ( x ) d x = ( 1 γ ) 0 P δ F X ( x ) d x .
where F ¯ X ( · ) = 1 F X ( · ) is the survival function. Thus, we have
V ( P , δ ) = δ + 1 1 α ( 1 γ ) 0 P δ F X ( x ) d x + γ P + δ F ¯ X ( x ) d x .
Then, taking partial derivatives with respect to P and δ , we have
V P = 1 1 α ( 1 γ ) F X ( P δ ) γ F ¯ X ( P + δ ) = 0 , V δ = 1 1 1 α ( 1 γ ) F X ( P δ ) + γ F ¯ X ( P + δ ) = 0 ,
from which we obtain
F X ( P δ ) = 1 α 2 ( 1 γ ) and F X ( P + δ ) = 1 1 α 2 γ .
Hence the result. □
Remark 1.
If it is possible to calculate the quantile function of the random variable X, i.e., F X 1 ( · ) , then we have
P ^ X , α = 1 2 F X 1 1 α 2 ( 1 γ ) + F X 1 1 1 α 2 γ ,
δ ^ X , α = 1 2 F X 1 1 1 α 2 γ F X 1 1 α 2 ( 1 γ ) .
Remark 2.
Observe that when α 0 , P ^ X , α approaches to the γ-quantile and when α 1 , P ^ X , α .
Unfortunately, it is not guaranteed that P ^ X , α , and δ ^ X , α given in (3) and (4) verify the non-negative loading property. However by taking a sufficiently large value of α , the optimal premium will eventually become larger than the net premium.
Following [20], some properties of the functional (risk measure) P ^ X , α are shown below in the next Proposition.
Proposition 2.
Let us assume that X is a continuous and non-negative random variable such that E ( X ) < and F X 1 ( · ) exist, then the functional P ^ X , α satisfies the following properties:
(i)
Translativity: any increase in the liability by a deterministic amount c should result in the same increase in the capital. If the risk increases by a fixed amount c, then the premium also increases by that amount, i.e., P ^ X + c , α = P ^ X , α + c for all random variables and each constant c.
(ii)
Monotonicity: if X s t Y then P ^ X , α P ^ Y , α , assuming that F X 1 ( · ) and F Y 1 ( · ) exist, where s t is the usual stochastic order.
(iii)
Subadditivity: this reflects the idea that risk can be reduced by diversification, i.e., P ^ X + Y , α P ^ X , α + P ^ Y , α .
(iv)
Positive homogeneity or scale invariance: independence with respect to the monetary units used, i.e., P ^ c X , α = c P ^ X , α for all random variables and any constant c. As F c X ( x ) = F X ( x / c ) , then using Proposition 1, ( P ^ c X , α , δ α ) is the optimal solution of the equations
F c X ( P δ ) = 1 α 2 ( 1 γ ) , F c X ( P + δ ) = 1 1 α 2 γ .
(v)
No-rip off: if X c , then P ^ α c . P X Θ , α min { x | F ¯ Θ , α ( x ) = 0 } , for all random variables. It is useless to keep more capital than the maximal loss value. If the random variable is unbounded then the premium is infinite.
(vi)
Constancy (or no unjustified loading): if X c , then P ^ X , α = c . To deal with a loss of c, the insurer only needs to have a capital of the same amount at its disposal.
Proof. 
We proceed as follows:
(i)
As F X + c ( x ) = F X ( x c ) , then using Proposition 1, ( P ^ X + c , α , δ α ) is the optimal solution of the equations
F X + c ( P δ ) = 1 α 2 ( 1 γ ) , F X + c ( P + δ ) = 1 1 α 2 γ .
(ii)
If X s t Y , then F ¯ X ( x ) F ¯ Y ( x ) for all x R + and therefore F X 1 ( u ) F Y 1 ( u ) for all u ( 0 , 1 ) . Thus P ^ X , α P ^ Y , α .
(iii)
It is direct.
(iv)
This property is satisfied since the CTE is a coherent risk measure. To be named coherent, a risk measure must be positive homogeneous, translative, and subadditive (see [20]).
(v)
The result follows since
P ^ X , α = 1 2 F X 1 1 α 2 ( 1 γ ) + F X 1 1 1 α 2 γ 2 c 2 = c .
(vi)
The result is easily verified since
P ^ c , α = 1 2 F c 1 1 α 2 ( 1 γ ) + F c 1 1 1 α 2 γ = c .
Hence, we have the result. □

3. Analytical Expressions of the Premium for Composite Models

In this Section, we will assume, without loss of generality, that the risk X can be identified as a non-negative continuous random variable (loss). On numerous occasions, insurance companies face the challenge of finding suitable models to describe loss data that contain claims that cause huge losses. In practice, it is usual to use the Pareto distribution, which usually fits the tail of the empirical distribution well in these cases. Other models that may be more flexible are the lognormal distribution or the Weibull distribution. However, in these latter cases, the fit of the tail of the empirical distribution of the data may not be adequate. In recent years it has been common to introduce models that combine both proposals, a lognormal distribution up to a certain threshold and a Pareto distribution at the tail of the distribution. These models, called composites, have had an explosion of research since the initial work of [21].
On the other hand, composite models allow explaining data with heavy tails and the unimodal character that empirical data usually present. There are several different ways to define a composite model. For instance [18], improved the model proposed by [21] incorporating unrestricted mixing weights and assuming continuity and differentiability conditions at the threshold. In the following, it will be assumed that risk X is distributed according to a composite model with probability density function (pdf) given by
f X ( x ) = r f 1 * ( x ) , 0 < x θ , ( 1 r ) f 2 * ( x ) , θ < x < ,
where 0 r 1 and the functions,
f 1 * ( x ) = f 1 ( x ) F 1 ( θ ) , f 2 * ( x ) = f 2 ( x ) 1 F 2 ( θ )
are adequate truncations of the pdf’s f 1 ( x ) and f 2 ( x ) up to and thereafter of an unknown threshold value θ , with F 1 ( θ ) and F 2 ( θ ) denote the cumulative distribution function (cdf) of f 1 ( x ) and f 2 ( x ) at θ respectively. Then (5) can be seen as a convex sum of two densities and hence it is expressed as a mixture model. It means that when the mixing weight r is close to 1, the pdf of X is mostly characterized by the density f 1 * ( · ) and θ tends to . On the other hand, if r is close to 0, the density of X is described by the second spliced model and the threshold θ is very small.
After imposing the continuity condition at the threshold, that is, f X ( θ ) = f X ( θ + ) , we have
r = f 2 ( θ ) F 1 ( θ ) f 2 ( θ ) F 1 ( θ ) + f 1 ( θ ) ( 1 F 2 ( θ ) .
Moreover, differentiability condition at θ was also imposed in order to make (5) smooth and to decrease the number of parameters. Analytical expressions of the pdf and cdf, unrestricted mixing weight and quantile function for lognormal-Lomax and Weibull-Lomax distribution can be found at [18,22], respectively. Also, composite models have been defined via a mode-matching technique, see [23]. This methodology guarantees the continuity and differentiability conditions mentioned earlier and it also allows the use of any density whose mode can be expressed in closed-form, what facilitates the implementation of the model. The main idea behind this procedure consists of using as first component of the continuous composite model, adequate truncation of a chosen distribution (say f 1 * ( x ) ) up to the mode, and the second part of the distribution uses adequate truncation of a second distribution (say f 2 * ( x ) ). More details about this methodology can be found in [24].
Let X be a non-negative random variable with pdf f X ( x ) defined by
f X ( x ) = r f 1 ( x ) F 1 ( θ ) , 0 < x θ , ( 1 r ) f 2 ( x ) 1 F 2 ( θ ) , θ < x <
with 0 r 1 , then the cdf F X ( x ) is easily derived from (7) and is given by
F X ( x ) = r F 1 ( x ) F 1 ( θ ) , 0 < x θ , r + ( 1 r ) F 2 ( x ) F 2 ( θ ) 1 F 2 ( θ ) , θ < x < .
In the following we assume that E ( X ) < . From Definition 1, the VaR at level α , with 0 < α < 1 of a random variable X with cdf F X ( x ) is given by
π X α = inf { x R , F X ( x ) α } .
The VaR is simply obtained by using the quantile function for composite models (see [24]),
π X α = F 1 1 α r F 1 ( θ ) 0 < α r , F 2 1 α r 1 r ( 1 F 2 ( θ ) ) + F 2 ( θ ) , r < α < 1
with 0 < α < 1 .
The VaR is a risk measure that is not coherent because of the lack of subadditivity. For the risk X, the CTE or TVaR (see [25]) is given by
CTE α ( X ) = 1 1 α α 1 π X u d u ,
which is a coherent risk measure. If X is continuous, Pr ( X π X α ) = α , and then the TVaR is the CTE, E X ( X | X > π X α ) . Then, we have that the CTE of X can be expressed as follows (see [19]),
E X ( X | X > π X α ) = F 1 ( θ ) F 1 ( θ ) r F 1 ( π X α ) r E ( X 1 ) F 1 ( 1 ) ( θ ) F 1 ( 1 ) ( π X α ) F 1 ( θ ) + ( 1 r ) E ( X 2 ) 1 F 2 ( 1 ) ( θ ) 1 F 2 ( θ ) ,
if 0 < π X α θ and
E X ( X | X > π X α ) = E ( X 2 ) 1 F 2 ( 1 ) ( π X α ) 1 F 2 ( π X α ) ,
if θ < π X α < , where F i ( 1 ) ( z ) is the cdf of the ith incomplete moment evaluated at z with i = 1 , 2 .
As it is simple to verify that 1 α 2 ( 1 γ ) and 1 1 α 2 γ cannot be simultaneously lower than the value of the mixing weight r given in (6), then we have that the analytical expressions for the risk-adjusted optimal premiums under the general composite are given by the expressions:
P ^ α = 1 2 F 1 1 1 α 2 r ( 1 γ ) F 1 ( θ ) + F 2 1 1 1 α 2 γ ( 1 r ) ( 1 F 2 ( θ ) ) + F 2 ( θ ) , δ ^ α = 1 2 F 2 1 1 1 α 2 γ ( 1 r ) ( 1 F 2 ( θ ) ) + F 2 ( θ ) F 1 1 1 α 2 r ( 1 γ ) F 1 ( θ ) ,
if 0 < 1 α 2 ( 1 γ ) r , and
P ^ α = 1 2 F 1 1 1 r 1 α 2 γ r F 1 ( θ ) + F 2 1 1 α 2 r ( 1 γ ) 2 ( 1 γ ) ( 1 r ) ( 1 F 2 ( θ ) ) + F 2 ( θ ) , δ ^ α = 1 2 F 2 1 1 α 2 r ( 1 γ ) 2 ( 1 γ ) ( 1 r ) ( 1 F 2 ( θ ) ) + F 2 ( θ ) F 1 1 1 r 1 α 2 γ r F 1 ( θ ) ,
if 0 < 1 1 α 2 γ r .
Note that to simplify the notation of the premiums, we have omitted the risk X from P ^ X , α and δ ^ X , α .

4. A Specific Model

We are applying the results derived in the previous section to the composite lognormal-Pareto models introduced in [18]. We have chosen this model due to the fact that there exist an analytical expression for the quantile functions of each spliced component and also for its simplicity and good estimation. For that reason let us consider
f 1 ( x ) = 1 2 π x σ exp 1 2 ln x μ σ 2 , x > 0
be the pdf of a two-parameter lognormal distribution, where μ R , σ > 0 , and f 2 ( x ) is the pdf of the Type II Pareto or Lomax distribution given by
f 2 ( x ) = ξ ( λ + θ ) ξ ( λ + x ) ξ + 1 , x > θ ,
where the parameters are θ > 0 , ξ > 0 , and λ > θ . We have considered this shifted or translated version of the Pareto Type II or Lomax distribution to incorporate the threshold as a location parameter. The work of [21] considers the classical Pareto distribution, which is a particular case of this shifted version of the Lomax distribution when λ = 0 .
The pdf of this composite model is given by
f X ( x ) = r f 1 ( x ) Φ A , 0 < x θ , ( 1 r ) f 2 ( x ) , θ < x < ,
where
A = ln θ μ σ = ξ θ λ λ + θ σ , 0 r 1
and Φ ( · ) denotes the cdf of the standard normal distribution. After imposing the continuity and differentiability requirements at θ a smooth four-parameter density is obtained. In this case, r is now provided by
r = 2 π ξ θ σ Φ A exp 1 2 A 2 2 π ξ θ σ Φ A exp 1 2 A 2 + λ + θ .
Note that for the case λ = 0 , this model nests the composite lognormal-Pareto model.
Figure 1 shows two plots of the pdf given in (11) for different values of the parameters. Observe that the value of the parameter ξ is not necessary since we have used expression (12) to simplify the model by imposing the continuity and differentiability conditions.
The VaR is easily derived using (9), and its analytical expression is given by
π X α = exp μ + σ Φ 1 α r Φ ( A ) 0 < α r , ( λ + θ ) 1 α 1 r 1 ξ λ , r < α < 1 ,
where Φ 1 ( · ) is the inverse of the cdf of the standard normal distribution, 0 < α < 1 and A is given by expression (12). Now, from (10), the CTE is provided by
E X ( X | X > π X α ) = Φ ( A ) Φ ( A ) r Φ ( B ) r exp μ + σ 2 2 Φ ( C ) Φ ( D ) Φ ( A ) + ( 1 r ) λ + θ ξ ξ 1 , if 0 < π X α θ ,
and
E X ( X | X > π X α ) = λ + ξ π X α ξ 1 , if θ < π X α < ,
where
B = ln π X α μ σ , C = ln θ ( μ + σ 2 ) σ , D = ln π X α ( μ + σ 2 ) σ
and once again A is provided by expression (12).
Again as 1 α 2 ( 1 γ ) and 1 1 α 2 γ cannot be simultaneously lower than the value of the mixing weight r, then we have that the analytical expressions for the risk-adjusted optimal premiums under the CLL model are given by the expressions:
P ^ α = 1 2 exp μ + σ Φ 1 1 α 2 ( 1 γ ) r Φ ( A ) + ( λ + θ ) 1 α 2 γ ( 1 r ) 1 ξ λ ,
δ ^ α = 1 2 ( λ + θ ) 1 α 2 γ ( 1 r ) 1 ξ λ exp μ + σ Φ 1 1 α 2 ( 1 γ ) r Φ ( A ) ,
if 0 < 1 α 2 ( 1 γ ) r , and
P ^ α = 1 2 exp μ + σ Φ 1 2 γ ( 1 α ) 2 r γ Φ ( A ) + ( λ + θ ) 1 2 γ + α 2 ( 1 γ ) ( 1 r ) 1 ξ λ ,
δ ^ α = 1 2 ( λ + θ ) 1 2 γ + α 2 ( 1 γ ) ( 1 r ) 1 ξ λ exp μ + σ Φ 1 2 γ ( 1 α ) 2 r γ Φ ( A ) ,
if 0 < 1 1 α 2 γ r .

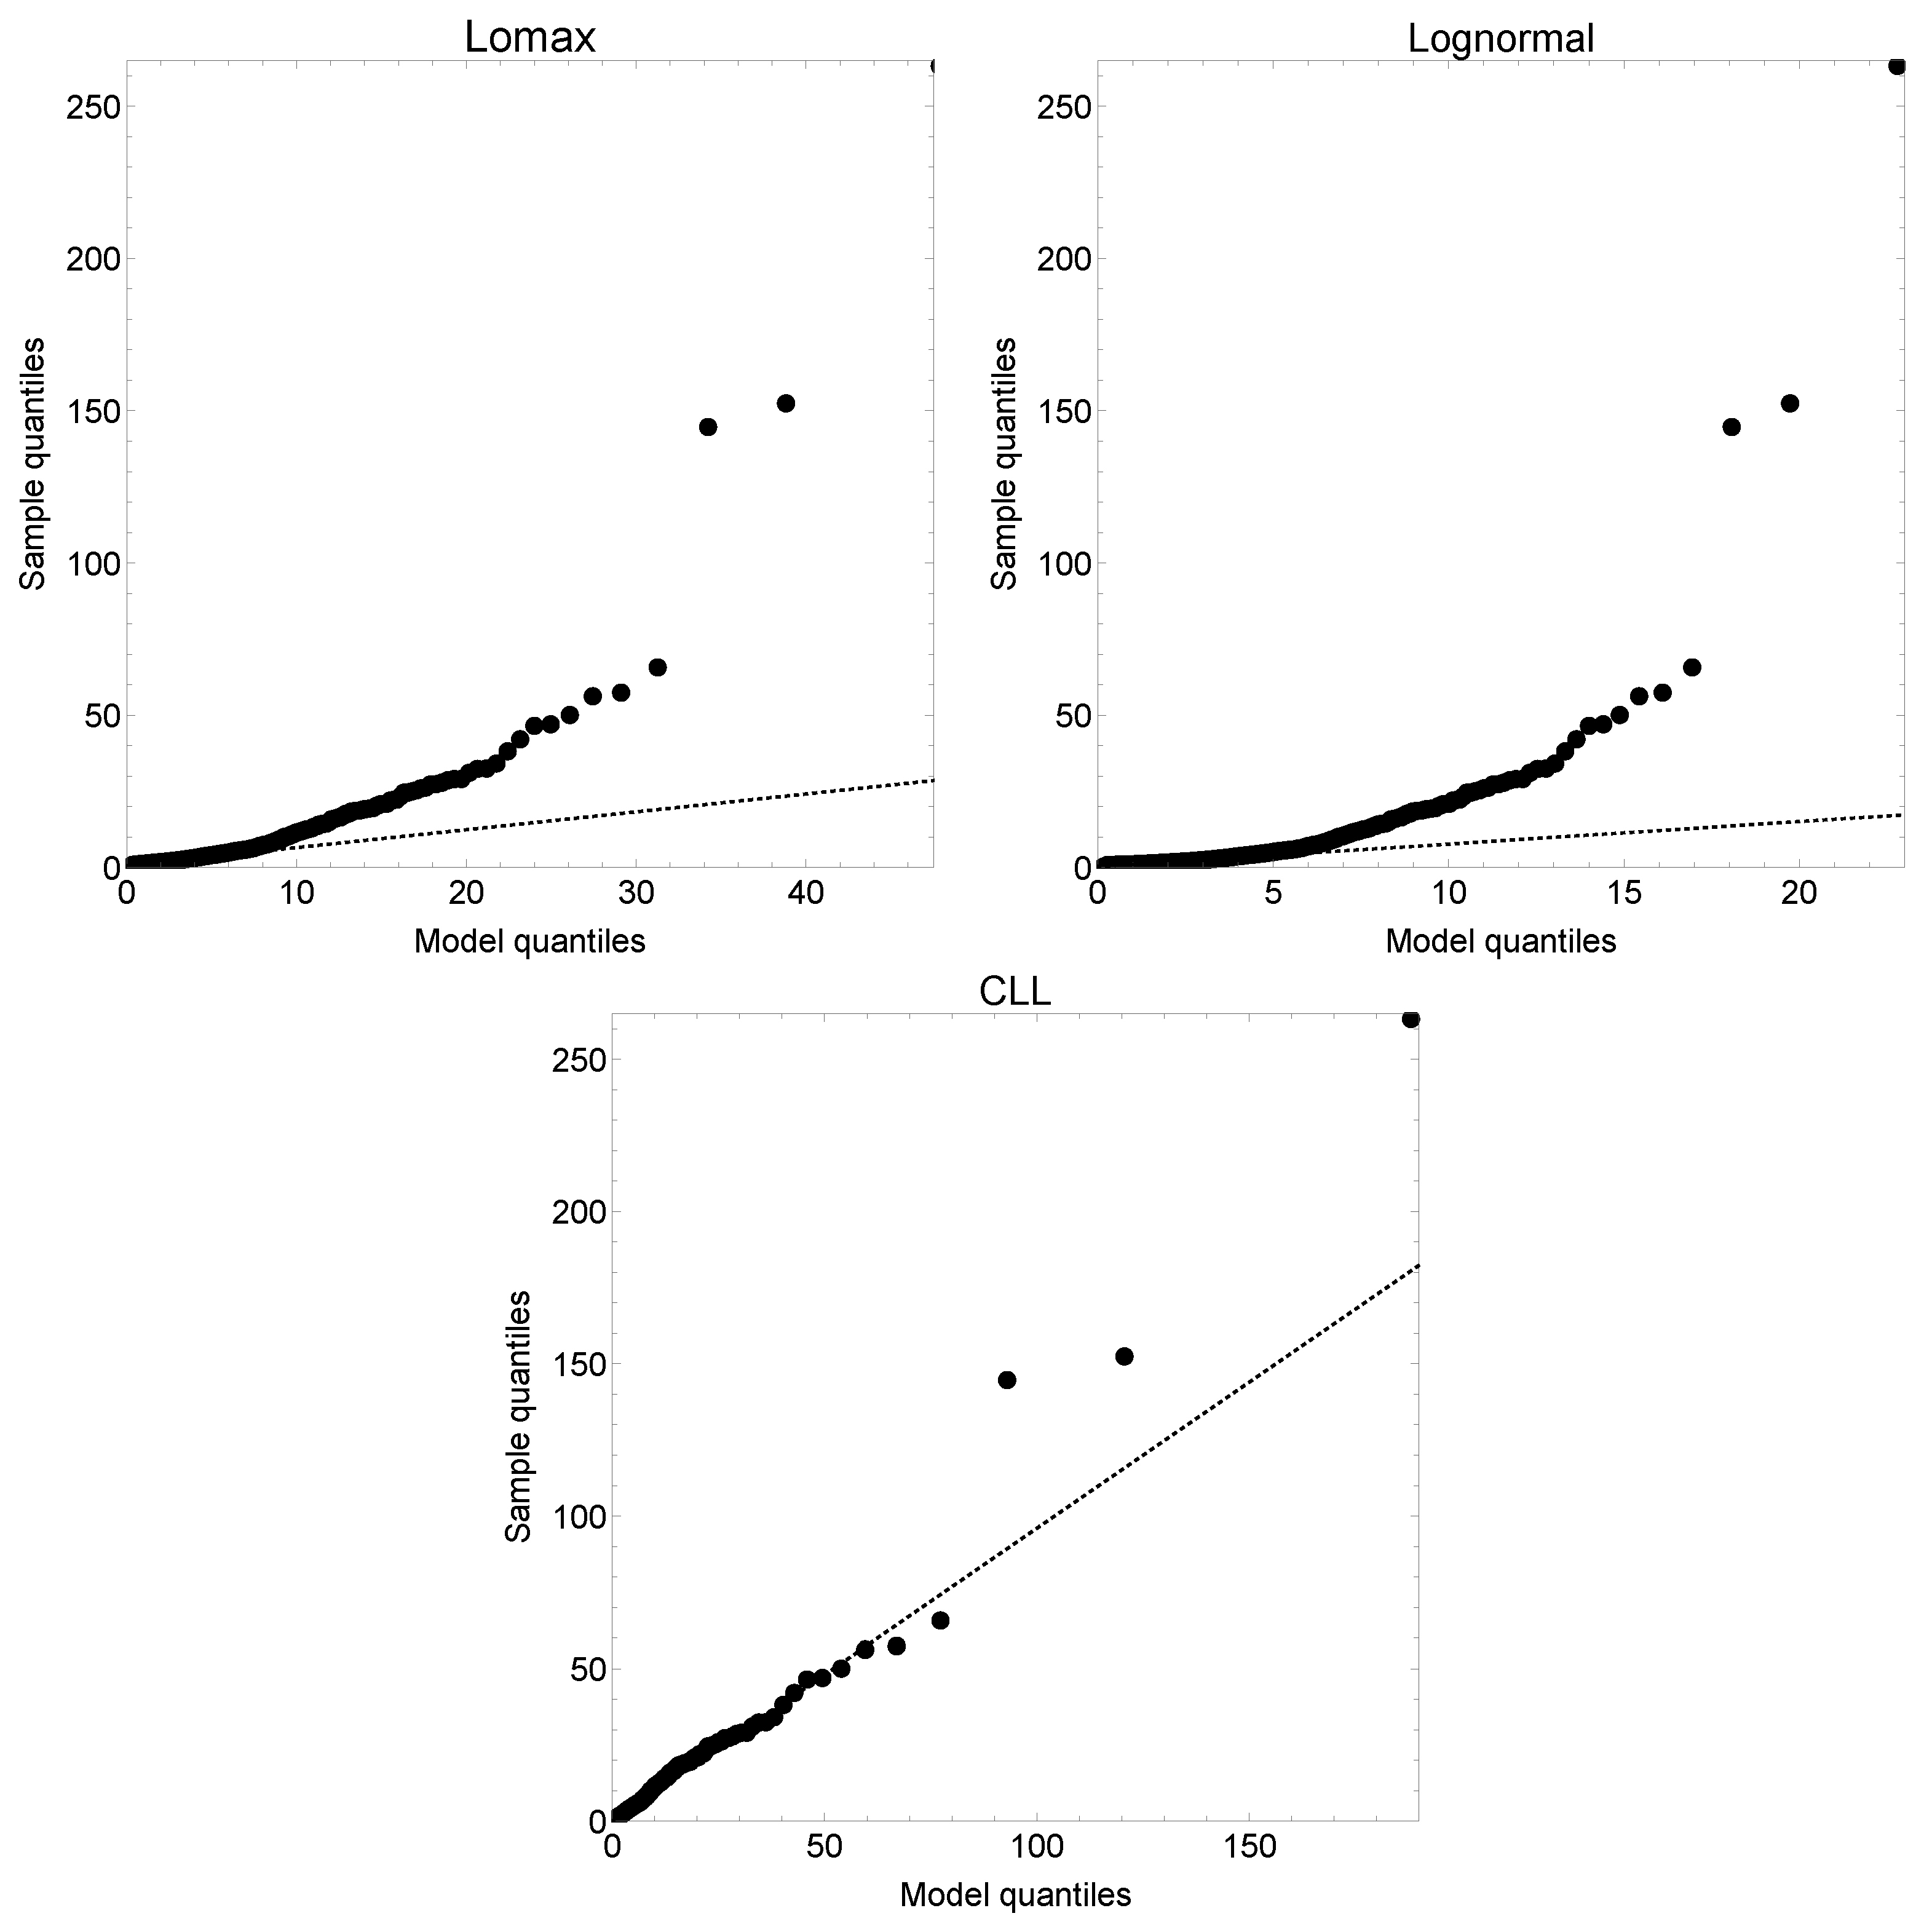
5. Numerical Application

Now we use the classic Danish fire insurance dataset. The dataset contains 2492 fire insurance losses in millions of Danish kroner (DKr) from the years 1980 to 1990 inclusive, adjusted to reflect 1985 values. This dataset may be found in the “SMPracticals” add-on package for R, available from the CRAN website http://cran.r-project.org/ (accessed on 14 May 2023). Estimates obtained by maximum likelihood estimation and standard errors (in brackets) were reported in [24]. These values are μ ^ = 0.1035 ( 0.0196 ) , σ ^ = 0.1823 ( 0.0112 ) , λ ^ = 0.3648 ( 0.1234 ) and θ ^ = 1.1444 ( 0.0289 ) . Also the value of the mixing weight is r = 0.2382 . We have also fitted the lognormal and Lomax distributions to this dataset for comparison purposes. For the former model, the estimates are μ ^ = 0.6719 and σ ^ = 0.7323 whereas for the latter distribution, these values are ξ ^ = 5.1694 and λ ^ = 11.9003 . Below in Figure 2, we have drawn the QQ plots of the three models. From the QQ plots shown below, it can be seen that the sample quantiles are larger than the model quantiles for the lognormal and Lomax distribution, thus both models underestimates the empirical quantiles. The lognormal distribution provides a better fit than the Lomax distribution in the lower and middle parts of the empirical distribution. The latter model improves the behaviour of the lognormal one in the middle-to-large part of the sample distribution. By combining the two models under the composite methodology, the resulting model improves the fit to data not only in the middle and top parts of the distribution but also in the upper tail.
Now we use the expressions (13) and (14) or (15) and (16) to calculate the risk-adjusted optimal premiums, say P ^ α and δ ^ α . In addition, we have also calculated the VaR and CTE for different security levels for the CLL model. By using the estimates given above, all these risk measures have been computed for security levels α : = 0.90 , 0.925 , 0.95 , 0.975 , 0.99 . In Table 1 below are exhibited the numerical values of the optimal numerical values of P ^ α , δ ^ α and CTE α ( P ^ α ) for different values of security level α and γ . The net premium calculated for the CLL model is 3.1450. Observe that for the values of α and γ chosen, the premiums obtained P ^ α are greater than the net premium. Note also that the optimal values of the conditional expectation of the losses CTE α ( P ^ α ) above the amount δ were computed by plugging the optimal values of P ^ α and δ ^ α into the objective function (1). The values of this risk measure exceed those ones of the premium P ^ α for each combination of α and γ . Nevertheless, it is observable that their values are lower than the premiums calculated applying the usual CTE or TVaR, i.e., CTE α ( X ) for each security level α .

6. Conclusions

In this work, following the methodology used in [15], we have derived a two-step procedure to calculate the risk premium using an asymmetric loss function. Unlike in that work, where the absolute error loss function to calculate the risk measures VaR and CTE was considered, we use the percentile principle given in the article of [5] to allow for different weights in the calculation of the premium. The choice of the loss function associated with the percentile premium principle is advisable since the premiums can be simply calculated and easily understood. In this sense, the use of an asymmetric loss function enable the practioner to explain overestimations and underestimations of a risk associated to a continuous and non-negative random variable representing the total claims amount.
The premiums are calculated as the quantities minimizing an objective function related to the conditional tail expectation of the loss. We have shown that the premiums calculated under this methodology satisfy important properties. Next, this methodology was applied to compute the premiums of composite models. The composite models have been recently used in actuarial statistics to derive loss distributions by combining two continuous models up to and after a threshold estimated from the sample data after imposing continuity and differentiability conditions. The numerical application showed that the premium values were lower than those using the usual conditional tail expectation principle for a specific composite model based on the lognormal and Lomax distribution. To the best of our knowledge, this methodology of premium calculation has never been used in risk theory. Finally, it is worth investigating if this methodology can be applied to calculating risk measures of the loss associated with a given premium.

Author Contributions

Conceptualization, E.C.-O., E.G.-D. and F.J.V.-P.; methodology, E.C.-O., E.G.-D. and F.J.V.-P.; software, E.C.-O., E.G.-D. and F.J.V.-P.; validation, E.C.-O., E.G.-D. and F.J.V.-P.; formal analysis, E.C.-O., E.G.-D. and F.J.V.-P.; investigation, E.C.-O., E.G.-D. and F.J.V.-P.; resources, E.C.-O., E.G.-D. and F.J.V.-P.; data curation, E.C.-O., E.G.-D. and F.J.V.-P.; writing—original draft preparation, E.C.-O., E.G.-D. and F.J.V.-P.; writing—review and editing, E.C.-O., E.G.-D. and F.J.V.-P.; visualization, E.C.-O., E.G.-D. and F.J.V.-P.; supervision, E.C.-O., E.G.-D. and F.J.V.-P.; project administration, E.C.-O., E.G.-D. and F.J.V.-P.; funding acquisition, E.C.-O., E.G.-D. and F.J.V.-P. All authors have read and agreed to the published version of the manuscript.

Funding

Authors were partially funded by grant PID2021-127989OB-I00 (Ministerio de Economía y Competitividad, Spain.) Also E.C.O thanks Ministerio de Universidades and Next Generation EU for funding the Program “Ayudas María Zambrano”.

Data Availability Statement

All of the data used in this study is available from “SMPracticals” add-on package for R, available from the CRAN website http://cran.r-project.org/cassavabase.org. We have accessed the data on 4 February 2021.

Conflicts of Interest

The authors declare no conflict of interest.

References

  1. Artzner, P.; Delbaen, F.; Eber, J.M.; Heath, D. Coherent measures of risk. Math. Financ. 1999, 9, 203–228. [Google Scholar] [CrossRef]
  2. Klugman, S.A.; Panjer, H.H.; Willmot, G.E. Loss Models. From Data to Decisions, 3rd ed.; John Wiley: Hoboken, NJ, USA, 2008. [Google Scholar]
  3. Furman, E.; Zitikis, R. Weighted premium calculation principles. Insur. Math. Econ. 2008, 42, 459–465. [Google Scholar] [CrossRef]
  4. Furman, E.; Zitikis, R. Weighted risk capital allocations. Insur. Math. Econ. 2008, 42, 263–269. [Google Scholar] [CrossRef]
  5. Heilmann, W.R. Decision theoretic foundations of credibility theory. Insur. Math. Econ. 1989, 8, 77–95. [Google Scholar] [CrossRef]
  6. Gómez-Déniz, E. A generalization of the credibility theory obtained by using the weighted balanced loss function. Insur. Math. Econ. 2008, 42, 850–854. [Google Scholar] [CrossRef]
  7. Gómez-Déniz, E.; Calderín-Ojeda, E. Credibility premiums for natural exponential family and general 0–1 loss function. Chil. J. Stat. 2015, 6, 3–17. [Google Scholar]
  8. Zellner, A. Bayesian and non-Bayesian estimation using balanced loss function. In Statistical Decision Theory and Related Topics; Gupta, S.S., Berger, J.O., Eds.; Springer: New York, NY, USA, 1994; pp. 371–390. [Google Scholar]
  9. Farsipour, N.S.; Asgharzadhe, A. Estimation of a normal mean relative to balanced loss functions. Stat. Pap. 2004, 45, 279–286. [Google Scholar] [CrossRef]
  10. Jafari, M.; Marchand, E.; Parsian, A. On estimation with weighted balanced-type loss function. Stat. Probab. Lett. 2006, 76, 773–780. [Google Scholar] [CrossRef]
  11. Hosomatsu, Y. Concepts, theory, and techniques. Asymmetric loss function and optimal policy under uncertainty: A simple proof. Manag. Sci. 1980, 26, 577–582. [Google Scholar]
  12. Rockafellar, R.; Uryasev, S. Conditional value at risk for general loss distributions. J. Bank. Financ. 2002, 26, 1443–1471. [Google Scholar] [CrossRef]
  13. Rockafellar, R.; Uryasev, S.; Zabaranking, M. Generalized deviations in risk analysis. Financ. Stoch. 2006, 10, 51–74. [Google Scholar] [CrossRef]
  14. Wang, S. Premium calculation by transforming the premium layer density. ASTIN Bull. 1996, 26, 71–92. [Google Scholar] [CrossRef]
  15. Heras, A.; Balbás, B.; Vilar, J.L. Conditional tail expectation and premium calculation. ASTIN Bull. 2012, 42, 325–342. [Google Scholar]
  16. Grün, B.; Miljkovic, T. Extending composite loss models using a general framework of advanced computational tools. Scand. Actuar. J. 2019, 8, 642–660. [Google Scholar] [CrossRef]
  17. Pigeon, M.; Denuit, M. Composite Lognormal–Pareto model with random threshold. Scand. Actuar. J. 2011, 3, 177–192. [Google Scholar] [CrossRef]
  18. Scollnik, D.P.M. On composite Lognormal-Pareto models. Scand. Actuar. J. 2007, 1, 20–33. [Google Scholar] [CrossRef]
  19. Sarabia, J.M.; Calderín-Ojeda, E. Analytical expressions of risk quantities for composite models. J. Risk Model Valid. 2018, 12, 75–101. [Google Scholar] [CrossRef]
  20. Kaas, R.; Goovaertes, M.; Dhaene, J.; Denuit, M. Modern Actuarial Risk Theory; Springer; Heidelberg Gmbh & Co. Kg.: Berlin/Heidelberg, Germany, 2008. [Google Scholar]
  21. Cooray, K.; Ananda, M.M.A. Modeling actuarial data with a composite Lognormal–Pareto model. Scand. Actuar. J. 2005, 5, 321–334. [Google Scholar] [CrossRef]
  22. Scollnik, D.P.M.; Sun, C. Modeling with Weibull-Pareto models. N. Am. Actuar. J. 2012, 16, 260–272. [Google Scholar] [CrossRef]
  23. Calderín-Ojeda, E. On the Composite Weibull–Burr Model to describe claim data. Commun. Stat. Case Stud. Data Anal. Appl. 2015, 1, 59–69. [Google Scholar] [CrossRef]
  24. Calderín-Ojeda, E.; Kwok, C.F.K. Modeling claims data with composite Stoppa models. Scand. Actuar. J. 2016, 9, 817–836. [Google Scholar] [CrossRef]
  25. Acerbi, C.; Tasche, D. On the coherence of expected shortfall. J. Bank. Financ. 2002, 26, 1487–1503. [Google Scholar] [CrossRef]
Figure 1. Plot of the pdf given in (11) for special values of its parameters. Left panel, ( θ , λ , μ , σ ) = ( 2 , 2 , 1 , 1 ) and right panel ( θ , λ , μ , σ ) = ( 3 , 3 , 0 , 0.5 ) .
Axioms 12 00496 g001
Figure 2. QQ plots of the Lomax (top left), lognormal (top right)and composite lognormal-Lomax (CLL) distribution for the Danish fire claims dataset.
Axioms 12 00496 g002
Table 1. Optimal values of P ^ α , δ ^ α and CTE α ( P ^ α ) for different risk levels α and γ . Empirical VaR and TVaR and VaR and TVaR of X are also given for comparison purposes.
Risk Level α
RiskMeasure0.900.9250.950.9750.99
EmpiricalVaR5.0805.9898.45414.39524.970
TVaR14.27117.17222.22233.45055.587
Model π X α 5.1656.2818.24813.05223.741
CTE α ( X ) 14.97118.06823.52436.84866.492
γ = 0.6 P ^ α 3.3333.9515.0437.72313.707
δ ^ α 2.5153.1524.2706.98813.015
CTE α ( P ^ α ) 3.4784.2905.7189.19816.927
γ = 0.8 P ^ α 3.9384.6846.0019.22916.428
δ ^ α 3.1653.9285.2678.52715.765
CTE α ( P ^ α ) 7.2108.75911.48518.13632.922
γ = 0.9 P ^ α 4.2115.0176.4409.92317.688
δ ^ α 3.4764.2975.7389.25117.051
CTE α ( P ^ α ) 9.15011.09214.51022.85141.398
Disclaimer/Publisher’s Note: The statements, opinions and data contained in all publications are solely those of the individual author(s) and contributor(s) and not of MDPI and/or the editor(s). MDPI and/or the editor(s) disclaim responsibility for any injury to people or property resulting from any ideas, methods, instructions or products referred to in the content.

