Article

A Hybrid Model for Evaluating the Bikeability of Urban Bicycle Systems

1
Department of Transportation Management, Tamkang University, 151, Yingzhuan Rd., Tamsui Distract, New Taipei City 251301, Taiwan
2
Department of Industrial Engineering and Management, National Taipei University of Technology, 1, Section 3, Zhongxiao E. Rd., Taipei 10608, Taiwan
*
Author to whom correspondence should be addressed.
Axioms 2023, 12(2), 155; https://doi.org/10.3390/axioms12020155
Submission received: 24 December 2022 / Revised: 30 January 2023 / Accepted: 30 January 2023 / Published: 2 February 2023

Abstract

:
Improving people’s willingness to ride bicycles has become the main green transportation policy of the government in the world. Bikeability is an important factor affecting the willingness to ride. Since the urban riding environment is more complex than the suburbs, it is necessary to establish a complete urban bikeability evaluation framework. This study applies Bayesian BWM (Best Worst Method) and modified VIKOR to develop an urban bikeability evaluation framework. First, this study collects criteria affecting urban bikeability through literature review and experts’ surveys to develop a novel evaluation framework. Second, the Bayesian BWM was used to evaluate the relative weights of criteria and dimensions. Finally, the modified VIKOR was used to evaluate the riding environment of urban bicycle systems. The modified VIKOR replaces the relatively good concept as the aspiration level, which can effectively reflect the real situation. This study used two cities of Taiwan as case studies to demonstrate the usefulness and effectiveness of the proposed model. The results show that “completeness of facilities” is the most important dimension and “maintenance of bicycle pavements”, “width of bicycle lanes”, and “separation of bicycle lanes and car lanes” are the critical criteria. Based on the findings, some management implications and improving strategies are provided.

1. Introduction

The demand for private vehicles is rapidly increasing as population and economic size grow, and the total number of registered vehicles worldwide has rapidly increased from 200 million in 1960 to 1.431 billion in 2018 [1]. This rapid growth in the number of vehicles has resulted in massive traffic volumes on the roads, serious traffic congestion, and consequential environmental pollution. In the face of this serious challenge, the core of modern transportation planning has shifted from traditional supply orientation to enabling people to commute more easily to their daily activities, making freight more energy efficient, and mitigating the negative impacts of transportation on climate, environment, and human health [2]. Such thinking, also known as sustainable transportation, is defined as meeting current needs without compromising future needs [3].
Based on the premise of a sustainable environment, all transportation systems with greenhouse gas reduction effects, low energy use intensity, and low pollution intensity are classified as green transportation. By promoting the use of low-polluting, energy-efficient, and intelligent vehicles, green transportation provides a safe, comfortable, environmentally friendly, and co-prosperous sustainable transportation environment. At the United Nations Climate Summit in 2021, all major cities around the world pledged to continue to actively promote green transportation, and companies from all over the world have also put forward various carbon reduction plans, whether it is developing a market for zero-carbon emission vehicles or increasing fuel fee rates. In particular, the promotion of bicycle riding can not only moderately mitigate traffic congestion, reduce accident rates, and alleviate problems such as fuel shortage and air pollution, but also promote the health of citizens and clean up the environment [4,5].
Studies have shown that among the many factors that influence people’s use of bicycles, the most important factor that affects the willingness to ride is whether the road environment is suitable for ride [6]. According to the National Highway Traffic Safety Administration (NHTSA), the number of bicycle accident deaths and injuries will increase by 5% in 2021 compared to 2020, and most of the accidents occur in an environment where bicycles and motorcycles share the same road. Therefore, it is necessary to establish a complete evaluation framework to review the state of the bicycle riding environment. Previous literature on bicycle environmental evaluation framework mostly focuses on one aspect, such as safety [7], environmental amenities [8], completeness of facilities [9], law enforcement policies, and education [6]. However, studies point out that the traditional evaluation method of measuring the bikeability in only one dimension is no longer in line with the demand. The concept of overall bikeability should be analyzed to meet the multi-dimensional considerations including completeness of facilities, safety, environmental comfort, enforcement policies and education, street connectivity [5,7]. The objective of this study is to establish a bikeability evaluation system that can be used to evaluate and improve urban green transportation systems to achieve the goal of sustainable cities.
First, this study reviewed the literature related to bikeability, collected all possible factors affecting bikeability, and extracted the essential criteria through the experts’ survey to establish a novel evaluation framework. Then, the Bayesian BWM method was used to explore the weight of each criterion. Since most of the traditional weighting evaluation methods have shortcomings, such as being time-consuming to fill in the answers and having low consistency of results and difficulty integrating various opinions [10,11], the Bayesian Best-Worst Method (Bayesian BWM), which yields consistent results, was used in this study. This method significantly reduces the number of pairwise comparisons compared to the traditional Analytic Hierarchy Process (AHP), and finds the optimal combination of weights by taking into account the inconsistency of expert opinions through a probability distribution. It can effectively integrate various judgements. The method has been successfully applied to various fields, such as modeling mobility choice [12], bicycle lane de-sign [13], logistics and distribution [14], finance [15], sports tourism [16], and risk evaluation [17]. After obtaining the criteria weights, this study investigated the improvement order of urban bicycle bikeability criteria by the modified VlseKriterijumska Optimizacija I Kompromisno Resenje (modified VIKOR). The traditional VIKOR is an effective alternative ranking method and has been successfully applied in many fields, such as transportation service evaluation [18], marketing planning [19], and medical evaluation [20]. However, because it uses the concept of relatively good as the evaluation benchmark, it may cause the phenomenon of picking a less rotten apple from a basket of rotten ones [21]. This study uses the concept of aspiration level as the benchmark, which can effectively explore the gap between the current performance and the aspiration level. It combines two different concepts of distances and is especially useful while the number of alternatives is few. Finally, this study applied the proposed bikeability evaluation framework to evaluate the bicycle road environment in Taipei City and New Taipei City in Taiwan, analyzed the gaps between the current levels and the aspiration levels, and then developed strategies to improve the bicycle riding environment. In sum, the contributions of the paper include: (1) establishing a novel evaluating framework for the bikeability of urban bicycle systems; (2) developing a hybrid model to evaluate the urban bikeability, which can effectively integrate various opinions and explore the gaps to aspiration levels; (3) providing practical strategies to improve the bikeability of urban bicycle systems.
The follow-up is explained in four sections in sequence. Section 2 reviews the literature related to bikeability; Section 3 explains the model formulas of the Bayesian best-worst method, and the modified VIKOR; Section 4 presents the screening results of important criteria for bikeability, the relative importance and weight of each dimension and criterion, and the evaluation results of the bicycle road environment in Taipei City and New Taipei City; Section 5 consolidates the results, and puts forward suggestions for improving the bicycle riding environment.

2. Proposed Bikeability Evaluation Framework

This section first explains the concept of bikeability, then explains the principles for the establishment of the evaluation framework, and finally organizes and reviews the methods traditionally used to evaluate bikeability, and explains the reasons for the evaluation methods used in this study.

2.1. The Concept of Bikeability

The concept of bikeability first originated from pedestrian walkability. Winters et al. [6] first proposed a framework of bikeability in 2013. The so-called walkability means that the environment is attractive, clean, and pleasant, and there are good pedestrian facilities, such as sidewalks and lighting facilities, so that pedestrians are energetic and willing to go out in this environment [22]. Later, this concept has been applied to bicycles in several studies, which led to the emergence of the concept of bikeability. The number of studies related to bikeability gradually increased between 2009 and 2019, which shows that this concept has gradually received the attention of researchers [23].
The Bicycle Compatibility Index (BCI) was developed by the U.S. Department of Transportation (DOT) in 1998 to examine the effects of roadway geometry designs and road traffic conditions on riding comfort, such as the width of bicycle lanes, traffic flow, and speed [24]. With the increase in bicycle accident rate at intersections, ref. [25] developed the Bicycle Intersection Safety Index (Bike ISI), modeled by variables such as the presence or absence of bicycle lanes, presence or absence of on-street parking, road speed limit and traffic flow, and calculated the bicycle safety scores of straight ahead, right turn, and left turn for intersections. The bicycle safety scores for straight ahead, right turn and left turn are calculated for the planners to understand the imperfections of bicycle-related facilities at the intersection. However, it is easy to ignore the influence of other important factors and cannot propose comprehensive improvement strategies by only focusing on a single aspect of the bicycle usage environment.
Many later studies have attempted to develop various evaluation models from different perspectives. The Bicycle Level of Service (BLOS) model uses variables such as lane width, traffic flow, vehicle speed, and pavement condition for regression modeling, and interprets them in three dimensions: suitability, accessibility, and friendliness. The Area-wide Bikeability Evaluation Model (ABAM) collected 25 bikeability evaluation criteria and analyzed them with a multi-criteria decision-making approach [6]. The Perceived Bicycling Intersection Safety (PBIS) model uses a five-point Likert scale to assess bicyclists’ perceptions of safety in bicycle road environment projects [7]. In addition, Fancello et al. [26] pointed out that with limited resources, it is also important to invest resources effectively in bicycle environment improvement projects.

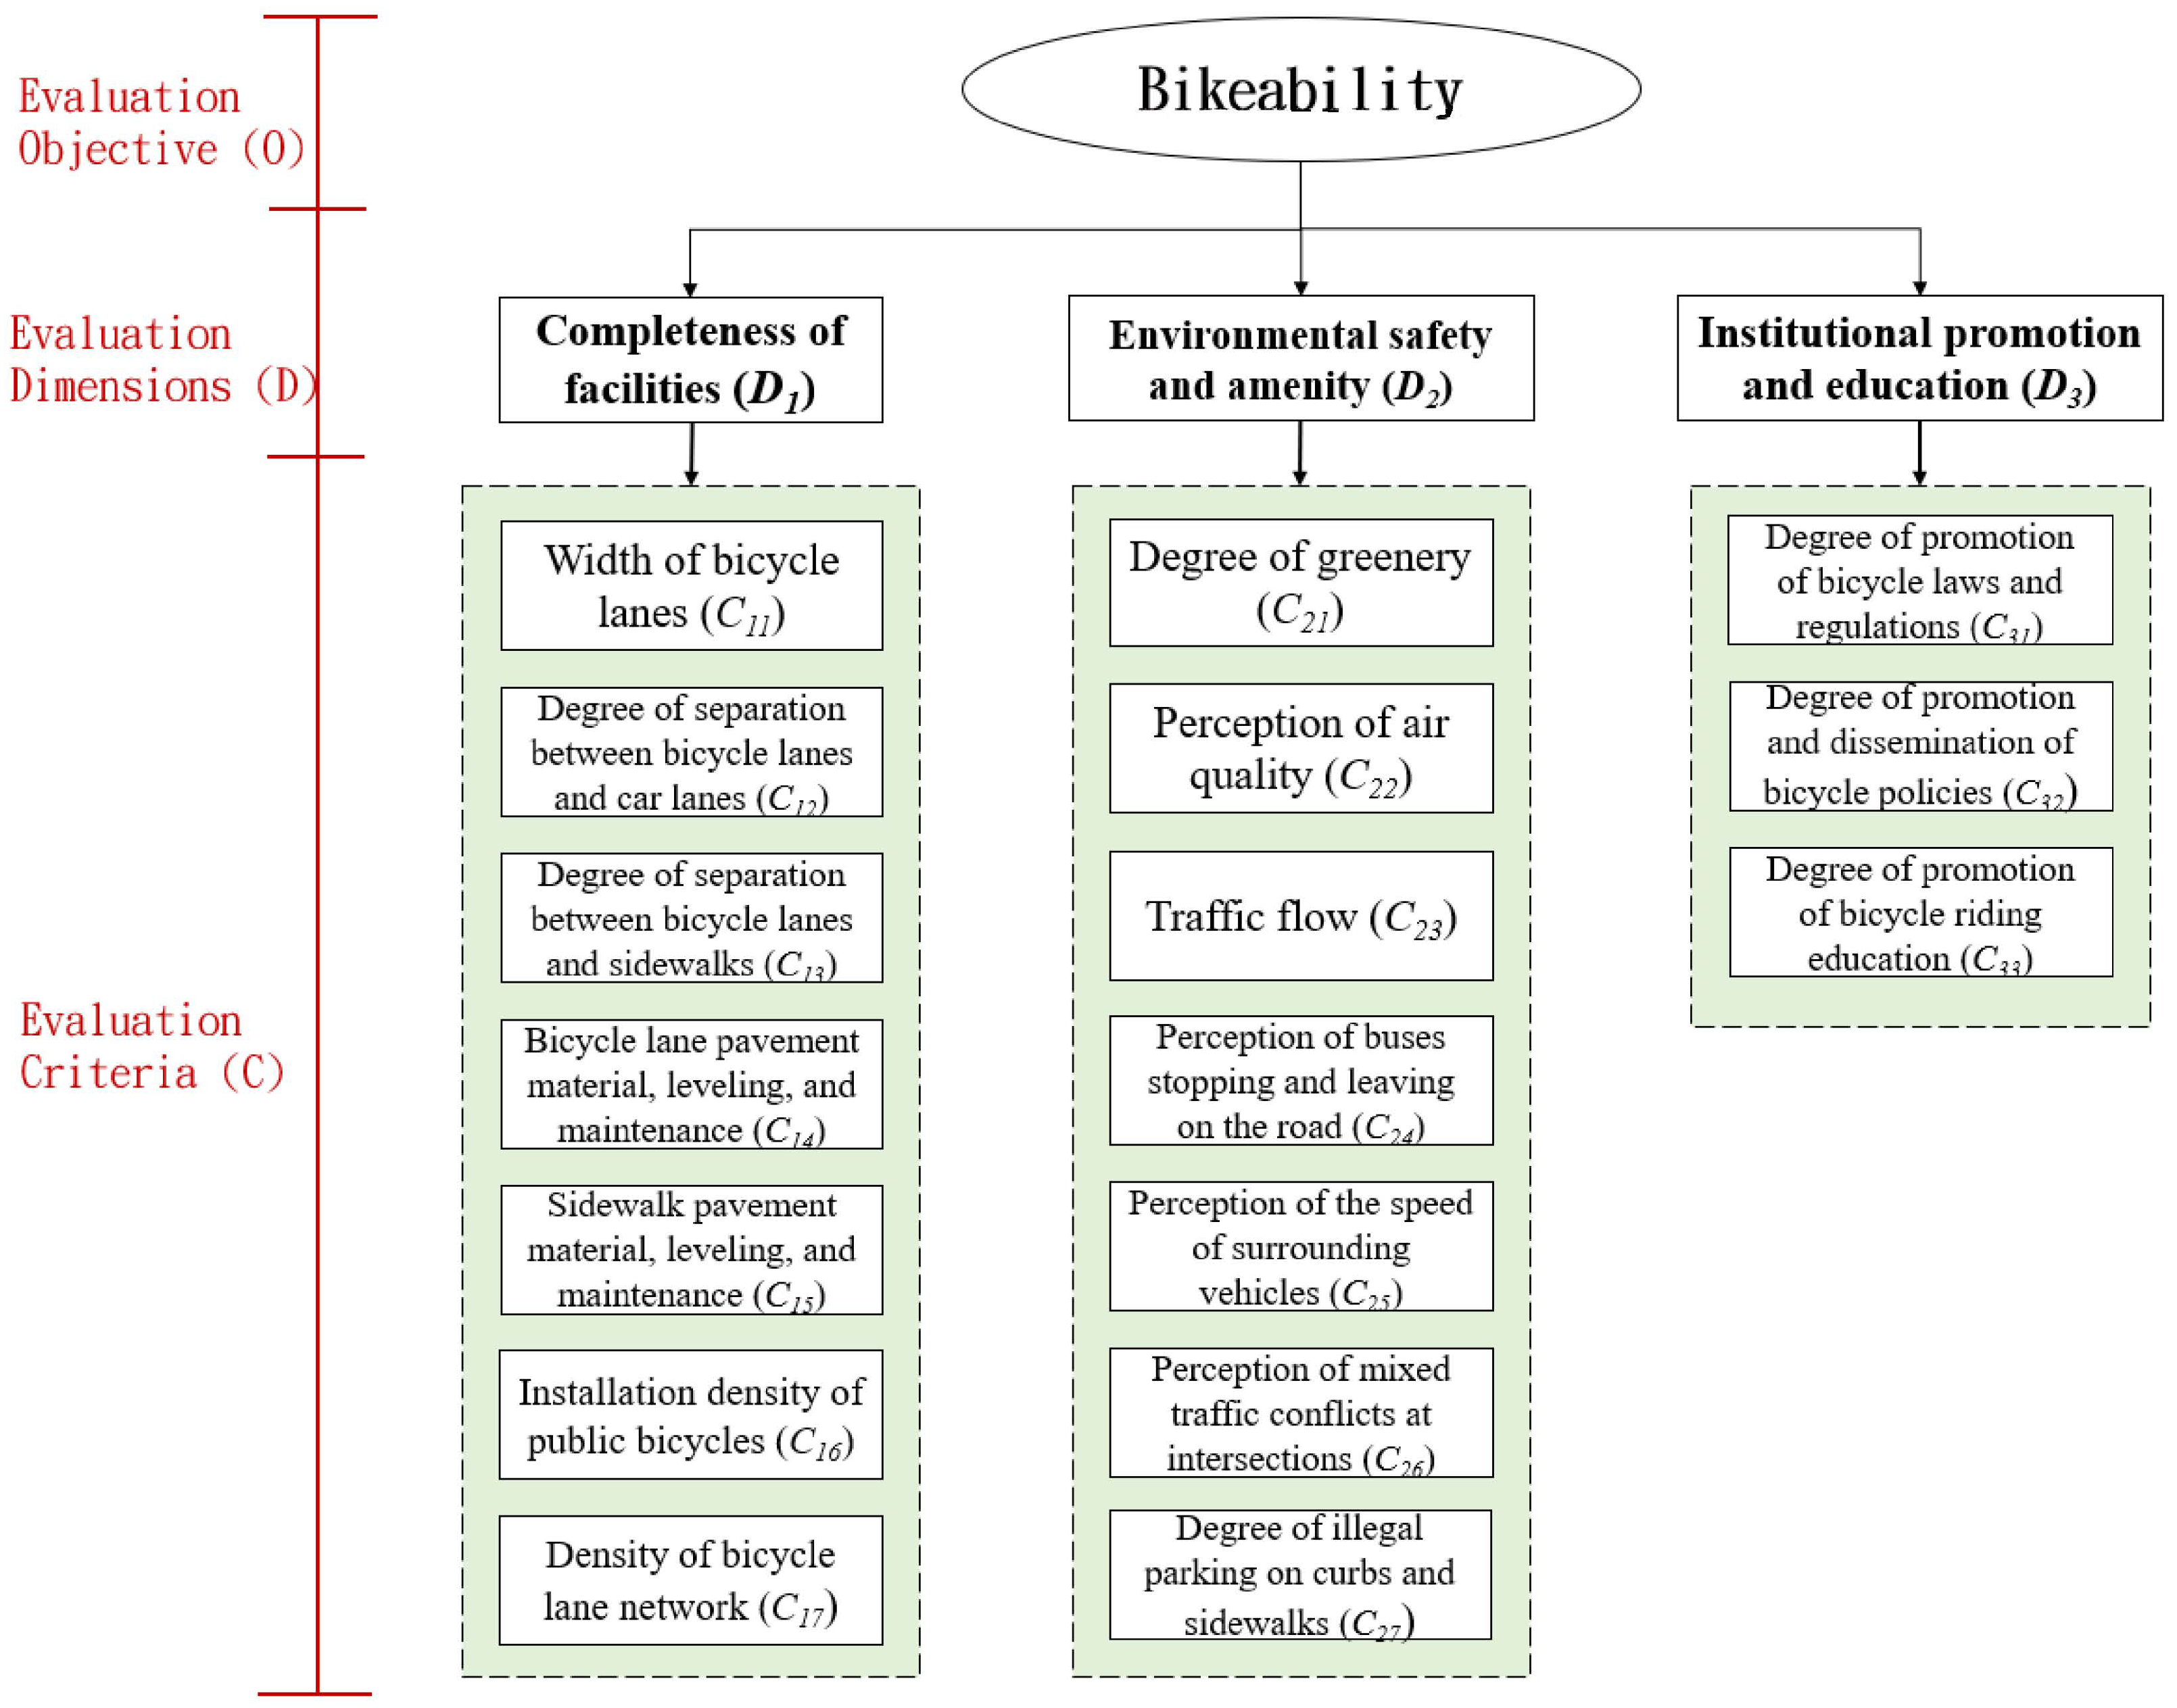
2.2. Framework of Bikeability Evaluation

There have been a large number of criteria used in previous studies on bikeability, but to explore bikeability more comprehensively, this study compiles the criteria and definitions used in previous studies and collects a total of 23 bikeability factors (Table 1). Based on the literature related to bikeability, this study proposes the definition of bikeability as “the degree of suitability of the overall environment for bicycle users to ride;”, and adopts the four dimensions of completeness of facilities, environmental safety and amenity, accessibility (connectivity), and institutional promotion and education, to construct the subsequent evaluation framework. The definitions of the dimensions are described as follows.
  • Completeness of facilities: consists of two parts, which are the completeness of traffic engineering facilities and the safety level around the bicycle riding environment [5];
  • Environmental safety and amenity: regarding riding comfort, safety, and environmental tranquility [7];
  • Accessibility (connectivity): connectivity between street networks to allow bicyclists to easily reach their destinations [6];
  • Institutional promotion and education: legal protection for safe riding, policies and safety education to encourage bicycle riding [7].

2.3. Evaluation Methods

Traditionally, the methods for constructing a bicycle bikeability evaluation framework can be roughly divided into three categories, namely, scale measurement methods [32], multi-criteria decision methods (MCDM) [6], and regression models [4,27,29]. Most of the research uses regression models to measure bikeability; however, this method can only capture the overall bikeability performance, but not the order and magnitude of improvement of bikeability factors in each city. In addition, constructing an evaluation framework in the form of a scale often presents the performance level of a single object or criterion. On the contrary, the multi-criteria decision method can calculate the relative weight of each criterion, and then use the performance evaluation method to measure the difference between the performance of each criterion and the ideal value, so that we can obtain the improvement priority. This study adopts the multi-criteria decision-making method to establish the evaluation framework, and then uses the performance evaluation method to actually measure the bikeability status.
MCDM is a method that helps decision-makers when they are faced with multiple and complex alternatives that are difficult to choose from. There are many MCDM methods, such as Analytic Hierarchy Process (AHP), Simple Multi-Attribute Rating Technique (SMART), Analytic Network Process (ANP), which can handle dependencies, Decision-making and Trial Evaluation Laboratory (DEMATEL), DEMATEL-based Analytic Network Process (DANP), etc. [33]. These methods require many pairwise comparisons, which makes the questionnaires complicated and time-consuming to fill out, and thus are prone to produce inconsistent results [34]. To address the problem of inconsistency, Rezaei developed the Best-Worst Method (BWM) in 2015 [35]. By comparing the remaining criteria with the best and worst criteria, all criteria are compared on a consistent basis, which can significantly reduce the number of pairwise comparisons to 2n − 3. However, conventional BWM has the disadvantage that only one expert evaluation result can be calculated at a time. To integrate all expert evaluation values, the arithmetic mean method must be used, but it is also susceptible to outliers, which can cause errors in the weighting results. To solve the disadvantage, Mohammadi and Rezaei developed the Bayesian Best-Worst Method (Bayesian BWM) in 2020 [36], which uses the concept of probability to integrate the opinions of experts. Since Bayesian BWM is an extension of BWM, it has all of the advantages of BWM, and at the same time, it can also produce visual graphics to clearly present the result of importance ranking among the criteria. Therefore, Bayesian BWM is used as the weight calculation method in this study.
In order to effectively invest resources in criteria that need improvement, most traditional studies use performance measurement to consider the priorities of improvement. The widely used performance evaluation methods are Elimination et Choix Traduisant La RÉalité (ELECTRE), Preference ranking organization method for enrichment evaluation (PROMETHEE), Technique for Order Preference by Similarity to Ideal Solution (TOPSIS), and VlseKriterijumska Optimizacija I Kompromisno Resenje, (VIKOR), complex proportional assessment (COPRAS), combined compromise solution (CoCoSo), etc., but ELECTRE cannot present the complete ranking of all alternatives [33,37,38,39]. The PROMETHEE needs many pairwise comparisons for alternatives corresponding to each criterion. The problem with TOPSIS is not easy to distinguish which alternative is closest to the ideal solution and there may exist blind spots [10]. Compared with the aforementioned methods, the results of VIKOR are acceptable to most decision-makers because it uses the concepts of maximizing group benefits and minimizing individual regrets to determine the optimal alternative [40].
Traditional VIKOR uses the best alternative among all as the benchmark, and then compares all alternatives with the best alternative. However, if all alternatives perform poorly, the best alternative can only be selected from all the poor alternatives, so the selected alternative is naturally not optimal. To solve this problem, Chang [41] developed the modified VIKOR, which uses the ideal value as the benchmark and compares all alternatives to the ideal value. Compared with the traditional VIKOR, the modified VIKOR can help the decision-maker to understand how much more effort and improvement should be made to achieve the desired target value, so the modified VIKOR is used as the performance evaluation method in this study.

3. Proposed Novel MCDM Model

The evaluation model proposed in this study consists of three stages. The first stage is to collect the opinions of experts by the questionnaires and establish the bikeability evaluation framework. Then, the Bayesian BWM is used to analyze and calculate the relative weights of the dimensions and criteria. Finally, the modified VIKOR is applied to evaluate the bicycle road environment in the two cities. Compared with AHP or FUCOM, the Bayesian BWM has advantages to obtain a consistent result and integrates various opinions in one programming. The modified VIKOR considers two different definitions of distances and the gaps to aspiration levels, which can reflect the real situations better than other methods such as original VIKOR, MOORA, TOPSIS, or Gray relation.

3.1. Developing the Framework of Bikeability

Through literature review, this study initially collected 23 bikeability-related factors. Then, a Likert 5-point scale survey was distributed to experts to determine the essential factors. After collecting the questionnaire data, the mean, quartile deviation, median, and standard deviation were obtained from the expert opinions to understand the frequency distribution of questions, the consistency of the questions, and the dispersion of the overall results. When the quartile deviation is less than or equal to 0.6, it means that the experts have reached a high level of agreement on the question; between 0.6 and 1.0, it means that the experts have reached a moderate level of agreement; and if the quartile deviation is greater than 1.0, it means that the experts have not reached a consensus on the question. Additionally, when the standard deviation is less than 1, it means that the dispersion of opinions among experts is low. In addition, when the Coefficient of Variance (C.V.) is ≤0.3, it means that the experts’ opinions are highly consistent; while 0.3 ≤ C.V. ≤ 0.5 means that the experts’ opinions are within the acceptable range; and when C.V. ≤ 0.5, the reason must be explained. To summarize the above criteria, the reference threshold values of mean greater than 3, standard deviation less than 1, and quartile deviation less than 0.6 were used as the basis for selecting critical evaluation criteria [42].

3.2. Bayesian BWM

Mohammadia and Rezaeia [36] proposed the Bayesian BWM in 2020 to calculate the optimal weights using the Bayesian probability concept and showed that it is feasible and meaningful to apply the concept of probability to the weighting calculations.
  • A typical weight vector is W = W j | j = 1 , 2 , , n , and each Wj is denoted as the corresponding weight value of Cj. From the perspective of probability, the criterion Cj can be considered as a random event, and the weight Wj is the probability of occurrence of each event
  • In a typical weight vector, j = 1 n W j = 1   and   W j 0 ; in terms of probability, the probability of occurrence of each event Cj (probability value) must be greater than or equal to 0 and sum up to 1.
The calculation steps of the Bayesian BWM are divided into five major steps, which are described as follows.
  • Step 1. Determine the set of evaluation criteria for the decision system.
The decision-maker or decision team develops n evaluation criteria that match the decision topic, C = C j | j = 1 , 2 , , n .
  • Step 2. Select the best and worst criteria.
Based on the n criteria developed in Step 1, each expert selects the best and worst criteria. The best and worst criteria selected are the key factors affecting the analysis results.
  • Step 3: Generate the BO (Best-to-Others) vectors by the pairwise comparisons of the best criteria with other criteria.
The decision-maker assesses the relative importance of the best criteria to other criteria. The evaluation scale ranges from 1 to 9, with Scale 1 being equally important and Scale 9 being absolutely important, which is the highest scale. The resulting BO vectors are as follows.
A B j = α B 1 , α B 2 , , α B n
where α B j indicates the importance of the best criterion B relative to the remaining criterion j, and the comparison of the best criterion with itself must be 1, i.e., α B B = 1 .
  • Step 4. Generate the OW (Others-to-Worst) vectors by the pairwise comparisons of the other criteria with the worst criterion.
The decision-maker assesses the relative importance of the other criteria to the worst criteria. The evaluation scale ranges from 1 to 9, with Scale 1 being equally important and Scale 9 being absolutely important, which is the highest scale. The resulting OW vectors are as follows.
A j W = α 1 W , α 2 W , , α n W T
where α j W indicates the importance of the other criterion j relative to the worst criterion W, and the comparison of the worst criterion with itself must be 1, i.e., α w w = 1 .
  • Step 5. Calculate the best weight of criteria for the group.
  • Step 5.1. Construct the joint probability distribution of group decisions.
Suppose there are k decision-makers, k = 1,2,…, K; evaluation criterion C j | j = 1 , 2 , , n ; the optimal weight of each decision-maker after the evaluation is W 1 : k ; the optimal group weight after aggregation is W a g g ; A B 1 : k represents the vector of the experts evaluating the best criterion compared with other criteria; similarly, A w 1 : k represents the vector of the experts evaluating other criteria compared to the worst criterion. The joint probability distribution function of group decision-making is as follows:
P ( W a g g , W 1 : k | A B 1 : k , A w 1 : k )
  • Step 5.2. Develop and compute the Bayesian network hierarchy model.
The optimal weight W 1 : k of each expert depends on the two sets of vectors A B 1 : k and A w 1 : k , and the optimal group weight W a g g depends on the optimal weight of each expert W 1 : k . The operation logic of the Bayesian network-level model is an iterative operation, which is carried out in the way of correcting the a priori probability by the posterior probability, that is, the vector values A B 1 : k and A w 1 : k evaluated by each expert will correct the probability value of W 1 : k , and W 1 : k will correct the probability value of W a g g .
According to the above concept, each variable is conditionally independent of the other, and the mathematical equation for the joint probability of the Bayesian level model is as follows.
P ( W a g g , W 1 : k | A B 1 : k , A w 1 : k ) P ( A B 1 : k , A w 1 : k | W a g g , W 1 : k ) P W a g g , W 1 : k
The optimal group weight w a g g obeys the Dirichlet distribution and the parameter is set to 1. The mathematical equation is as follows.
w a g g ~ D i r α
After the probability distribution of all parameters is constructed, the posterior probability distribution is calculated using Markov-chain Monte Carlo (MCMC) technique [43]. Therefore, the optimal group weight w a g g can be obtained according to the above calculation process, which only requires each expert to provide BO and OW vectors.
  • Step 5.3. Confidence test of ranking
Suppose a group of criteria C = C j | j = 1 , 2 , , n is evaluated, where two criteria are C i and C j . It is important to know whether the ranking results of the group weights are consistent with the evaluation of all decision-makers, so the concept of Credal Ranking is used to examine their confidence level, and the value of Credal Ranking is used to rank the criteria. The mathematical equation for the probability of C i outperforming C j is as follows.
P C i > C j = I ( w i a g g > w j a g g ) P w a g g
where P w a g g is the posterior probability of w a g g and I is the conditional parameter that is calculated when ( w i a g g > w j a g g ) holds, otherwise, it is 0. The confidence level is then calculated by the sample size Q obtained from MCMC, and its mathematical equations are as follows.
P C i > C j = 1 Q q = 1 Q I ( w i a g g q > w j a g g q )
P C j > C i = 1 Q q = 1 Q I ( w j a g g q > w i a g g q )
where W a g g q denotes the qth sample from MCMC. When P C i > C j > 0.5 , it means that criterion i is more important than criterion j, and the presented probability value is the confidence level, and since the sum of probability is 1, P C i > C j + P C j > C i = 1 .

3.3. Modified VIKOR

The steps for the modified VIKOR are described as follows.
  • Step 1. Establish positive and negative ideal solutions.
f i * = max j f i j | i ϵ I 1 , min j f i j | i ϵ I 2 , i
f i = min j f i j | i ϵ I 1 , max j f i j | i ϵ I 2 , i
In the above equation, j is each alternative, i is each evaluation criterion; f i j is the performance evaluation value of criterion i of the alternative j, which is obtained through the survey; I 1 is the set of evaluation criteria for benefit, I 2 is the set of evaluation criteria for cost; and f i * is the positive ideal value, as in Equation (9), and the value 100 is used in modified VIKOR as the aspiration level; f i is the negative ideal value, and the value 0 is used in modified VIKOR as the tolerable value, as in Equation (10).
  • Step 2. Establish the overall benefits and maximum individual regrets of the alternatives.
S j = i = 1 n W i f i * f i j / f i * f i
R j = m a x i W i f i * f i j / f i * f i ,   j = 1 , 2 , , n
Equation (11) mainly solves the overall benefit of the program ( S j ), while Equation (12) solves the maximum individual regret ( R j ), where W i is the relative weight value among the evaluation criteria, and in this study, W i is the relative weight value of each criterion derived from Bayesian BWM.
  • Step 3. Establish the comprehensive benefits of the alternatives.
Q j = v S j S * S S * + 1 v R j R * R R *
  • S * = min j S j , S = max j S j ; R * = min j R j , R = max j R j .
  • min j S j is the maximum group benefit; min j R j is the minimum individual regret.
  • Q j is the ratio of benefits that can be generated by option j. The smaller the value of Q j , the better the alternative is.
v is the decision mechanism coefficient. Usually, modified VIKOR will set v = 0.5 to maximize group benefit and minimize individual regret at the same time. Additionally, the S and R are set as 1 and S* and R* are set as 0. This change has advantage especially when the alternatives are few. Otherwise, the obtained gap to ideal solution will become 0 for a relatively good alternative, which is not reasonable. In this study, the Matlab and Microsoft Excel are used to analyze the bikeability of urban bicycle systems.

4. Empirical Research on Bikeability Evaluation

In this section, 23 preliminary criteria were firstly explored and compiled through a literature review, and the criteria that experts in various fields consider to be more important were selected. Then, the BBWM was used to find the weights of the dimensions and criteria.

4.1. Establishment of the Bikeability Evaluation Framework

In this study, 23 evaluation criteria were initially drafted after reviewing literature. According to [44], six to ten experts can have confident results for expert survey. To find the key criteria that affect bikeability, 18 experts (Table 2) from industrial, governmental and academic bicycle-related fields were invited to conduct the evaluation. We introduced the procedures of the survey and meanings of the questionnaire to experts. Then, each expert spent about one to one and a half hours answering the questions. The first survey was conducted through a 5-point Likert scale, and the selection of key criteria was conducted using the survey. In the two-stage selection process, experts’ opinions were first collected to revise the criterion titles, add new criteria, and merge criteria with similar definitions, and the revised criteria are as follows.
  • The criterion of “bicycle lane connectivity” is revised to “density of bicycle lane network”.
  • The definitions of “length of bicycle lanes” and “density of bicycle lane network” are similar, both are compared based on the same reference point (per square kilometer), but the concept of density of bicycle lane network has a wider scope, so “density of bicycle lane network” is left.
  • The new criterion “degree of separation between bicycle lanes and sidewalks” is added.
  • The criterion of “proportion of buses on the road” is revised to “perception of buses stopping and leaving on the road”.
  • The criterion of “degree of parking on curbs and sidewalks” is revised to “degree of illegal parking on curbs and sidewalks”.
In the second stage, conditions such as mean greater than 3, standard deviation less than 1, and quartile deviation less than 0.6 were used as reference thresholds for extracting essential criteria. A total of 6 criteria were deleted from the screening results (such as the criteria in gray shading in Table 3). The only criterion left in the dimension of “Accessibility and connectivity” was “Density of bicycle lane network”, so it was incorporated into the dimension of “Completeness of facilities”. The 23 criteria in the original evaluation framework of four dimensions were reduced to 17 criteria in three dimensions as shown in Figure 1.

4.2. Calculating the Criteria Group Weights with Bayesian BWM

After establishing the evaluation framework, the Bayesian BWM was used for weight analysis. In this study, experts were asked to select the best (most important) and worst (least important) dimensions and criteria based on their experience (corresponding to Step 2 in Section 3.3). Then, the BO (Best-to-Others) and OW (Others-to-Worst) vectors were generated by comparing the best and worst criteria with other criteria. Take Expert 1′s response as an example (as shown in Table 4), Expert 1 considered that the best dimension “Environmental safety and amenity” is about 2 times more important than the other dimension “Completeness of facilities”, so it is 2. “Environmental safety and amenity” is about 3 times more important than “Institutional promotion and education”, so it is 3 (corresponding to Steps 3 and 4 in Section 3.3). Similarly, taking Expert 1 as an example (as shown in Table 5), Expert 1 considered that the importance of the other dimension “Completeness of facilities” is about 2 times more important than the worst dimension “Institutional promotion and education”, so it is 2. The importance of the other dimension “Environmental safety and amenity” over the worst dimension “Institutional promotion and education” should be the same as the scale of Table 5, so it is 3.
Then, to estimate the optimal group weights of the 18 experts, the experts’ questionnaire data were integrated into two vectors, A B and A W , by using Equations (3)–(8) in Section 3.2 as inputs for the subsequent construction of the joint probability distribution of the group decision and for solving the Bayesian BWM. In the same way, the pairwise comparisons between the most important and other criteria and the pairwise comparisons between the least important and other criteria were obtained.
The results of the analysis are shown in Table 6. From the perspective of weighting for all the criteria, it can be found that among the 17 criteria evaluated on bikeability, the top five criteria with the highest weights are “Bicycle lane pavement material, leveling, and maintenance ( C 14 )”, “Width of bicycle lanes ( C 11 )”, “Degree of separation between bicycle lanes and car lanes ( C 12 )”, “Degree of separation between bicycle lanes and sidewalks ( C 13 )”, and “Perception of mixed traffic conflicts at intersections ( C 26 )”, and most of these criteria are criteria under the dimension “Completeness of facilities”, which means that experts agree that the first and foremost task to improve bikeability is to build good facilities for bicycle use.
The most important dimension is “Completeness of facilities ( D 1 )”, under which the criteria of “Bicycle lane pavement material, leveling, and maintenance ( C 14 )”, “Width of bicycle lanes ( C 11 )”, and “Degree of separation between bicycle lanes and car lanes ( C 12 )” are more important. The second important dimension is “Environmental safety and amenity ( D 2 )”, under which the criteria of “Perception of mixed traffic conflicts at intersections ( C 26 )”, “Perception of the speed of surrounding vehicles ( C 25 )”, and “Traffic flow ( C 23 )” are more important. The third important dimension is “Institutional promotion and education ( D 3 )”, under which the criterion “Degree of promotion of bicycle riding education ( C 33 )” is more important.

4.3. Using the Modified VIKOR to Calculate Urban Bikeability Performance

After obtaining the criteria weights, this study used Taipei City and New Taipei City as the cases of the empirical study. We applied modified VIKOR to examine the bicycle riding environment in both cities, and analyzed the difference between the performance and the ideal values in both cities to understand the improving priorities. In this study, experts were asked to evaluate the bikeability of Taipei City and New Taipei City on various criteria, and the scores of each bikeability criterion were averaged under each expert’s evaluation as shown in Table 7. Through Equations (11)–(13) in Section 3.3, these scores were first normalized, and then the weights calculated by Bayesian BWM in Section 3.3 were substituted into the normalized performance matrix to calculate the difference between the current performance and the ideal values in both cities, and then the priority improvement for each bikeability criterion was ranked (as shown in Table 8).
The first three improving priorities for the Taipei City and New Taipei City are same, which include “Bicycle lane pavement material, leveling, and maintenance”, “Perception of mixed traffic conflicts at intersections”, and “Degree of separation between bicycle lanes and sidewalks”. Therefore, this study classifies them as the “primary category for improvement”. In both cities, the improvement order of criteria 4 to 10 differs only in order. It can be seen that these 7 criteria are all criteria that both cities must continue to work on. This study classifies these seven criteria as the “secondary category for improvement”. In addition, the criteria in the order of improvement 11 to 17 are different in ranking, but they can still improve the overall urban bikeability through continuous efforts, so they are classified as the “fundamental category for improvement”.

5. Discussion

This section discusses the results of the study, firstly, the constructed bikeability evaluation framework is discussed, and then, based on the results of the difference analysis, suggestions for improving bikeability in the urban areas of Taipei City and New Taipei City are proposed.

5.1. Bikeability Evaluation Framework

From the above analysis, it can be found that the dimensions of evaluating bikeability can be divided into three dimensions: completeness of facilities, environmental safety and comfort, and institutional promotion and education. The framework obtained from our survey is similar to Lowry et al.’s [45]. The difference is this study additionally drafted the dimension of institutional promotion and education, which clearly point out that government authorities should actively build bicycle-related facilities, provide a bicycle-friendly environment, enhance the safety of the riding environment, effectively publicize the bicycle-related regulations that bicyclists should follow, and promote proper bicycle riding. Overall, most of the top 10 weighted criteria fall under the dimension “Completeness of facilities (D1)”. From the perspective of “Completeness of facilities”, the “Bicycle lane pavement material, leveling, and maintenance ( C 14 )”, “Width of bicycle lanes ( C 11 )”, and “Degree of separation between bicycle lanes and car lanes ( C 12 )” are the more important criteria, indicating that experts believe that the improvement of physical bicycle facilities in urban areas should give priority to the anti-slip, durable, and leveling of bicycle lane pavement, and that the existing width and separation of bicycle lanes should be adjusted. This result is similar to the results obtained by McNeil [31] using the city of Portland in the United States, and Winters et al. [6] using the city of Vancouver in Canada as the empirical research.
In terms of Environmental safety and amenity, the criteria of “Perception of mixed traffic conflicts at intersections ( C 26 )”, “Perception of the speed of surrounding vehicles ( C 25 )”, and “Traffic flow ( C 23 )” are more important, indicating that experts believe that while riding a bicycle, the flow and speed of surrounding cars and motorcycles are factors that greatly affect bicyclists’ sense of safety and comfort. Many empirical studies, such as the city of Isparta in Turkey [5], the city of Villacidro in Italy [26], and the state of Florida in the United States [9], show that safety and accident rates are the main factors affecting the willingness to use bicycles. Therefore, the proportion of road buses, the speed of surrounding vehicles, the feeling of mixed traffic conflict at intersections, and the degree of parking on roadsides and sidewalks are critical criteria for cyclists. For example, the door opening incident caused by parking on the side of the road, the oppressive feeling brought to the rider when the bus stops are all the factors that cyclists care [5,9,26,28].
The majority of literature mainly focus on safety, completeness of facilities, and the degree of convenience to destination. This study proposes an additional dimension of institutional promotion and education, in which the criterion of “Degree of promotion of bicycle riding education ( C 33 )” is an important issue. This shows that the bicycle riding safety education activities and lectures will influence whether the concept of bicycle riding is correct or not, which in turn affects urban bikeability.

5.2. Gap Analysis and Model Comparison

According to the findings, the three criteria that need urgent improvement in both Taipei City and New Taipei City are “Bicycle lane pavement material, leveling, and maintenance ( C 14 )”, “Perception of mixed traffic conflicts at intersections ( C 26 )”, and “Degree of separation between bicycle lanes and sidewalks ( C 13 )”. The results are echoed in [45,46]. It is suggested that the government authorities should replace the bicycle lane pavement with asphalt concrete or concrete with better water drainage and anti-slip properties to facilitate the safety and comfort of bicyclists and improve intersections with the concept of protected intersection to achieve the effect of traffic diversion and conflict relief. By designating dedicated bicycle lane markings, signs, colored paving, and setting up physical dividers with height differences, the right-of-way of bicycles, pedestrians, automobiles, and motorcycles can be effectively separated to improve bikeability.
Taipei City also needs to actively improve the aspects of “Perception of buses stopping and leaving on the road ( C 24 )”, “Traffic flow ( C 23 )”, “Perception of the speed of surrounding vehicles ( C 25 )”, “Degree of illegal parking on curbs and sidewalks ( C 27 )”, by adjusting traffic signals promptly to control the speed of vehicles, strengthening the enforcement of illegal parking on curbs and sidewalks, and designing slotted islands with the concept of protected intersections, to divert motorized vehicles, and relieve the pressure caused by the process of buses stopping and leaving on the road, as well as the feeling of traffic flow and the speed of surrounding vehicles. New Taipei City should actively improve the aspects of “Degree of separation between bicycle lanes and car lanes ( C 12 )” and “Width of bicycle lanes ( C 11 )”, and actively strengthen the hardware facilities by building facilities to separate bicycles and motor vehicles, checking the width of bicycle lanes, and expanding the bicycle lane network. Besides, both cities need to appropriately introduce bicycle riding education, policy promotion, and law enforcement, as well as continuously maintain street lighting and greenery, in order to improve the overall urban bicycle riding environment. At the same time, they should also introduce corresponding bicycle riding education (e.g., riding safety education, safety equipment wearing education, etc.) for different age groups to educate bicyclists on how to ride safely and correctly, and additionslly, they should also actively expand the density of public bicycle facilities to achieve the effect of encouraging bicycling. Moreover, street lighting, planting and greenery must be continuously maintained to improve the overall bikeability in the urban areas through continuous maintenance and construction of related projects.
To validate the robustness of our results, a comparison between our results and other MCDM methods was conducted as shown Table 9. The TOPSIS is based on the concept of Euclidean distance. The COPRAS is founded on the utility function. The CoCoSo method incorporates three different compromise aggregation functions to calculate the final ranking index. The ranking for all methods is the same, which indicates the reliability of our model. However, the original VIKOR shows zero gap for Taipei city that is not reasonable. This is because the original VIKOR uses relatively good concept as the benchmark, our modified model applies absolutely good concept as the benchmark. These results show the superiority of the proposed modified VIKOR.

6. Conclusions and Remarks

With the rise of global awareness of energy saving and carbon reduction, the development of green transportation has become the main policy in various countries. Encouraging bicycle riding is the core implementation strategy, and the important factor that affects people’s willingness to ride is the overall environment’s bikeability. It is necessary to establish a complete evaluation framework of urban bikeability. This study applied a hybrid model to investigate the bikeability of urban bicycle systems. The results indicate that completeness of facilities (D1) is the most important dimension with weight 0.40 and bicycle lane pavement material, leveling, and maintenance (C14) is the most essential criterion with weight 0.045. The contribution of this study is to propose a bikeability evaluation framework, collect opinions of experts from various fields, obtain the importance of the dimensions and criteria, and conducted the gap analysis for both cities. We also provide improving suggestions according to the analysis results. The results show that the overall bikeability of Taipei City is better than that of New Taipei City, but there are still many areas for improvement in both cities. This study suggests that both cities should replace the pavement with asphalt concrete or concrete with better water drainage and better slip resistance as soon as possible. They need to adjust the existing intersection design with the concept of protected intersections and designate special bicycle lane markings and signs. Except those strategies, paint colorful pavement, set up physical dividers with a height difference, adjust signs to control the speed of vehicles promptly, strengthen the enforcement of illegal parking on curbs and sidewalks, expand the bicycle lane network, introduce bicycle riding education for different age groups, and actively expand the density of public bicycle installations, and continuously maintain street lighting and greenery can improve the overall urban bikeability.
As with all methodologies, the introduced model also has some limitations. Whether the evaluation criteria selected by the collective selection of experts is consistent with the criteria identified by the general public still needs in-depth research. This study only analyzes the qualitative evaluation criteria. If quantitative data can be combined, a more complete analysis results can be reached. This study takes the whole urban area as the evaluation unit. If the evaluation can be carried out for smaller administrative regions, it should be able to explore more insight implications.
Although the preliminary results of this study on the evaluation of bikeability of urban bicycles have been obtained, we still have the following suggestions for the future studies:
  • In the future, when selecting important criteria, the survey can be conducted for different stakeholders to extract the essential criteria of bikeability.
  • Other methods can also be used to obtain the weights of interdependent dimensions and criteria.
  • Fuzzy theory or Grey theory can be applied to solve the uncertainty problem caused by discrete data and ambiguous information of experts’ opinions.

Author Contributions

C.-C.H., designed the research and wrote the paper. Y.-W.K., collected the data, verified the model, and administered the project. J.J.H.L., co-worked and made revisions to the paper. All authors have read and agreed to the published version of the manuscript.

Funding

This research received no external funding.

Data Availability Statement

Not applicable.

Conflicts of Interest

The authors declare no conflict of interest.

References

  1. Davis, S.C.; Boundy, R.G. Transportation Energy Data Book: Edition 39; Oak Ridge National Lab: Oak Ridge, TN, USA, 2021. [Google Scholar]
  2. Sun, D.; Zeng, S.; Lin, H.; Meng, X.; Yu, B. Can Transportation Infrastructure Pave a Green Way? A City-Level Examination in China. J. Clean. Prod. 2019, 226, 669–678. [Google Scholar] [CrossRef]
  3. Imperatives, S. Report of the World Commission on Environment and Development: Our Common Future; UN Documents Cooperation Circles: Washington, DC, USA, 1987. [Google Scholar]
  4. Arellana, J.; Saltarín, M.; Larrañaga, A.M.; González, V.I.; Henao, C.A. Developing an Urban Bikeability Index for Different Types of Cyclists as a Tool to Prioritise Bicycle Infrastructure Investments. Transp. Res. Part A Policy Pract. 2020, 139, 310–334. [Google Scholar] [CrossRef]
  5. Saplıoğlu, M.; Aydın, M.M. Choosing Safe and Suitable Bicycle Routes to Integrate Cycling and Public Transport Systems. J. Transp. Health 2018, 10, 236–252. [Google Scholar] [CrossRef]
  6. Winters, M.; Brauer, M.; Setton, E.M.; Teschke, K. Mapping Bikeability: A Spatial Tool to Support Sustainable Travel. Environ. Plan. B Plan. Des. 2013, 40, 865–883. [Google Scholar] [CrossRef]
  7. Lin, J.J.; Wei, Y.H. Assessing Area-Wide Bikeability: A Grey Analytic Network Process. Transp. Res. Part A Policy Pract. 2018, 113, 381–396. [Google Scholar] [CrossRef]
  8. Wang, K.; Akar, G. Street Intersection Characteristics and Their Impacts on Perceived Bicycling Safety. Transp. Res. Rec. 2018, 2672, 41–54. [Google Scholar] [CrossRef]
  9. Cai, Q.; Abdel-Aty, M.; Castro, S. Explore Effects of Bicycle Facilities and Exposure on Bicycle Safety at Intersections. Int. J. Sustain. Transp. 2021, 15, 592–603. [Google Scholar] [CrossRef]
  10. Opricovic, S.; Tzeng, G.H. Compromise Solution by MCDM Methods: A Comparative Analysis of VIKOR and TOPSIS. Eur. J. Oper. Res. 2004, 156, 445–455. [Google Scholar] [CrossRef]
  11. Shih, H.S.; Shyur, H.J.; Lee, E.S. An Extension of TOPSIS for Group Decision Making. Math. Comput. Model. 2007, 45, 801–813. [Google Scholar] [CrossRef]
  12. Moslem, S.; Campisi, T.; Szmelter-Jarosz, A.; Duleba, S.; Nahiduzzaman, K.M.; Tesoriere, G. Best–worst method for modelling mobility choice after COVID-19: Evidence from Italy. Sustainability 2020, 12, 6824. [Google Scholar] [CrossRef]
  13. Campisi, T.; Moslem, S.; Al-Rashid, M.A.; Tesoriere, G. Optimal urban planning through the best–worst method: Bicycle lanes in Palermo, Sicily. In Proceedings of the Institution of Civil Engineers-Transport; Thomas Telford Ltd.: London, UK, 7 November 2022; pp. 1–11. [Google Scholar]
  14. Li, L.; Wang, X.; Rezaei, J. A Bayesian Best-Worst Method-Based Multicriteria Competence Analysis of Crowdsourcing Delivery Personnel. Complexity 2020, 2020, 4250417. [Google Scholar] [CrossRef]
  15. Liu, P.; Hendalianpour, A.; Hamzehlou, M.; Feylizadeh, M.R.; Razmi, J. Identify and Rank the Challenges of Implementing Sustainable Supply Chain Blockchain Technology Using the Bayesian Best Worst Method. Technol. Econ. Dev. Econ. 2021, 27, 656–680. [Google Scholar] [CrossRef]
  16. Yang, J.J.; Chuang, Y.C.; Lo, H.W.; Lee, T.I. A Two-Stage MCDM Model for Exploring the Influential Relationships of Sustainable Sports Tourism Criteria in Taichung City. Int. J. Environ. Res. Public Health 2020, 17, 2319. [Google Scholar] [CrossRef] [PubMed]
  17. Ak, M.F.; Yucesan, M.; Gul, M. Occupational Health, Safety and Environmental Risk Assessment in Textile Production Industry through a Bayesian BWM-VIKOR Approach. Stoch. Environ. Res. Risk Assess. 2022, 36, 629–642. [Google Scholar] [CrossRef]
  18. Liang, X.; Chen, T.; Ye, M.; Lin, H.; Li, Z. A Hybrid Fuzzy BWM-VIKOR MCDM to Evaluate the Service Level of Bike-Sharing Companies: A Case Study from Chengdu, China. J. Clean. Prod. 2021, 298, 126759. [Google Scholar] [CrossRef]
  19. Chiu, W.Y.; Tzeng, G.H.; Li, H.L. A New Hybrid MCDM Model Combining DANP with VIKOR to Improve E-Store Business. Knowl. Based Syst. 2013, 37, 48–61. [Google Scholar] [CrossRef]
  20. Alsalem, M.A.; Zaidan, A.A.; Zaidan, B.B.; Albahri, O.S.; Alamoodi, A.H.; Albahri, A.S.; Mohsin, A.H.; Mohammed, K.I. Multiclass Benchmarking Framework for Automated Acute Leukaemia Detection and Classification Based on BWM and Group-VIKOR. J. Med. Syst. 2019, 43, 212. [Google Scholar] [CrossRef] [PubMed]
  21. Huang, S.W.; Liou, J.J.; Chuang, H.H.; Tzeng, G.H. Using a Modified VIKOR Technique for Evaluating and Improving the National Healthcare System Quality. Mathematics 2021, 9, 1349. [Google Scholar] [CrossRef]
  22. Forsyth, A. What is a Walkable Place? The Walkability Debate in Urban Design. Urban Des. Int. 2015, 20, 274–292. [Google Scholar] [CrossRef]
  23. Castañon, U.N.; Ribeiro, P.J. Bikeability and Emerging Phenomena in Cycling: Exploratory Analysis and Review. Sustainability 2021, 13, 2394. [Google Scholar] [CrossRef]
  24. Harkey, D.L.; Reinfurt, D.W.; Knuiman, M.; Stewart, J.R.; Sorton, A. Development of the Bicycle Compatibility Index: A Level of Service Concept, Final Report (No. FHWA-RD-98-072); Federal Highway Administration: Washington, DC, USA, 1998.
  25. Carter, D.L.; Hunter, W.W.; Zegeer, C.V.; Stewart, J.R.; Huang, H. Bicyclist Intersection Safety Index. Transp. Res. Rec. 2007, 2031, 18–24. [Google Scholar] [CrossRef]
  26. Fancello, G.; Carta, M.; Fadda, P. Road Intersections Ranking for Road Safety Improvement: Comparative Analysis of Multi-Criteria Decision Making Methods. Transp. Policy 2019, 80, 188–196. [Google Scholar] [CrossRef]
  27. Foster, N.; Monsere, C.M.; Dill, J.; Clifton, K. Level-of-Service Model for Protected Bike Lanes. Transp. Res. Rec. 2015, 2520, 90–99. [Google Scholar] [CrossRef]
  28. Porter, A.K.; Kohl III, H.W.; Pérez, A.; Reininger, B.; Pettee Gabriel, K.; Salvo, D. Bikeability: Assessing the Objectively Measured Environment in Relation to Recreation and Transportation Bicycling. Environ. Behav. 2020, 52, 861–894. [Google Scholar] [CrossRef]
  29. Tran, P.T.; Zhao, M.; Yamamoto, K.; Minet, L.; Nguyen, T.; Balasubramanian, R. Cyclists’ Personal Exposure to Traffic-Related Air Pollution and Its Influence on Bikeability. Transp. Res. Part D Transp. Environ. 2020, 88, 102563. [Google Scholar] [CrossRef]
  30. Beura, S.K.; Kumar, N.K.; Bhuyan, P.K. Level of Service for Bicycle Through Movement at Signalized Intersections Operating Under Heterogeneous Traffic Flow Conditions. Transp. Dev. Econ. 2017, 3, 21. [Google Scholar] [CrossRef]
  31. McNeil, N. Bikeability and the 20-min Neighborhood: How Infrastructure and Destinations Influence Bicycle Accessibility. Transp. Res. Rec. 2011, 2247, 53–63. [Google Scholar] [CrossRef]
  32. Wahlgren, L.; Schantz, P. Exploring Bikeability in a Metropolitan Setting: Stimulating and Hindering Factors in Commuting Route Environments. BMC Public Health 2012, 12, 168. [Google Scholar] [CrossRef] [PubMed]
  33. Velasquez, M.; Hester, P.T. An Analysis of Multi-Criteria Decision Making Methods. Int. J. Oper. Res. 2013, 10, 56–66. [Google Scholar]
  34. Yang, Y.P.O.; Shieh, H.M.; Leu, J.D.; Tzeng, G.H. A Novel Hybrid MCDM Model Combined with DEMATEL and ANP with Applications. Int. J. Oper. Res. 2008, 5, 160–168. [Google Scholar]
  35. Rezaei, J. Best-Worst Multi-Criteria Decision-Making Method. Omega 2015, 53, 49–57. [Google Scholar] [CrossRef]
  36. Mohammadi, M.; Rezaei, J. Bayesian Best-Worst Method: A Probabilistic Group Decision Making Model. Omega 2020, 96, 102075. [Google Scholar] [CrossRef]
  37. Sabaei, D.; Erkoyuncu, J.; Roy, R. A Review of Multi-Criteria Decision Making Methods for Enhanced Maintenance Delivery. Procedia CIRP 2015, 37, 30–35. [Google Scholar] [CrossRef]
  38. Ecer, F.; Pamucar, D. Sustainable supplier selection: A novel integrated fuzzy best worst method (F-BWM) and fuzzy CoCoSo with Bonferroni (CoCoSo’B) multi-criteria model. J. Clean. Prod. 2021, 266, 121981. [Google Scholar] [CrossRef]
  39. Dhiman, H.S.; Deb, D. Fuzzy TOPSIS and fuzzy COPRAS based multi-criteria decision making for hybrid wind farms. Energy 2020, 202, 117755. [Google Scholar] [CrossRef]
  40. Opricovic, S. Multicriteria Optimization of Civil Engineering Systems. Ph.D. Thesis, Faculty of Civil Engineering, Belgrade, Serbia, 1998; pp. 5–21. [Google Scholar]
  41. Chang, C.L. A Modified VIKOR Method for Multiple Criteria Analysis. Environ. Monit. Assess. 2010, 168, 339–344. [Google Scholar] [CrossRef]
  42. Chang, P.C.; Tsou, N.T.; Yuan, B.J.C.; Huang, C.C. Development trends in Taiwan’s opto-electronics industry. Technovation 2022, 22, 161–173. [Google Scholar] [CrossRef]
  43. Gilks, W.R.; Richardson, S.; Spiegelhalter, D. Markov Chain Monte Carlo in Practice; CRC Press: Boca Raton, FL, USA, 1995. [Google Scholar]
  44. Lowry, M.B.; Callister, D.; Gresham, M.; Moore, B. Assessment of Communitywide Bikeability with Bicycle Level of Service. Transp. Res. Rec. 2012, 2314, 41–48. [Google Scholar] [CrossRef]
  45. Sam Schwartz Consulting, L.L.C. Separated Bike Lane Planning and Design Guide (No. FHWA-HEP-15-025); Federal Highway Administration (US): Washington, DC, USA, 2015.
  46. Vafadarnikjoo, A.; Ahmadi, H.B.; Liou, J.J.H.; Botelho, T.; Chalvatzis, K. Analyzing Blockchain Adoption Barriers in Manufacturing Supply Chains by the Neutrosophic Analytic Hierarchy Process. Ann. Oper. Res. 2021. [CrossRef]
Figure 1. Bikeability evaluation framework.
Axioms 12 00155 g001
Table 1. Proposed dimensions and criteria for bikeability evaluation.
DimensionCriterionDescriptionReferences
Completeness of facilitiesLength of bicycle lanesThe length of dedicated bicycle lanes in the urban area (bicycle lanes include bicycle lanes for both pedestrians and bicycles, and dedicated bicycle lanes).[4,6,7]
Width of bicycle lanesThe width of dedicated bicycle lanes in the urban area (bicycle lanes include bicycle lanes for both pedestrians and bicycles, and dedicated bicycle lanes).[24,27]
Degree of separation between the bicycle lanes and the “car lanes”The degree to which bicycle lanes and car lanes are separated in the urban area (bicycle lanes include bicycle lanes for both pedestrians and bicycles, and dedicated bicycle lanes).[5,28]
Bicycle lane pavement material, leveling, and maintenanceThe pavement material, leveling, and maintenance level of the bicycle lanes designated by the government in the urban area (bicycle lanes include bicycle lanes for both pedestrians and bicycles, and dedicated bicycle lanes).[6,28]
Density of bicycle parking racksPercentage of bicycle racks in the urban area.[4,26,29]
Sidewalk widthThe width of the sidewalk in the urban area (bicycles are allowed to ride on sidewalks in Taiwan, but priority must be given to pedestrians).[6,7]
Sidewalk pavement material, leveling, and maintenanceThe pavement material, leveling, and maintenance of the sidewalks designated by the government in the urban area.[7]
Degree of street lighting (at night)The level of street lighting in the urban area (at night).[30]
Installation density of public bicyclesThe installation density of public bicycles (Youbike) in the urban area.[4,5]
Environmental safety and amenityDegree of greeneryThe degree of greenery in the urban area.[29]
Perception of air qualityThe perception of air quality in the urban area.[29,30]
Traffic flowThe number of vehicles on the roads in the urban area (when the space for bicycle riding is “non-dedicated bicycle lanes”, the number of vehicles on the roads will affect the riding perception).[31]
Proportion of buses on the roadThe ratio of buses to the total traffic flow on roads in the urban area (when buses stop at stops, there is a possibility of oppressing bicyclists).[26]
Perception of the speed of surrounding vehiclesThe perception of the speed of the surrounding traffic when riding a bicycle.[27,30]
Perception of mixed traffic conflicts at intersectionsThe perception of conflict felt by bicyclists due to mixed traffic at intersections.[6]
Degree of parking on curbs and sidewalksThe number of illegal parking on curbs and sidewalks in the urban area.[5,30]
Accessibility (connectivity)Degree of mixed use of landThe greater the mixed use of land in the urban area, the more diverse the services and facilities in the area, which can increase the desire to ride a bicycle.[5,30,31]
Number of intersections (connectivity of transportation network)More intersections mean better road connectivity, allowing bicyclists to reach their desired destinations easily.[29]
Bicycle lane connectivityThe length of bicycle lanes per square kilometer in the urban area (bicycle lanes include bicycle lanes for both pedestrians and bicycles and dedicated bicycle lanes).[6,9,30]
Institutional promotion and educationDegree of enforcementThe degree of traffic enforcement in the city (e.g., failure to yield to pedestrians, running red lights, and driving in the opposite direction).[5,6,29]
Degree of promotion of bicycle laws and regulationsThe government’s promotion of bicycle laws and regulations (e.g., no bicycle riding on pedestrian crossings).[5,6]
Degree of promotion and dissemination of bicycle policiesThe government promotes and publicizes bicycle-related policies (e.g., improvement of bicycle riding space, bicycle route inquiry, and public bicycle monthly pass discount program).[7]
Degree of promotion of bicycle riding educationThe government plans bicycle education for different age groups (e.g., bicycle safety education and training, safety gear education, etc.).[5]
Table 2. Backgrounds of experts.
WorksiteEducationYears of Experience in Related FieldsNumber of Experts
GovernmentMasterWithin 5 years (including 5 years)2
PhDMore than 10 years5
More than 10 years2
IndustryBachelorMore than 10 years2
PhDMore than 10 years3
AcademicPhDMore than 10 years4
Table 3. Criteria screening in bikeability evaluation.
Dimension/CriteriaMeanSDQD
Completeness of facilities
Length of bicycle lanes4.80.420.00
Width of bicycle lanes 4.50.550.25
Degree of separation between the bicycle lanes and the “car lanes” 3.80.730.25
Degree of separation between the bicycle lanes and the “sidewalks”4.60.710.25
Bicycle lane pavement material, leveling, and maintenance4.30.820.25
Density of bicycle parking racks2.20.980.50
Degree of illegal parking on curbs and sidewalks3.80.740.25
Sidewalk width2.80.900.50
Sidewalk pavement material, leveling, and maintenance2.70.890.50
Degree of street lighting (at night) 4.80.380.00
Installation density of public bicycles3.80.780.25
Environmental safety and amenity
Degree of greenery 3.60.810.50
Perception of air quality3.20.880.50
Traffic flow3.80.710.25
Perception of buses stopping and leaving on the road3.90.800.25
Degree of mixed use of land4.10.690.25
Number of intersections (connectivity of transportation network) 4.30.770.25
Accessibility and connectivity
Degree of mixed use of land2.60.990.50
Number of intersections (connectivity of transportation network) 2.50.940.50
Density of bicycle lane network3.80.720.00
Institutional promotion and education
Degree of enforcement2.60.980.50
Degree of promotion of bicycle laws and regulations4.20.740.25
Degree of promotion and dissemination of bicycle policies4.20.700.25
Degree of promotion of bicycle riding education4.00.710.25
Table 4. BO vectors of the three dimensions.
ExpertBest Dimension Completeness   of   Facilities   ( D 1 ) Environmental   Safety   and   Amenity   ( D 2 ) Institutional   Promotion   and   Education   ( D 3 )
1 D 2 213
2 D 1 147
3 D 1 158
4 D 3 851
5 D 1 168
6 D 3 581
7 D 2 314
8 D 1 158
9 D 2 213
10 D 2 213
11 D 1 125
12 D 2 613
13 D 3 621
14 D 2 412
15 D 3 321
16 D 2 213
17 D 1 135
18 D 1 163
Table 5. OW vectors of the three dimensions.
ExpertWorst Dimension Completeness   of   Facilities   ( D 1 ) Environmental   Safety   and   Amenity   ( D 2 ) Institutional   Promotion   and   Education   ( D 3 )
1 D 3 231
2 D 3 721
3 D 3 821
4 D 1 138
5 D 3 821
6 D 2 218
7 D 3 241
8 D 3 821
9 D 3 231
10 D 3 231
11 D 3 541
12 D 1 153
13 D 2 214
14 D 3 541
15 D 1 163
16 D 1 142
17 D 3 761
18 D 2 315
Table 6. Weighted results from the Bayesian BWM calculation.
DimensionLocal WeightCriterionLocal WeightGlobal WeightRank
Completeness of facilities (D1)0.4003Width of bicycle lanes (C11)0.07530.03012
Degree of separation between bicycle lanes and car lanes (C12)0.07280.02913
Degree of separation between bicycle lanes and sidewalks (C13) 0.07240.02904
Bicycle lane pavement material, leveling, and maintenance (C14)0.11390.04561
Sidewalk pavement material, leveling, and maintenance (C15)0.05460.02197
Installation density of public bicycles (C16)0.05100.02048
Density of bicycle lane network (C17)0.06030.02416
Environmental safety and amenity (D2)0.3455Degree of greenery (C21)0.03200.011115
Perception of air quality (C22)0.04040.014013
Traffic flow (C23)0.05660.019610
Perception of buses stopping and leaving on the road (C24)0.05400.018711
Perception of the speed of surrounding vehicles (C25)0.05870.02039
Perception of mixed traffic conflicts at intersections (C26)0.07680.02655
Degree of illegal parking on curbs and sidewalks (C27)0.05270.018212
Institutional promotion and education (D3)0.2542Degree of promotion of bicycle laws and regulations (C31)0.03440.008717
Degree of promotion and dissemination of bicycle policies (C32)0.04200.010716
Degree of promotion of bicycle riding education (C33)0.05200.013214
Table 7. The performance of bikeability in two cities.
CriterionTaipei CityNew Taipei City
Width of bicycle lanes (C11)7653
Degree of separation between bicycle lanes and car lanes (C12)7347
Degree of separation between bicycle lanes and sidewalks (C13) 6343
Bicycle lane pavement material, leveling, and maintenance (C14)7658
Sidewalk pavement material, leveling, and maintenance (C15)8066
Installation density of public bicycles (C16)8474
Density of bicycle lane network (C17)7352
Degree of greenery (C21)6848
Perception of air quality (C22)6051
Traffic flow (C23)5374
Perception of buses stopping and leaving on the road (C24)5972
Perception of the speed of surrounding vehicles (C25)4661
Perception of mixed traffic conflicts at intersections (C26)4867
Degree of illegal parking on curbs and sidewalks (C27)4667
Degree of promotion of bicycle laws and regulations (C31)4846
Degree of promotion and dissemination of bicycle policies (C32)5853
Degree of promotion of bicycle riding education (C33)5147
Table 8. Improving priorities of bikeability in two cities.
CriterionGapImprovement Priority
Taipei CityNew Taipei CityTaipei CityNew Taipei City
Width of bicycle lanes (C11)0.0150.03085
Degree of separation between bicycle lanes and car lanes (C12)0.0160.03274
Degree of separation between bicycle lanes and sidewalks (C13) 0.0230.03533
Bicycle lane pavement material, leveling, and maintenance (C14)0.0240.04211
Sidewalk pavement material, leveling, and maintenance (C15)0.0090.0161211
Installation density of public bicycles (C16)0.0070.0111715
Density of bicycle lane network (C17)0.0140.0241010
Degree of greenery (C21)0.0070.0121614
Perception of air quality (C22)0.0130.0161312
Traffic flow (C23)0.0230.01356
Perception of buses stopping and leaving on the road (C24)0.0190.01347
Perception of the speed of surrounding vehicles (C25)0.0280.02069
Perception of mixed traffic conflicts at intersections (C26)0.0380.02422
Degree of illegal parking on curbs and sidewalks (C27)0.0250.01598
Degree of promotion of bicycle laws and regulations (C31)0.0320.0341417
Degree of promotion and dissemination of bicycle policies (C32)0.0330.0371516
Degree of promotion of bicycle riding education (C33)0.0560.0611113
Table 9. Comparison with other methods.
VIKORModified
VIKOR
TOPSISCOPRASCOCOSO
Taipei City0 (1)0.070 (1)0.64 (1)0.19 (1)5.63 (1)
New Taipei City1 (2)0.085 (2)0.36 (2)0.16 (2)1.22 (2)
Note: The parentheses represent the ranking.
Disclaimer/Publisher’s Note: The statements, opinions and data contained in all publications are solely those of the individual author(s) and contributor(s) and not of MDPI and/or the editor(s). MDPI and/or the editor(s) disclaim responsibility for any injury to people or property resulting from any ideas, methods, instructions or products referred to in the content.

