Abstract
To quantitatively identify internal wire breakage damage in mining wire ropes, a wire rope internal wire breakage signal identification method is proposed. First, the whale optimization algorithm is used to find the optimal value of the variational mode decomposition parameter [ to obtain the optimal combination of the parameters, which reduces the signal noise with a signal-to-noise ratio of 29.29 dB. Second, the minimum envelope entropy of the noise reduction signal is extracted and combined with the time-domain features (maximum and minimum) and frequency-domain features (frequency–amplitude average, average frequency, average power) to form a fusion feature set. Finally, we use a particle swarm optimization–least squares support vector machine model to identify the internal wire breakage of wire ropes. The experimental results show that the method can effectively identify the internal wire rope breakage damage, and the average recognition rate is as high as 99.32%, so the algorithm can greatly reduce the system noise and effectively identify the internal damage signal of the wire rope, which is superior to a certain extent.
MSC:
94A12
1. Introduction
Wire ropes are widely used in modern industrial production equipment; in particular, they are important parts of the coal mine hoisting and traction systems. Owing to their critical function, wire ropes must possess a large safety factor, good elasticity, and high load-bearing capacity. The use environments of wire ropes are typically harsh, and they often bear complex and changeable loads. As a result, wire rope breakage commonly occurs, endangering the safety of personnel and the healthy operation of the overall system, causing severe economic losses [1,2,3,4]. Hence, the rapid detection of wire breakage and its location is essential for the safety of rope operation. However, the collected wire rope damage signal is affected by the background magnetic field, wire rope fluctuation noise and other factors, which change randomly; larger noise may even affect the feature vector when the damage is small, making wire rope damage detection and identification difficult [5,6,7]. Therefore, to improve the accuracy of the internal damage signal identification of a wire rope, this study proposes a new signal noise reduction and internal damage quantitative identification method.
Due to the mine environment, noise and other factors have an impact on the wire rope detection signal, making it difficult to distinguish between normal wire rope signals and damaged wire rope signals. Therefore, in order to facilitate the accurate identification and analysis of internal damage to the wire rope, the noise reduction in the damage detection signal is particularly important. Empirical modal decomposition (EMD) [8,9,10], wavelet transform (WT) [11,12], and variational mode decomposition (VMD) [13,14,15,16] are conventional noise reduction methods. The EMD technique is susceptible to modal confusion due to the envelope value, and the wavelet basis function of the WT method requires a manual selection and is less adaptive. Meanwhile, the traditional variational mode decomposition technique can suppress the modal confusion; however, the accuracy of its adaptive parameter selection is generally low. Many researchers have used these methods to suppress the noise in the collected signal and obtained good results. Therefore, this study uses the VMD method to decompose and reduce the noise of the collected internal damage signal of the wire rope. In addition, the whale optimization algorithm (WOA) is used for parameter search optimization of the VMD method, which effectively improves the signal-to-noise ratio and recognition accuracy.
Convolutional neural networks (CNNs) [17,18,19], extreme learning machines (ELMs) [20,21,22], and support vector machines (SVMs) [23,24] are frequently used for quantitative recognition. The recognition performance of CNNs is influenced by various parameters (such as the number of layers and nodes) and sample size, which often produce local minima during recognition. ELMs can effectively handle nonlinearities in the recognition process; however, they are able to detect only empirical hazards, exhibit poor generalization capabilities, and are very prone to overfitting. In contrast, SVMs can solve complex problems under unconstrained conditions with a small sample size and quick response. Suykens [25] improved the SVM and proposed the least squares support vector machine (LSSVM), which replaced the non-equation constraint in the SVM with the equation constraint, which considerably reduced the solution difficulty and has been widely used in industrial intelligence [26,27]. Zhang, K. et al. [28] used a compressor fault diagnosis test experimental platform to obtain fault signals, and used the PCA algorithm to extract the feature data in the fault signals as inputs to the fault diagnostic model, and the proposed fault diagnostic system can effectively identify the compressor fault diagnosis. Guan, S et al. [29] used the orthogonal wavelet packet decomposition algorithm to decompose the raw signals of industrial systems, and then extracted the features to be input into the LSSVM model for classification and identification, and the effectiveness of the method was verified through experiments and input into the LSSVM model for classification and identification, and the effectiveness of the method was verified through experiments. Gao, S et al. [30] fused singular entropy, energy entropy and arrangement entropy to obtain the complementary features, combined with the PSO algorithm to optimize the LSSVM, and successfully accomplished the diagnosis of the bearing faults. In addition, in the research of machine learning modeling, different algorithms arrive at different conclusions for different research problems, and it is very meaningful to apply the LSSVM model to wire rope damage identification; therefore, this paper adopts particle swarm to optimize the parameters of the LSSVM model and uses the optimized LSSVM model for the identification of internal damage of wire rope.
In summary, most of the above studies are conducted to detect surface defects of wire ropes, and there are fewer studies on the internal wire breakage damage of wire ropes; in terms of signal processing, the adaptive effect of wavelet transform is poor, and there is a modal aliasing phenomenon in EMD; in terms of quantitative identification, the neural network is very easy to fall into the local minima, the limit learning machine has a weak ability of generalization, and it is easy the overfitting problem can easily occur. The support vector machine to solve the non-equation problem is rather complex; therefore, this study proposes a WOA-optimized VMD algorithm to reduce the noise generated when detecting internal wire-break damage of wire ropes. Finally, a PSO–LSSVM-based wire rope internal wire-break damage identification method is proposed for accurately identifying the internal wire-break damage of wire ropes. Its main contributions are summarised as follows:
This paper analyzes the noise of the wire rope's internal broken wire damage signal from the frequency domain perspective and proposes the WOA–VMD noise reduction algorithm for this noise. At the same time, the noise reduction algorithm is compared with the wavelet thresholding noise reduction and complete ensemble empirical mode decomposition with adaptive noise (CEEMDAN) and VMD algorithms, and the noise reduction effect of this research algorithm is significantly better than the other three algorithms, so this research noise reduction algorithm has a certain degree of superiority.
This work is based on the wire rope inspection system, and a significant amount of actual and reliable data regarding internal wire rope damage have been collected. Meanwhile, various frequency domain parameters (average frequency amplitude, frequency, and power), time domain characteristics (maximum and minimum), and minimum envelope entropies were extracted to form a fused feature set, and the outcomes of various feature sets were discussed.
After feature extraction, we used the WOA–VMD-PSO–LSSVM model to identify the wire rope internal wire breakage signal, which no one has applied in the field of wire rope identification, and at the same time, compared it with three other methods, namely the WOA–VMD-KNN algorithm, the WOA–VMD-SVM algorithm, and the WOA–VMD-LSSVM algorithm; the method is obviously superior to the other three methods.
The remainder of this article is organized as follows. Section 2 describes the WOA–VMD and PSO–LSSVM algorithms. Section 3 outlines a procedure for identifying the internal damage in wire ropes. In Section 4, simulated signals are created to verify the effectiveness of the algorithms discussed in this paper. In Section 5, experiments are conducted to examine the noise reduction effect and detection rate of the proposed algorithms. Finally, conclusions from the obtained results are drawn in Section 6.
2. Theoretical Basis
2.1. Principle of Wire Rope Damage Detection
In practical engineering, in order to better simulate the analysis, it is usually assumed that the wire rope damage is a section of infinite length and perpendicular to the direction of the magnetization of the external magnetic field H0 rectangular groove. According to the spontaneous magnetization of the magnetic domains in the wire rope defect on both sides of the uniform distribution of “magnetic charge”, the two walls of the magnetic charge are magnetic opposites; the theoretical model is shown in Figure 1.
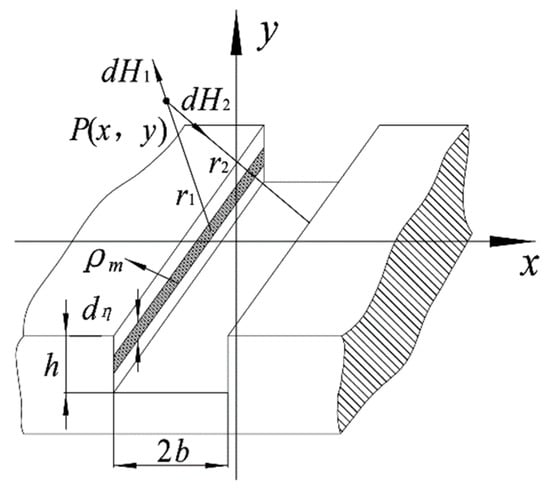
Figure 1.
Magnetic dipole model of wire rope damage.
As shown in the figure, the width of the rectangular defect is 2b, the depth of h. The origin is the middle of the rectangular slot. The direction of the magnetization of the magnetic field along the x-axis and y-axis establishes the two-dimensional plane coordinate system. The width of the loading surface is denoted as ; the density of the loading surface is denoted as . The value of can be determined by the Formula (1); r1, r2 is the distance between the midpoint of the space and the loading surface of the two walls of the slot surface.
where is the relative permeability of the measured material; H0 is the magnitude of the applied magnetic field strength.
In the above coordinate system, the magnetic field strengths and generated by the loading surface on both walls at point in space are denoted as:
where is the vacuum permeability.
If the recorded load surface is at depth in the wire rope, then there is:
Then, the strength of the magnetic field generated on the left side can be expressed in the above coordinate system:
where is the x-component of the magnetic field strength generated at point by the left defective slot wall loading surface ; is the y-component of the magnetic field strength generated by the left defective slot wall loading surface at point .
The strength of the magnetic field generated on the right-hand side can be expressed in the above coordinate system:
where is the x-component of the magnetic field strength generated by the right-hand defective slot wall loading surface at point ; is the y-component of the magnetic field strength generated at point by the right defective slot wall loading surface .
As can be seen from the above equation, the magnetic induction strength of the wire rope damage signal has a close relationship with the size and depth of the damage, so this paper uses the length and depth of the wire rope broken wire damage to verify the effectiveness of the algorithm in this paper.
2.2. WOA–VMD Algorithm
The first step to establishing the internal damage recognition model of wire rope is to carry out feature extraction. Whether the extracted features are accurate or not directly determines the accuracy of the recognition model, so the extracted features must be able to truly and accurately reflect the information about the internal damage of the wire rope. In order to obtain accurate feature vectors, the first step is to process the detected signals. This study uses VMD for noise reduction in the detected signals, but VMD needs to pre-determine the modulus and the penalty factor , which will greatly affect the adaptability of the signal processing process. Therefore, the use of WOA for the optimization of the parameters can greatly improve the adaptability of the VMD. At the same time, different wire rope fracture damage will produce different frequency detection signals, which leads to the VMD decomposition producing different eigenfunctions. According to the eigenfunctions constructed by different feature information, the calculated eigenvalues will be different. Therefore, the WOA–VMD decomposition of the internal damage signal of the wire rope to obtain the noise reduction signal and the calculation of the feature vector according to the noise reduction signal can greatly improve the recognition accuracy. The following is the principle of the noise reduction algorithm.
2.2.1. Principles of the WOA Algorithm
The WOA is an intelligent optimization algorithm based on the hunting behavior of humpback whales [31,32]. The advantages of this algorithm are its good stability, short search time, effective avoidance of falling into the trap of local minimal values, and strong global optimization search capability. Based on these features, this study adopted the WOA for parameter optimization.
The WOA consists of three important phases: encircling prey, bubble net attack, and search for predatory prey. during the first stage, the algorithm searches for prey in the space. After the prey location is determined, it is assumed to be the best location, and other whales surround the prey with the best location utilized as the core. The prey location is continuously updated using the following expressions:
where is the number of iterations, is the position of the optimal solution, is the distance between the search individual and the optimal solution, is the position of the search individual, and are the coefficient vectors.
The second phase consists of two processes: envelope contraction and spiral position update. When an attack is performed, all whales gradually contract the envelope around the core prey, and each whale moves in a spiral path along the optimal distance from the core prey according to the following expressions:
where is the distance between the searching individual and the optimal solution; is the spiral shape parameter; is a uniformly distributed random number with value domain .
During the envelope contraction, we assume that each whale can update its position along the contraction and spiral paths with a probability of 0.5 according to the following expressions:
where is the occurrence probability of the predation process, and is a random number in the range of possible values.
In the third stage, the WOA algorithm performs the predation by randomly updating the position in the solution space. The corresponding expression is shown in (12):
where is the distance between search individuals, and is the position of random individuals.
2.2.2. VMD Principle
VMD is an adaptive signal decomposition method that employs a non-recursive decomposition to decompose a signal into a specified number of IMF with different center frequencies based on a predetermined number of modes, K, and a penalty factor, α. It overcomes the uncertainty in the number of IMFs caused by the traditional EMD decomposition method as well as the encountered end-point effects and mode mixing problems and is able to better highlight the characteristic information of the signal [33]. The variational modal decomposition is mainly divided into the construction of the variational problem and its solution; the variational problem is constructed as follows:
In order to obtain the optimal solution of Equation (8), it is necessary to change this constrained problem into an unconstrained problem, which can be changed into an unconstrained problem by expanding it with the help of the generalized Lagrange function. Its variational solution problem is expressed as:
Here, represents the quadratic term penalty factor; represents the Lagrange multiplier; the alternating direction multiplier algorithm is used to continuously update each IMF’s , and , and ; and the “saddle point” of the Lagrange expression is calculated.
2.2.3. WOA Optimization and VMD Principle
The key to WOA optimization of VMD is to define a suitable fitness function to calculate the fitness value and update the parameters by comparing the fitness value [34]. In this paper, the envelope entropy is chosen as the fitness function of the WOA–VMD algorithm. When the IMF component after VMD decomposition contains more noise and the features are not obvious, the signal of the component is weakly sparse, and its envelope entropy value is larger; when the IMF component has more feature information, the signal shows stronger sparse characteristics, and its envelope entropy value is smaller. The minimum envelope entropy calculation formula is as follows:
where is the envelope amplitude of the th point of the modal signal, is the modal signal length, and is the normalized envelope of the modal signal.
The envelope entropy is calculated as follows:
where is the envelope information entropy of modal signals.
In summary, the flowchart for optimizing VMD parameters using WOA is shown in Figure 2. The specific steps are as follows:
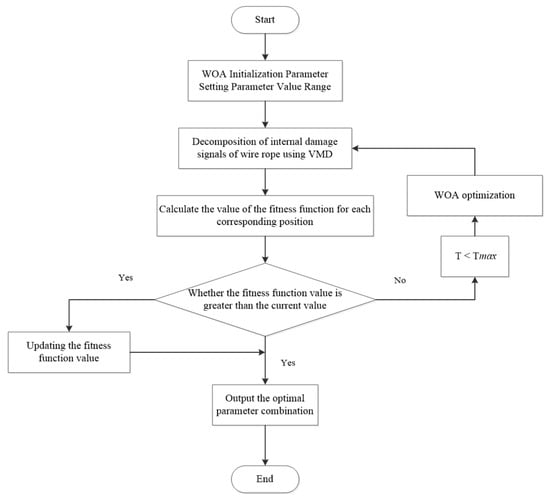
Figure 2.
WOA optimizing the VMD process.
Step1: WOA initialization parameter Set the range of parameter values to avoid setting the range too small, which leads to less feature information in the modal component.
Step2: Decompose the internal damage signal of the wire rope using VMD to obtain several IMF components.
Step3: Calculate the fitness function value for each corresponding position, and update the best fitness function value when the fitness function value is greater than the current value.
Step4: Determine if the iteration is complete. If , update the whale’s position variable. Otherwise, the iteration terminates and the optimal parameters are saved.
2.3. PSO–LSSVM Identification Principle
In the LSSVM model with radial basis function (RBF) as the kernel function, the selection of the radial basis kernel function parameter σ is the key to the identification of wire rope damage signals, and improper selection of the parameter will lead to poor identification model results. In the preprocessing stage, the selection of initial values is random, and in the past, it relied on experience to select the appropriate parameters, which may lead to underfitting or overfitting problems. The PSO algorithm is used to optimize the parameters, which avoids the above drawbacks and greatly improves the classification accuracy of the LSSVM model. The principle of the PSO optimization LSSVM algorithm is as follows:
The LSSVM model parameters are optimized via particle swarming to increase the recognition accuracy [35]. First, we assume that where are the n-dimensional system input vectors, and is the input value for the training sample. is the high-dimensional feature space, and is the high-dimensional nonlinear mapping operator. The fitted sample in the feature space is defined as follows:
where is the weight vector; is the bias; and and are the system input and output values, respectively.
Second, the minimization function for the LSSVM optimization process is established using the least-squares function and equation constraint:
The constraints are expressed as follows:
where is the penalty coefficient, and is the relaxation factor.
The Lagrangian solution equation for the minimization function is:
where is the Lagrangian multiplier. The optimal parameters and can be obtained using the following Karush–Kuhn–Tucker ) conditions:
Using a radial basis function (RBF) as the kernel function, the following expression is derived:
where is the width parameter of the kernel function, which is the key computational parameter. When the value of is small, the LSSVM model is unable to accurately recognize the results, although it has high computational accuracy. When the value of is large, the computational accuracy of the LSSVM model is poor, although the degree of generalization of the recognition results is improved. Therefore, the regularization parameter and width parameter need to be optimized when using the LSSVM model for recognition.
Therefore, in this study, the PSO algorithm is used to optimize the RBF kernel function with the expression:
where represents the th particle, is the particle dimension, is the number of iterations, is the velocity of particle , is the position of particle , is the optimal position of particle , is the global optimal position of the entire cluster, and are the learning factors, and and are the random numbers in the range .
Therefore, the PSO–LSSVM model can be expressed as:
3. WOA–VMD–PSO–LSSVM Algorithms
A flowchart of the WOA-VMD-PSO-LSSVM algorithm is shown in Figure 3.
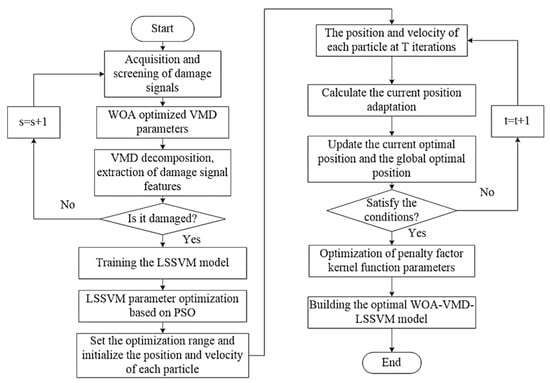
Figure 3.
Flowchart of the WOA–VMD–PSO–LSSVM algorithm.
The overall identification procedure includes the following steps.
Step 1: Damage signals are acquired and screened, and damage signal types are analyzed.
Step 2: Data noise reduction is performed using the WOA–VMD process.
Step 3: A multidomain feature set is created by combining the minimal envelope entropy with the time-domain and frequency-domain characteristics.
Step 4: To obtain recognition results, a PSO–LSSVM model is constructed, the fused feature set is fed into this model, and parameter optimization is performed using the particle swarm approach.
The pseudo-code for the WOA–VMD-PSO–LSSVM method is as follows:
| method | WOA–VMD and PSO–LSSVM method |
| Input | num = xlsread(‘x.xlsx’); % detection signal x |
| Output | ); % WOA–VMD denoising signal ); % PSO–LSSVM identification results |
| Loop | For (i = 1, i ≤ 30; i++); { is the number of optimal decomposition layers is the signal after noise reduction } For (j = 1, j ≤ 50; j++); { ; % PSO optimization ; % Recognizing Noise Reduction Signals with LSSVM, is the result of the identification } end |
4. Simulation Analysis
In order to investigate the efficiency of the proposed algorithm in this study, we utilize the signal expression given in Equation (27) and simulate it in MATLAB 2021 software. According to the characteristics of the wire rope damage detection signal, white noise is added to the simulated signal to obtain a noisy detection signal, as shown in Figure 4a. The signal is noise-reduced using the WOA–VMD method, and the noise-reduced signal shown in Figure 4b is obtained. The simulation signals are only a prejudgement of the results and a basis for judgment to proceed to the next step, so the simulation results are broadly similar to the experimental results.
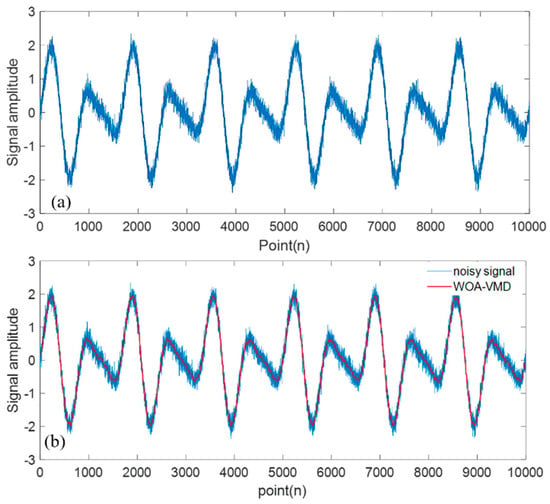
Figure 4.
Simulated signals generated according to (27) after the (a) addition of a noisy analog signal and (b) noise reduction using the algorithm developed in this work.
The simulation results in Figure 4 show that the signal after noise reduction is morphologically close to the original signal, which can eliminate the noise components and retain the effective features of the signal.
To validate the PSO–LSSVM recognition method, we created a new set of simulated signals in MATLAB2021 according to Expression (28), as shown in Figure 5. Then, the fused feature vectors of the two sets of signals are extracted for recognition identification, and the results are shown in Figure 6.
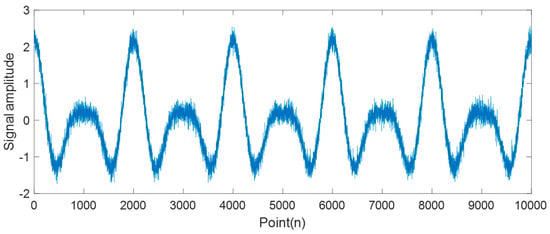
Figure 5.
Simulated signal generated according to (28).
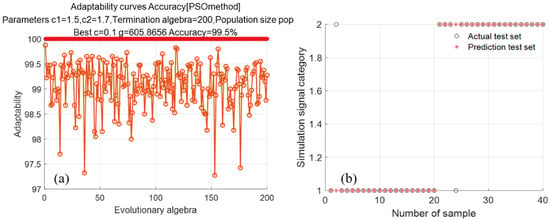
Figure 6.
Simulated identification data. (a) Adaptation curve for parameter optimization (b) PSO-LSSVM algorithm identification results.
The simulated identification data presented in Figure 6 show that the particle swarm seeking fitness curve becomes smooth after several iterations. After the optimization search, the optimal parameters of the LSSVM algorithm are equal to and , and the internal damage recognition rate of the wire rope is 99.5%.
5. Experimental Results
5.1. Experimental Design
A wire rope experimental setup was constructed to validate the developed recognition method (Figure 7). The wire rope damage is detected via the following procedure. To prevent the effects of temperature on the obtained results, the room temperature was set to 26 °C. At the same time, the flaw detector with the FPC radial acquisition board (signal detection sensor) was placed at a designated location. Next, the motor was started to set the wire rope with internal damage in motion. Finally, the data acquisition card was used to collect the wire rope internal damage signal. The obtained information is transmitted and stored on the computer.
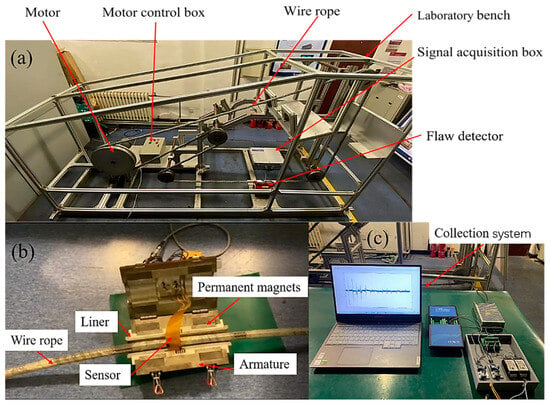
Figure 7.
Experimental setup: (a) integral testing platform, (b) prototype flaw detector, and (c) collection system.
To study the magnetic field response of the internal damage of the wire rope, two groups of experiments were performed. The first group included the experiments conducted at different wire damage lengths. For this purpose, a 6 × 19 wire rope was selected, and its internal damage length was varied between 3, 5, 7, 9, 11, 13, and 15 mm (Figure 8a). In the second group of experiments, the broken wire depth was varied between 5, 10, 15, 20, 25, 30, and 35 wire (Figure 8b).
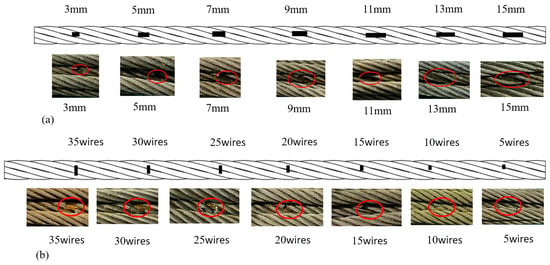
Figure 8.
Wire rope experimental defects examined at various (a) internal damage lengths and (b) broken wire depths.
5.2. Damage Signal Data Analysis
To evaluate the effectiveness of the proposed WOA–VMD–PSO–LSSVM approach, acquisition work was performed on the internal damage data of the wire rope. The detected experimental signals are shown in Figure 9. The causes of noise generation and their effects on the detection of the internal broken wire damage were investigated from the time–domain and frequency–domain perspectives.
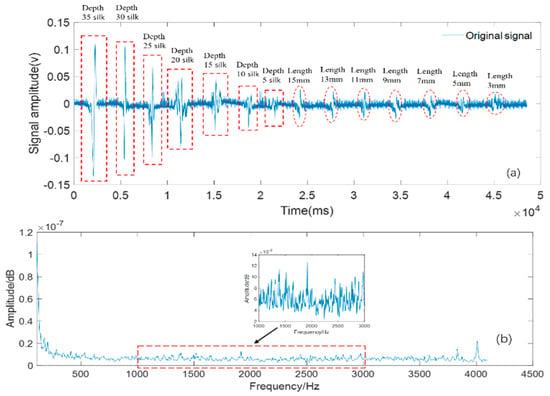
Figure 9.
Wire rope internal damage acquisition signal: (a) time-domain diagram and (b) frequency spectrum.
When using leakage magnetic field to detect internal broken wire damage, two different types of noise will be generated: one is the background noise caused by the helical structure of the wire rope strand, and the other is the other random noise caused by the wire rope jitter, external magnetic field interference, positioning errors and other factors during the detection process. Therefore, these two types of noise cannot be avoided.
Figure 9a shows the time-domain diagram of the wire rope internal damage signal. Because of the impact of the above-mentioned noise types, the wire rope internal damage signal noise is very strong, and it is difficult to distinguish between the noise and useful signal characteristics. Figure 9b displays the frequency spectrum of the wire rope internal damage signal, in which the generated noise causes a considerable band interference and mode overlap. Therefore, to ensure a sufficiently high recognition accuracy, the internal damage signal of the wire rope must be subjected to a noise reduction procedure.
5.3. WOA–VMD Optimization Search Process
The VMD algorithm requires a predetermined number of decomposition layers during the decomposition of the detected signal. Modal mixing is performed for each mode after VMD to determine both the number of decomposition layers and penalty factor α. In this study, the WOA was used to perform an adaptive optimization search for the VMD parameters to obtain the optimal combination of values for each group of signals. Figure 10 describes the optimization-seeking iterative process for the internal length damage of the wire rope.
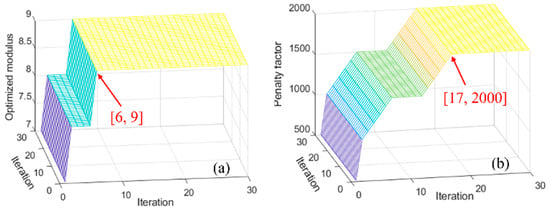
Figure 10.
Iterative diagram of the WOA–VMD parameter seeking process for the determination of (a) K values and (b) penalty factor α.
According to Figure 10, 17 iterations are required to achieve the optimal penalty factor of 2000, and the value of the decomposition layers K after the optimization search reaches the optimal number of decomposition layers equal to 9 after six iterations. Hence, the WOA–VMD algorithm optimal parameter combination is , which was used to reduce noise in the wire rope internal damage signal. The outcomes of the noise reduction process are displayed in Figure 11.
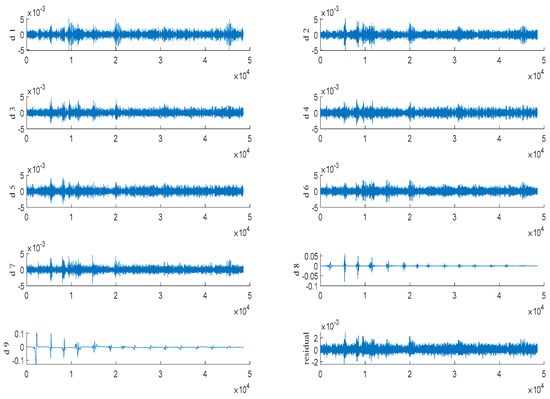
Figure 11.
WOA–VMD decomposition results.
The WOA–VMD method divides the signal into numerous modal components with various center frequencies and constrained bandwidths (Figure 11). The WOA–VMD residual component, which is the error produced during the decomposition process, has an amplitude of approximately 0.002, indicating that the error is very small. The first eight modal components obtained after decomposition are high-frequency noise signals. The internal damage signal of the wire rope is represented by the d9 component following noise reduction.
In order to verify the superiority of whale optimization for noise reduction, we compare the wavelet threshold noise reduction, CEEMDAN, and VMD algorithms to verify the noise reduction effect of the WOA–VMD technique. Their time domain waveforms are shown in Figure 12.
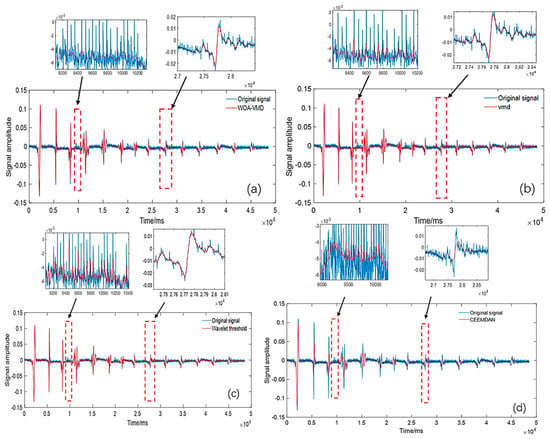
Figure 12.
Time-domain waveforms produced by the (a) WOA–VMD, (b) VMD, (c) wavelet threshold, and (d) CEEMDAN algorithms.
From Figure 12, the VMD algorithm after noise reduction can retain the effective information of the original signal and has high similarity with the original signal. However, there is more noise, and the damage signal after noise reduction by the wavelet threshold algorithm shows irregular fluctuations. The noise in the high-frequency noise part is more obvious, and the damage signal waveform after noise reduction by the CEEMDAN algorithm presents inconsistency with the original signal. The reconstructed signal after noise reduction by the WOA–VMD algorithm has a high similarity with the original signal, and noise reduction can smooth out nonlinear and localized signals (such as spikes and abrupt changes), thus retaining the effective characteristics of the original signal; additionally, the noise reduction effect is obvious.
Four metrics were used to compare the noise reduction efficiency of the method proposed in this work with those of other noise reduction algorithms to demonstrate its superiority. The obtained results are presented in Table 1. They show that the WOA–VMD noise reduction technique has a signal-to-noise ratio of approximately 29.29 dB, which is 6.23, 3.86, and 3.09 dB greater than those of the wavelet threshold, CEEMDAN, and VMD algorithms, respectively. The noise reduction algorithm developed in this study exhibits an R-value of 0.99, which is also higher than the R-values of the other three noise reduction techniques. Thus, the WOA–VMD noise reduction impact is very strong, and the signal useful features are preserved using this method, which significantly increases the recognition accuracy.

Table 1.
Noise reduction effects of different methods.
In summary, this paper adopts WOA to optimize the VMD, so that the VMD can adaptively determine the optimal decomposition parameters; therefore, it is called the adaptive VMD algorithm. It is known through the multi-algorithm comparative study that the WOA–VMD algorithm has a great advantage in signal processing, it is able to obtain a very good effect of noise reduction, and it can effectively improve the accuracy of recognition.
5.4. Damage Identification
After the noise reduction processing work, the feature extraction work is carried out. In this study, the time-domain features, frequency-domain features, and envelope entropy features of the samples are extracted from the noise-canceled signals to form a multidimensional fusion feature set, which can greatly improve the recognition accuracy. The time-domain features include maximum and minimum values, and the frequency-domain features include average frequency amplitude, frequency and power, as well as the envelope entropy features extracted by the WOA–VMD noise reduction process, of which seven sets of feature vectors are shown in Table 2.

Table 2.
Sample signal eigenvalues.
5.5. Analysis of Results
The entire dataset is separated into two groups (360 training set samples and 140 test set samples) to input into the PSO–LSSVM model and demonstrate the superiority of the WOA–VMD–PSO–LSSVM technique. Meanwhile, in order to prove the superiority of the algorithms in this study, the WOA–VMD-KNN algorithm, the WOA–VMD-SVM algorithm, and the WOA–VMD-LSSVM algorithm are used to recognize the noise reduction signal, respectively. The recognition effects are compared to highlight the superiority of the algorithms in this paper. Figure 13d shows the recognition results obtained after training with the WOA–VMD-PSO–LSSVM algorithm. Figure 13a shows the recognition results of the WOA–VMD-KNN algorithm, and Figure 13b,c show the recognition data obtained by the WOA–VMD-SVM algorithm and the WOA–VMD-LSSVM algorithm, respectively.
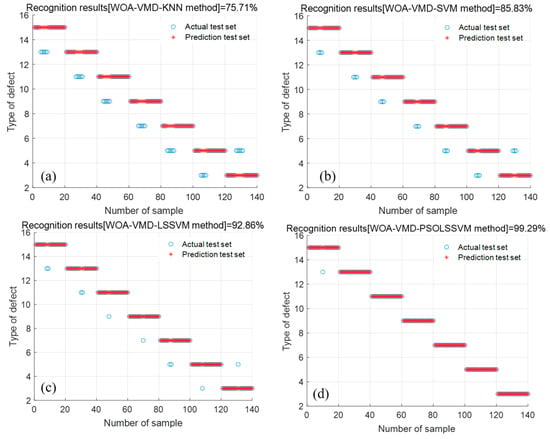
Figure 13.
Recognition data obtained via the (a) WOA–VMD–KNN, (b) WOA–VMD–SVM, (c) WOA–VMD–LSSVM, and (d) WOA–VMD–PSO–LSSVM algorithms.
From Figure 13, the recognition accuracy of the WOA–VMD-KNN algorithm is 75.71%, the recognition accuracy of the WOA–VMD-SVM algorithm is 85.83%, the recognition accuracy of the WOA–VMD-LSSVM algorithm is 92.86%, and the recognition accuracy of the WOA–VMD-PSO–LSSVM algorithm is 99.29%. We can see that after PSO, the recognition rate of this algorithm is considerably improved, i.e., it is approximately 6.43% higher. Simultaneously, from the comparison, we can see that the recognition rate of the proposed algorithm is higher than those of the WOA–VMD-KNN and WOA–VMD-SVM algorithms, which proves that our algorithm has certain superiority for wire rope internal damage broken wire recognition.
To further verify the superiority of multi-domain feature fusion based on the time-domain, frequency-domain, and minimum envelope entropy, the multi-feature fusion, time-domain, frequency-domain, and minimum envelope entropy feature sets were input into the WOA–VMD-PSO–LSSVM model for comparison. The same algorithm was randomly performed for five experiments, and the average value was taken as the final result. Table 3 lists the recognition results for the different feature sets.

Table 3.
Identification results consisting of fused features with different domain degrees.
According to Table 3, the average recognition rate of the method developed in this study is 92.93% based on the time-domain features, 91.54% based on the frequency-domain features, and 81.70% based on the minimum envelope entropy features. Meanwhile, the average recognition rate of the WOA–VMD–PSO–LSSVM algorithm, which fuses the time-domain, frequency-domain, and minimum envelope entropy features, is 99.32%. This magnitude is higher than the recognition rates obtained using various single-domain feature vectors, indicating that fused features can effectively improve the recognition performance of the studied system.
To verify the effect of the WOA–VMD algorithm on the recognition accuracy, four methods, i.e., WOA–VMD-PSO–LSSVM, VMD-PSO–LSSVM, CEEMDAN-PSO–LSSVM, and AWT-PSO–LSSVM, were used for comparison. Table 4 shows the recognition results of the different methods.

Table 4.
Identification results obtained by different methods.
Table 4 shows that the average recognition rates of VMD-PSO–LSSVM, CEEMDAN-PSO–LSSVM and AWT-PSO–LSSVM are 81.83%, 87.49% and 93.02%, respectively. Compared with the above three algorithms, the recognition rate of the WOA–VMD algorithm is 99.32%, which is significantly higher than the other three algorithms, which indicates that the whale optimization method can greatly improve the recognition rate of the internal damage of the wire rope.
In conclusion, compared with other methods, the WOA–VMD-PSO–LSSVM algorithm proposed in this paper can more accurately identify the internal wire breakage damage of wire ropes, and therefore, the superiority of the algorithm proposed in this study is verified.
6. Conclusions
In this study, a wire rope internal broken wire damage identification method based on the WOA–VMD-PSO–LSSVM algorithm is proposed, which adopts the WOA–VMD noise reduction method to reduce the wire rope damage signal. At the same time, the minimum envelope entropy features, time domain features and frequency domain features of the noise-reduced signal are extracted to form a multi-domain fusion feature vector, which is input into the PSO–LSSVM model for identification. The effectiveness and superiority of the proposed method are confirmed by theoretical and experimental validation.
First, the optimal combination of VMD parameters was obtained by optimizing the WOA algorithm, i.e., [9,2000]. The signal after noise reduction had no modal aliasing phenomenon or endpoint effect; thus, the model could retain useful damage features and avoid signal distortion, effectively solving the noise problem in the internal damage detection of the wire rope.
Second, after comparing with various algorithms, the SNR of the internal damage signal of the wire rope after noise reduction with the WOA–VMD algorithm was 29.29 dB, which was 6.23 dB, 3.86 dB and 3.09 dB higher than wavelet threshold, CEEMDAN and VMD, respectively; meanwhile, the correlation coefficient was 0.99. This is closer to the original signal than the other algorithms; thus, the proposed algorithm can retain effective features and significantly improve the recognition rate.
Third, the time-domain, frequency-domain, and lowest envelope entropy features were fused to form a multi-domain fused feature vector to input into the WOA–VMD-PSO–LSSVM algorithm for wire rope internal damage identification. The average recognition rate of the multi-domain feature vector was 6.39%, 7.78% and 17.62% higher than that of the time-domain, frequency-domain, and lowest envelope entropy features, respectively, by experimental comparison and analysis, which fully reflects the superiority of the multi-domain feature vector.
Finally, the WOA–VMD-PSO–LSSVM algorithm was used for internal broken wire identification, with an average recognition rate of 99.32%. To verify the effectiveness of the algorithm in this study, the WOA–VMD-LSSVM, WOA–VMD-SVM, and WOA–VMD-KNN algorithms were introduced for experimental comparison. The average recognition rates of the algorithms in this study were 6.43%, 13.46%, and 23.57% higher than those of the above three algorithms, respectively, which verified the superiority of the WOA–VMD-PSO–LSSVM algorithm.
Author Contributions
P.L.: simulation, analysis, experiments, data collation, writing—original manuscript; J.T.: Funding acquisition, proofreading, supervision; Z.Z.: experiments; W.W.: experiments. All authors have read and agreed to the published version of the manuscript.
Funding
This work was supported by the Fundamental Research Funds for Central Universities (Grants Nos. 2022JCCXJD02 and 2022YJSJD09). Funding for this project was also provided by the National Natural Science Foundation of China under Grant No. 51774293.
Data Availability Statement
Data sharing not applicable.
Acknowledgments
The authors would like to thank the anonymous reviewers and the editor for their valuable and insightful suggestions.
Conflicts of Interest
The authors declare no conflict of interest.
Abbreviations
WOA: Whale optimization algorithm; VMD: Variational mode decomposition; PSO: Particle swarm optimization; LSSVM: Least-squares support vector machine; EMD: Empirical mode decomposition; WT: Wavelet transform; CNN: Convolutional neural network; ELM: Extreme learning machine; SVM: Support vector machine; Lagrange: Lagrangian function; KKT: Karush–Kuhn–Tucker; RBF: Radial basis function; FPC: Radial collection plate model; CEEMDAN: Complete ensemble empirical mode decomposition with adaptive noise; KNN: K-nearest neighbor.
References
- Liu, S.; Sun, Y.; Jiang, X.; Kang, Y. A Review of Wire Rope Detection Methods, Sensors and Signal Processing Techniques. J. Nondestruct. Eval. 2020, 39, 85. [Google Scholar] [CrossRef]
- Ouyang, Y.; Wang, T.; Hong, T.; Sun, X. Calibration and Analysis of Mechanical Modeling for Traction Wire Rope of Mountainous Orchard Carrier. Math. Probl. Eng. 2021, 2021, 7391524. [Google Scholar] [CrossRef]
- Zhang, J.; Peng, F.; Chen, J. Quantitative Detection of Wire Rope Based on Three-Dimensional Magnetic Flux Leakage Color Imaging Technology. IEEE Access 2020, 8, 104165–104174. [Google Scholar] [CrossRef]
- Zhang, D.; Zhang, E.; Pan, S. A new signal processing method for the nondestructive testing of a steel wire rope using a small device. NDT E Int. 2020, 114, 102299. [Google Scholar] [CrossRef]
- Jomdecha, C.; Prateepasen, A. Design of modified electromagnetic main-flux for steel wire rope inspection. NDT E Int. 2009, 42, 77–83. [Google Scholar] [CrossRef]
- Wang, H.; Tian, J.; Li, X.; Lv, X. Inspection of Mine Wire Rope Using Magnetic Aggregation Bridge Based on Magnetic Resistance Sensor Array. IEEE Trans. Instrum. Meas. 2020, 69, 7437–7448. [Google Scholar] [CrossRef]
- Liu, S.; Sun, Y.; He, L.; Kang, Y. Weak Signal Processing Methods Based on Improved HHT and Filtering Techniques for Steel Wire Rope. Appl. Sci. 2022, 12, 6969. [Google Scholar] [CrossRef]
- Huang, S.; Wang, X.; Li, C.; Kang, C. Data decomposition method combining permutation entropy and spectral substitution with ensemble empirical mode decomposition. Measurement 2019, 139, 438–453. [Google Scholar] [CrossRef]
- Zhang, J.; Zheng, P.; Tan, X. Recognition of Broken Wire Rope Based on Remanence using EEMD and Wavelet Methods. Sensors 2018, 18, 1110. [Google Scholar] [CrossRef]
- Qiao, T.Z.; Li, Z.X.; Jin, B.Q. Identification of mining steel rope broken wires based on improved EEMD. Int. J. Min. Miner. Eng. 2016, 7, 224. [Google Scholar] [CrossRef]
- Wang, D.; Zhao, Y.; Yi, C.; Tsui, K.-L.; Lin, J. Sparsity guided empirical wavelet transform for fault diagnosis of rolling element bearings. Mech. Syst. Signal Process. 2018, 101, 292–308. [Google Scholar] [CrossRef]
- Peng, F.; Zhang, J. The Broken Wires Identification of Wire Rope Based on Multilevel Filtering Method Using EEMD and Wavelet Analysis. J. Fail. Anal. Prev. 2020, 21, 280–289. [Google Scholar] [CrossRef]
- Li, H.; Liu, T.; Wu, X.; Chen, Q. An optimized VMD method and its applications in bearing fault diagnosis. Measurement 2020, 166, 108185. [Google Scholar] [CrossRef]
- Wang, G.; Wang, X.; Wang, Z.; Ma, C.; Song, Z. A VMD–CISSA–LSSVM Based Electricity Load Forecasting Model. Mathematics 2021, 10, 28. [Google Scholar] [CrossRef]
- Lu, Q.; Shen, X.; Wang, X.; Li, M.; Li, J.; Zhang, M. Fault Diagnosis of Rolling Bearing Based on Improved VMD and KNN. Math. Probl. Eng. 2021, 2021, 2530315. [Google Scholar] [CrossRef]
- Yan, X.; Liu, Y.; Zhang, W.; Jia, M.; Wang, X. Research on a Novel Improved Adaptive Variational Mode Decomposition Method in Rotor Fault Diagnosis. Appl. Sci. 2020, 10, 1696. [Google Scholar] [CrossRef]
- Chen, Q.; Zhang, J.; Li, B. Research on 3D MFL testing of wire rope based on empirical wavelet transform and SRCNN. J. Vibroeng. 2022, 24, 779–792. [Google Scholar] [CrossRef]
- He, Y.; Song, K.; Meng, Q.; Yan, Y. An End-to-End Steel Surface Defect Detection Approach via Fusing Multiple Hierarchical Features. IEEE Trans. Instrum. Meas. 2020, 69, 1493–1504. [Google Scholar] [CrossRef]
- Zhang, Y.; Han, J.; Jing, L.; Wang, C.; Zhao, L. Intelligent Fault Diagnosis of Broken Wires for Steel Wire Ropes Based on Generative Adversarial Nets. Appl. Sci. 2022, 12, 11552. [Google Scholar] [CrossRef]
- Chen, M.R.; Zeng, G.Q.; Lu, K.D.; Weng, J. A Two-Layer Nonlinear Combination Method for Short-Term Wind Speed Prediction Based on ELM, ENN, and LSTM. IEEE Internet Things J. 2019, 6, 6997–7010. [Google Scholar] [CrossRef]
- Chen, Z.; Jiang, C.; Xie, L. A Novel Ensemble ELM for Human Activity Recognition Using Smartphone Sensors. IEEE Trans. Ind. Inform. 2019, 15, 2691–2699. [Google Scholar] [CrossRef]
- Cai, W.; Yang, J.; Yu, Y.; Song, Y.; Zhou, T.; Qin, J. PSO-ELM: A hybrid learning model for short-term traffic flow forecasting. IEEE Access 2020, 8, 6505–6514. [Google Scholar] [CrossRef]
- Alickovic, E.; Subasi, A. Ensemble SVM Method for Automatic Sleep Stage Classification. IEEE Trans. Instrum. Meas. 2018, 8, 6505–6514. [Google Scholar] [CrossRef]
- Zhou, P.; Zhou, G.; Li, Y.; He, Z.; Liu, Y. A Hybrid Data-Driven Method for Wire Rope Surface Defect Detection. IEEE Sens. J. 2020, 20, 8297–8306. [Google Scholar] [CrossRef]
- Suykens, J.A.K.; Vandewalle, J. Least Squares Support Vector Machine Classifiers. Neural Process. Lett. 1999, 9, 293–300. [Google Scholar] [CrossRef]
- Jia, Y.; Ying, L.; Wang, D.; Zhang, J. Defect Prediction of Relay Protection Systems Based on LSSVM-BNDT. IEEE Trans. Ind. Inform. 2020, 17, 710–719. [Google Scholar] [CrossRef]
- Yousefi, M.; Gholami, M.; Oskoei, V.; Mohammadi, A.A.; Baziar, M.; Esrafili, A. Comparison of LSSVM and RSM in simulating the removal of ciprofloxacin from aqueous solutions using magnetization of functionalized multi-walled carbon nanotubes: Process optimization using GA and RSM techniques. J. Environ. Chem. Eng. 2021, 9, 105677. [Google Scholar] [CrossRef]
- Zhang, K.; Su, J.; Sun, S.; Liu, Z.; Wang, J.; Du, M.; Liu, Z.; Zhang, Q. Compressor fault diagnosis system based on PCA-PSO-LSSVM algorithm. Sci. Prog. 2021, 104, 368504211026110. [Google Scholar] [CrossRef]
- Guan, S.; Huang, D.; Guo, S.; Zhao, L.; Chen, H. An Improved Fault Diagnosis Approach Using LSSVM for Complex Industrial Systems. Machines 2022, 10, 443. [Google Scholar] [CrossRef]
- Gao, S.; Li, T.; Zhang, Y. Rolling bearing fault diagnosis of PSO–LSSVM based on CEEMD entropy fusion. Trans. Can. Soc. Mech. Eng. 2019, 44, 405–418. [Google Scholar] [CrossRef]
- Mirjalili, S.; Lewis, A. The Whale Optimization Algorithm. Adv. Eng. Softw. 2016, 95, 51–67. [Google Scholar] [CrossRef]
- Wang, X.; Gao, S.; Zhou, S.; Guo, Y.; Duan, Y.; Wu, D. Prediction of House Price Index Based on Bagging Integrated WOA-SVR Model. Math. Probl. Eng. 2021, 2021, 3744320. [Google Scholar] [CrossRef]
- Li, C.; Liu, Y.; Liao, Y.; Wang, J. A VME method based on the convergent tendency of VMD and its application in multi-fault diagnosis of rolling bearings. Measurement 2022, 198, 111360. [Google Scholar] [CrossRef]
- Ouyang, M.; Shen, P. Prediction of Remaining Useful Life of Lithium Batteries Based on WOA-VMD and LSTM. Energies 2022, 15, 8918. [Google Scholar] [CrossRef]
- Li, Y.; Huang, D.; Qin, Z. A Classification Algorithm of Fault Modes-Integrated LSSVM and PSO with Parameters’ Optimization of VMD. Math. Probl. Eng. 2021, 2021, 6627367. [Google Scholar] [CrossRef]
Disclaimer/Publisher’s Note: The statements, opinions and data contained in all publications are solely those of the individual author(s) and contributor(s) and not of MDPI and/or the editor(s). MDPI and/or the editor(s) disclaim responsibility for any injury to people or property resulting from any ideas, methods, instructions or products referred to in the content. |
© 2023 by the authors. Licensee MDPI, Basel, Switzerland. This article is an open access article distributed under the terms and conditions of the Creative Commons Attribution (CC BY) license (https://creativecommons.org/licenses/by/4.0/).