1. Introduction
The problem that this research solves is the contradiction, that we have identified, in the multidimensional quality of life index methodology designed by Eurostat [
1], and consequently applied by European Union national statistical institutes, such as the INE, which is the Spanish National Statistics Institute [
2]. The contradiction in the methodology is due to the aggregation with non-compensation between indicators in the first phase and the aggregation by compensating between dimensions in the second phase. From our point of view, the non-compensatory condition should be respected in both phases.
The purpose of this research is to apply alternative aggregation methodologies for the construction of an improved multidimensional quality of life index, which can replace the current methodology designed by Eurostat and applied by INE. Thus, this is research aims to improve the multidimensional quality of life index used by INE, and, consequently, helps economists and policy makers to better understand the quality of life and to make more accurate decisions. The contribution of this research is to provide a more accurate approach by using “non-compensatory” aggregation methods in both phases (both in the aggregation of indicators and in the aggregation of dimensions). The INE method uses a non-compensatory method for aggregating indicators, but a “compensatory” one (the arithmetic mean) for aggregating dimensions. Although it cannot be said that there is a “perfect” type of aggregation, we believe that it is much better to use a multi-criteria approach that captures the complexity of the phenomenon under study and that does not allow for trade-offs between different criteria.
Multidimensional indices are necessary to understand the quality of life of a society, as well as to compare and rank the well-being of societies and, more importantly, to make informed policy decisions. The idea of multidimensional measurement of quality of life is to be able to aggregate all elements into a single indicator. In this way, a quality of life indicator would be constructed that would make it possible to compare countries, regions, or population groups with each other. By contrast, a sole indicator of well-being, often income or GDP per capita, fails to capture the heterogeneous complexity of human well-being, although it is undoubtedly an indicator that should have an important weight in an aggregate index, as improved socio-economic conditions contribute to higher quality of life [
3,
4,
5]. In fact, it is not only the objective indicators and dimensions that must be considered, but also the subjective dimensions, including subjective indicators such as the individual’s cognitive perception of his or her well-being, level of satisfaction, and assessment of his or her quality of life [
6]. Well-being indices, also known as composite indicators of well-being, or indices of quality of life, are indices whose value is created by the aggregation of many indicators. Those indices are easier to understand, present and communicate than the results of all indicators at the same time.
Classifying well-being using a combination of objective and subjective indicators of quality of life, in a single index, is a difficult mission that faces two different problems. On the one hand, the technical complexity of the mathematical models used to create the index, and on the other hand, the problem derived from the subjective decision to weight the indicators according to their relative importance in human well-being, which is always open to discussion and may vary across cultures and time [
7,
8].
The INE decided to integrate in 2017, within the publication “Quality of Life Indicators” [
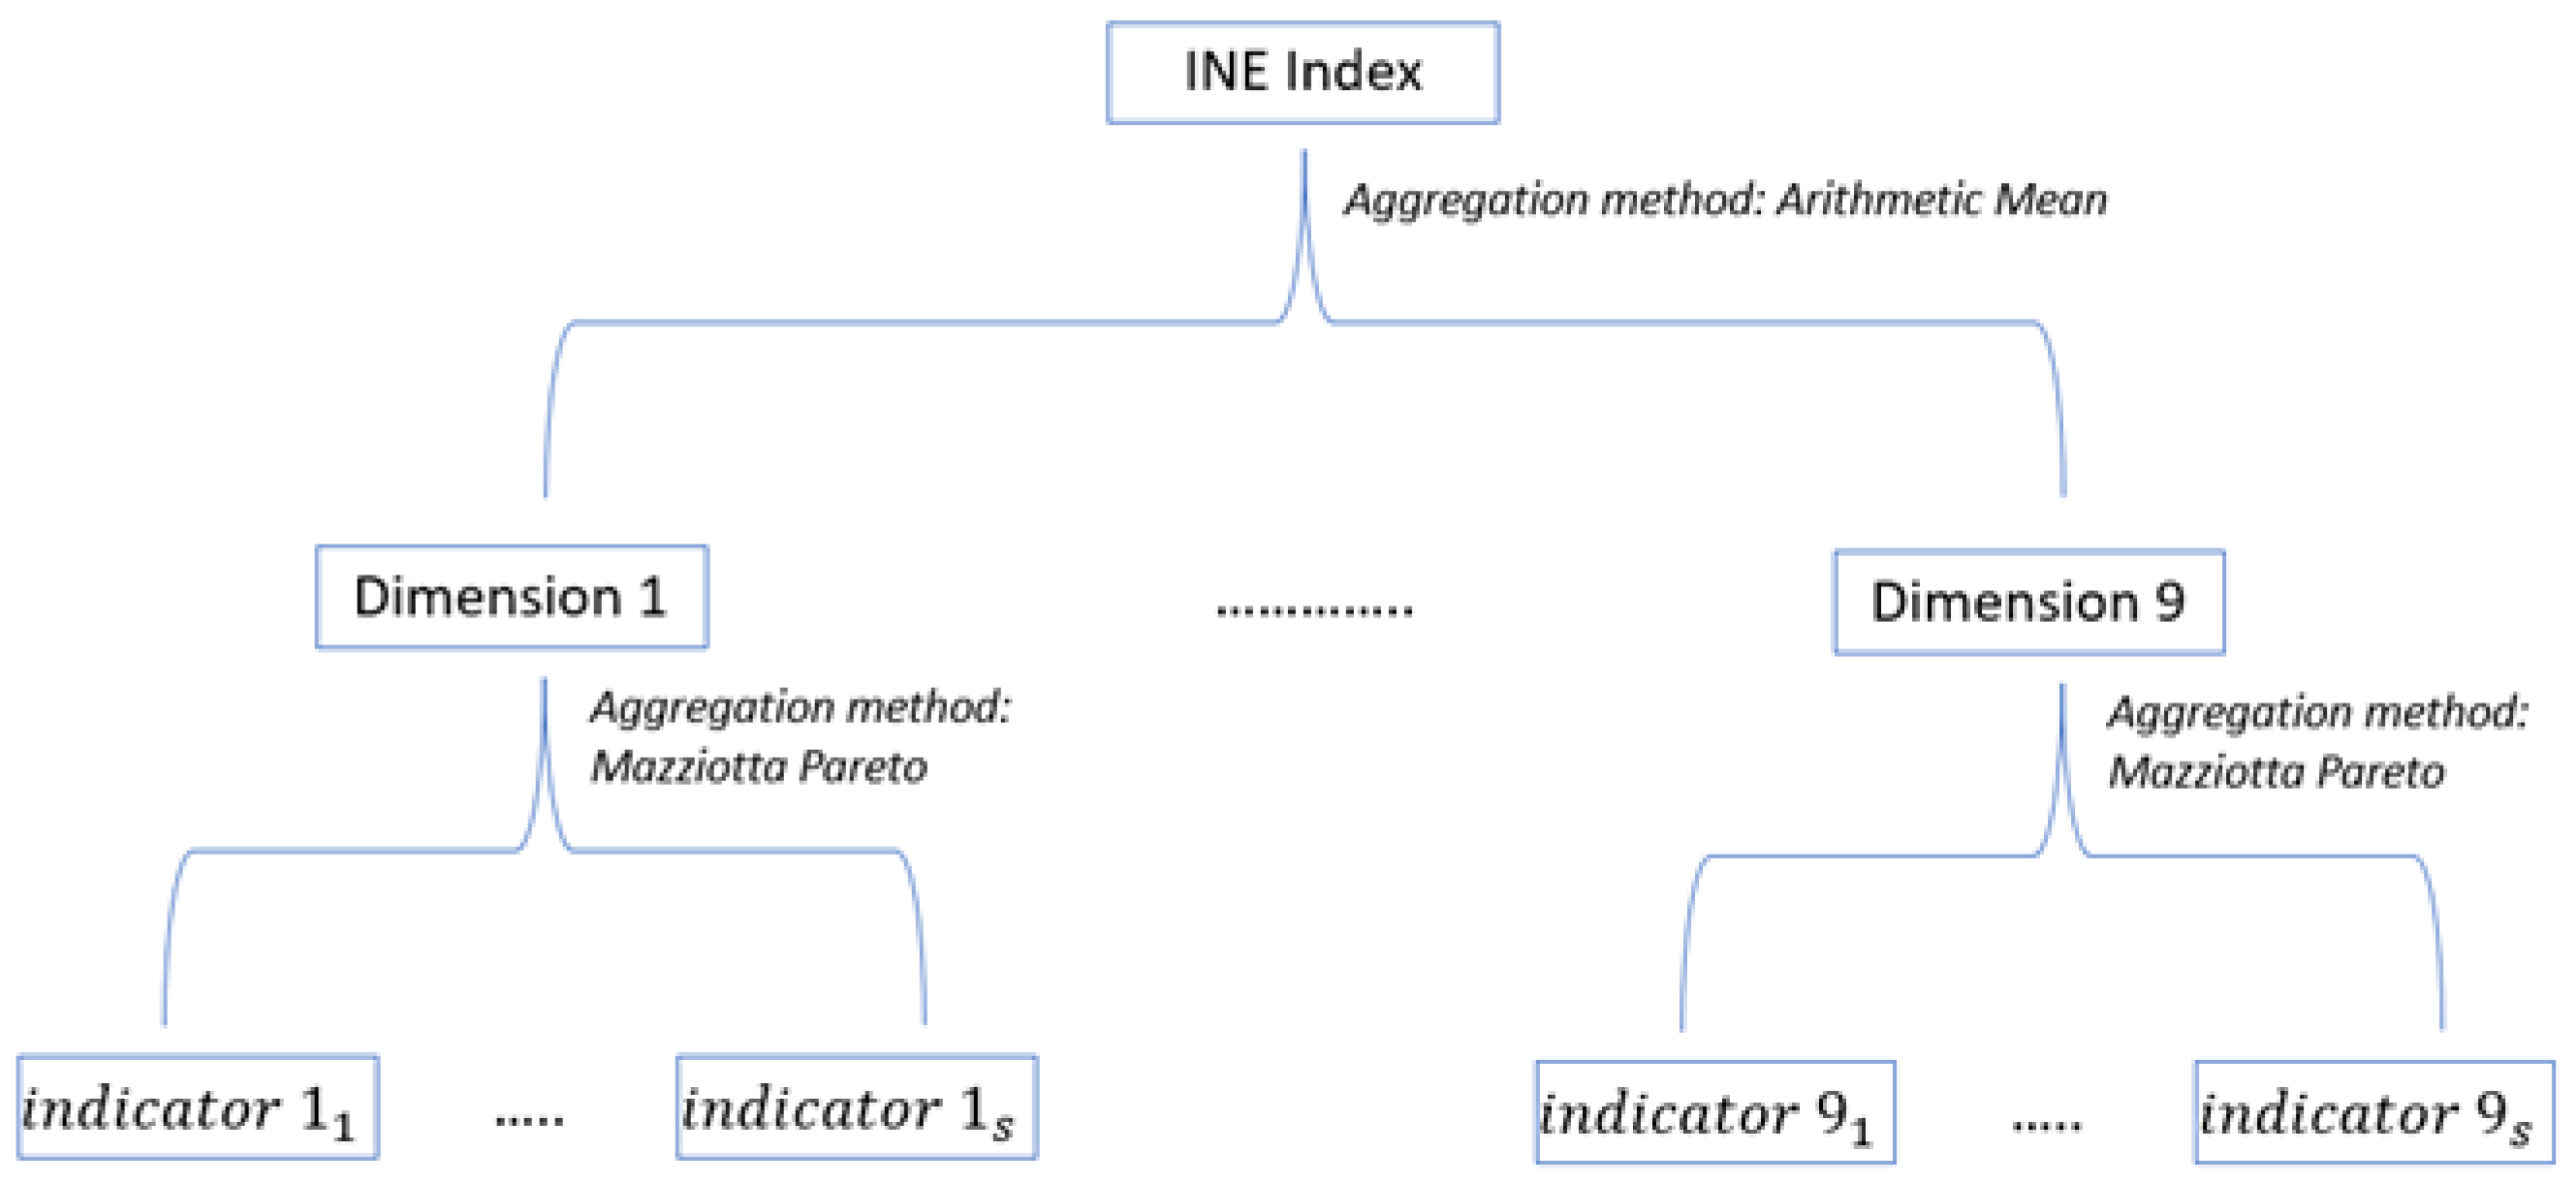
9], an aggregate indicator of the 9 dimensions. The individual indicators are aggregated into a single indicator for each dimension, using as a synthetic indicator the adjusted Mazziotta-Pareto method (AMPI). In a second phase, the AMPI indicators for each dimension are aggregated into a single quality of life indicator by means of an unweighted arithmetic mean where all dimensions are equally important. The INE allows the user to assign each dimension the importance he/she considers appropriate.
The 9 dimensions calculated by INE are obtained by aggregating a large but limited number of indicators (currently 55). The 9 dimensions are as follows: 1.-Material living conditions; 2.-Work; 3.-Health; 4.-Education; 5.-Leisure and social relations; 6.-Physical and personal safety; 7.-Governance and basic rights; 8.-Environment; and 9.-General experience of life. For each of these 9 dimensions, a series of indicators are chosen, mainly obtained from population surveys, such as the Living Conditions Survey or the Labor Force Survey, which are considered representative of the quality of life in this dimension.
Although it cannot be said that there is a “perfect” type of aggregation, we believe that it is much better to use a multi-criteria approach that captures the complexity of the phenomenon under study and that does not allow for trade-offs between different criteria (allowing e.g., poor health outcomes to be compensated by good environmental sustainability outcomes). Furthermore, although we will not go into the question of weights in depth in our article, both our approach and that presented by the Spanish National Statistics Institute understand weights as parameters that reflect the relative importance of the criteria. Taking this fact into account, [
10] concludes that “…the use of non-linear/non-compensatory aggregation rules to construct composite indicators is compulsory for reasons of theoretical consistency when weights with the meaning of importance coefficients are used or when the assumption of preferential independence (where no phenomenon of synergy or conflict can be taken into account) does not hold”.
Specifically, we will use an approach based on ELECTRE methods where the weights are considered as parameters that reflect the intrinsic importance of the criteria and that could even, if necessary, take into account possible interactions between criteria. The problem to be solved is to eliminate the contradiction in the INE (and Eurostat) multidimensional quality of life index methodology in relation to the non-compensatory aggregation between indicators in the first phase and in the compensatory aggregation between dimensions in the second phase. This paper solves this important problem by respecting the no-compensatory condition in the two phases of the index creation.
Our aim, in this article, is to propose alternative aggregation methodologies for the construction of an improved multidimensional quality of life index. In addition, this research aims to demonstrate that it is possible to construct an index that is completely non-compensatory. In this article the authors present three approaches that offer three improved alternatives to the current INE (and Eurostat) procedure: 1.-Basic ELECTRE, 2.-Full ELECTRE, and 3.-Full Fuzzy ELECTRE.
The great novelty is that by applying our methodological proposals it would be possible to obtain, for the first time, non-compensatory European quality of life indexes. It should be borne in mind that, although this research has been carried out based on the methodology and data of INE, the results and conclusions are fully applicable at European level and for all European Union member states, due to the fact that the methodology is designed by Eurostat and is applied in the same way both by INE and by all national statistical offices in all European Union member states. All national statistical offices in EU countries follow Eurostat’s methodological guidelines and apply the same procedure to calculate quality of life indices in each country. However, not all national statistical offices have managed to obtain data for all variables.
Therefore, this study raises the following research question: Can the INE (and Eurostat) multidimensional quality of life index be improved? A priori, the most logical answer to the above research question is the following hypothesis: Yes, the INE (and Eurostat) multidimensional quality of life index can be improved. The above a priori observation is based on the fact that it is apparently not very logical the procedure applied by the statistical office of the European Union, and consequently by the European national statistical institutes, such as the INE. The contradiction of the model applied by Eurostat and INE is that this procedure respects in the first phase of aggregation the non-compensation between indicators, and in the second phase it aggregates data by compensating between dimensions.
The rest of this paper is organized as follows.
Section 2 shows the literature review.
Section 3 presents the data source and methodology, which include the INE methodology and our reasoning and formulations to improve it.
Section 4 is dedicated to compare the results obtained by INE with the results provided by our research, including a comparative summary between the ranking obtained based on the scores given to each Autonomous Regions by the INE and the rankings obtained using our three innovative methodologies: Basic ELECTRE, Full ELECTRE, and Full Fuzzy ELECTRE.
Section 5 is devoted to discussing why and how our methodological innovation improves the current INE (and Eurostat) methodology, and at drawing some conclusions, including the identification of specific lines of future research.
2. Literature Review
A systematic literature review on the concept of quality of life shows that it has been largely studied not only by economists and mathematicians, but also by philosophers due to inherent moral debate on selecting and weighting well-being indicators [
11,
12,
13].
The mainstream literature in this field of study defends the suitability of the use of multidimensional indicators and perspective on the notion of well-being [
14,
15,
16,
17].
However, as can be seen in the following proposals, there is no unanimity as to which indicators should be included. Ref. [
18] states that happiness and overall life satisfaction are affected by many aspects of life, such as health, employment, material resources and marital status. According to [
19], social welfare, political affairs, education, and medical services are more suitable for assessing quality of life as a whole. Ref. [
20] measured well-being with affective and cognitive indicators, including the use of four items (happy, sad, angry, and afraid) as an affective measure of well-being.
There is a wide range of multidimensional quality of life index methodologies [
21] depending on criteria related to three elements of design: the dimensions and indicators selected, the methodology of aggregation, and the relative weights assigned to each dimension and indicator [
14].
The Stiglitz-Sen-Fitoussi report [
22] clearly recommends the construction of an aggregate indicator but does not go so far as to propose one. What it suggests is that statistical offices work together and reach a consensus.
Several aggregate indicators are already being constructed in academia. In the field of international organizations, the United Nations’ Human Development Index (HDI) [
23] is worth mentioning, although perhaps the best example is the OECD’s Better Life Index [
24]. In the OECD Well-being Framework, current well-being is comprised of 11 dimensions. These dimensions relate to material conditions that shape people’s economic options (Income and Wealth, Housing, Work and Job Quality) and quality of life factors that encompass how well people are (and how well they feel they are), what they know and can do, and how healthy and safe their places of living are (Health, Knowledge and Skills, Environmental Quality, Subjective Well-being, Safety). Quality of life also encompasses how connected and engaged people are, and how and with whom they spend their time (Work-Life Balance, Social Connections, Civic Engagement). After constructing these 11 dimensions, the next step should be to aggregate them into a single indicator. This step is left to the user’s discretion by proposing to use a weighted arithmetic mean where the weights would take values from 1 to 5.
If we stick to the European level, the European Statistical Office (Eurostat) has not yet constructed any aggregate indicators. Aggregation, as we have seen in the case of the OECD index, should be carried out in two steps: first by aggregating the indicators for each dimension and then by aggregating the different dimensions into a single quality of life indicator.
Most multidimensional well-being indices use aggregators such as Factor Analysis or Principal Component Analysis, such as [
25,
26]. Some other studies introduce fuzzy set theory [
27] or other methods such as geometric benefit-of-the-doubt (BoD)-method [
28].
But, out of the many aggregation methodologies that exist on the subject, one of the most widely used, for the construction of aggregate indices in multidimensional social phenomena such as quality of life, is the Mazziota-Pareto method (MPI), developed by the authors of ISTAT (Italian Statistical Institute). A variation of MPI has been used as aggregation method in recent experiments by the OECD; this variation is the adjusted Mazziota-Pareto method (AMPI) [
29].
In relation to composite indicators, it should be taken into consideration that a composite indicator is an aggregate of all dimensions, objectives, individual indicators and variables used for its construction. This implies that what defines a composite indicator is the set of properties underlying its mathematical aggregation convention” [
10].
In relation to the reliability of composite indicators, it should also be taken into consideration if the uncertainty in single indicators affect the reliability of composite indexes [
30]. In the literature on social indicators (including welfare indices) there have been traditionally two distinct fields: aggregators versus non-aggregators. The first group supports the construction of synthetic indices to describe an overall complex phenomenon. The second group opposes it, claiming that the final product is statistically meaningless. Nowadays, synthetic (or composite) indicators resulting from aggregation of variables are the most widely used and the ways of constructing them are very diverse. A fundamental article to know the methodologies used in the construction of the synthetic indicators is [
31]. This article re-examines the literature focusing on the methodological framework of composite indicators. The steps that are the focus of the paramount criticism as well as the recent development in the construction of aggregate indicators are weighting and aggregation. In [
31] a final step is also added that is beginning to be discussed: robustness.
In our article we will focus primarily on aggregation of composite indicators. According to the latest handbook on constructing composite indices, aggregation methods may be divided into three distinctive categories: linear, geometric, and multi-criteria [
32]. Another type of categorization of the aggregation methods in the literature is between ‘compensatory’ and ‘non-compensatory’ approaches [
33].
We will use a multi-criteria, non-compensatory approach in the construction of our index. As noted in [
31]: “Despite its desirable properties, judging from the number of applications existing in this literature, the non-compensatory multi-criteria approach is not met hugely popular. This could be attributed to the simplicity of construction of other methods (e.g., linear or geometric aggregation) or the issue of being computationally costly to calculate. [
33] urge developers to reflect on the cost of oversimplification that other techniques bear (e.g., linear), and, whenever possible, to use non-compensatory multi-criteria approaches”.
It is apparent from the latest publications that, after a vast number of suggestions in the literature, there is a shift towards the spectrum of non-compensatory approaches. Ref. [
29] applies this approach to the measurement of socio-economic phenomena. However, there is still no agreed multidimensional (or multi-criteria) and non-compensatory index of quality of life in the social indicators’ literature [
34].
Recent studies have proposed models for analyzing composite indicators based on MCDM. In this area of research, a number of different computer programmes are used. Among them, the SOCRATES (SOcial multi-CRiteria AssessmenT of European policieS) software stands out as a software tool designed explicitly for impact assessment problems [
35]. The
Table 1 shows selected studies on composite indicators based on MCDM.
Table 2 shows selected literature review on papers on MCDM and computational intelligence, whereas
Table 3 shows research papers using MCDM and computational intelligence to build composite indicators.
The above literature review discussion shows a research gap to consider. The novelty of our contribution is precisely to present, for the first time, an article dedicated to proposing a multidimensional index of quality of life that is completely non-compensatory.
3. Methodology and Data
The quality of life index that we propose is an improvement on the INE’s multidimensional quality of life index. In order to understand the process of constructing our index (in fact the three versions of the index that are proposed) it is necessary to begin by presenting which parts of the INE index are maintained and which are the variations introduced.
The information used for the construction of our index is the same as that used by the INE. Initially, it consists of 55 indicators, which are then grouped into 9 dimensions.
The INE aggregates the indicators in two stages [
49]:
The elementary indicators of each dimension are aggregated into a single indicator representative of the dimension using the AMPI method, hence they are called AMPI indicators.
The 9 indicators are aggregated into a single MQLI by weighted arithmetic mean, by default with equal weights. Although they are weighted by default with equal weights, the application allows the user to vary the relative weight of each dimension.
The first part of this section presents the indicators used. This is followed by an explanation of the INE dimensions as well as the dimensions we will use in the different variations of our index. Together with the explanation of the dimensions, we also show the hierarchical relationship between indicators and dimensions, both in the case of the INE and in our proposed variations of the index. This is followed by an analysis of the weaknesses of the INE index and our proposal with the variations of our index. The final sections are devoted to the methods used in the study (Adjusted Mazziotta-Pareto Method (AMPI) and ELECTRE III), ending with a reference to the source and justification of the data used.
3.1. Indicators
There are 55 indicators used to compose the MQLI are all taken from the INE publication Indicators of Quality of Life (QLI) [
2]. Not all indicators that appear in the QLI publication are included in the calculation of the MQLI. Some indicators are very similar to each other and only one of them is chosen as representative (for example, between average and median income, only the latter is taken).
On the other hand, not all indicators are available every year. The most extreme case is the governance and basic rights dimension for which there is not really a time series as there is currently only data for 2013. Another relevant case is that of “General experience of life” where the most recent data are from 2018. The 9 dimensions and 55 indicators used by INE are listed in
Appendix A Table A1 [
9,
49].
3.2. Dimensions
The INE aggregate the 55 indicators into 9 dimensions. These 9 dimensions in the second phase are aggregated into 1 index.
The 9 dimensions resulting from aggregating groups of indicators are:
Dimension 1. Material living conditions
Dimension 2. Work
Dimension 3. Health
Dimension 4. Education
Dimension 5. Leisure and social relations
Dimension 6. Physical and personal security
Dimension 7. Governance and basic rights
Dimension 8. Environment
Dimension 9. Overall experience of life
The
Figure 1 shows which indicators define each of the nine dimensions.
In the case of the INE, the dimensions are obtained by aggregating elementary indicators with the Mazziota-Pareto method.
In our case, the dimensions will be obtained in the same way as the INE does in the variation of the index called BASIC ELECTRE. In the case of FULL ELECTRE and FULL FUZZY ELECTRE, the dimensions are obtained by aggregating the same elementary indicators but through the ELECTRE method.
As mentioned above, the INE aggregates the dimensions through an arithmetic mean. We will always aggregate the dimensions through an ELECTRE III.
3.3. The Weaknesses of the INE Index and Our Proposal for a Multidimensional Quality of Life Index
The main characteristics of the Mazziota-Pareto method applied to multidimensional phenomena are based on the aggregation of indicators that are not substitutable with each other, all with the same relevance in the phenomenon analyzed, and which do not compensate each other (a low value in one indicator is not compensated by a high value in another).
The INE points out that, the AMPI method is only one of the possible methods for aggregating, being the choice of one method or another arbitrary. Moreover, INE implicitly weights all the dimensions equally, which is also arbitrary.
From our point of view, there are two debatable aspects in the construction of the multidimensional quality of life index proposed by the INE:
The methodology proposed for the aggregation of the 9 dimensions, the arithmetic mean, since it is a compensatory method, unlike the aggregator used in the first phase which was non-compensatory (AMPI method). The “non-compensatory” condition should be respected in both phases.
The weighting of the dimensions. Although, as mentioned in the INE document itself, the weighting must be “subjective”, a method must be proposed that can incorporate as closely as possible the importance that the user attaches to each dimension. It should be borne in mind here that the user is not always able to assign a numerical value that faithfully represents the relative importance of the dimensions.
Our aim, in this article, is to propose an aggregation methodology for the construction of the multidimensional quality of life index (MIQL) that is non-compensatory, in coherence with the non-compensatory character of the AMPI method used in the first phase of aggregation.
Specifically, we propose the following three variations of the multidimensional quality of life index:
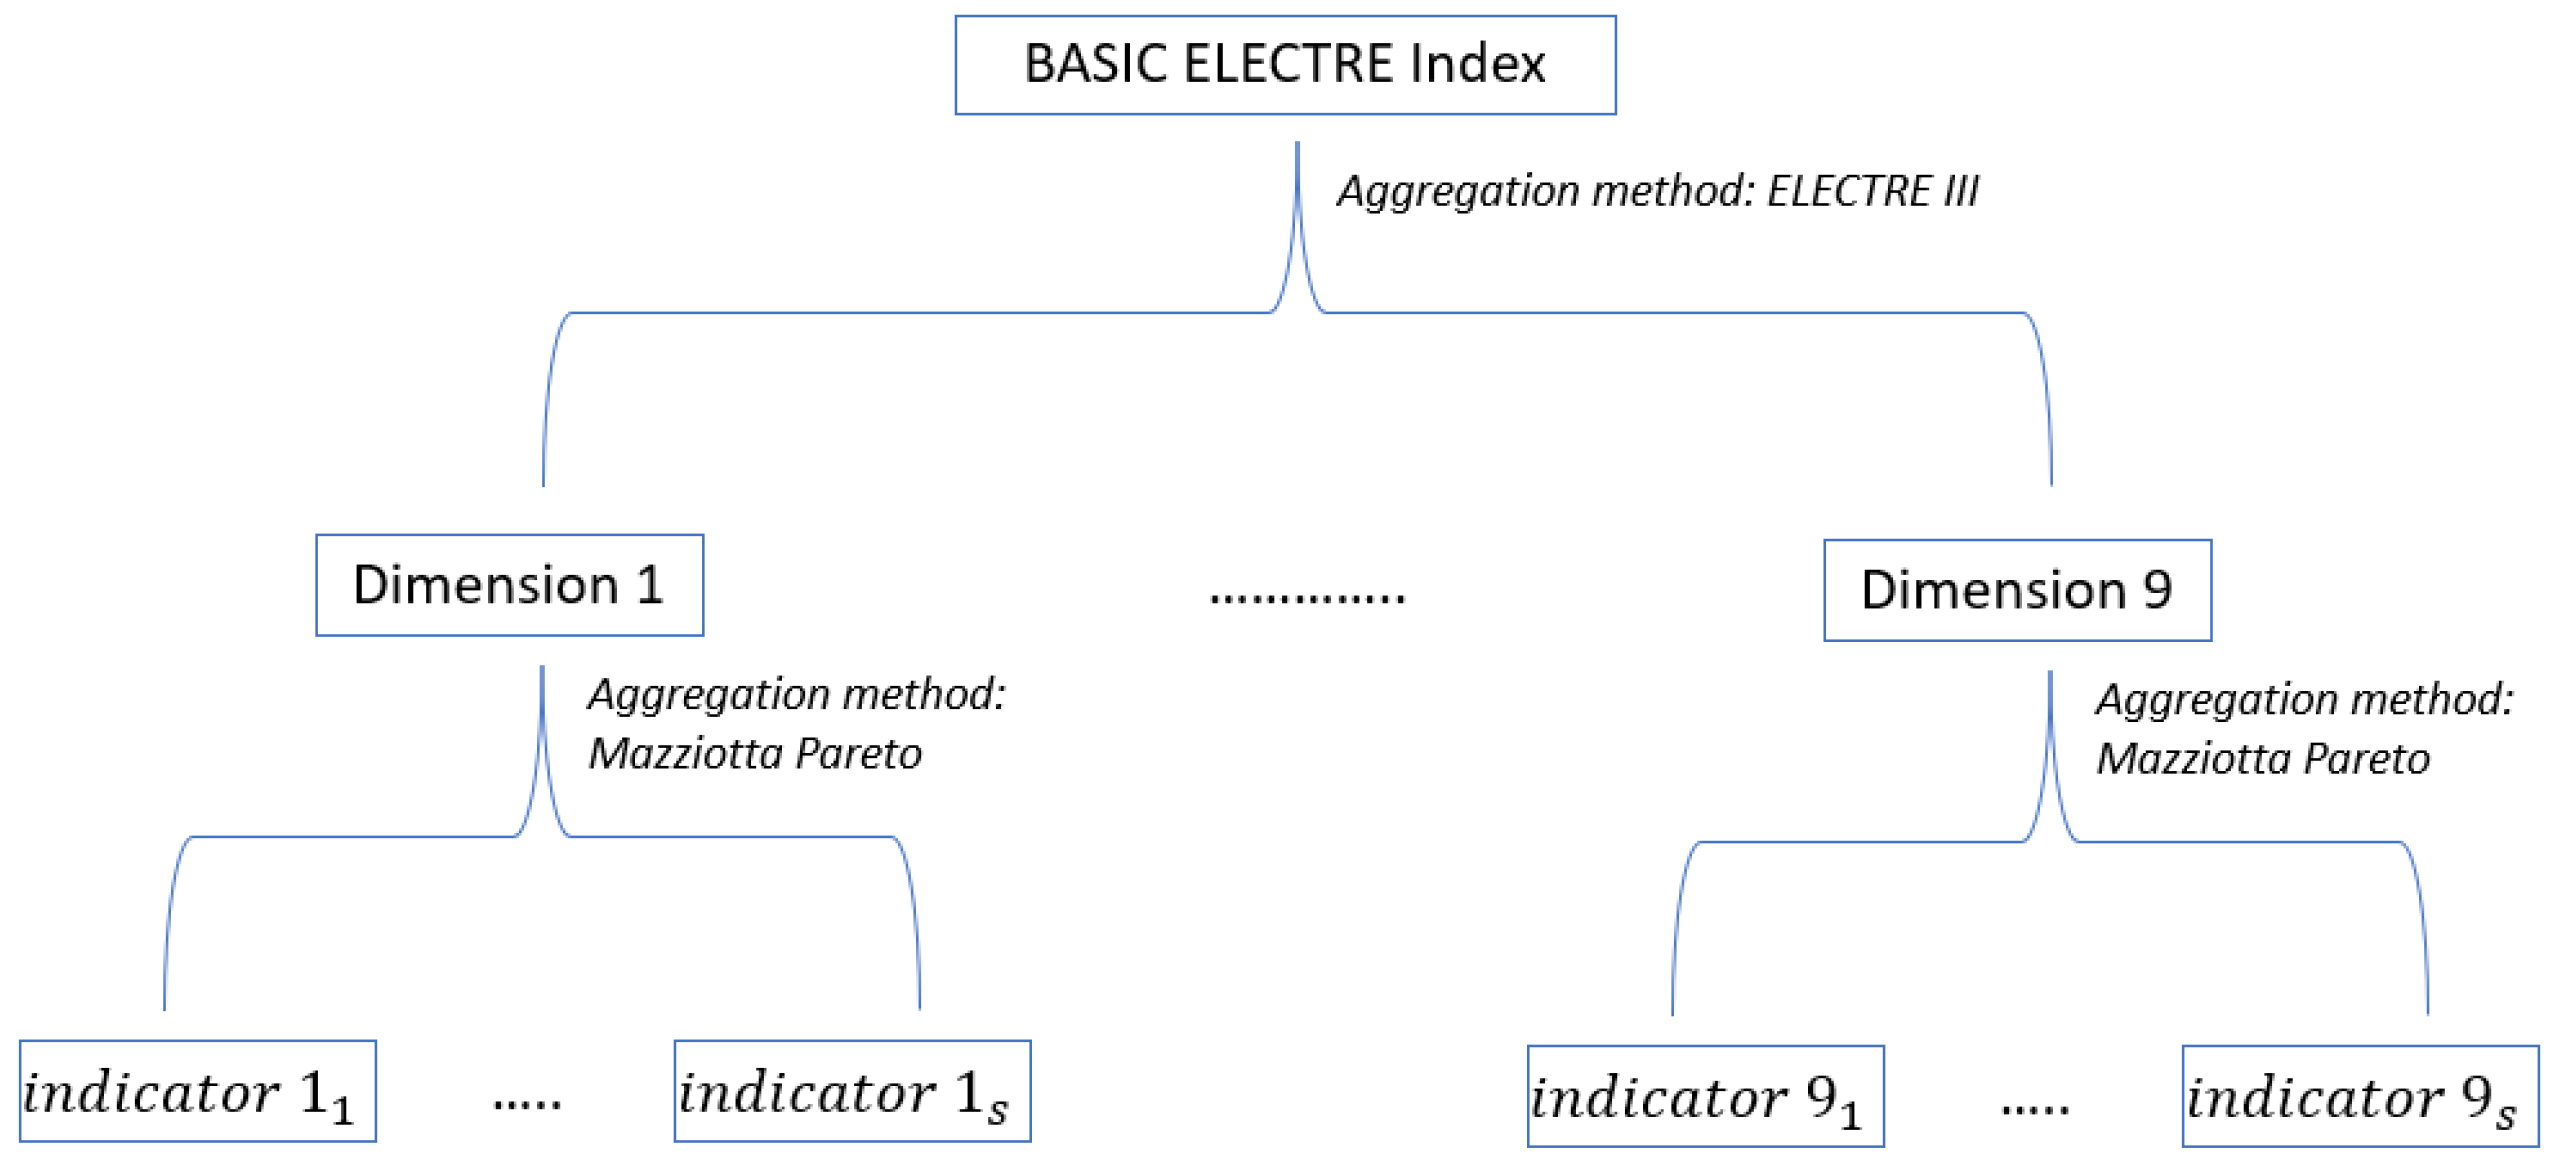
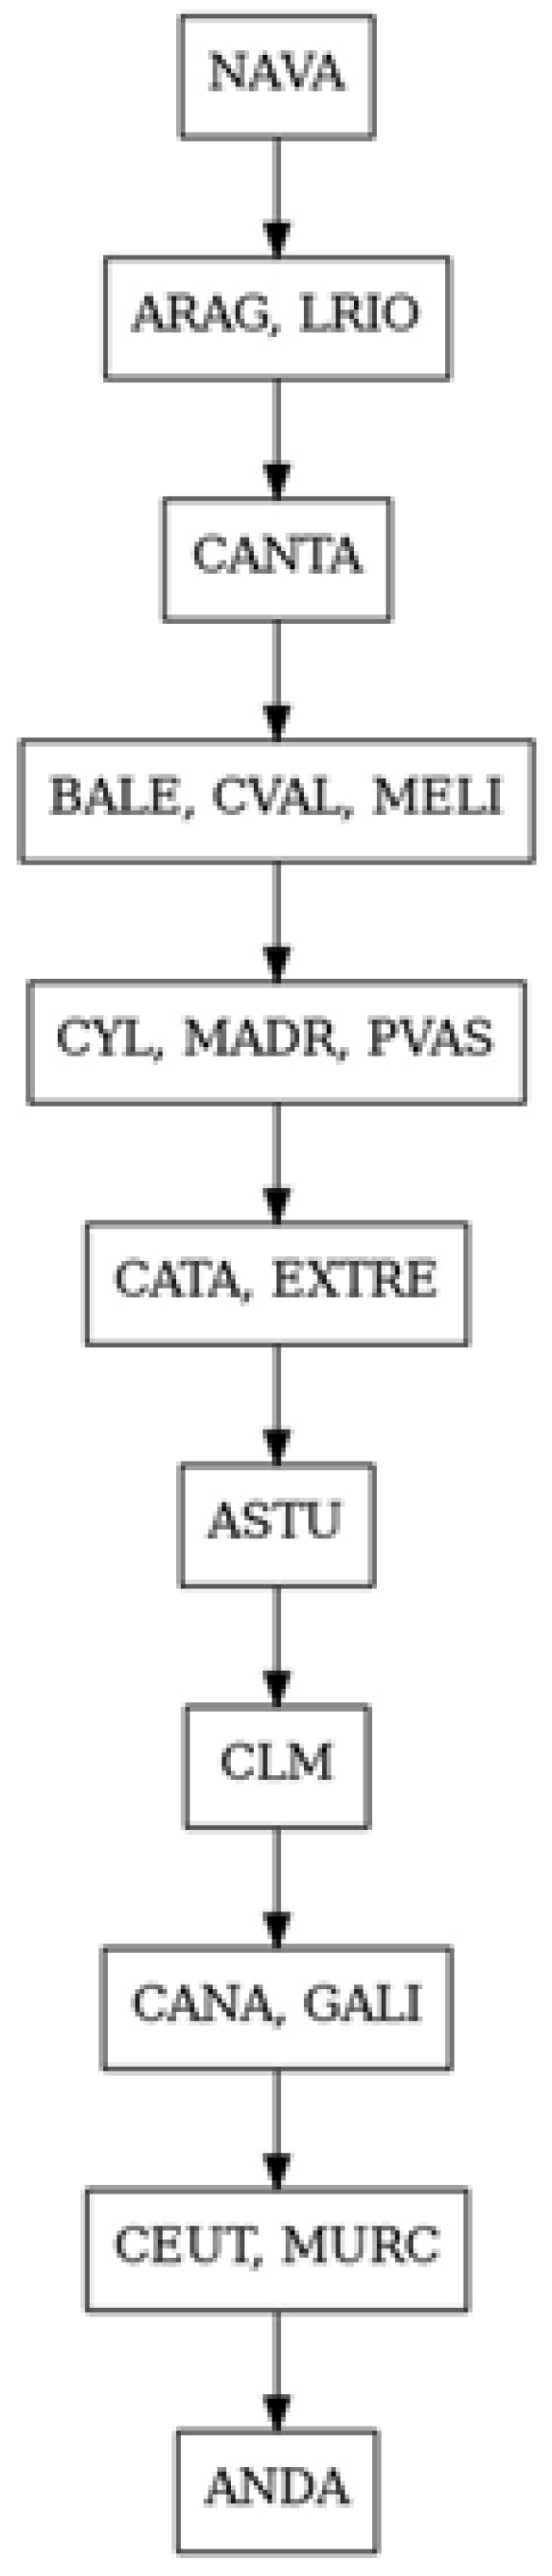
BASIC ELECTRE: To use the AMPI method to aggregate elementary indicators into 9 dimensions. To use ELECTRE III to create a ranking that allows us to compare Autonomous Regions.
Figure 2 shows the first variation that we propose: BASIC ELECTRE Index.
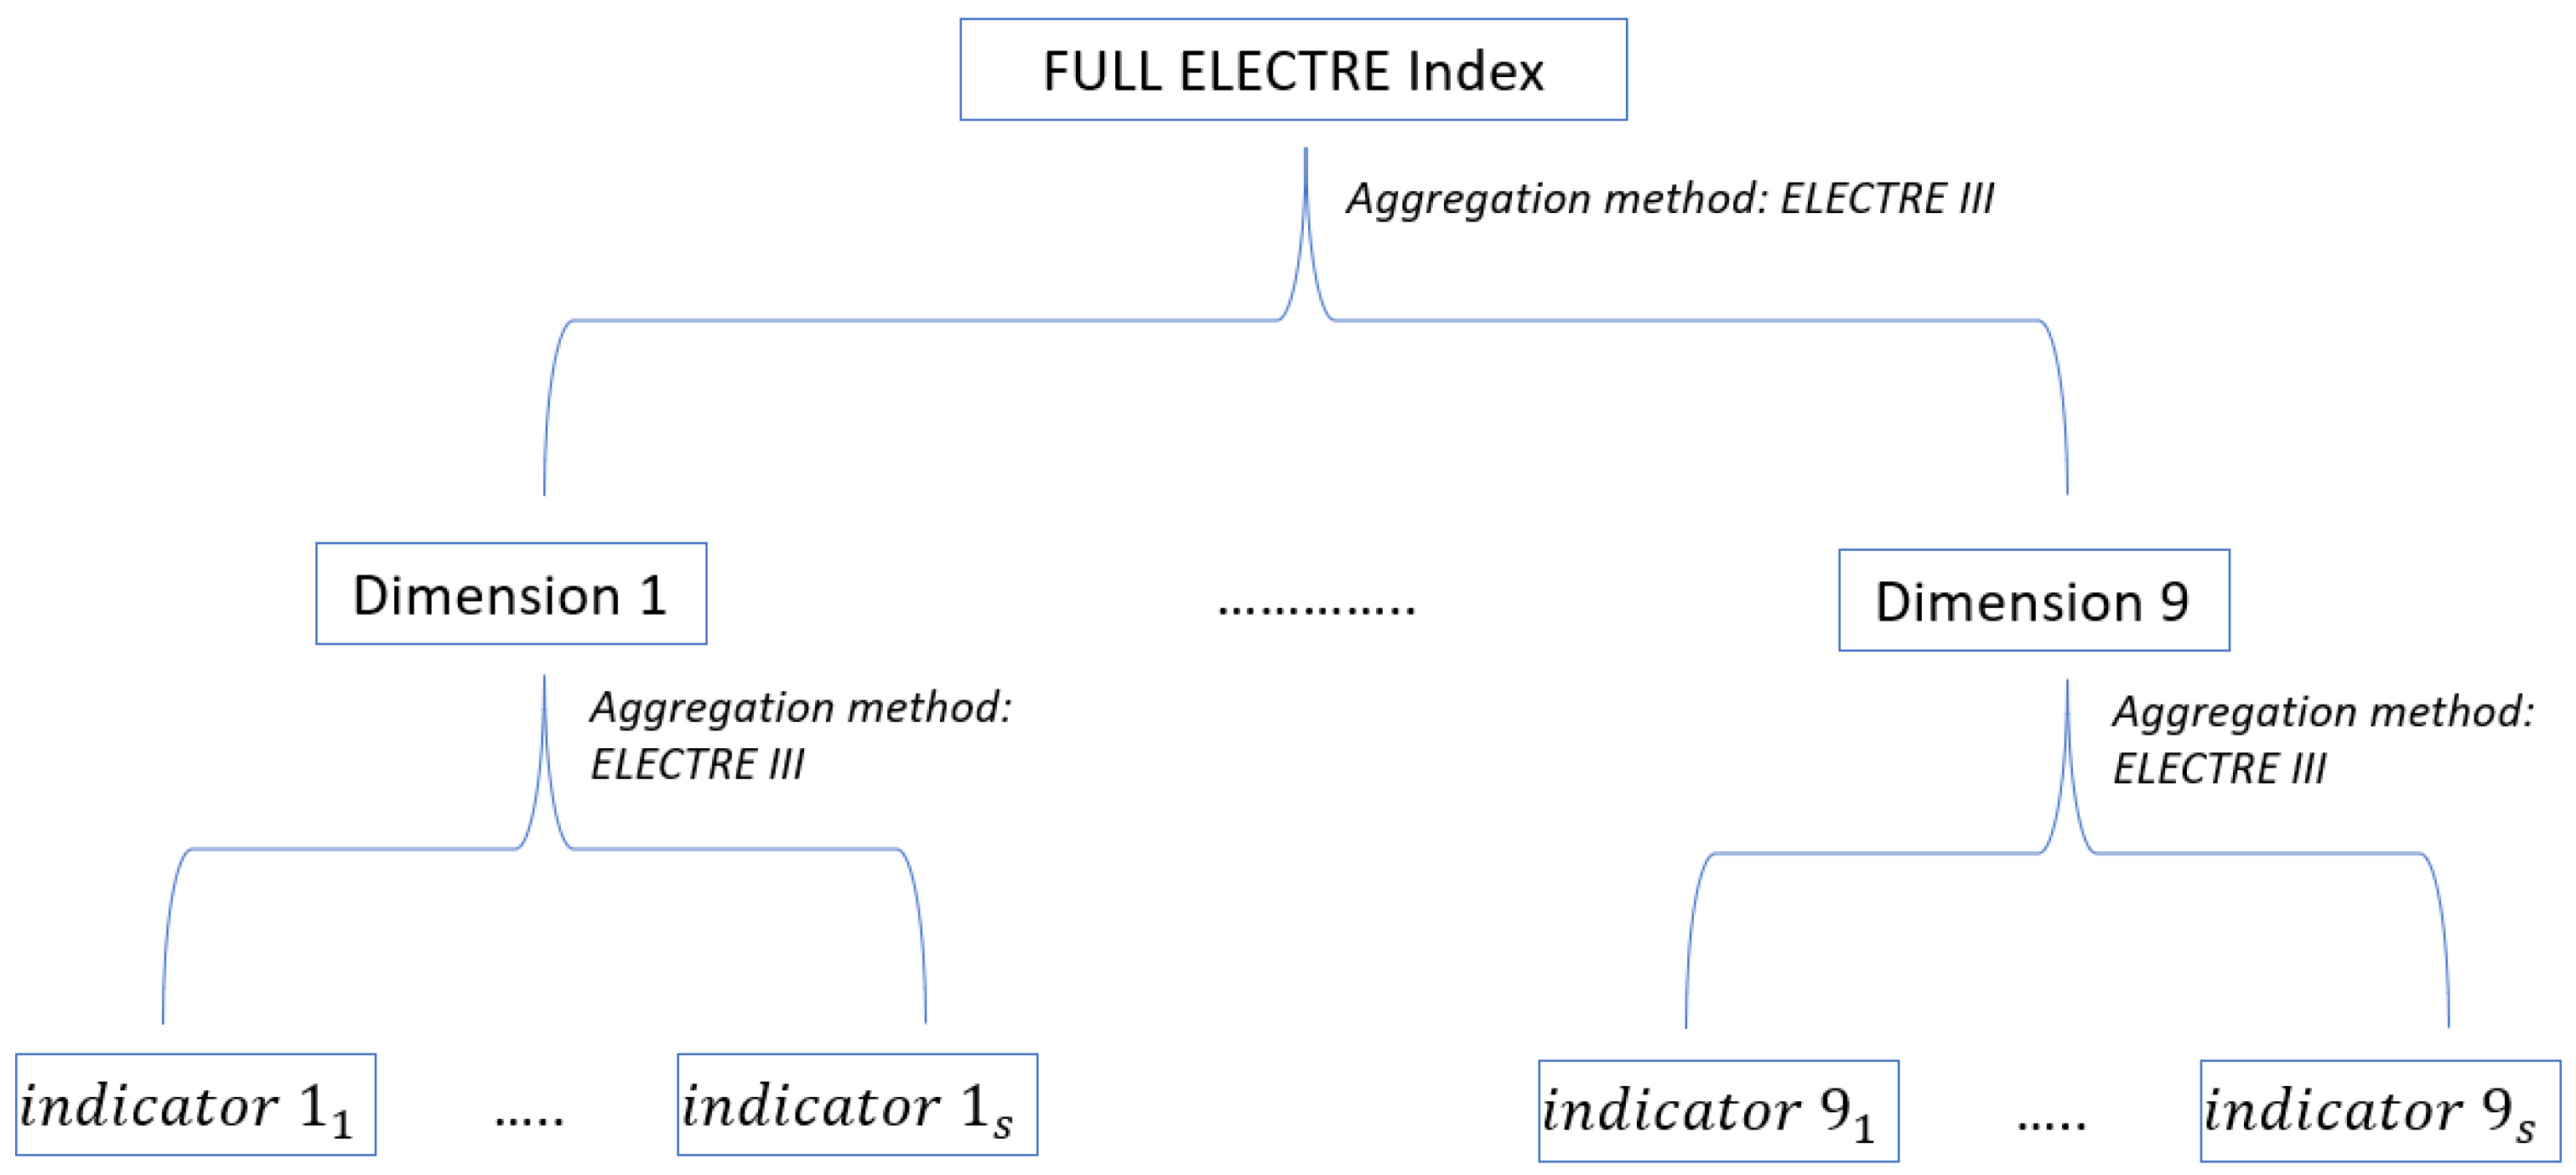
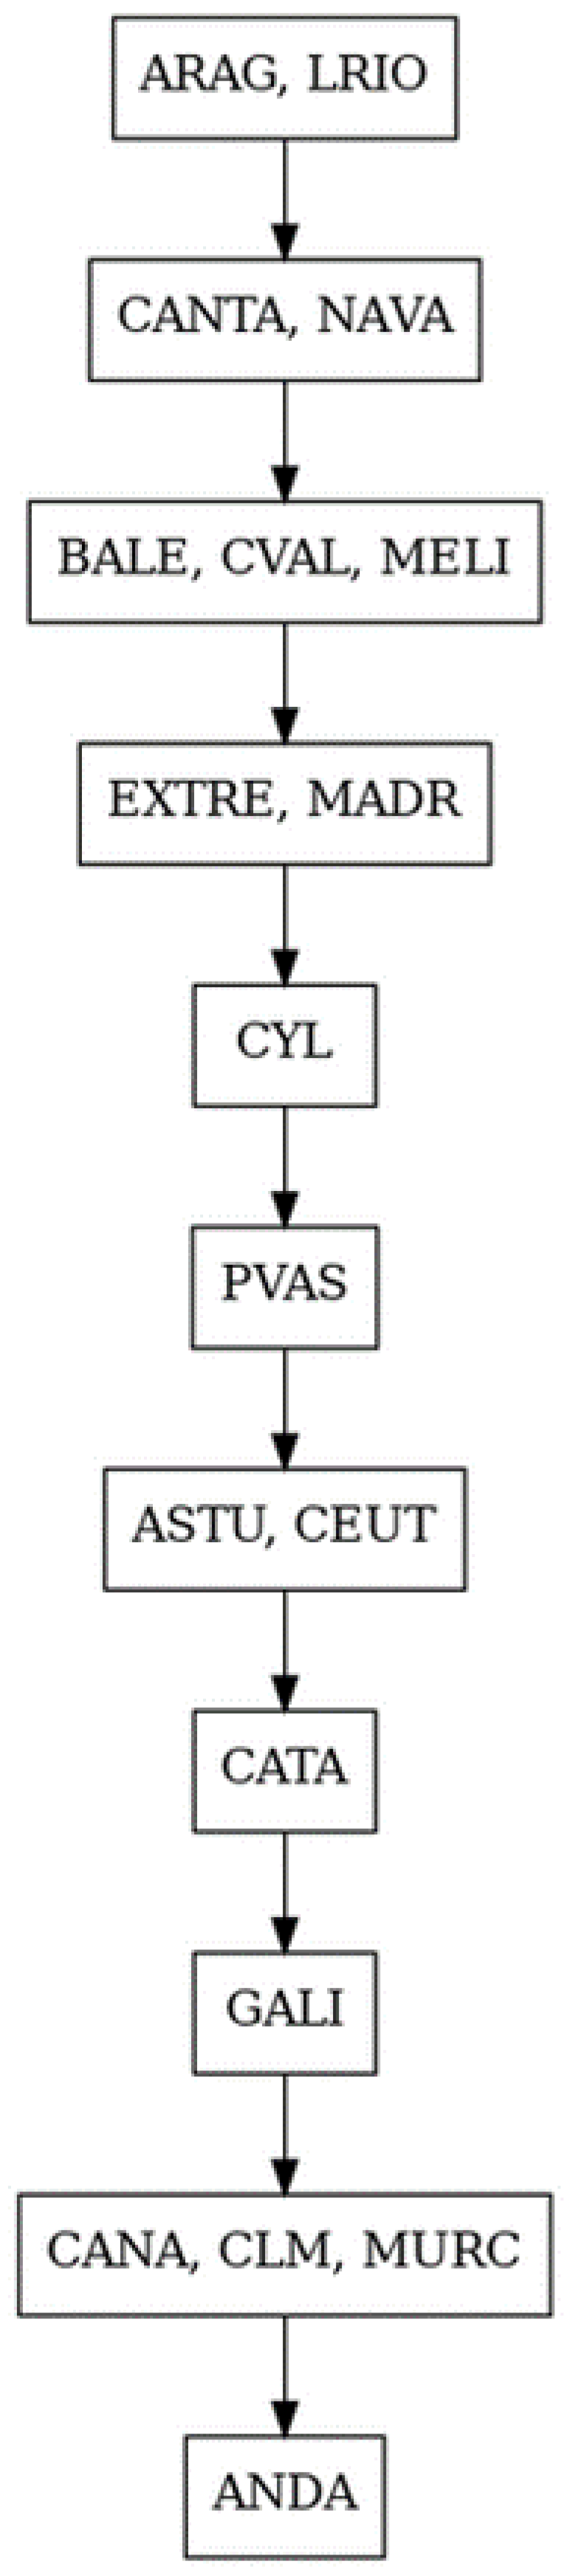
FULL ELECTRE: To use ELECTRE III to aggregate indicators in the first phase and again ELECTRE III to aggregate the 9 dimensions resulting from the first phase to create a final index in the form of a ranking.
Figure 3 shows the second variation that we propose: FULL ELECTRE Index.
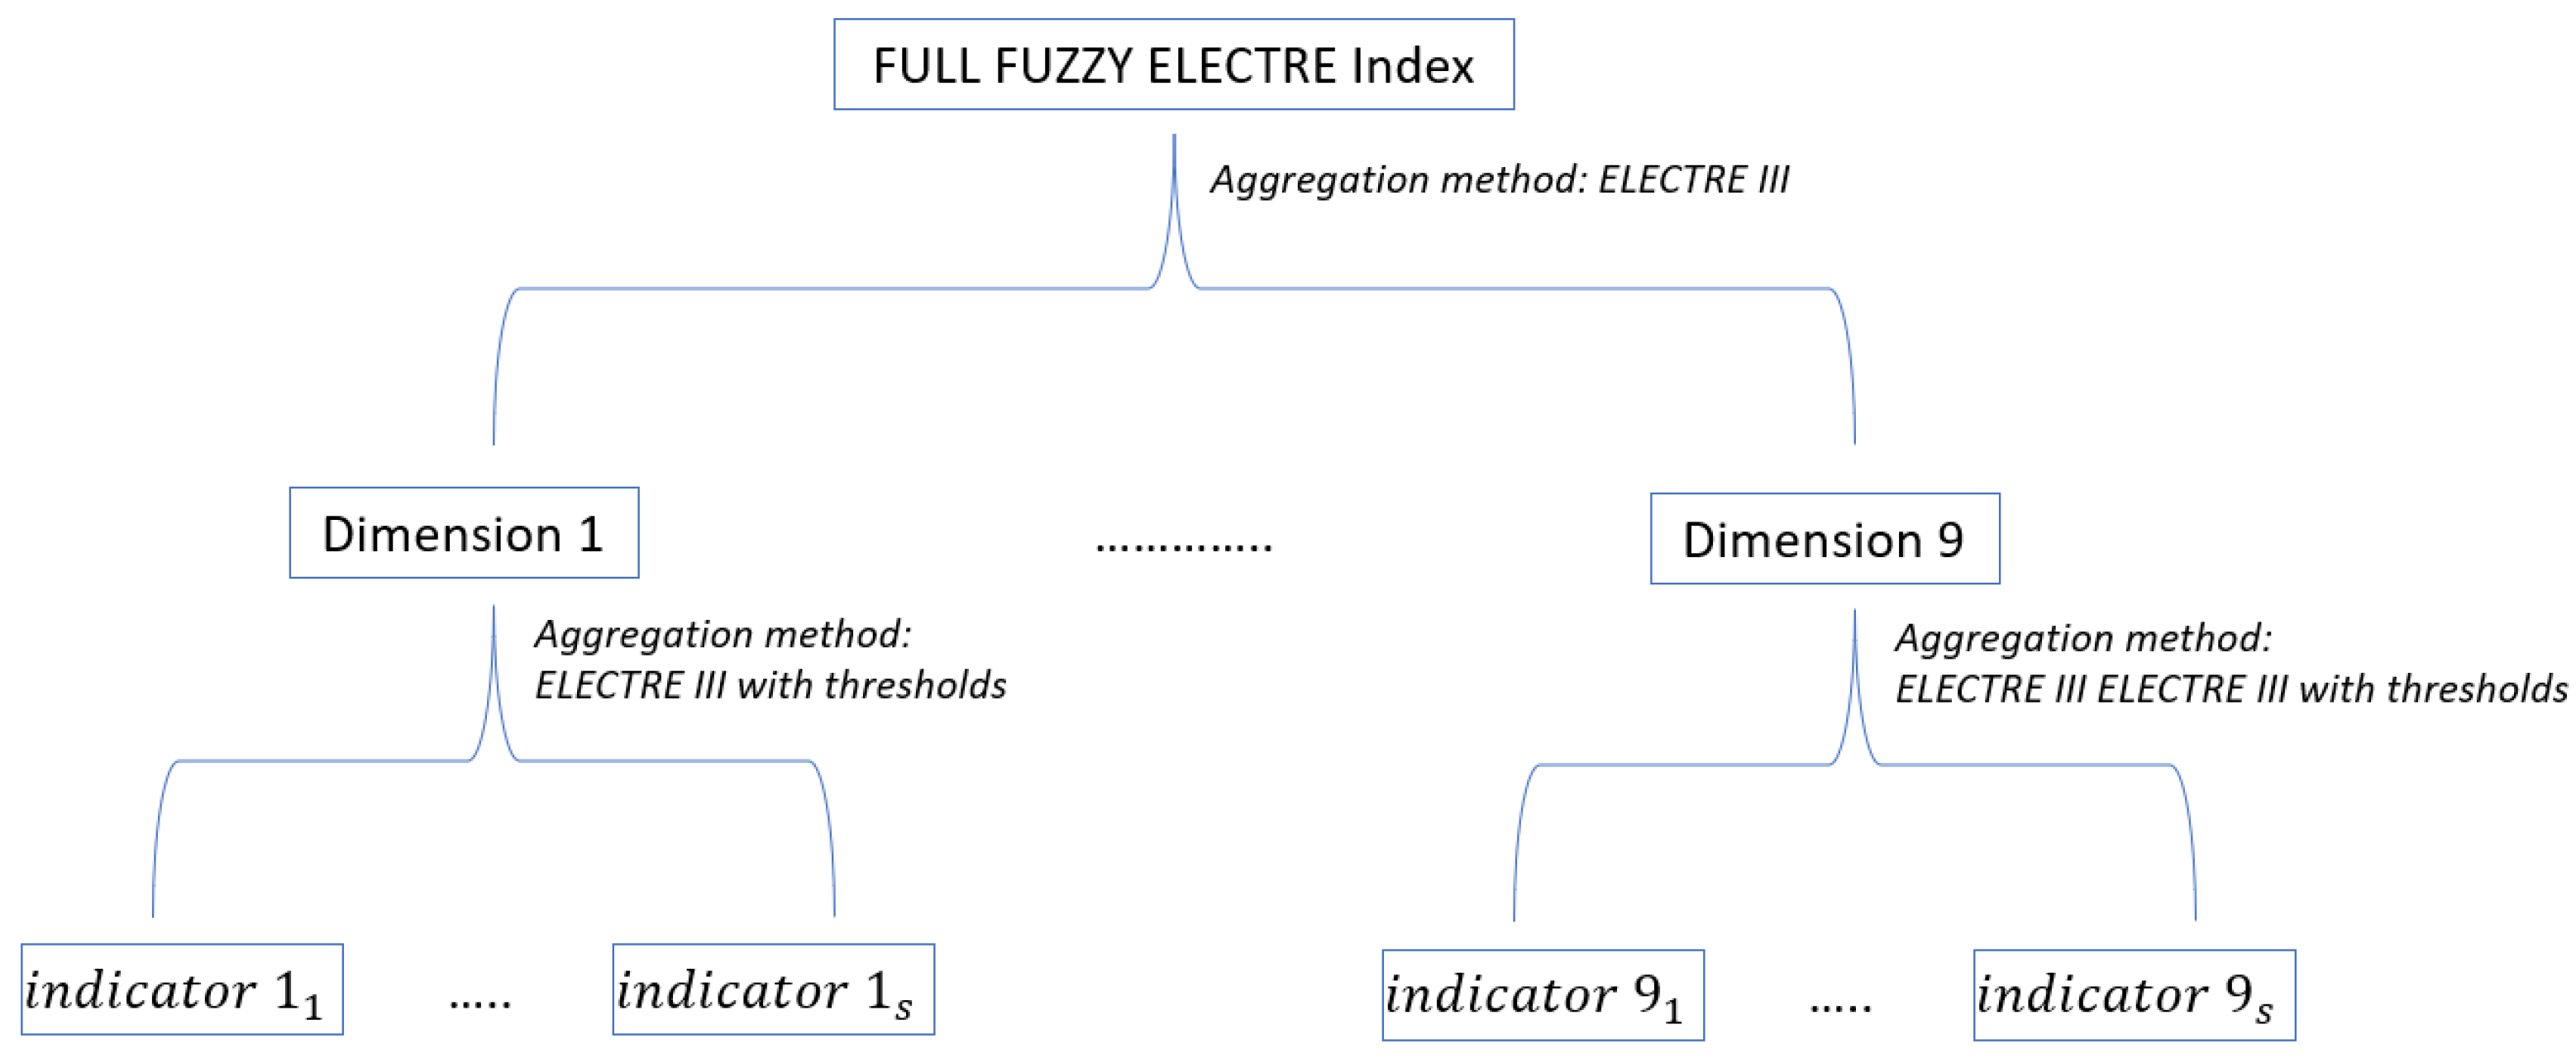
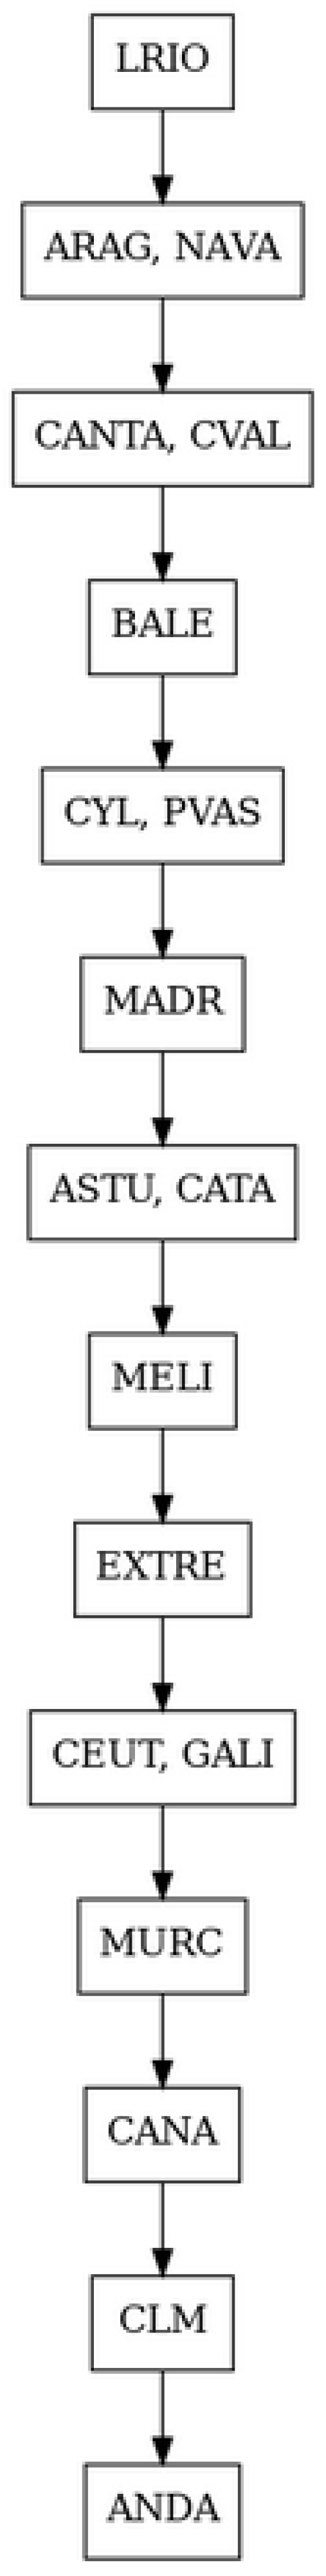
FULL FUZZY ELECTRE: To use ELECTRE III to aggregate indicators in the first phase and again ELECTRE III to aggregate the 9 dimensions resulting from the first phase to create a final index in the form of a ranking. The difference between this index and FULL ELECTRE is that thresholds are introduced when aggregating indicators (this will be explained later).
Figure 4 shows the third variation that we propose: FULL FUZZY ELECTRE Index
The data were entered by authors into the Diviz software [
50,
51,
52,
53] to conduct an ELECTRE III method. The reason to choose the ELECTRE III method to implement the application of a multicriteria decision-making (MCDM) technique in the three innovative methodologies that we propose, is that it is most suitable technique for outranking relations that deal with ranking problematic [
54].
We will present the results obtained with our proposal and compare them with those obtained by INE. Precisely, to make a direct comparison with the INE results, we will not introduce weights for the dimensions (all nine dimensions will have the same weight) and we will compare our results with the one from INE.
The question of how to weight the nine dimensions, as well as whether the initial indicators should also be weighted, is of course a problem that remains to be solved. A large part of the problem lies in whether such weights should be consensual or whether complete subjectivity should be allowed.
3.3.1. The Adjusted Mazziotta-Pareto Method (AMPI)
As it has been stated by INE [
49], the Mazziota-Pareto method consists of the following steps:
Standardization
Given the matrix with n rows and m columns.
The normalised matrix
is calculated. Where indicator j has mean 100 and standard deviation 10:
where
and
are the mean and standard deviation of indicator
j. The sign ± will depend on the relationship of indicator j to the phenomenon to be measured (+ in the case of indicator
j will depend on the relationship of indicator
j to the phenomenon to be measured (+ if the indicator represents a positive change and—if it represents a negative change).
Aggregation
Let
the coefficient of variation of the standardised values of the indicators
in statistical unit
,
and
be the mean and standard deviation of the standardized values of the indicators
in statistical unit
. The generalized form of the MPI is:
The ± sign depends on the type of phenomenon to be measured. If the composite index measures a positive phenomenon, i.e., increasing values of the index correspond to positive variations of the phenomenon is used. On the contrary, if the composite index measures a negative phenomenon, i.e., increasing values of the index correspond to increases of the negative phenomenon (e.g., increased poverty), is used.
The Mazziotta Pareto method is recommended for single-year analyses. Subsequently, the same authors developed an adjusted version of the MPI method, called AMPI (Adjusted Mazziotta Pareto Index) which allows for spatial and/or temporal comparisons.
The Adjusted Mazziotta-Pareto Index (AMPI) is an adjustment of the Mazziotta Pareto method, beforehand explained, to allow comparisons in space and/or time.
To be able to make absolute comparisons over a period of time we need a re-scaling of the values of each of the indicators with respect to two benchmarks to two reference points: the “maximum value” and the “minimum value”, which represents the range of each variable in all periods of time and in all statistical units.
The steps for the calculation of the AMPI are as follows:
Given the matrix
with n rows (statistical units) and m columns (indicators), the normalized matrix
is calculated:
where
is the value of indicator
for unit
and
and
are the extreme reference points of indicator
. If indicator
has a negative polarity, the complement of
with respect to 200 is applied. The range of the normalized values is (70; 130). This range can be changed to (85; 115).
Where and are the mean and standard deviation of the normalized values of unit , the generalized form of the adjusted MPI is where is the coefficient of variation of unit . The sign ± depends on the type of phenomenon to be measured as detailed in the MPI method.
This method allows comparisons to be made over time, between dimensions and between groups (by sex, age, by Autonomous Community). The results are obtained on a relative scale relative to a reference value of 100. In particular, the AMPI indicators chosen for the construction of the MQLI are calculated taking as a range the values (85; 115) and taking 2008 as the base year. As a first approximation, it is calculated only by Autonomous Community.
3.4. ELECTRE III
ELECTRE III is a method based on outranking relations that deals with ranking problematic. The goal is to propose a ranking of alternatives (Autonomous Regions in our case) ordered from best to worst by means or pairwise comparisons [
55].
Let be the set of alternatives.
Let be a coherent family of criteria.
Let be the value of the criterion for the alternative .
Let be the weight of the criterion .
An outranking relation, where alternative a outranks alternative b (denoted by a S b), expresses the fact that there are sufficient arguments to decide whether a is at least as good as b and there are no essential reasons to refute this. An outranking degree S(a,b) between a and b will be computed in order to ‘measure’ or to ‘evaluate’ this assertion. Outranking relations are based on binary relations. Three basics binary relations are considered: preference, indifference (ELECTRE III considers that indifference is not necessarily transitive), and incomparability.
If we consider two alternatives a and b, four situations may occur:
Numbered lists can be added as follows:
aSb and not bSa, i.e., aPb (a is strictly preferred to b);
bSa and not aSb, i.e., bPa (b is strictly preferred to a);
aSb and bSa, i.e., aIb (a is indifferent to b);
Not aSb and not bSa, i.e., aRb (a is incomparable to b).
ELECTRE methods are built on the basis of two principles: the principle of concordance and the principle of discordance with an assertion given. The concordance principle states that if a is demonstrably as good as or better than b according to a sufficiently large weight of criteria, then this is considered to be evidence in favour of a outranking b. The discordance principle states that if b is very strongly preferred to a on one or more criteria, then this is considered to be evidence against a outranking b.
In a first phase ELECTRE III constructs the outranking relationship between the alternatives. In a second phase ELECTRE III exploits the outranking relation constructed before.
To construct the outranking relationship, ELECTRE III uses different kind of parameters to model intra and inter criteria information. The inter criteria information is contained into the weights of criteria. The intra criteria information models decision-maker’s preferences, these parameters are the preference, indifference, and veto thresholds. Criteria can be increasing or decreasing. In what follows, and without lack of generality, we will consider the criteria to be increasing.
The indifference threshold indicates the largest difference between the alternatives’ performances on a given criterion that makes the two performances indifferent to the decision-maker. Let be the indifference threshold for criterion i. Alternative b is weakly preferred to alternative a in terms of criterion i if .
The preference threshold indicates the largest difference between the performances of the two alternatives such that one is preferred over the other for the criterion under consideration. Let be the preference threshold for criterion i. Alternative b is strictly preferred to alternative a in terms of criterion i if .
The veto threshold for a criterion is the difference between the performances of the two alternatives above which it seems reasonable to reject any credibility about the outranking of one alternative by the other alternative, even when all other criteria are in line with this outranking. Let be the veto threshold for criterion i. Alternative a cannot outrank alternative b if the performance of b exceeds that of a by an amount greater than the veto threshold, i.e., if .
ELECTRE III constructs a partial concordance index per criterion. Next, an overall concordance index and a discordance index are defined. The credibility index is then calculated based on the above two indices.
Below we specify what each of the indices introduced above measures:
Partial Concordance index measures the strength of support, given the available evidence, that a is at least as good as b considering criteria one specific criterion;
Global Concordance index measures the strength of support, given the available evidence, that a is at least as good as b considering criteria all criteria;
Discordance index measures, for each criterion, the strength of the evidence against the hypothesis that a is at least as good as b. Credibility index measures the strength of the claim that “alternative a is at least as good as alternative b”.
The decision-maker must provide information relative to the value of the parameters that represent the indifference , preference , and veto thresholds, and the weight of each criterion .
These values allow the calculation of the partial concordance, overall concordance, and discordance indices, as well as the credibility index.
Partial concordance index per each criterion
:
Global concordance index:
Discordance index for each criterion:
If no veto threshold is specified, for all pairs of alternatives.
If no veto threshold is specified, S(a,b) = C(a,b) for all pairs of alternatives.
Once the credibility index has been calculated, the second phase of ELECTRE III, the exploitation phase of the outranking relations, can be moved on. This phase consists of the exploitation of the pairwise outranking indices through bottom-up and top-down distillations.
Each one of the distillation procedures calculate a complete pre-order where each pre-order takes into account the behaviour of each alternative when outranking or being outranked by the other alternatives. These two distillations can lead to two different complete pre-orders. The final partial pre-order is obtained as the intersection of these two complete pre-orders [
56].
3.5. Data
The data used in this study are openly available at the webpage of the INE and were obtained by INE from population surveys [
2]. The latest available data, prior to the start of the confinement in Spain due to the COVID-19 pandemic, have been used, being these data corresponding to the year 2019. It has been considered that in March 2020 there was a turning point in quality of life due to a temporary issue that significantly affected quality of life, so that, although data for 2020 are available, no conclusions can be drawn for 2020, and for 2021 the data are not currently published, although even if they were, no conclusions could be drawn with the data for 2021 due to the anomaly in quality of life during the years of the pandemic.
4. Results
We will now compare the results obtained by INE with the results provided by our research.
First, we will compare the global INE result with the result of aggregating the nine dimensions obtained by INE with an ELECTRE III assuming that all weights are equal to 1 and no threshold is introduced. We will call this approach “BASIC ELECTRE III: INE Dimensions aggregated with an ELECTRE III”.
Second, a more complex model is proposed below. The variables that make up each dimension will be aggregated with an ELECTRE III. All variables will have a weight equal to 1 and no thresholds will be introduced. This model has been named “Full ELECTRE III”.
Then, a third model is proposed where ELECTRE III is used for the aggregation in the first phase and indifference and preference thresholds will be introduced (but not for veto). The indifference threshold will be equal to 1% of the difference between the maximum and minimum value of the variable. The preference threshold shall be equal to 5% of the difference between the maximum and the minimum value of the variable. In this way, for each dimension a ranking (a partial pre-order) will be obtained. The 9 rankings will be aggregated again thanks to ELECTRE III. An alternative approach, that could be addressed in future lines of research, is to apply the Revised Simos method [
42] to assign weights to each of the nine dimensions.
The indifference and preference threshold will not be introduced this time because each dimension is a ranking. This approach will be referred to as “Full Fuzzy ELECTRE III: ELECTRE III two-stage approach”.
4.1. Basic ELECTRE: INE Dimensions Aggregated with an ELECTRE III
Our Improved Multidimensional Quality of Life Index (IMQLI) is constructed based on the INE’s Quality of Life Indicators [
57] and is broken down into nine dimensions: 1.-Material living conditions; 2.-Work; 3.-Health; 4.-Education; 5.-Leisure and social relations; 6.-Physical and personal safety; 7.-Governance and basic rights; 8.-Environment; and 9.-General experience of life.
Table 4 shows the 9 dimensions obtained by INE for the year 2019 as well as the global value of the MQLI by Autonomous Communities. For each one of the 9 dimensions, indicators are aggregated using the Adjusted Mazziotta-Pareto Index (AMPI). Then, the 9 dimensions are aggregated by weighted arithmetic mean, by default with equal weights, although it should be noted that the INE application allows the user to vary the relative weight of each dimension.
Our first approach is to aggregate the 9 dimensions of the INE with an ELECTRE III where all weights are equal to 1 (we will see later how to vary these weights) and where no indifference, preference or veto thresholds is introduced (we will also see later how thresholds can be introduced).
Figure 5 shows the ELECTRE III ranking obtained. The full name of each Autonomous Communities is shown in
Table 5.
The comparison between our result, aggregating the 9 dimensions with ELECTRE III, and the result obtained by INE, aggregating the 9 dimensions with an arithmetic mean, can be seen in
Table 5.
Thus, the first difference we find is that we compare ranks with scores. Moreover, as the ELECTRE III aggregator is a non-compensatory methodology, it is to be expected that some alternatives have a different comparative position in our approach than in the INE methodology.
4.2. ELECTRE III Two-Stage Approach
In this section we are going to apply an ELECTRE III both for the aggregation of the indicators that make up each of the 9 dimensions and for the aggregation of the 9 dimensions. We believe that this approach is more appropriate since a non-compensatory aggregator is used in both steps and, in addition, the outranking relationships allow us to establish 4 types of relationships for each pair of alternatives (strict preference, weak preference, indifference, and incomparability).
4.2.1. Full ELECTRE: ELECTRE III Two-Stage Approach with Weights Equal to 1 in Both Stages and No Thresholds
First, we will apply the ELECTRE III aggregator in both phases and in both cases, we will assign weights equal to 1 for all criteria (indicators or dimensions) and we will also not set any thresholds. In this way we want to compare the solutions obtained with our approach with the INE results progressively, as we refine our approach. Finally, we will introduce weights on the criteria and also thresholds. It is in this last way that we believe the approach is more suitable for comparing the multidimensional index of quality of life between the Autonomous Regions.
The ranks for the nine dimensions obtained with ELECTRE III from the original INE indicators [
49] are presented in
Table 6.
The final ranking aggregating these nine dimensions with ELECTRE III with all weights equal to 1 and no thresholds can be seen in
Figure 6 and the comparison with the global ranking provided by INE in
Table 7.
Figure 6 shows the final ranking aggregating the nine dimensions with ELECTRE III with all weights equal to 1.
4.2.2. Full Fuzzy ELECTRE: ELECTRE III Two-Stage Approach with Thresholds on the Indicators of the Dimensions
Now we present a new proposal introducing thresholds in the first stage of ELECTRE III, but maintaining weights equal to 1 on the 9 dimensions to compare the results with the INE result.
Indifference thresholds are calculated for each indicator as 1% of the difference between the maximum and the minimum value of each indicator. Preference thresholds are calculated for each indicator as 5% of the difference between the maximum and the minimum value of each indicator.
Table 8 shows the indifference and preference thresholds for each one of the indicators of the 9 dimensions.
Each of the 9 dimensions will be obtained by aggregating their indicators with ELECTRE III and using the indifference and preference thresholds defined above. No veto thresholds will be used to make the result more objective and comparable with the dimensions obtained by INE with the AMPI method. For this same reason no weights will be introduced for the indicators as the INE gives all indicators the same importance.
Table 9 shows the 9 dimensions obtained aggregated with ELECTRE III including thresholds.
We need now to aggregate these 9 dimensions with ELECTRE III. Weights will be set to 1 to make comparisons with the INE results. No thresholds will be set here as the criteria (dimensions) are rankings.
The final ranking aggregating these nine dimensions with ELECTRE III with all weights equal to 1 and no thresholds can be seen in
Figure 7 and the comparison with the global ranking provided by INE in
Table 10.
Table 10 shows the comparison between our result (ELECTRE III with all weights equal to 1 and no thresholds) and INE result (arithmetic mean).
At this point, we believe it is interesting to make a comparative summary between the ranking obtained based on the scores given to each Autonomous Regions by the INE and the rankings obtained using our three innovative methodologies:
Basic ELECTRE: Ranking by aggregating with an ELECTRE III the 9 dimensions calculated with the AMPI method.
Full ELECTRE: Ranking with ELECTRE III two-stage with no thresholds on the indicators and weights always equal to 1.
Full Fuzzy ELECTRE: Ranking with ELECTRE III two-stage with thresholds on the indicators and weights always equal to 1.
Table 11 shows the comparison between our result for each one of the three innovative methodologies that we propose, that is Basic ELECTRE, Full ELECTRE, and Full Fuzzy ELECTRE, versus INE result using arithmetic mean.
ELECTRE III Two-Stage Approach with Thresholds on the Indicators of the Dimensions and Different Weights on the Dimensions
We will now make a final comparison between our results and the INE results by introducing a set of weights for the 9 dimensions.
The INE allows us to introduce a weight for each dimension on a scale from 1 to 10. Let us assume that we introduce the weights shown on
Table 12, which shows the weight for each dimension introduced by authors in INE model.
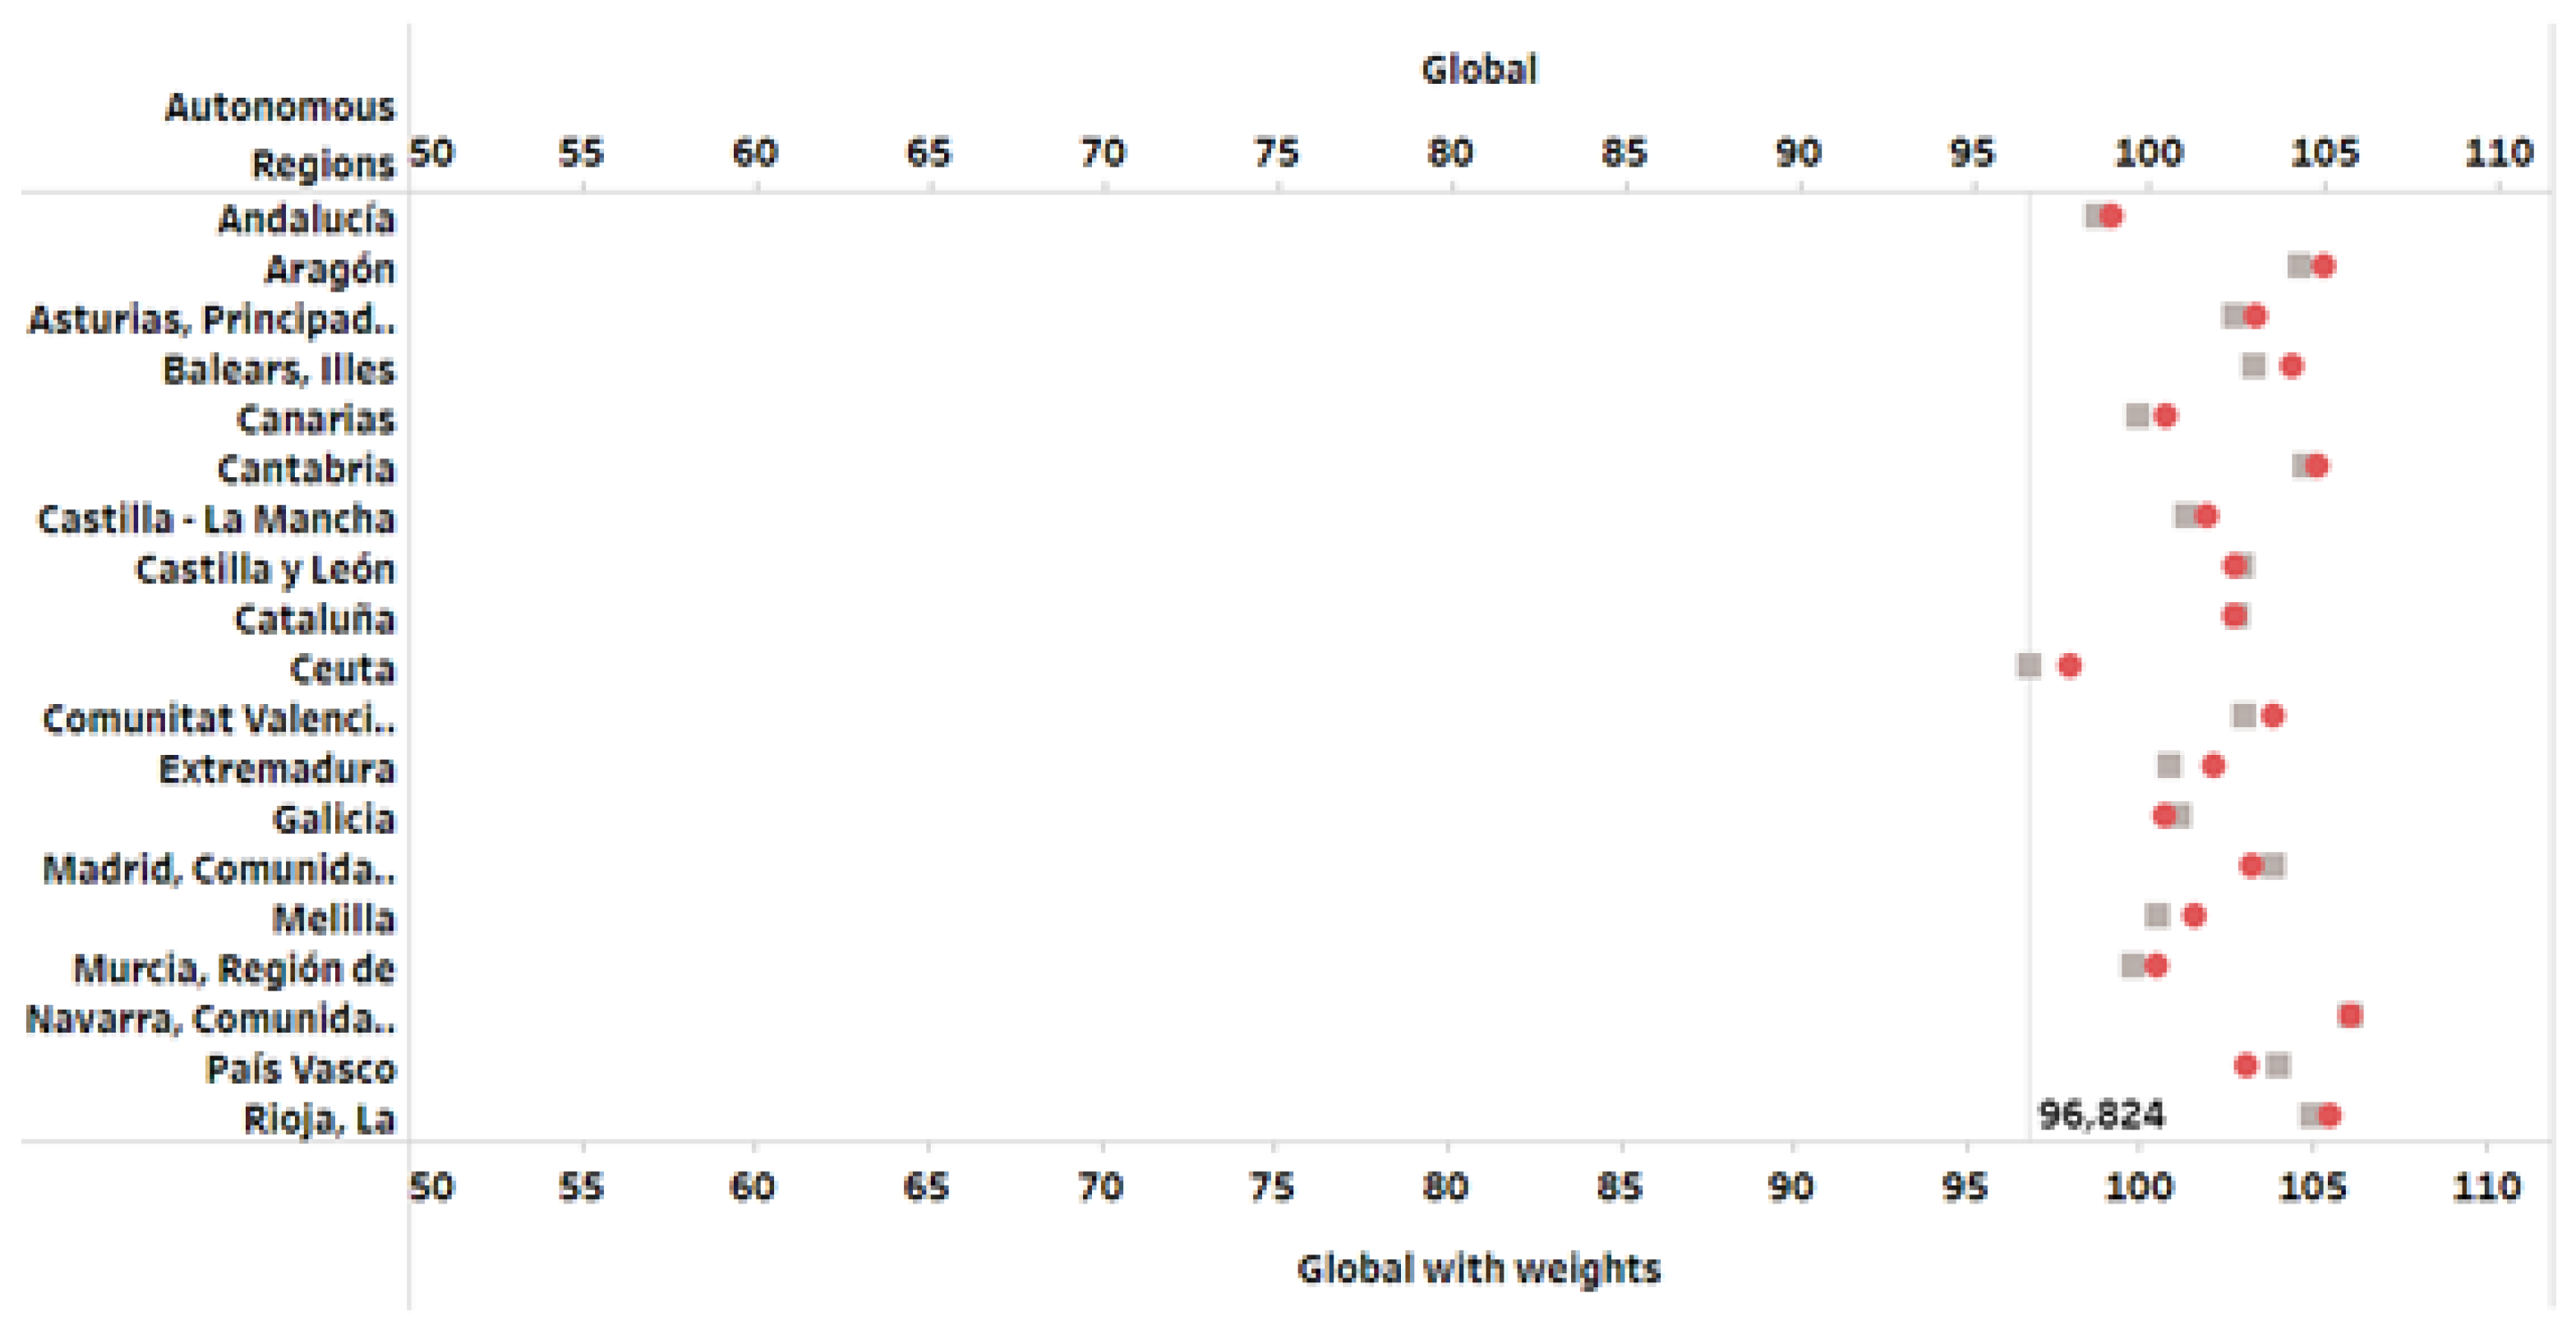
Table 13 displays the data used to create
Figure 8.
Figure 8 shows the ranking generated by the INE including the
Table 13 weights. It is a self-elaborated image created by authors using INE data and Tableau Public software. The grey dots represent the overall ranking with weights and the red dots represent the values of the corresponding Autonomous Regions with all weights of the 9 dimensions equal to 1. The axes represent the quantitative values of the weighted average of the 9 dimensions (global with weights) and the unweighted average (global).
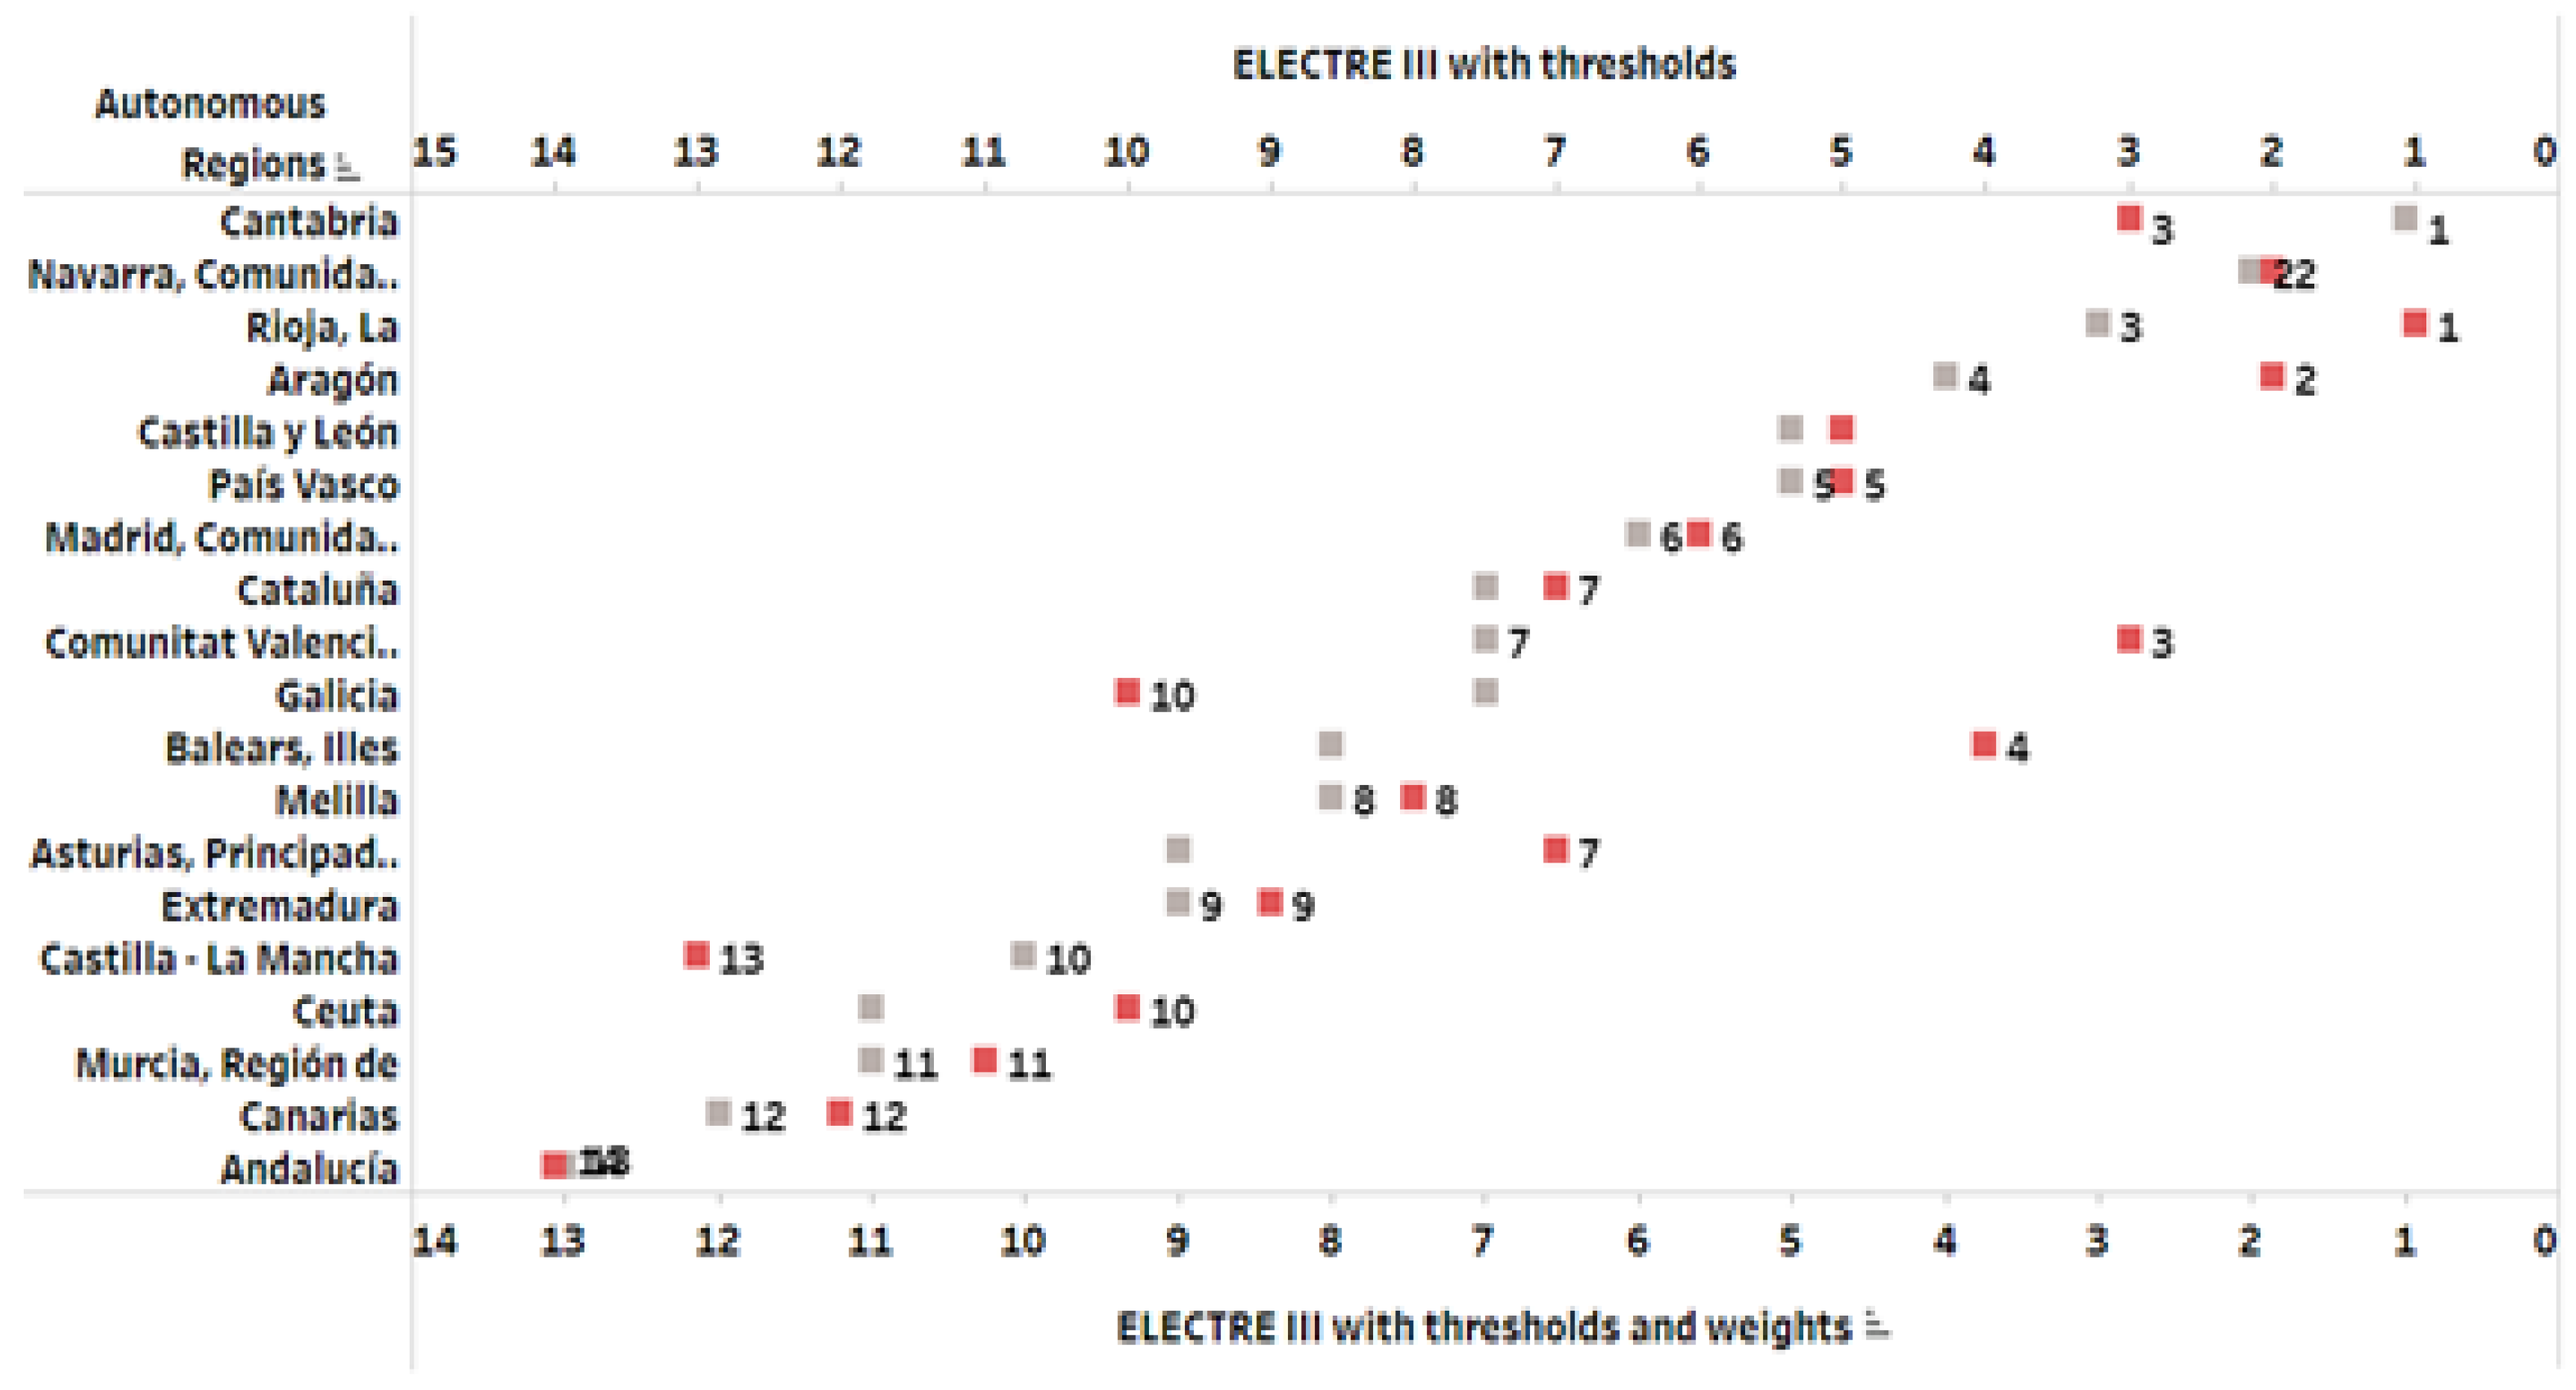
Table 14 displays the data used to create
Figure 9.
Figure 9 shows our ranking generated by ELECTRE III two-stage approach with thresholds on the indicators of the dimensions and with and without the different weights on the dimensions. For the bars interpretation of the image, it must first be noted that ELECTRE III only gives the ranking, so the first position (the best position) is the ranking number 1. Secondly, we observe that while in the solution without weights there were 14 positions in the ranking, when weights are introduced, they are reduced to 13. This is evidently due to the ties. The grey dots represent the ranking with weights and the red dots represent the ranking with all weights of the 9 dimensions equal to 1. This figure is also a self-elaborated image created by authors using INE data and Tableau Public software.
In this final comparison, it is interesting to see, in the two graphs above, separately the variation in the index calculated by INE with and without weights on the one hand, and on the other hand, the variation in the ranking calculated by authors with ELECTRE III two-stage with thresholds with and without weights. The idea is to show the variations produced by the introduction of weights in each of the calculation methods. For this reason, the INE comparative graph has also been presented with the quantitative values of the index while, obviously, in the case of ELECTRE, the comparison between the ranking positions obtained with and without weights is shown.
5. Conclusions
The multivariate quality of life index developed by INE is based on a two-stage aggregation. First of a set of indicators to create 9 dimensions, the quality of life dimensions, and then of the 9 dimensions into a single index. In the first phase of the aggregation, the one that generates the 9 dimensions, a non-compensatory type of aggregation (the AMPI method), is in our view judiciously used. However, for the aggregation of the 9 dimensions into a single indicator, a simple arithmetic mean is used. It does not seem very logical that, if non-compensation between indicators was used in the first phase, it is now necessary to compensate in the second phase.
What we propose is to create an index in which the principle of non compensation is maintained in both phases. To this end, we propose two alternatives:
To use the AMPI method in the first phase and ELECTRE III in the second phase to create a ranking that allows us to compare the established subgroups (in our case the Autonomous Regions). This is the Basic ELECTRE methodology.
To use ELECTRE III to aggregate indicators in the first phase and again ELECTRE III to aggregate the 9 dimensions resulting from the first phase to create a final index in the form of a ranking. We have named Full ELECTRE to this methodology in the case of no thresholds have been introduced in the first phase. And we have named Full Fuzzy ELECTRE to the methodology when thresholds have been introduced.
To sum up, the main advantage of our Improved Multidimensional Quality of Life Index (IMQLI), is based on the benefits of using the ELECTRE III over AMPI, as ELECTRE III allows modelling user (decision-maker) to introduce preferences, indifference and veto thresholds. Consequently, this refines the comparison between alternatives (Autonomous Regions), and the final ranking also allows for equivalence classes of Autonomous Regions and even incomparability between 2 or more of them.
The index generated by the INE is a quantitative index, each Autonomous Region is assigned a score. The ranking generated by ELECTRE III is an ordering of the Autonomous Regions from the best to the least good where ties and incomparability are allowed. It could be argued that assigning a score is more accurate than assigning a rank. But, in our opinion, and since the ultimate purpose of the index is the comparison between Autonomous Regions (or sub-populations in general), a ranking actually provides the necessary information.
The reason why our approach is more accurate than the one used by the INE is that our approach uses “non-compensatory” aggregation methods in both phases (both in the aggregation of indicators and in the aggregation of dimensions). The INE method uses a non-compensatory method for aggregating indicators, but a “compensatory” one (the arithmetic mean) for aggregating dimensions. Although it cannot be said that there is a “perfect” type of aggregation, we believe that it is much better to use a multi-criteria approach that captures the complexity of the phenomenon under study and that does not allow for trade-offs between different criteria (allowing e.g., poor “Material living conditions” outcomes to be compensated by good “Leisure and social relations” outcomes). With our approach it cannot happen that a bad value in one dimension cannot be compensated by a good value in another.
In the construction of the INE index, the question of the weightings of the 9 dimensions remains to be addressed. The INE proposes that the user/decider enters his/her subjective weights. We have approached the problem in the same way by introducing the same weights in the average used by INE and in ELECTRE III of the second stage aggregation. As we have seen, the solutions vary greatly depending on whether weights are introduced or not.
In relation to future lines of research, we believe that the question of weights needs to be addressed in more depth. Above all, there is a fundamental question: should the weights be derived from information provided by experts? We believe that yes, experts should be consulted, and a consensus method should be sought for assigning weights to the 9 dimensions. And furthermore, should the original indicators also be weighted (remember that they all had a weight equal to 1)? Although, as mentioned in the INE document itself, the weighting must be “subjective”, a method must be proposed that can incorporate as closely as possible the importance that the user attaches to each dimension. It should be borne in mind here that the user is not always able to assign a numerical value that faithfully represents the relative importance of the dimensions.
The question of how to weight the nine dimensions, as well as whether the initial indicators should also be weighted, is of course a problem that remains to be solved. A large part of the problem lies in whether such weights should be consensual or whether complete subjectivity should be allowed.
These questions will be lines of future research by the authors to propose a robust method for constructing multidimensional quality of life indices.


