Dynamic Correlation between the Chinese and the US Financial Markets: From Global Financial Crisis to COVID-19 Pandemic
Abstract
1. Introduction
2. Literature Review
2.1. The US Stock Market and Other Financial Markets
2.2. The US Dollar and Other Financial Assets
2.3. The Chinese Stock Market and Other Financial Markets
3. Methodology
- is the vector of past observations of the return;
- is the vector of conditional returns;
- is the vector of residual (assumed to be independent and identically distributed);
- is the information set of the previous issue;
- is a conditional covariance matrix;
- is a symmetric dynamic correlations matrix;
- is the four index’s diagonal matrix of conditional standard deviations and each calculated by by which we can estimate the univariate process of each index.
4. Data
5. Empirical Results
5.1. The Information Criteria Values for the Models
5.2. The Interpretation of the Estimated Results
5.3. General Correlations between China’s and the US Financial Markets
5.4. The Correlation Analysis of the Two Financial Markets
5.4.1. Analysis of Events before Financial Crisis
5.4.2. Analysis of Events after Financial Crisis
6. Conclusions and Discussion
6.1. Conclusions
6.2. Discussion
Author Contributions
Funding
Institutional Review Board Statement
Informed Consent Statement
Data Availability Statement
Acknowledgments
Conflicts of Interest
References
- Valls, N.; Chuliá, H. Volatility Transmission and Correlation Analysis between the USA and Asia: The Impact of the Global Financial Crisis. Glob. Econ. Rev. Perspect. East Asian Econ. Ind. 2012, 41, 111–129. [Google Scholar] [CrossRef]
- World Bank Group. World Development Report 2022; World Bank Publications: Herndon, VA, USA, 2022. [Google Scholar]
- Maghyereh, A.I.; Awartani, B.; Hilu, K.A. Dynamic transmissions between the U.S. and equity markets in the MENA countries: New evidence from pre- and post-global financial crisis. Q. Rev. Econ. Financ. 2015, 56, 123–138. [Google Scholar] [CrossRef]
- Tian, G.G.; Ma, S. The relationship between stock returns and the foreign exchange rate: The ARDL approach. J. Asia Pac. Econ. 2010, 15, 490–508. [Google Scholar] [CrossRef]
- Huynh, T.L.D.; Burggraf, T. If worst comes to worst: Co-movement of global stock markets in the US-China trade war. Econ. Bus. Lett. 2020, 9, 21–30. [Google Scholar] [CrossRef]
- Chen, Q.; Wang, D.; Pan, M. Multivariate Time-Varying G-H Copula GARCH Model and Its Application in the Financial Market Risk Measurement. Math. Probl. Eng. 2015, 2015. [Google Scholar] [CrossRef]
- Engle, R. Dynamic Conditional Correlation: A Simple Class of Multivariate Generalized Autoregressive Conditional Heteroskedasticity Models. J. Bus. Econ. Stat. 2002, 20, 339–350. [Google Scholar] [CrossRef]
- Cappiello, L.; Engle, R.F.; Sheppard, K. Asymmetric correlations in the dynamics of global equity and bond returns. J. Financ. Econom. 2006, 4, 537–572. [Google Scholar] [CrossRef]
- Fang, L.; Chen, B.; Yu, H.; Qian, Y. Identifying systemic important markets from a global perspective: Using the ADCC Δ CoVaR approach with skewed-t distribution. Financ. Res. Lett. 2018, 24, 137–144. [Google Scholar] [CrossRef]
- Pal, D.; Mitra, S.K. Hedging bitcoin with other financial assets. Financ. Res. Lett. 2019, 30, 30–36. [Google Scholar] [CrossRef]
- Hoque, M.E.; Soo-Wah, L.; Md Akther Uddin, M.A.; Rahman, A. International trade policy uncertainty spillover on stock market: Evidence from fragile five economies. J. Int. Trade Econ. Dev. 2022. [Google Scholar] [CrossRef]
- Pan, Q.; Mei, X.; Gao, T. Modeling dynamic conditional correlations with leverage effects and volatility spillover effects: Evidence from the Chinese and US stock markets affected by the recent trade friction. North Am. J. Econ. Financ. 2022, 59, 101591. [Google Scholar] [CrossRef]
- Zhang, B.; Li, X.M. Has there been any change in the comovement between the Chinese and US stock markets? Int. Rev. Econ. Financ. 2014, 29, 525–536. [Google Scholar] [CrossRef]
- Kocaarslan, B.; Sari, R.; Gormus, A.; Soytas, U. Dynamic Correlations between BRIC and U.S. Stock Markets: The Asymmetric Impact of Volatility Expectations in Oil, Gold and Financial Markets. J. Commod. Mark. 2017, 7, 41–56. [Google Scholar] [CrossRef]
- Yang, T.; Zhou, F.; Du, M.; Du, Q.; Zhou, S. Fluctuation in the Global Oil Market, Stock Market Volatility, and Economic Policy Uncertainty: A Study of the US and China. Q. Rev. Econ. Financ. 2021, in press. [CrossRef]
- Agmon, T. The Relations Among Equity Markets: A Study of Share Price Co-Movements in the United States, United Kingdom, Germany and Japan. J. Financ. 1972, 27, 839–855. [Google Scholar] [CrossRef]
- Becker, K.G.; Finnerty, J.E.; Friedman, J. Economic news and equity market linkages between the U.S. and U.K. J. Bank. Financ. 1995, 19, 1191–1210. [Google Scholar] [CrossRef]
- Cha, B.; Seeking, O. The relationship between developed equity markets and the Pacific-Basin’s emerging equity markets. Int. Rev. Econ. Financ. 2000, 9, 299–322. [Google Scholar] [CrossRef]
- Forbes, K.J.; Rigobon, R. No Contagion, Only Interdependence: Measuring Stock Market Comovements. J. Financ. 2002, 57, 2223–2261. [Google Scholar] [CrossRef]
- Lahrech, A.; Sylwester, K.U.S. and Latin American stock market linkages. J. Int. Money Financ. 2011, 30, 1341–1357. [Google Scholar] [CrossRef]
- Sakurai, Y.; Kurosaki, T. How has the relationship between oil and the US stock market changed after the COVID-19 crisis? Financ. Res. Lett. 2020, 37, 101773. [Google Scholar] [CrossRef]
- Chin, C.-C.; Paphakin, W. The daily relationship between U.S. asset prices and stock prices of American countries. N. Am. J. Econ. Financ. 2021, 57, 101399. [Google Scholar] [CrossRef]
- Li, X.-L.; Chang, T.; Miller, S.M.; Balcilar, M.; Gupta, R. The co-movement and causality between the U.S. housing and stock markets in the time and frequency domains. Int. Rev. Econ. Financ. 2015, 38, 220–233. [Google Scholar] [CrossRef]
- Mighri, Z.; Ragoubi, H.; Sarwar, S.; Wang, Y. Quantile Granger causality between US stock market indices and precious metal prices. Resour. Policy 2022, 76, 102595. [Google Scholar] [CrossRef]
- Asgharian, H.; Hess, W.; Liu, L. A spatial analysis of International stock market linkages. J. Bank. Financ. 2013, 37, 4738–4754. [Google Scholar] [CrossRef]
- Bhuyan, R.; Robbani, M.G.; Talukdar, B.; Jain, A. Information transmission and dynamics of stock price movements: An empirical analysis of BRICS and US stock markets. Int. Rev. Econ. Financ. 2016, 46, 180–195. [Google Scholar] [CrossRef]
- Wang, Y.S.; Chueh, Y.L. Dynamic transmission effects between the interest rate, the US dollar, and gold and crude oil prices. Econ. Model. 2013, 30, 792–798. [Google Scholar] [CrossRef]
- Kumar, J.J.; Robiyanto, R. The Impact of Gold Price and Us Dollar Index: The Volatile Case of Shanghai Stock Exchange and Bombay Stock Exchange During the Crisis of COVID-19. J. Keuang. Dan Perbank. 2021, 25, 508–531. [Google Scholar] [CrossRef]
- Tran, O.; Nguyen, H. The interdependence of gold, US dollar and stock market in the context of COVID-19 pandemic: An insight into analysis in Asia and Europe. Cogent Econ. Financ. 2022, 10, 2127483. [Google Scholar] [CrossRef]
- Mo, B.; Nie, H.; Jiang, Y. Dynamic linkages among the gold market, US dollar and crude oil market. Phys. A Stat. Mech. Its Appl. 2018, 491, 984–994. [Google Scholar] [CrossRef]
- Mokni, K.; Ajmi, A.N. Cryptocurrencies vs. US dollar: Evidence from causality in quantiles analysis. Econ. Anal. Policy 2021, 69, 238–252. [Google Scholar] [CrossRef]
- Arfaoui, M.; Ben Rejeb, A. Oil, gold, US dollar and stock market interdependencies: A global analytical insight. Eur. J. Manag. Bus. Econ. 2017, 26, 278–293. [Google Scholar] [CrossRef]
- Wen, X.; Cheng, H. Which is the safe haven for emerging stock markets, gold or the US dollar? Emerg. Mark. Rev. 2018, 35, 69–90. [Google Scholar] [CrossRef]
- Su, E.-D.; Fen, Y.-G. The affect of the U.S. dollar index, U.S. stocks and the currency exchange on the Taiwan stock market during the financial tsunami. J. Stat. Manag. Syst. 2011, 14, 789–813. [Google Scholar] [CrossRef]
- Singh, N.P.; Sharma, S. Phase-wise analysis of dynamic relationship among gold, crude oil, US dollar and stock market. J. Adv. Manag. Res. 2018, 15, 480–499. [Google Scholar] [CrossRef]
- Cheema, M.A.; Faff, R.; Szulczyk, K.R. The 2008 global financial crisis and COVID-19 pandemic: How safe are the safe haven assets? Int. Rev. Financ. Anal. 2022, 83, 102316. [Google Scholar] [CrossRef]
- Wang, J.; Wang, X. COVID-19 and financial market efficiency: Evidence from an entropy-based analysis. Financ. Res. Lett. 2021, 42, 101888. [Google Scholar] [CrossRef]
- Liu, X.; Li, B. Safe-haven or speculation? Research on price and risk dynamics of Bitcoin. Appl. Econ. Lett. 2022, 1–7. [Google Scholar] [CrossRef]
- Ji, H.; Wang, H.; Xu, J.; Liseo, B. Dependence Structure between China’s Stock Market and Other Major Stock Markets before and after the 2008 Financial Crisis. Emerg. Mark. Financ. Trade 2019, 56, 2608–2624. [Google Scholar] [CrossRef]
- Cai, W.; Chen, J.; Hong, J.; Jiang, F. Forecasting Chinese Stock Market Volatility With Economic Variables. Emerg. Mark. Financ. Trade 2015, 53, 521–533. [Google Scholar] [CrossRef]
- Lu, X.; Ye, Z.; Lai, K.K.; Cui, H.; Lin, X. Time-Varying Causalities in Prices and Volatilities between the Cross-Listed Stocks in Chinese Mainland and Hong Kong Stock Markets. Mathematics 2022, 10, 571. [Google Scholar] [CrossRef]
- Liu, J.; Cheng, Y.; Li, X.; Sriboonchitta, S. The Role of Risk Forecast and Risk Tolerance in Portfolio Management: A Case Study of the Chinese Financial Sector. Axioms 2022, 11, 134. [Google Scholar] [CrossRef]
- Li, H. The impact of China’s stock market reforms on its international stock market linkages. Q. Rev. Econ. Financ. 2012, 52, 358–368. [Google Scholar] [CrossRef]
- Hsiao, F.; Hsiao, M.; Yamashitac, A. The impact of the US economy on the Asia-Pacific region: Does it matter? J. Asian Econ. 2003, 14, 219–241. [Google Scholar] [CrossRef]
- Wang, Y.; Di Iorio, A. Are the China-related stock markets segmented with both world and regional stock markets? J. Int. Financ. Mark. Inst. Money 2007, 17, 277–290. [Google Scholar] [CrossRef]
- Ye, G.L. The interactions between China and US stock markets: New perspectives. J. Int. Financ. Mark. Inst. Money 2014, 31, 331–342. [Google Scholar] [CrossRef]
- Martens, M.; Poon, S.-H. Returns synchronization and daily correlation dynamics between international stock markets. J. Bank. Financ. 2001, 25, 1805–1827. [Google Scholar] [CrossRef]
- Wang, Q.; Choi, S.M. Co-movement of the Chinese and U.S. aggregate stock returns. Appl. Econ. 2015, 47, 5337–5353. [Google Scholar] [CrossRef]
- Johansson, A. China’s financial market integration with the world. J. Chin. Econ. Bus. Stud. 2010, 8, 293–314. [Google Scholar] [CrossRef]
- Song, G.; Xia, Z.; Basheer, M.F.; Shah, S.M.A. Co-movement dynamics of US and Chinese stock market: Evidence from COVID-19 crisis. Econ. Res. Ekon. Istraživanja 2021, 2460–2476. [Google Scholar] [CrossRef]
- Ben Amar, A.; Hachicha, N.; Halouani, N. Is there a shift contagion among stock markets during the COVID-19 crisis? Further insights from TYDL causality test. Int. Rev. Appl. Econ. 2020, 35, 188–209. [Google Scholar] [CrossRef]
- Gao, X.; Ren, Y.; Umar, M. To what extent does COVID-19 drive stock market volatility? A comparison between the US and China. Econ. Res. -Ekon. Istraž. 2022, 35, 1686–1706. [Google Scholar] [CrossRef]
- Glosten, L.R.; Jagannathan, R.; Runkle, D.E. On the Relation between the Expected Value and the Volatility of the Nominal Excess Return on Stocks. J. Financ. 1993, 48, 1779–1801. [Google Scholar] [CrossRef]
- Chiang, T.C.; Jeon, B.N.; Li, H. Dynamic correlation analysis of financial contagion: Evidence from Asian markets. J. Int. Money Financ. 2007, 26, 1206–1228. [Google Scholar] [CrossRef]
- Cho, J.H.; Parhizgari, A.M. East Asian Financial Contagion under DCC-Garch. Int. J. Bank. Financ. 2009, 6, 17–30. [Google Scholar] [CrossRef]
- Hou, Y.; Li, S. Volatility behaviour of stock index futures in China: A bivariate GARCH approach. Stud. Econ. Financ. 2015, 32, 128–154. [Google Scholar] [CrossRef]
- Sheppard, K.K.; Engle, R.F.; Cappiello, L. Asymmetric Dynamics in the Correlations of Global Equity and Bond Returns. J. Financ. Econom. 2006, 4, 537–572. [Google Scholar] [CrossRef]
- S&P Global (n.d.). About the Stock Market Component. Available online: https://www.spglobal.com/ratings/en/ (accessed on 25 April 2022).
- Gao, F.; Song, F.; Wang, J. Rational or irrational expectations? Evidence from China’s stock market. J. Risk Financ. 2008, 9, 432–448. [Google Scholar] [CrossRef]
- Liu, L. Impact of the Global Financial Crisis on China: Empirical Evidence and Policy Implications. China World Econ. 2009, 17, 1–23. [Google Scholar] [CrossRef]
- Liang, Y. China and the Global Financial Crisis: Assessing the Impacts and Policy Responses. China World Econ. 2010, 18, 56–72. [Google Scholar] [CrossRef]
- Troster, V.; Penalva, J.; Taamouti, A.; Wied, D. Cointegration, information transmission, and the lead-lag effect between industry portfolios and the stock market. J. Forecast. 2021, 40, 1291–1309. [Google Scholar] [CrossRef]
- Cao, G. Time-Varying Effects of Changes in the Interest Rate and the RMB Exchange Rate on the Stock Market of China: Evidence from the Long-Memory TVP-VAR Model. Emerg. Mark. Financ. Trade 2012, 48 (Suppl. S2), 230–248. [Google Scholar] [CrossRef]
- Zhang, Z.; Ma, C.; Hu, H.; Li, H. Will infectious disease outbreaks cause a decline in investment of real sector firms? Evidence form 2003 SARS outbreak in China. Appl. Econ. 2021, 53, 6820–6838. [Google Scholar] [CrossRef]
- Peng, Z.; Tang, Q.; Wang, K. Adjustment of the Stamp Duty on Stock Transactions and Its Effect on the Chinese Stock Market. Emerg. Mark. Financ. Trade 2014, 50, 183–196. [Google Scholar] [CrossRef]
- Zhang, Y. China, Japan and the US Stock Markets and the Global Financial Crisis. Asia-Pac. Financ. Mark. 2018, 25, 23–45. [Google Scholar] [CrossRef]
- Koss, R.; Shi, X. Stabilizing China’s Housing Market; International Monetary Fund: Washington, DA, USA, 2018. [Google Scholar]
- National Bureau of Statistics (n.d.). Available online: https://data.stats.gov.cn/easyquery.htm?cn=A01 (accessed on 28 May 2022).
- Saijai, W.; Yamaka, W.; Maneejuk, P. Measuring Dependence in China-United States Trade War: A Dynamic Copula Approach for BRICV and US Stock Markets. In Data Science for Financial Econometrics; Springer International Publishing: Cham, Switzerland, 2020; pp. 583–595. [Google Scholar] [CrossRef]
- Keynes, J.M. The General Theory of Employment, Interest and Money; Macmillan & Co.: London, UK, 1936. [Google Scholar]
- Fang, Y.; Liu, L.; Liu, J. A dynamic double asymmetric copula generalized autoregressive conditional heteroskedasticity model: Application to China’s and US stock market. J. Appl. Stat. 2014, 42, 327–346. [Google Scholar] [CrossRef]
- Liu, J.; Wang, M.; Sriboonchitta, S. Examining the Interdependence between the Exchange Rates of China and ASEAN Countries: A Canonical Vine Copula Approach. Sustainability 2019, 11, 5487. [Google Scholar] [CrossRef]
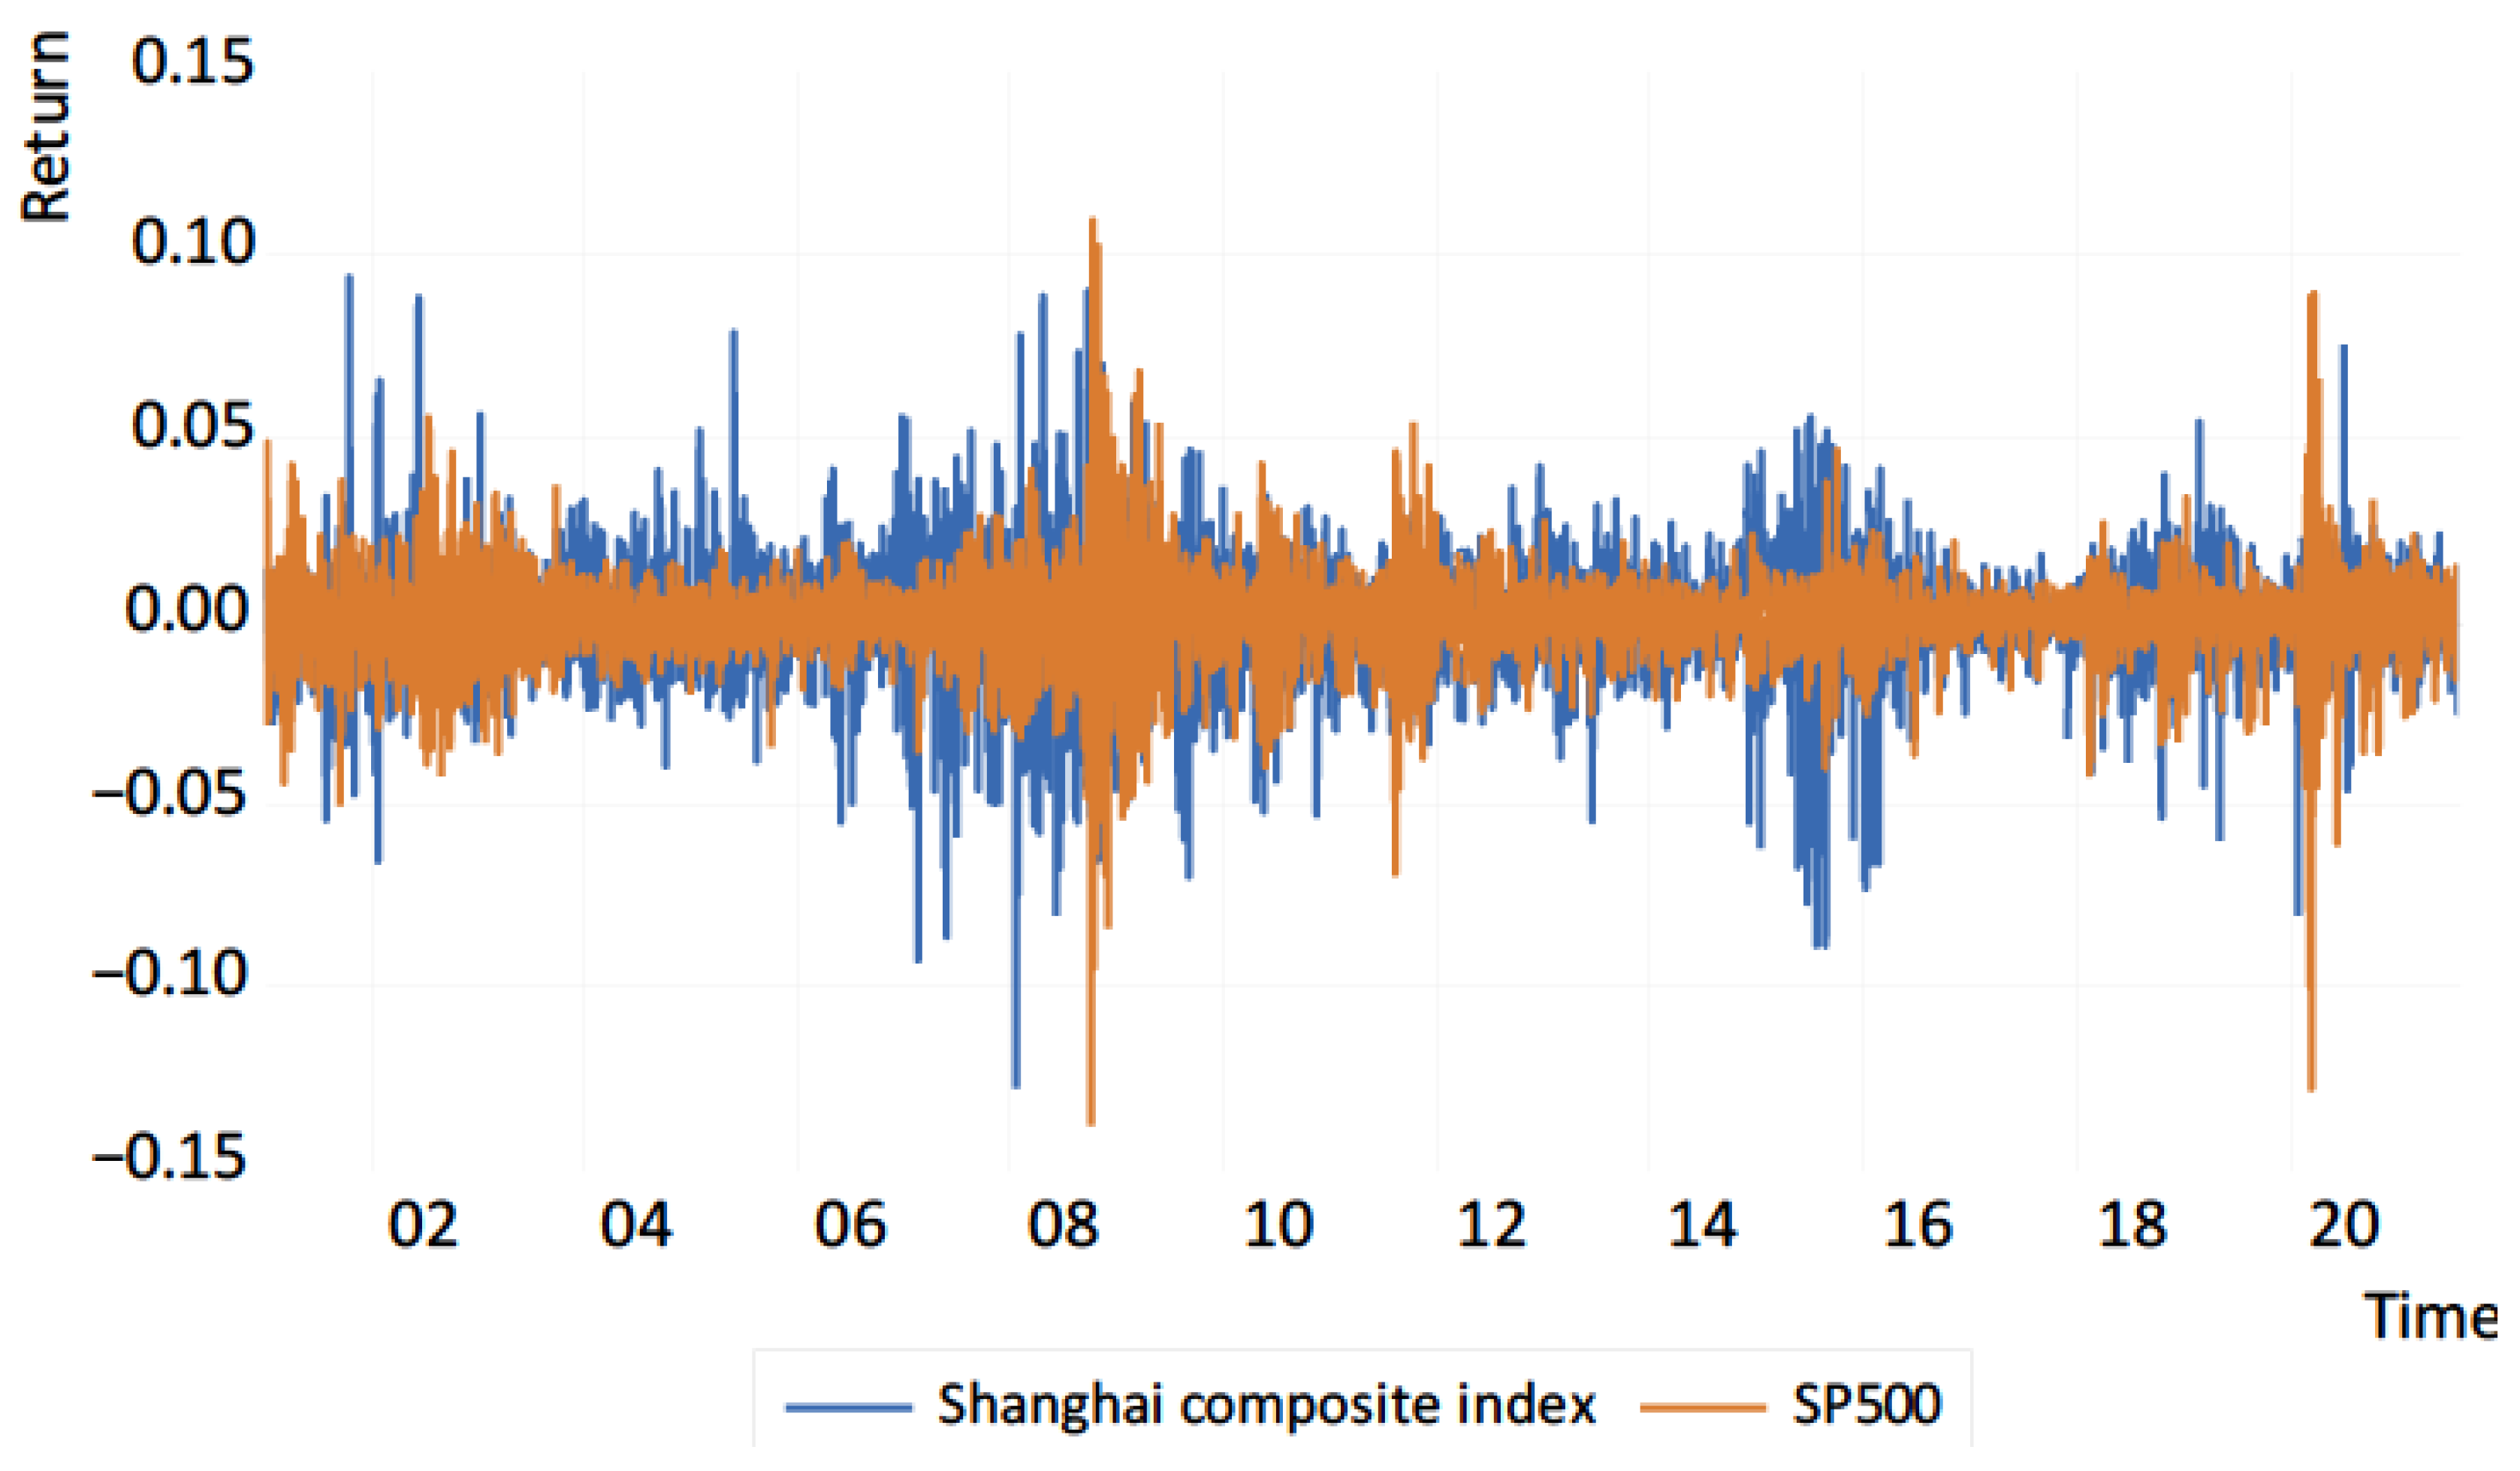
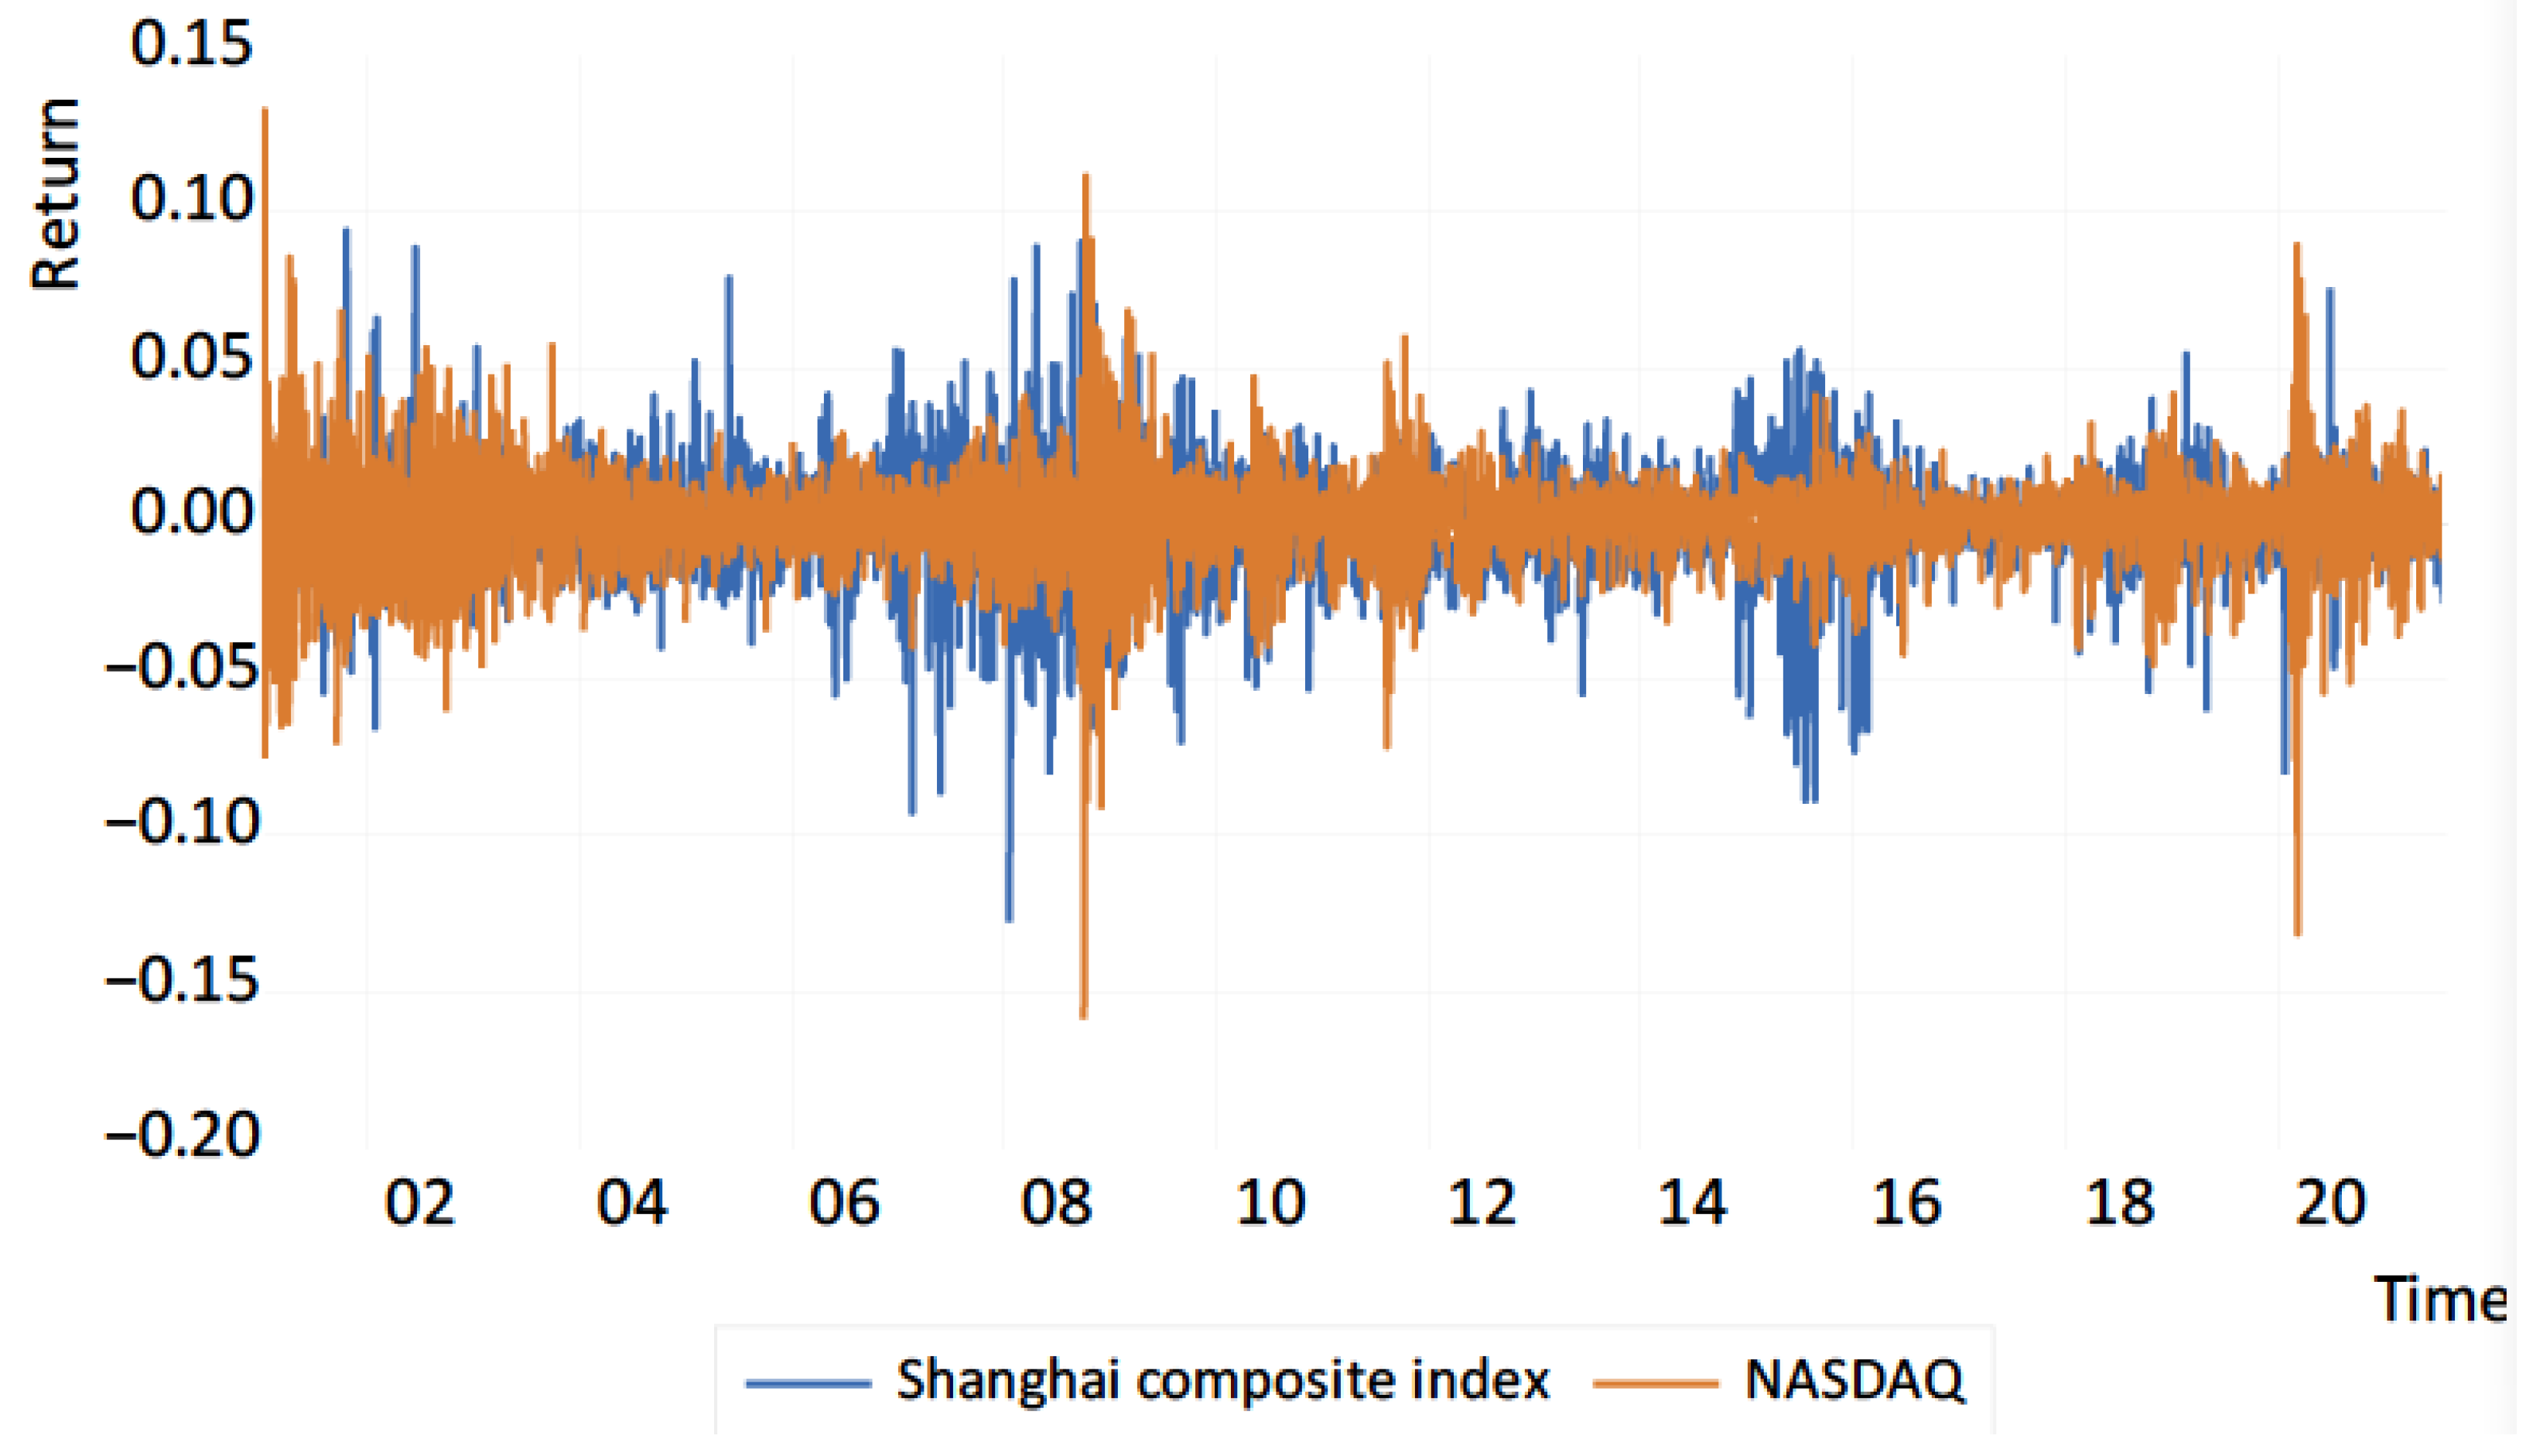
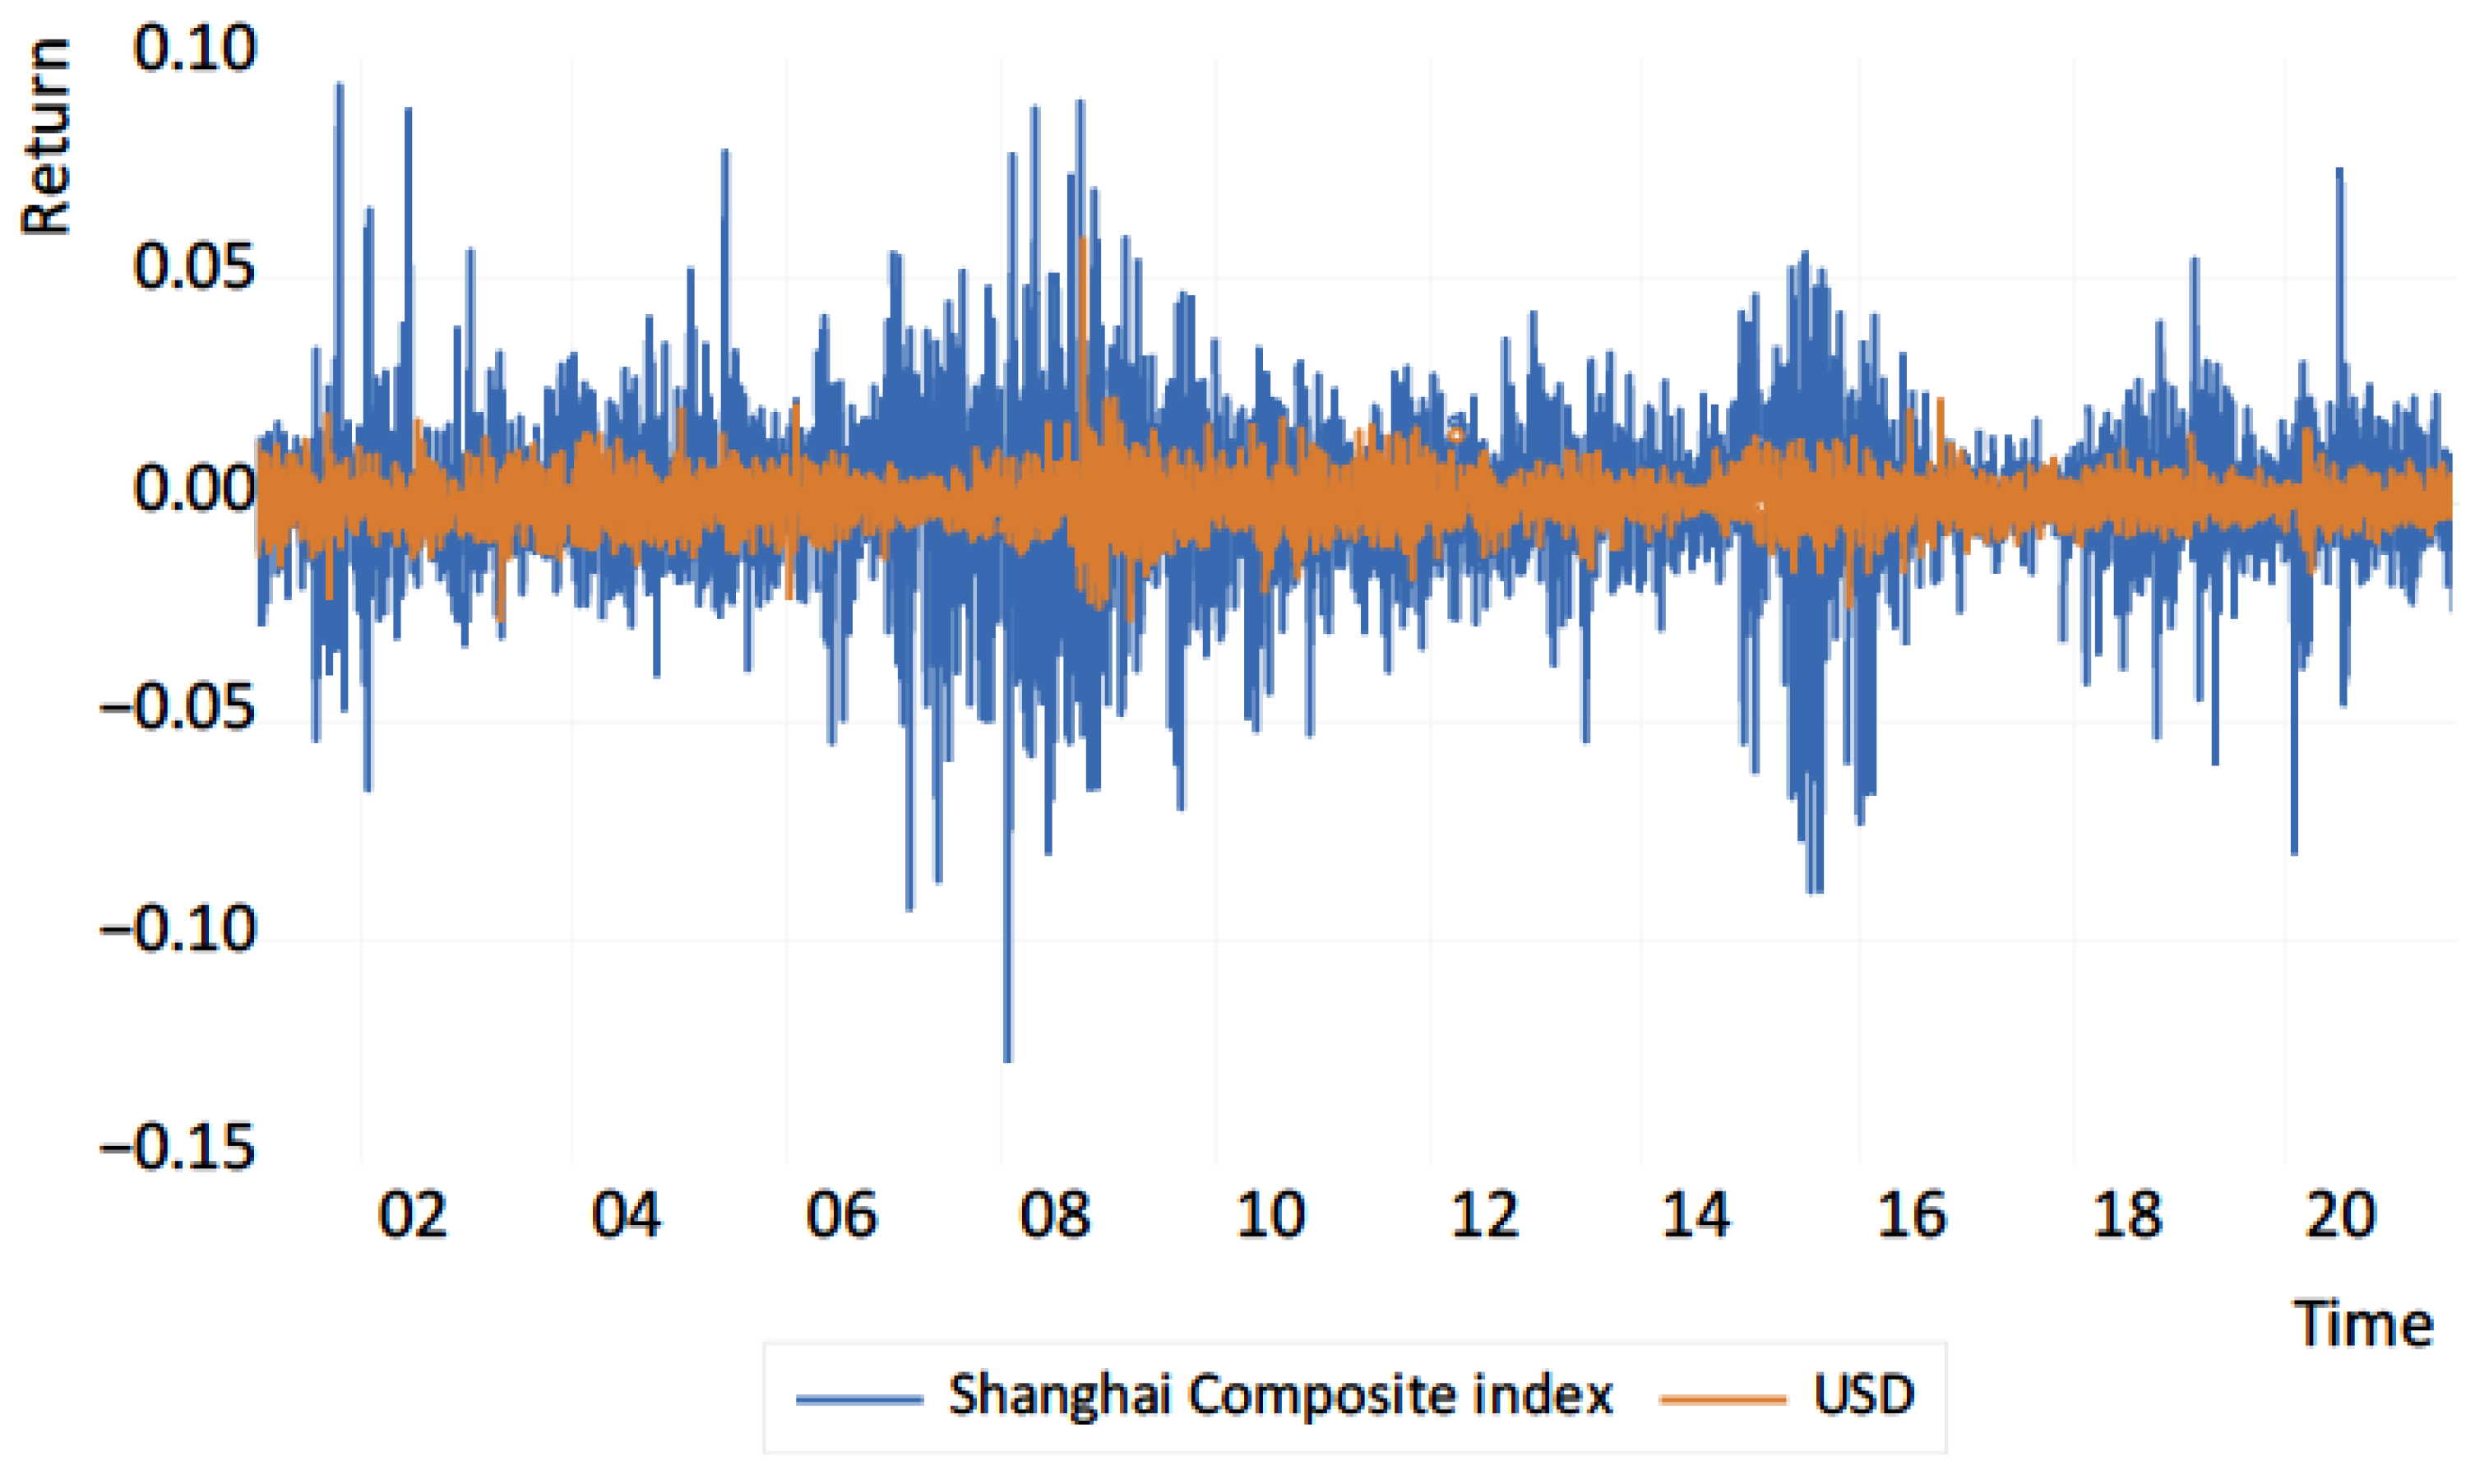

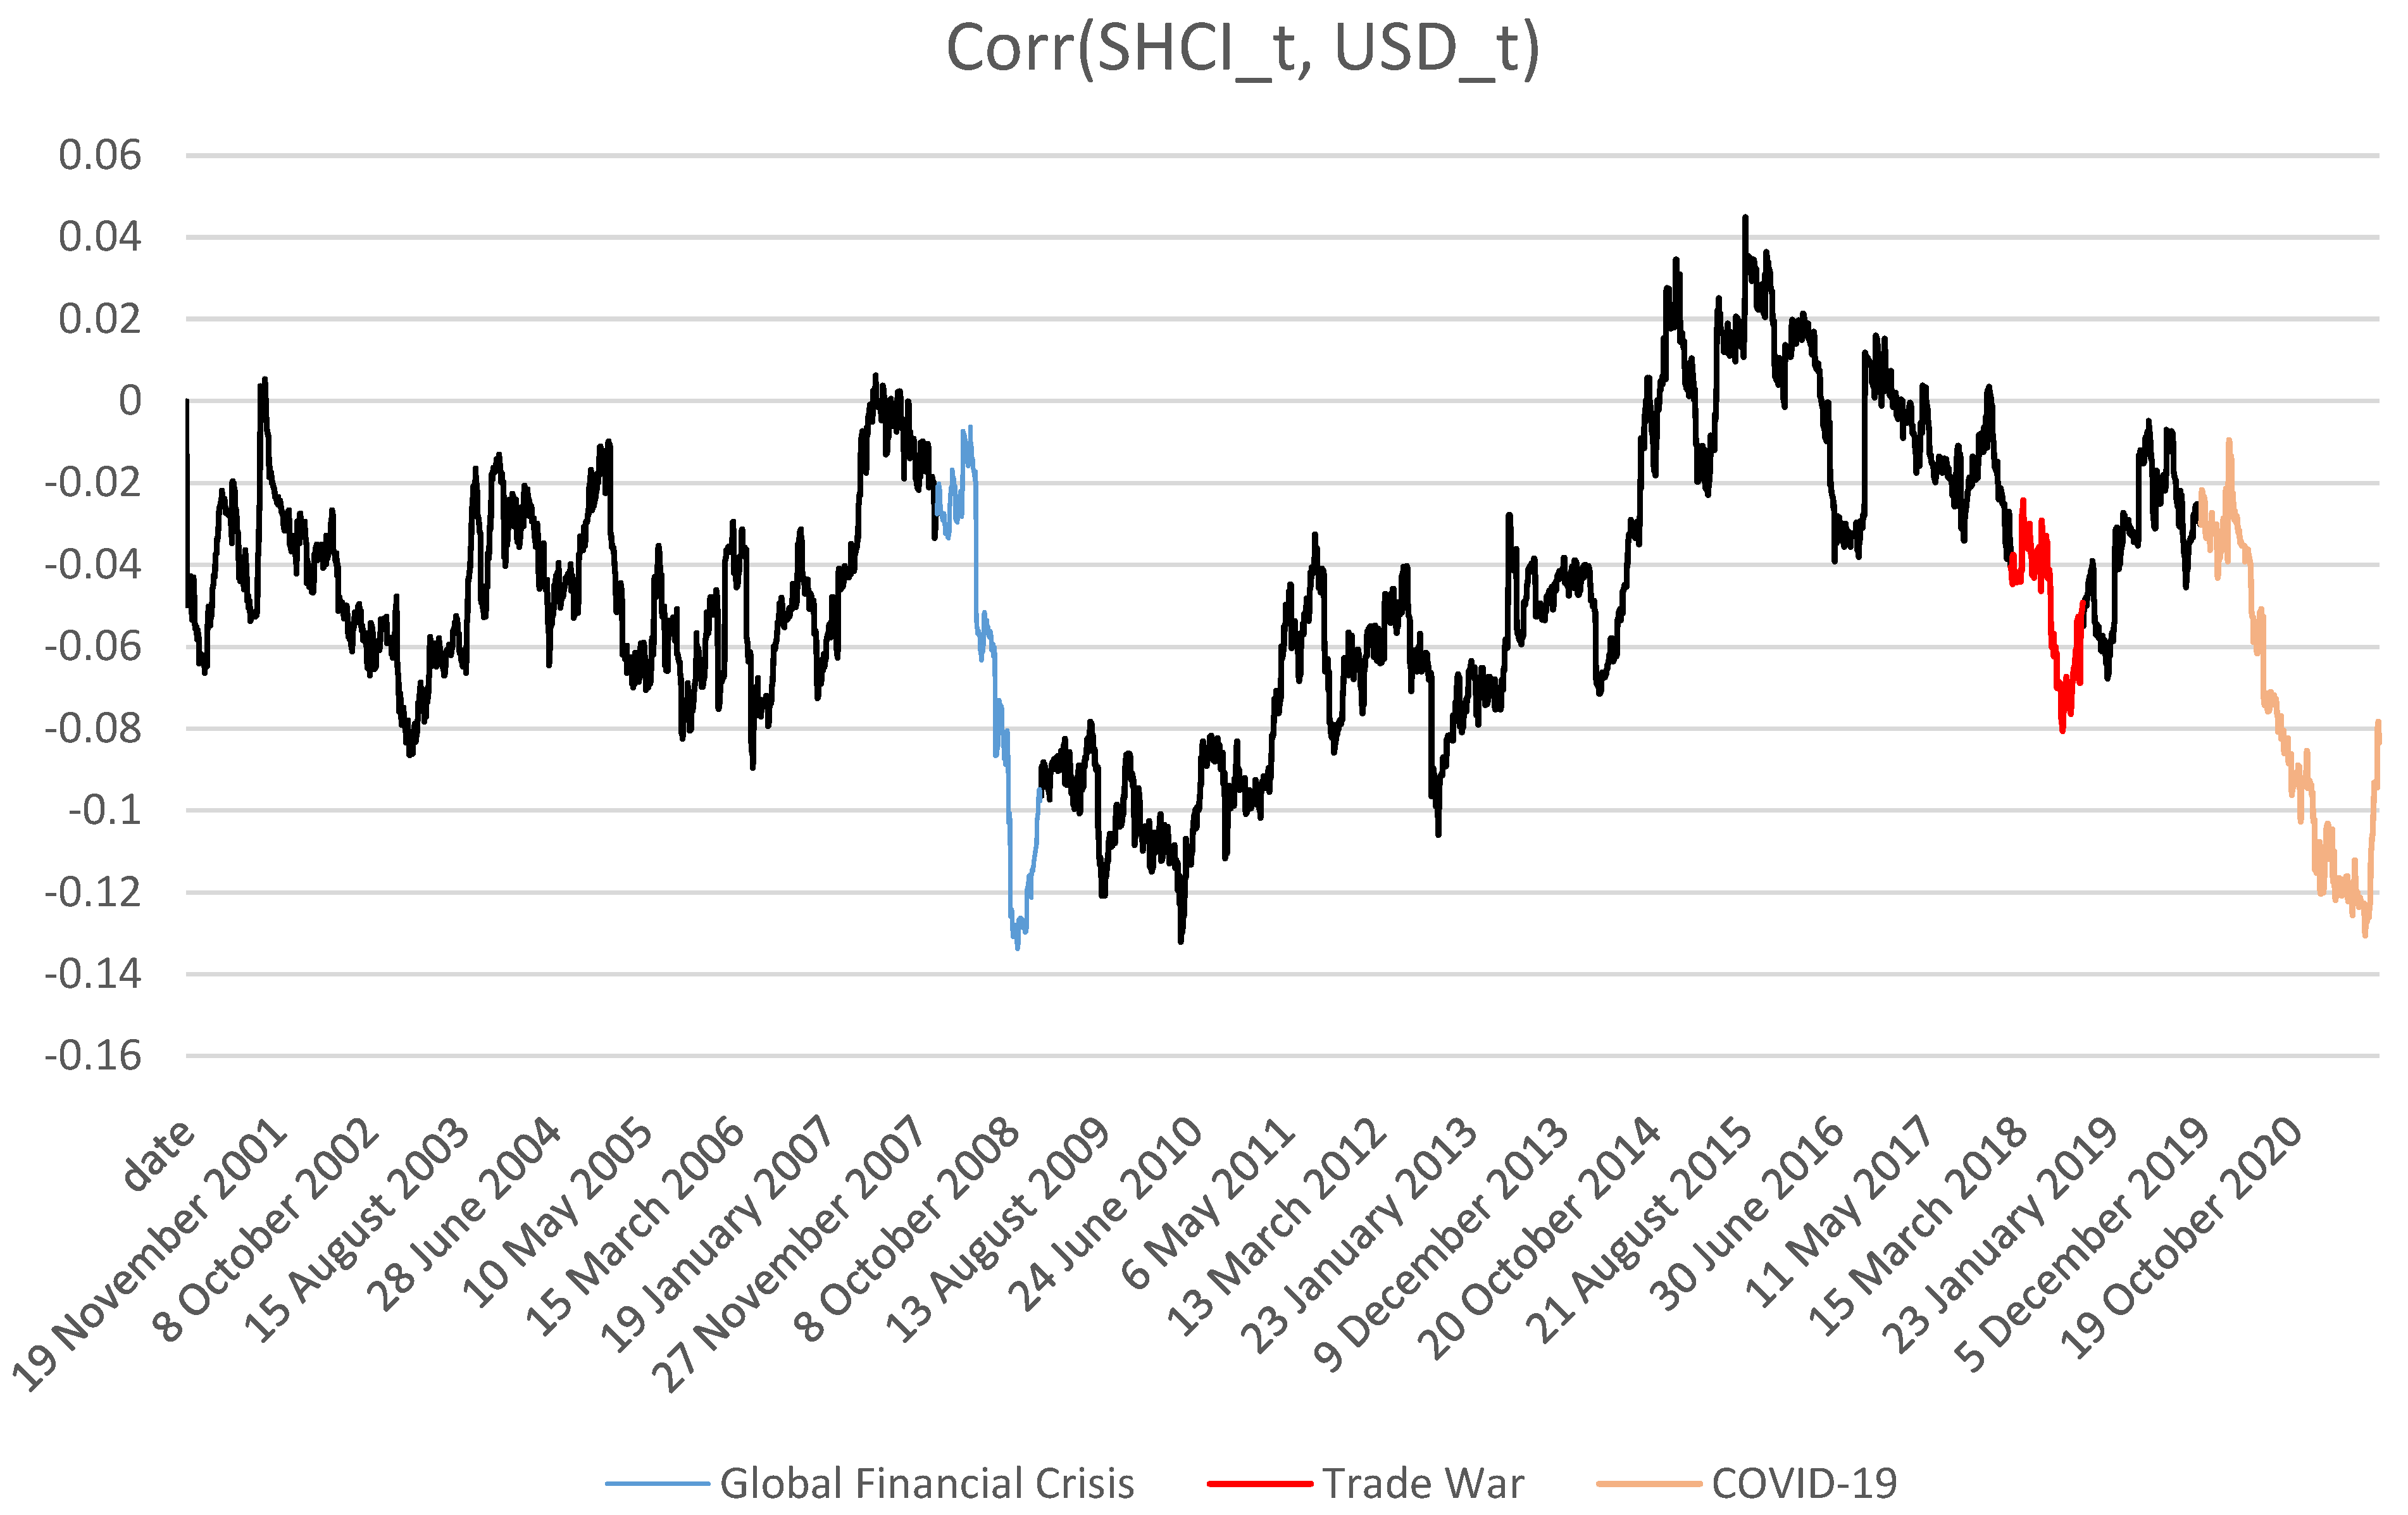
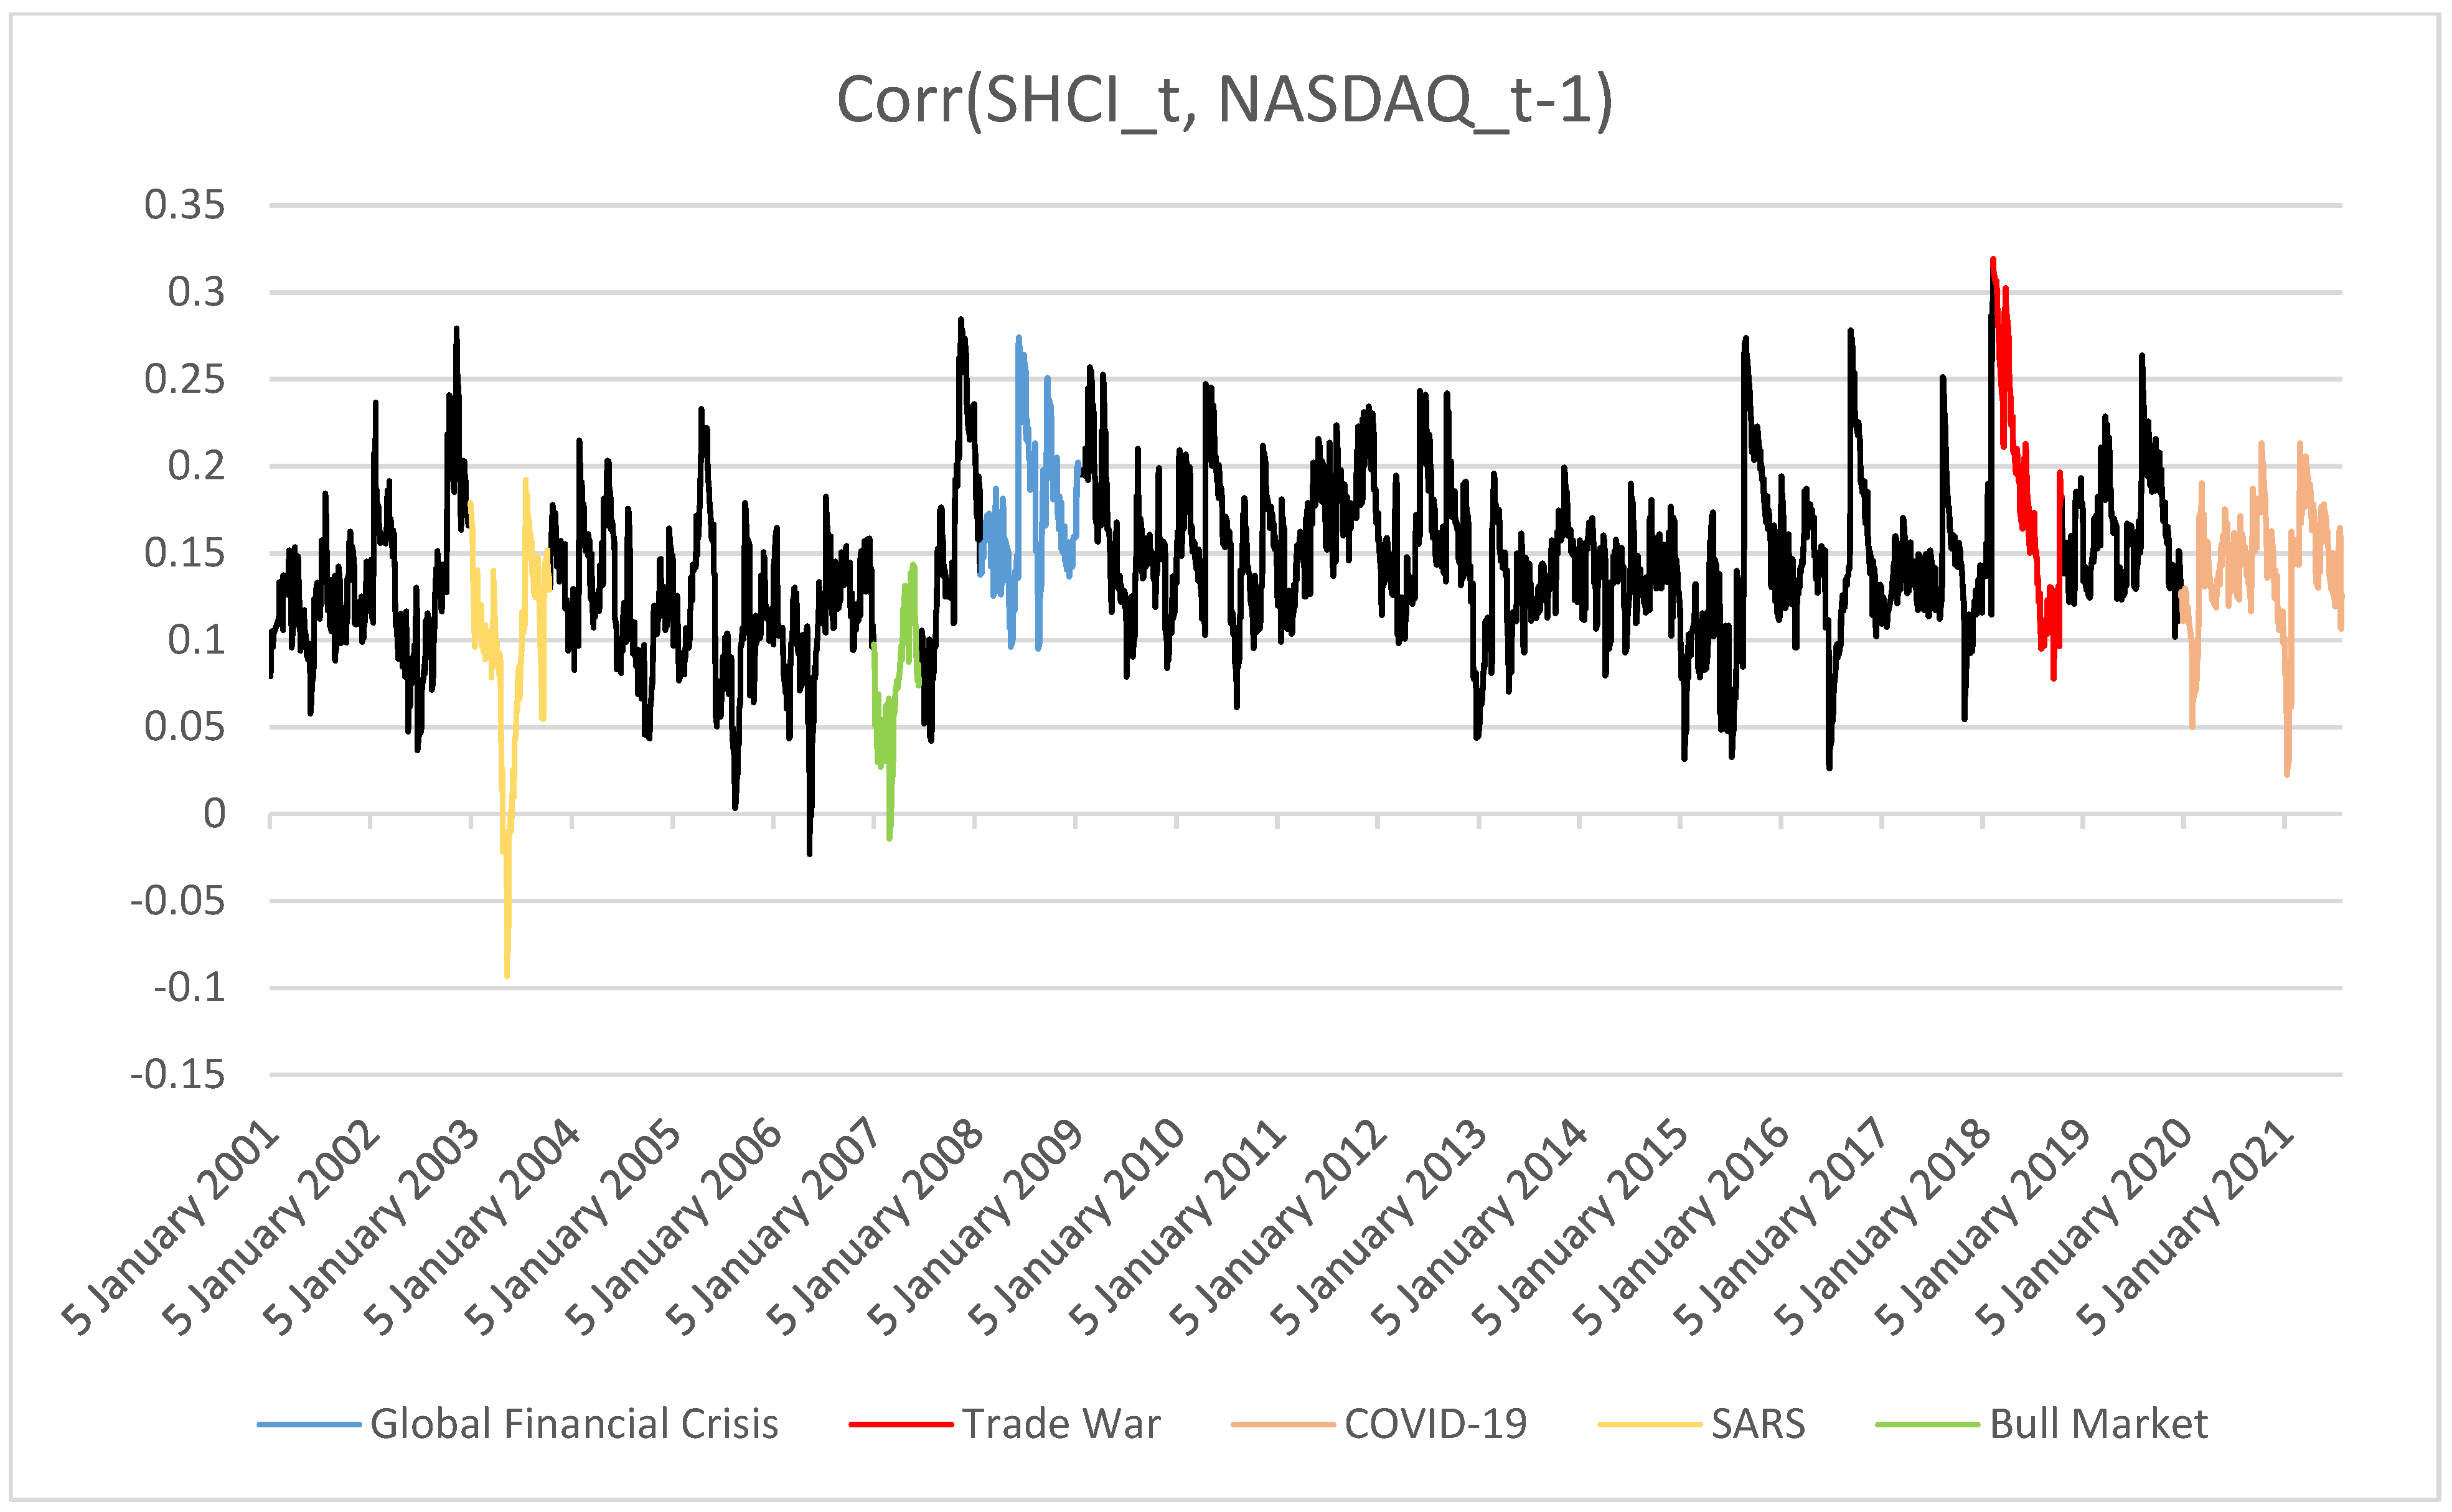
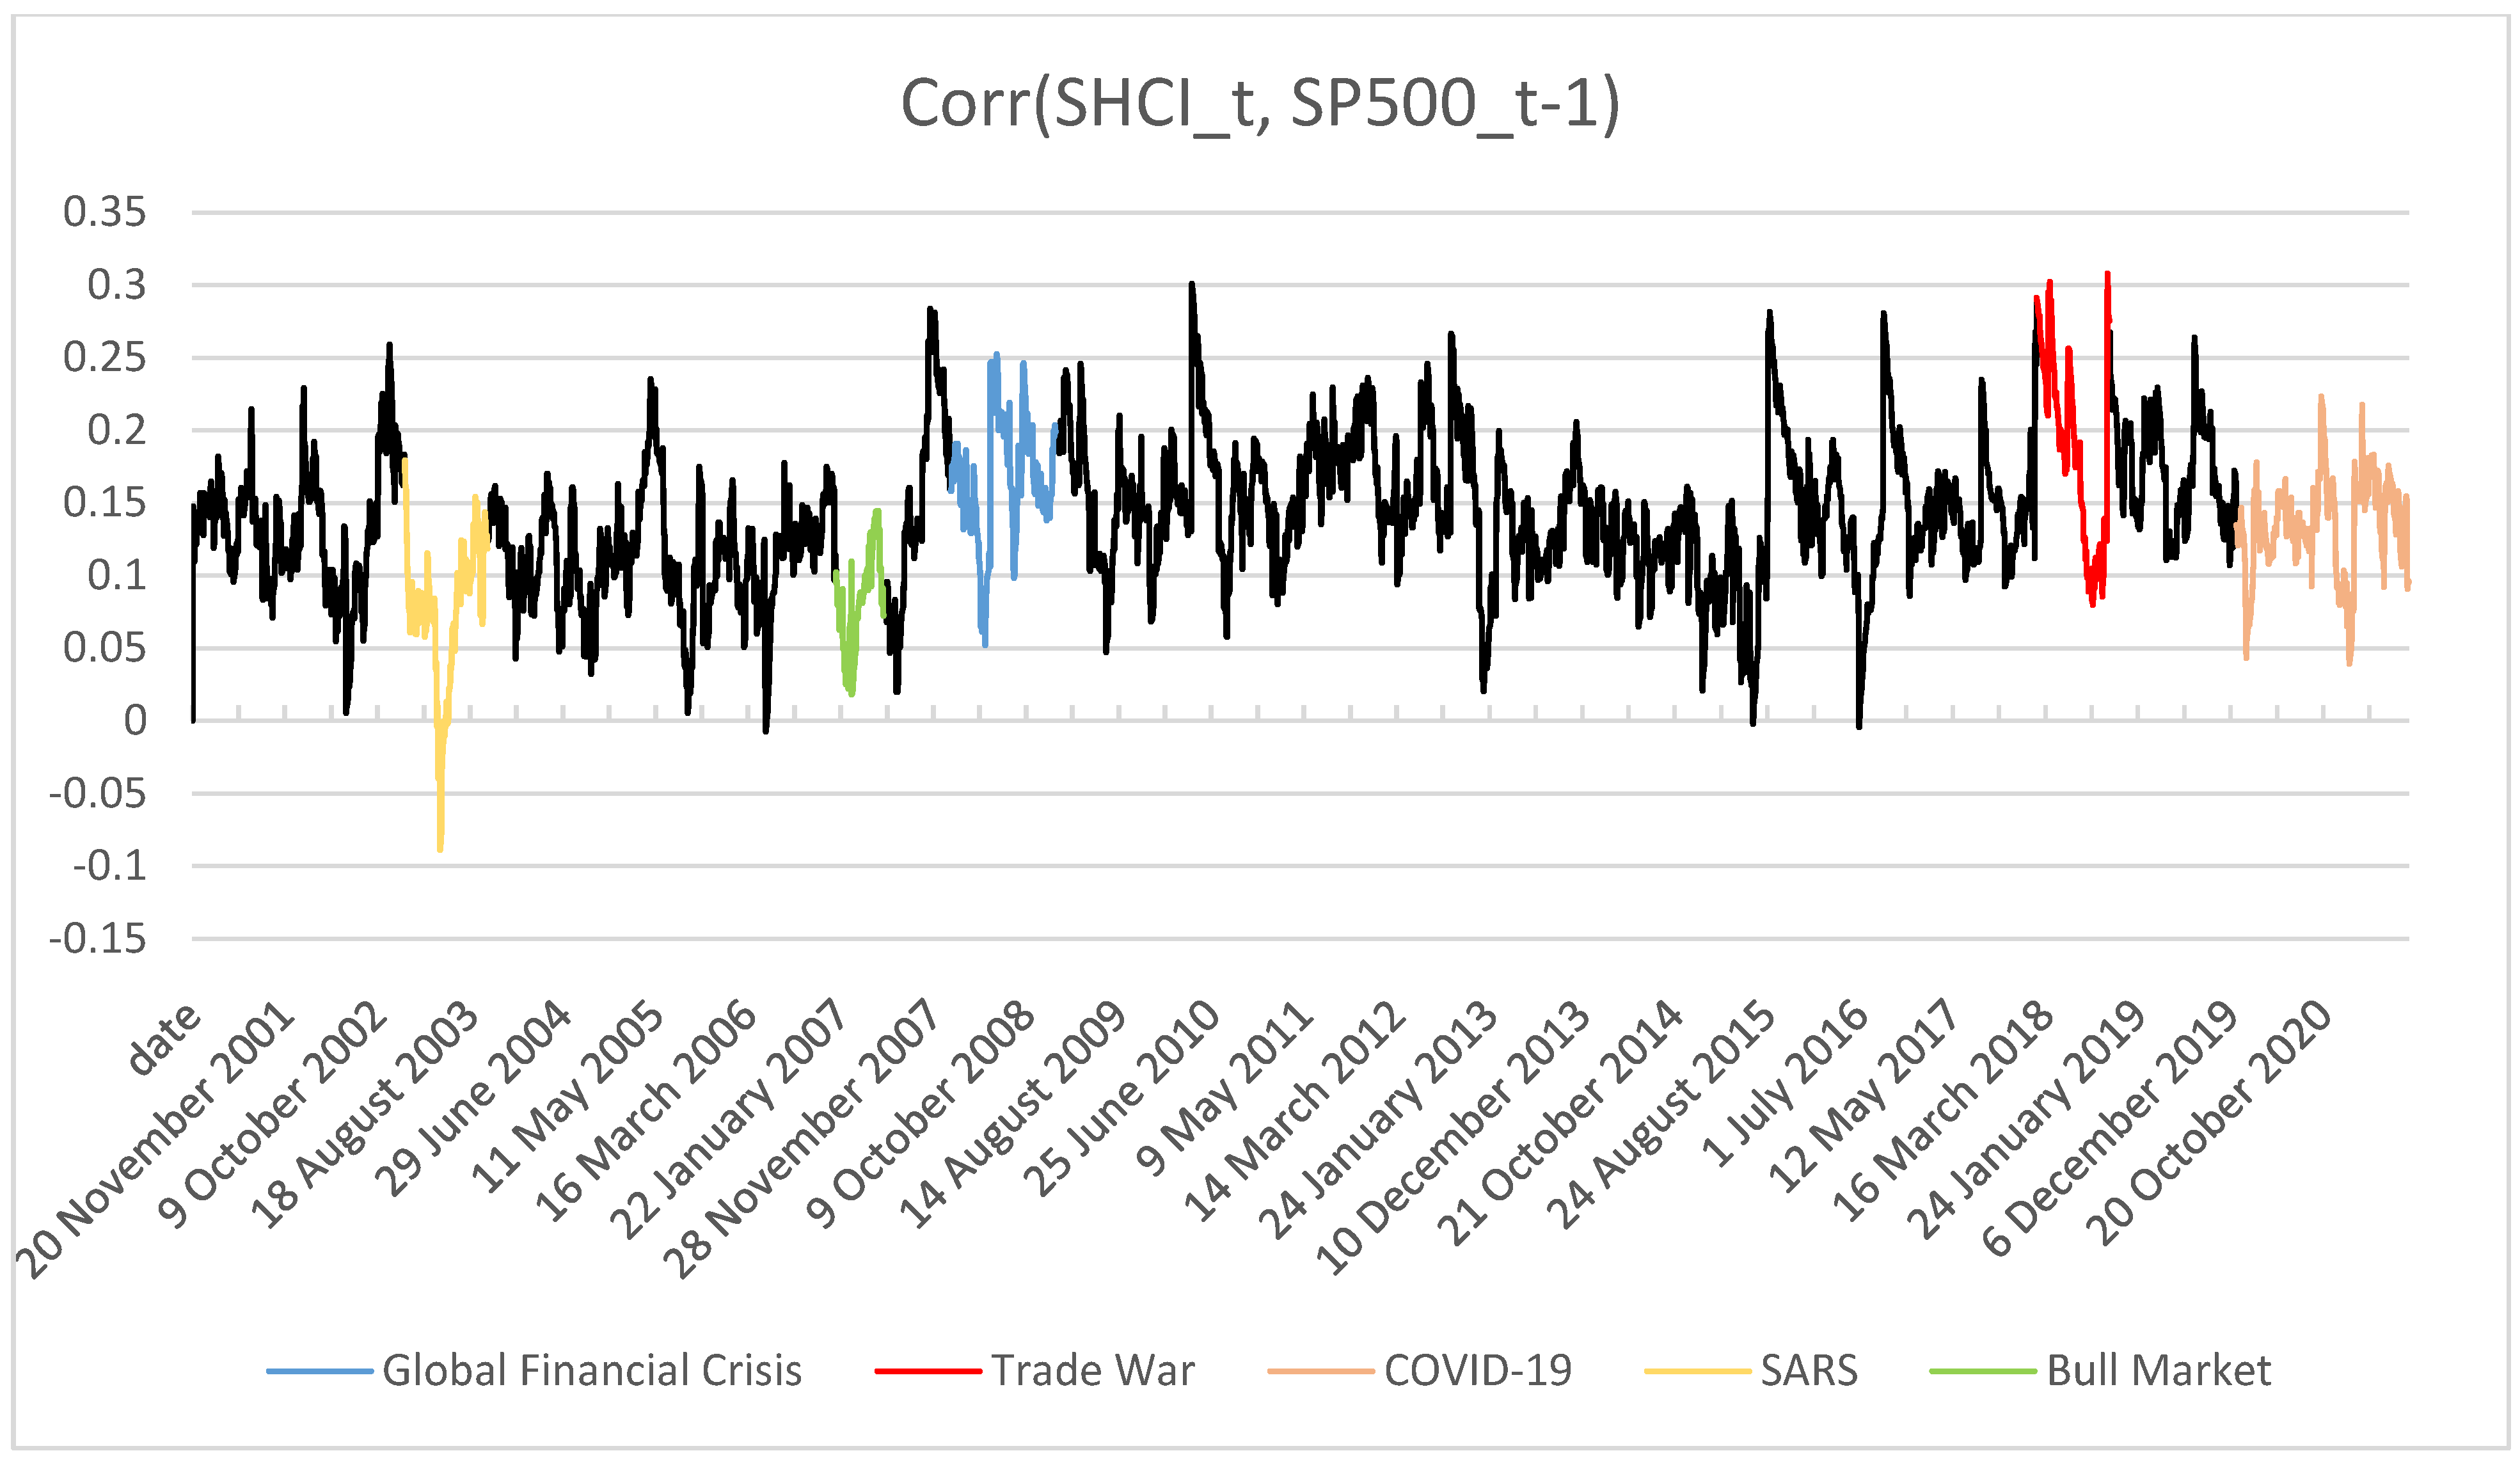

| SHCI | SP500 | NASDAQ | USD | |
|---|---|---|---|---|
| Mean | 0.000103 | 0.000251 | 0.000372 | −3.61 × 10⁻⁵ |
| Median | 0.000550 | 0.000702 | 0.001037 | −0.000103 |
| Maximum | 0.094010 | 0.109572 | 0.132546 | 0.059653 |
| Minimum | −0.127636 | −0.137774 | −0.158689 | −0.027539 |
| Std.Dev. | 0.015808 | 0.012745 | 0.015306 | 0.005118 |
| Skewness | −0.407482 | −0.551040 | −0.327671 | 0.328351 |
| Kurtosis | 8.451031 | 16.22000 | 11.97649 | 8.641219 |
| Jarque-Bera | 6056.596 | 35086.63 | 16150.75 | 6430.763 |
| Probability | 0.000000 | 0.000000 | 0.000000 | 0.000000 |
| Sum | 0.493772 | 1.202683 | 1.781559 | −0.172838 |
| SumSq.Dev. | 1.195526 | 0.777088 | 1.120797 | 0.125299 |
| Observations | 4785 | 4785 | 4785 | 4785 |
| Information Criteria | DCC-MND | ADCC-MND | DCC-MTD | ADCC-MTD | DCC-MLD | ADCC-MLD |
|---|---|---|---|---|---|---|
| Akaike | −12.210 | −12.209 | −12.340 | −12.342 | −12.276 | −12.281 |
| Bayes | −12.192 | −12.190 | −12.321 | −12.319 | −12.258 | −12.259 |
| Shibata | −12.210 | −12.209 | −12.340 | −12.342 | −12.276 | −12.281 |
| Hannan-Quinn | −12.204 | −12.203 | −12.333 | −12.334 | −12.269 | −12.273 |
| Information Criteria | DCC-MND | ADCC-MND | DCC-MTD | ADCC-MTD | DCC-MLD | ADCC-MLD |
|---|---|---|---|---|---|---|
| Akaike | −11.744 | −11.744 | −11.864 | −11.867 | −11.789 | −11.795 |
| Bayes | −11.727 | −11.725 | −11.845 | −11.844 | −11.772 | −11.773 |
| Shibata | −11.744 | −11.744 | −11.864 | −11.867 | −11.789 | −11.795 |
| Hannan-Quinn | −11.738 | −11.737 | −11.857 | −11.859 | −11.783 | −11.787 |
| Information Criteria | DCC-MND | ADCC- MND | DCC-MTD | ADCC- MTD | DCC- MLD | ADCC- MLD |
|---|---|---|---|---|---|---|
| Akaike | −13.585 | −12.209 | −13.702 | −13.700 | −13.617 | −13.616 |
| Bayes | −13.567 | −12.190 | −13.683 | −13.677 | −13.599 | −13.595 |
| Shibata | −13.585 | −12.209 | −13.702 | −13.700 | −13.617 | −13.616 |
| Hannan-Quinn | −13.579 | −12.203 | −13.695 | −13.692 | −13.611 | −13.609 |
| Explanatory Variables | ADCC-MVT SHCI + SP500 | DCC-MTD SHCI + USD | ADCC-MVT SHCI + NASDAQ |
|---|---|---|---|
| SHCI | |||
| α0 | 0.000312 ** (0.000152) | 0.000113 (0.000175) | 0.000312 ** (0.000152) |
| α1 | 0.000001 (0.000001) | 0.000002 (0.000004) | 0.000001 (0.000001) |
| α2 | 0.054449 *** (0.008966) | 0.067948 *** (0.037635) | 0.054449 *** (0.008976) |
| β1 | 0.933246 *** (0.008661) | 0.915254 *** (0.047597) | 0.933246 *** (0.008647) |
| γ1 | 0.022333 ** (0.010738) | 0.022892 (0.025818) | 0.022333 ** (0.010732) |
| Shape1 | 4.400244 *** (0.310510) | 4.400244 *** (0.311092) | |
| SP500/USD/NASDAQ | SP500 | USD | NASDAQ |
| α0 | 0.000569 *** (0.000103) | −0.000054 (0.000064) | 0.000829 *** (0.000139) |
| α1 | 0.000002 (0.000001) | 0.000000 (0.000000) | 0.000003 (0.000002) |
| α2 | 0.000000 (0.011219) | 0.031241 *** (0.003448) | 0.000001 (0.007633) |
| β1 | 0.884345 *** (0.023238) | 0.958642 *** (0.001626) | 0.895868 *** (0.018843) |
| γ1 | 0.199700 *** (0.042032) | 0.014803* (0.008767) | 0.174673 *** (0.036266) |
| Shape2 | 5.756440 *** (0.518589) | 6.500130 *** (0.592510) | |
| A | 0.002712 (0.008844) | 0.003090 * (0.001660) | 0.001208 (0.001165) |
| B | 0.993701 *** (0.034701) | 0.991526 *** (0.004116) | 0.998768 *** (0.003243) |
| G | 0.000000 (0.002974) | 0.000055 (0.000409) | |
| a(t-1) | 0.013159 ** | 0.008734 | 0.011800 ** |
| B | 0.993701 *** (0.034701) | 0.991526 *** (0.004116) | 0.998768 *** (0.003243) |
| g(t-1) | 0.001151 | 0.004301 | |
| mshape | 5.770440 *** (0.299449) | 6.598618 *** (0.408857) | 6.012508 *** (0.292350) |
Disclaimer/Publisher’s Note: The statements, opinions and data contained in all publications are solely those of the individual author(s) and contributor(s) and not of MDPI and/or the editor(s). MDPI and/or the editor(s) disclaim responsibility for any injury to people or property resulting from any ideas, methods, instructions or products referred to in the content. |
© 2022 by the authors. Licensee MDPI, Basel, Switzerland. This article is an open access article distributed under the terms and conditions of the Creative Commons Attribution (CC BY) license (https://creativecommons.org/licenses/by/4.0/).
Share and Cite
Liu, J.; Wan, Y.; Qu, S.; Qing, R.; Sriboonchitta, S. Dynamic Correlation between the Chinese and the US Financial Markets: From Global Financial Crisis to COVID-19 Pandemic. Axioms 2023, 12, 14. https://doi.org/10.3390/axioms12010014
Liu J, Wan Y, Qu S, Qing R, Sriboonchitta S. Dynamic Correlation between the Chinese and the US Financial Markets: From Global Financial Crisis to COVID-19 Pandemic. Axioms. 2023; 12(1):14. https://doi.org/10.3390/axioms12010014
Chicago/Turabian StyleLiu, Jianxu, Yang Wan, Songze Qu, Ruihan Qing, and Songsak Sriboonchitta. 2023. "Dynamic Correlation between the Chinese and the US Financial Markets: From Global Financial Crisis to COVID-19 Pandemic" Axioms 12, no. 1: 14. https://doi.org/10.3390/axioms12010014
APA StyleLiu, J., Wan, Y., Qu, S., Qing, R., & Sriboonchitta, S. (2023). Dynamic Correlation between the Chinese and the US Financial Markets: From Global Financial Crisis to COVID-19 Pandemic. Axioms, 12(1), 14. https://doi.org/10.3390/axioms12010014


