Article

A Spherical Fuzzy Multi-Criteria Decision-Making Model for Industry 4.0 Performance Measurement

Department of Industrial Engineering, Ankara Science University, 06200 Ankara, Türkiye
Axioms 2022, 11(7), 325; https://doi.org/10.3390/axioms11070325
Submission received: 30 May 2022 / Revised: 21 June 2022 / Accepted: 27 June 2022 / Published: 4 July 2022
(This article belongs to the Special Issue Soft Computing with Applications to Decision Making and Data Mining)

Abstract

:
In recent years, efficient processes have become increasingly important because of high-level competition in the production industry. The concept of Industry 4.0 is a relatively new and effective method for managing production processes. Because the Industry 4.0 implementation process includes connections between objects, humans, and systems, it is quite difficult to evaluate and measure the performance. At this stage, performance criteria can be applied. However, linguistic evaluation of criteria makes the problem too complicated to solve. The purpose of this paper is to present a novel fuzzy performance measurement model for Industry 4.0 in small and medium-sized manufacturing firms. A hybrid spherical fuzzy analytic hierarchy process (SF-AHP)—weighted score methodology (WSM) is proposed for the performance measurement and scoring process. In the application part of this paper, the propounded methodology was applied to five companies. The results of this study can be used as a reference for experts in the performance measurement of the Industry 4.0 process.

1. Introduction

By the end of the 18th century, the introduction of mechanical production techniques based on water and steam power had changed the world. The usage of mechanical manufacturing equipment is called the first Industrial Revolution (1.0) and the beginning of industrialization. With the invention of electric power, another era had begun. This new invention was used to bring about mass production during the second Industrial Revolution (2.0). In the 1970s, the growth of automation, the power of electronics, and information technology changed the world again. Production was further mechanized in the third Industrial Revolution (3.0) [1]. In recent decades, major technological developments have appeared, such as the internet, processing power, and artificial intelligence. As a result of these technological advances, the fourth and lastest industrial revolution started, which is called “Industry 4.0” or “I4.0”.
The Industry 4.0 concept was first introduced by the German government in 2011 to promote manufacturing computerization [2]. The proposed concept has attracted considerable attention. It includes cloud computing, the Internet of Things (IoT), and cyber-physical systems. The concept addresses smart factories. Cyber-physical systems monitor physical processes and create a virtual copy of the physical world by using the advantages of cloud computing. The IoT refers to cyber-physical systems that communicate and collaborate online in real-time [3]. Furthermore, internet services provide valuable information for both internal and cross-organizational participants in all production processes.
Industry 4.0 was presented as a theoretical concept. Companies that have implemented this concept in their industries have reaped numerous benefits. Reduced costs and increased productivity are the main advantages [4]. Because of the benefits that the company provides as a result of Industry 4.0 technologies, this concept has spread quickly. Herewith, businesses started investing in Industry 4.0 technologies.
Industry 4.0 is a revolution that affects all types of industries and the processes associated with them. There is also a relationship between Industry 4.0 and sustainability [5]. Therefore, the literature has been fairly wide-ranging [6]. It is possible to evaluate Industry 4.0 from different perspectives. Performance management is one of the important points in the evaluation process. There are many alternative evaluation methods for the Industry 4.0 performance measurement such as balanced scorecard (BSC), empirical methods, and MCDM approaches [7,8,9]. In this research, a novel evaluation model was proposed for Industry 4.0 performance management for small and middle-sized production companies. The performance was evaluated by using a new hybrid SF-AHP—WSM approach.
The paper is structured as follows: A brief literature review is given in Section 2. Spherical fuzzy sets and the steps of the proposed methodology are explained in Section 3. Industry 4.0 performance evaluation application is given in Section 4. Finally, conclusions and future works are in the last section.

2. Literature Review

Multi-criteria decision-making (MCDM) methods have been widely utilized in decision processes, selection, ranking, and evaluation problems for a long time. Although Industry 4.0 is a new concept, there are different MCDM approaches used for emerging problems. Veza et al. proposed a procedure for comparison and ranking of industrial enterprises with the preference ranking organization method for enrichment evaluation (PROMETHEE) method, based on the enterprise’s competencies [10]. Medic et al. used the hybrid fuzzy MCDM method to rank organizational improvements from Industry 4.0 perspective [11]. According to the research, organizational innovations have a strong relation with Industry 4.0 approaches in manufacturing companies. Kazancoglu et al. presented a structural competency model and new criteria for personnel selection in the Industry 4.0 frame through the fuzzy decision-making trial and evaluation laboratory (DEMATEL) method [12]. Hassanpour et al. investigated the effects of Industry 4.0 on the household appliance industry. The authors combined the MCDM and data envelopment analyses (DEA) methods and propounded a hybrid approach for ranking companies and evaluating efficiency scores [13].
Performance measurement and performance indicators in Industry 4.0 are important topics in the literature. Ante et al. develop a key performance indicators tree for lean and smart production systems [14]. Lopes and Martins provide a map of Industry 4.0 impacts on performance measurement systems [15]. Kloviene and Uosyte use qualitative research methods, including semi-structured interviews and documents analysis, to develop a performance measurement system [16]. Xie et al. focus on intelligent supply chain performance measurement in Industry 4.0 [17]. Yin and Qin offer a smart performance measurement approach for collaborative design in Industry 4.0 [18].
Examining the readiness factors of Industry 4.0 is another important step. Sriram et al. use the complex proportionality assessment (COPRAS) methodology for Industry 4.0 deployment in small and medium-sized enterprises (SMEs) [19]. Büyüközkan et al. analyze the success factors of Industry 4.0 in aviation by using an integrated intuitionistic MCDM methodology [9]. In the research, factors are obtained from the expert opinions and literature survey. Vinodh et al. analyzed the workforce attributes related to Industry 4.0 using fuzzy DEMATEL and fuzzy combinative distance-based assessment (CODAS) [20]. Gupta et al. propose a model based on sustainable production, economy, and Industry 4.0 standards. The model evaluates manufacturing companies’ sustainability performance by applying the MCDM approach [21].
The MCDM literature is developing rapidly, and new methods are constantly emerging. Watróbski and Sałabun propose a new MCDM approach called the Characteristic Objects method (COMET), which is resistant to the rank reversal phenomenon [22]. Kizielewicz et al. combine COMET with TOPSIS and PROMETHEE II [23]. Faizi et al. offer a method to support decision making in an uncertain environment. The method is based on normalized interval-valued triangular fuzzy numbers [24]. Rehman et al. focus on the AHP structure in group decision making using incomplete fuzzy information [25].
The AHP methodology, one of the most widely used decision-making methods in the literature, was suggested by Saaty in the 1980s [26]. It is developed for organizing and analyzing complex decisions based on mathematics and psychology. The methodology provides to reveal objective thoughts for the personal preferences in the decision-making process. It is based on pairwise comparisons of decision makers. The decision maker reaches the final ranking by comparing the criteria and the alternatives within the hieratical structure [27]. This method can be used for a decision maker as well as for the decision process of a group containing more than one decision maker [28]. Another advantage of the method is that it provides more consistent comparisons by revealing the inconsistency in the comparisons of the decision makers [29].
In fuzzy decision making, decision makers prefer to express their evaluations as a range rather than fixed values due to the fuzzy nature of the selection process. There is a broad range of studies and approaches available for fuzzy decision-making processes in the literature [30]. Classical fuzzy sets [31], type-2 fuzzy sets [32], interval-valued [32], intuitive (intuitionistic) fuzzy sets [33], fuzzy multiple sets [34], intuitive type-2 sets [35], Neutrosophic fuzzy sets [36], non-stationary fuzzy sets [37], unstable (Hesitant) fuzzy sets [38], Pythagorean fuzzy sets [39], q-rung Orthopair fuzzy sets [40], and finally spherical fuzzy sets [41] were combined with the AHP method.

3. Methodology

Although the human mind is relatively accurate in qualitative predictions, it may fail to make quantitative predictions. For many problems, some decision data can precisely be evaluated while others cannot be done. Uncertainty in preference judgments leads to uncertainty in the order of alternatives and difficulties in defining the consistency of preferences [42].
Methods of dealing with MCDM problems may involve complex processes. The success of the decision-making model(s) applied to solve the problem is directly proportional to the accuracy of the data received from the DM. However, in many cases, linguistic uncertainties in the decision-making process drive DMs to erroneous conclusions [43]. Fuzzy decision-making processes have emerged as a solution to these problems.
There are specific judgments in classical decision-making problems. However, in complex decision-making processes where uncertainty is concerned, the DMs prefer general evaluations rather than definitive assessments. In order to express these linguistic uncertainties in the decision-making process, fuzzy sets are used, which is similar to human thought. Fuzzy sets were proposed in the mid-1960s, and their membership functions are used for situations that cannot be expressed in crisp numbers [31]. Spherical fuzzy sets are a relatively new approach [44,45]. In this paper, the SF-AHP approach has been applied to determine the criterion weights [46]. WSM has been used for performance scoring. First, spherical fuzzy sets are explained [47]. After that, the steps of the SF-AHP—WSM hybrid methodology are represented.

3.1. Spherical Fuzzy Sets

The definition of A ˜ s , which is the spherical fuzzy set defined on U, is given in Equation (1).
A ˜ s = u , ( μ A ˜ s u , ( v A ˜ s u ( π A ˜ s u ) | u U
where μ A ˜ s u :   U 0 , 1 ,   v A ˜ s u :   U 0 , 1 , π A ˜ s u :   U 0 , 1 and 0     μ A ˜ s 2 u + v A ˜ s 2 u + π A ˜ s 2 u     1 ,   u U .
In spherical fuzzy sets, addition and multiplication operators are defined as given in Equations (2) and (3).
A ˜ s B ˜ s = μ A ˜ s 2 + μ B ˜ s 2     μ A ˜ s 2 μ B ˜ s 2 2 , v A ˜ s v B ˜ s , 1     μ B ˜ s 2 π A ˜ s 2 + 1 μ A ˜ s 2 π B ˜ s 2 π A ˜ s 2 π B ˜ s 2 1 / 2
A ˜ s B ˜ s =   μ A ˜ s μ B ˜ s , v A ˜ s 2 + v B ˜ s   2   v A ˜ s 2 v B ˜ s 2 1 / 2 , 1 v B ˜ s 2 π A ˜ s 2 + 1 v A ˜ s 2 π B ˜ s 2 π A ˜ s 2 π B ˜ s 2 1 / 2
The multiplication of a spherical fuzzy number with a constant λ 0 number is given in Equation (4),
λ . A ˜   s = 1 1 μ A ˜ s 2 λ 1 2 , v A ˜ s λ , 1 μ A ˜ s 2 λ 1 μ A ˜ s 2 π A ˜ s 2 λ 1 / 2
and the power of a spherical fuzzy number is given in Equation (5),
μ A ˜ s λ = μ A ˜ s λ , 1 1 v A ˜ s 2 λ 1 2 , 1 v A ˜ s 2 λ 1 v A ˜ s 2 π A ˜ s 2 λ 1 / 2
General definitions in spherical fuzzy sets: Let A ˜ s = μ A ˜ s , v A ˜ s , π A ˜ s and B ˜ s = μ B ˜ s , v B ˜ s , π B ˜ s are the spherical fuzzy set numbers. For all λ 1 , λ 2 , λ 3 , 0 , the properties are given in Equations (6)–(11).
A ˜ s B ˜ s = B ˜ s A ˜ s  
A ˜ s B ˜ s =   B ˜ s A ˜ s
λ ( A ˜ s B ˜ s ) = λ A ˜ s λ B ˜ s  
λ 1 A ˜ s λ 2 A ˜ s = λ 1 + λ 2 A ˜ s  
( A ˜ s B ˜ s ) λ =   λ . A ˜ s λ . B ˜ s
A ˜ s λ 1 A ˜ s λ 2 = A ˜ s λ 1 + λ 2  
The definition of spherical fuzzy arithmetic mean ( S F A M ) is given in Equation (12).
S F A M A ˜ 1 , A ˜ 2 , , A ˜ n = i = 1 n w i A ˜ i = w 1 A ˜ 1 w 2 A ˜ 2 w n A ˜ n
where w = w 1 , w 2 , , w n T is a weight vector of the S F A M operator where i I n , w i 0 , 1 and i = 1 n w i = 1 .
The definition of spherical fuzzy geometric mean ( S F G M ) is given in Equation (13).
S F G M A ˜ 1 , A ˜ 2 , , A ˜ n = i = 1 n A ˜ i w i = A ˜ s 1 w 1 A ˜ 2 w 2 A ˜ n w n   ,
where w = w 1 , w 2 , , w n T is a weight vector of the S F G M operator where i I n , w i 0 , 1 and i = 1 n w i = 1 .

3.2. SF-AHP-WSM Methodology

In the classical AHP method, pairwise comparisons are expressed with crisp numbers [48]. However, it ignores the linguistic uncertainty of the decision makers, as mentioned before [49]. So as to overcome this deficiency, the AHP method and fuzzy sets were combined together [50]. In this study, the SF-AHP and WSM methods were applied for a hybrid approach. The SF-AHP method was used for criteria evaluation. The WSM method was selected because a scale ranged 1–10 was used in the SMEs evaluation. There are seven steps in the proposed methodology. The steps are given below.
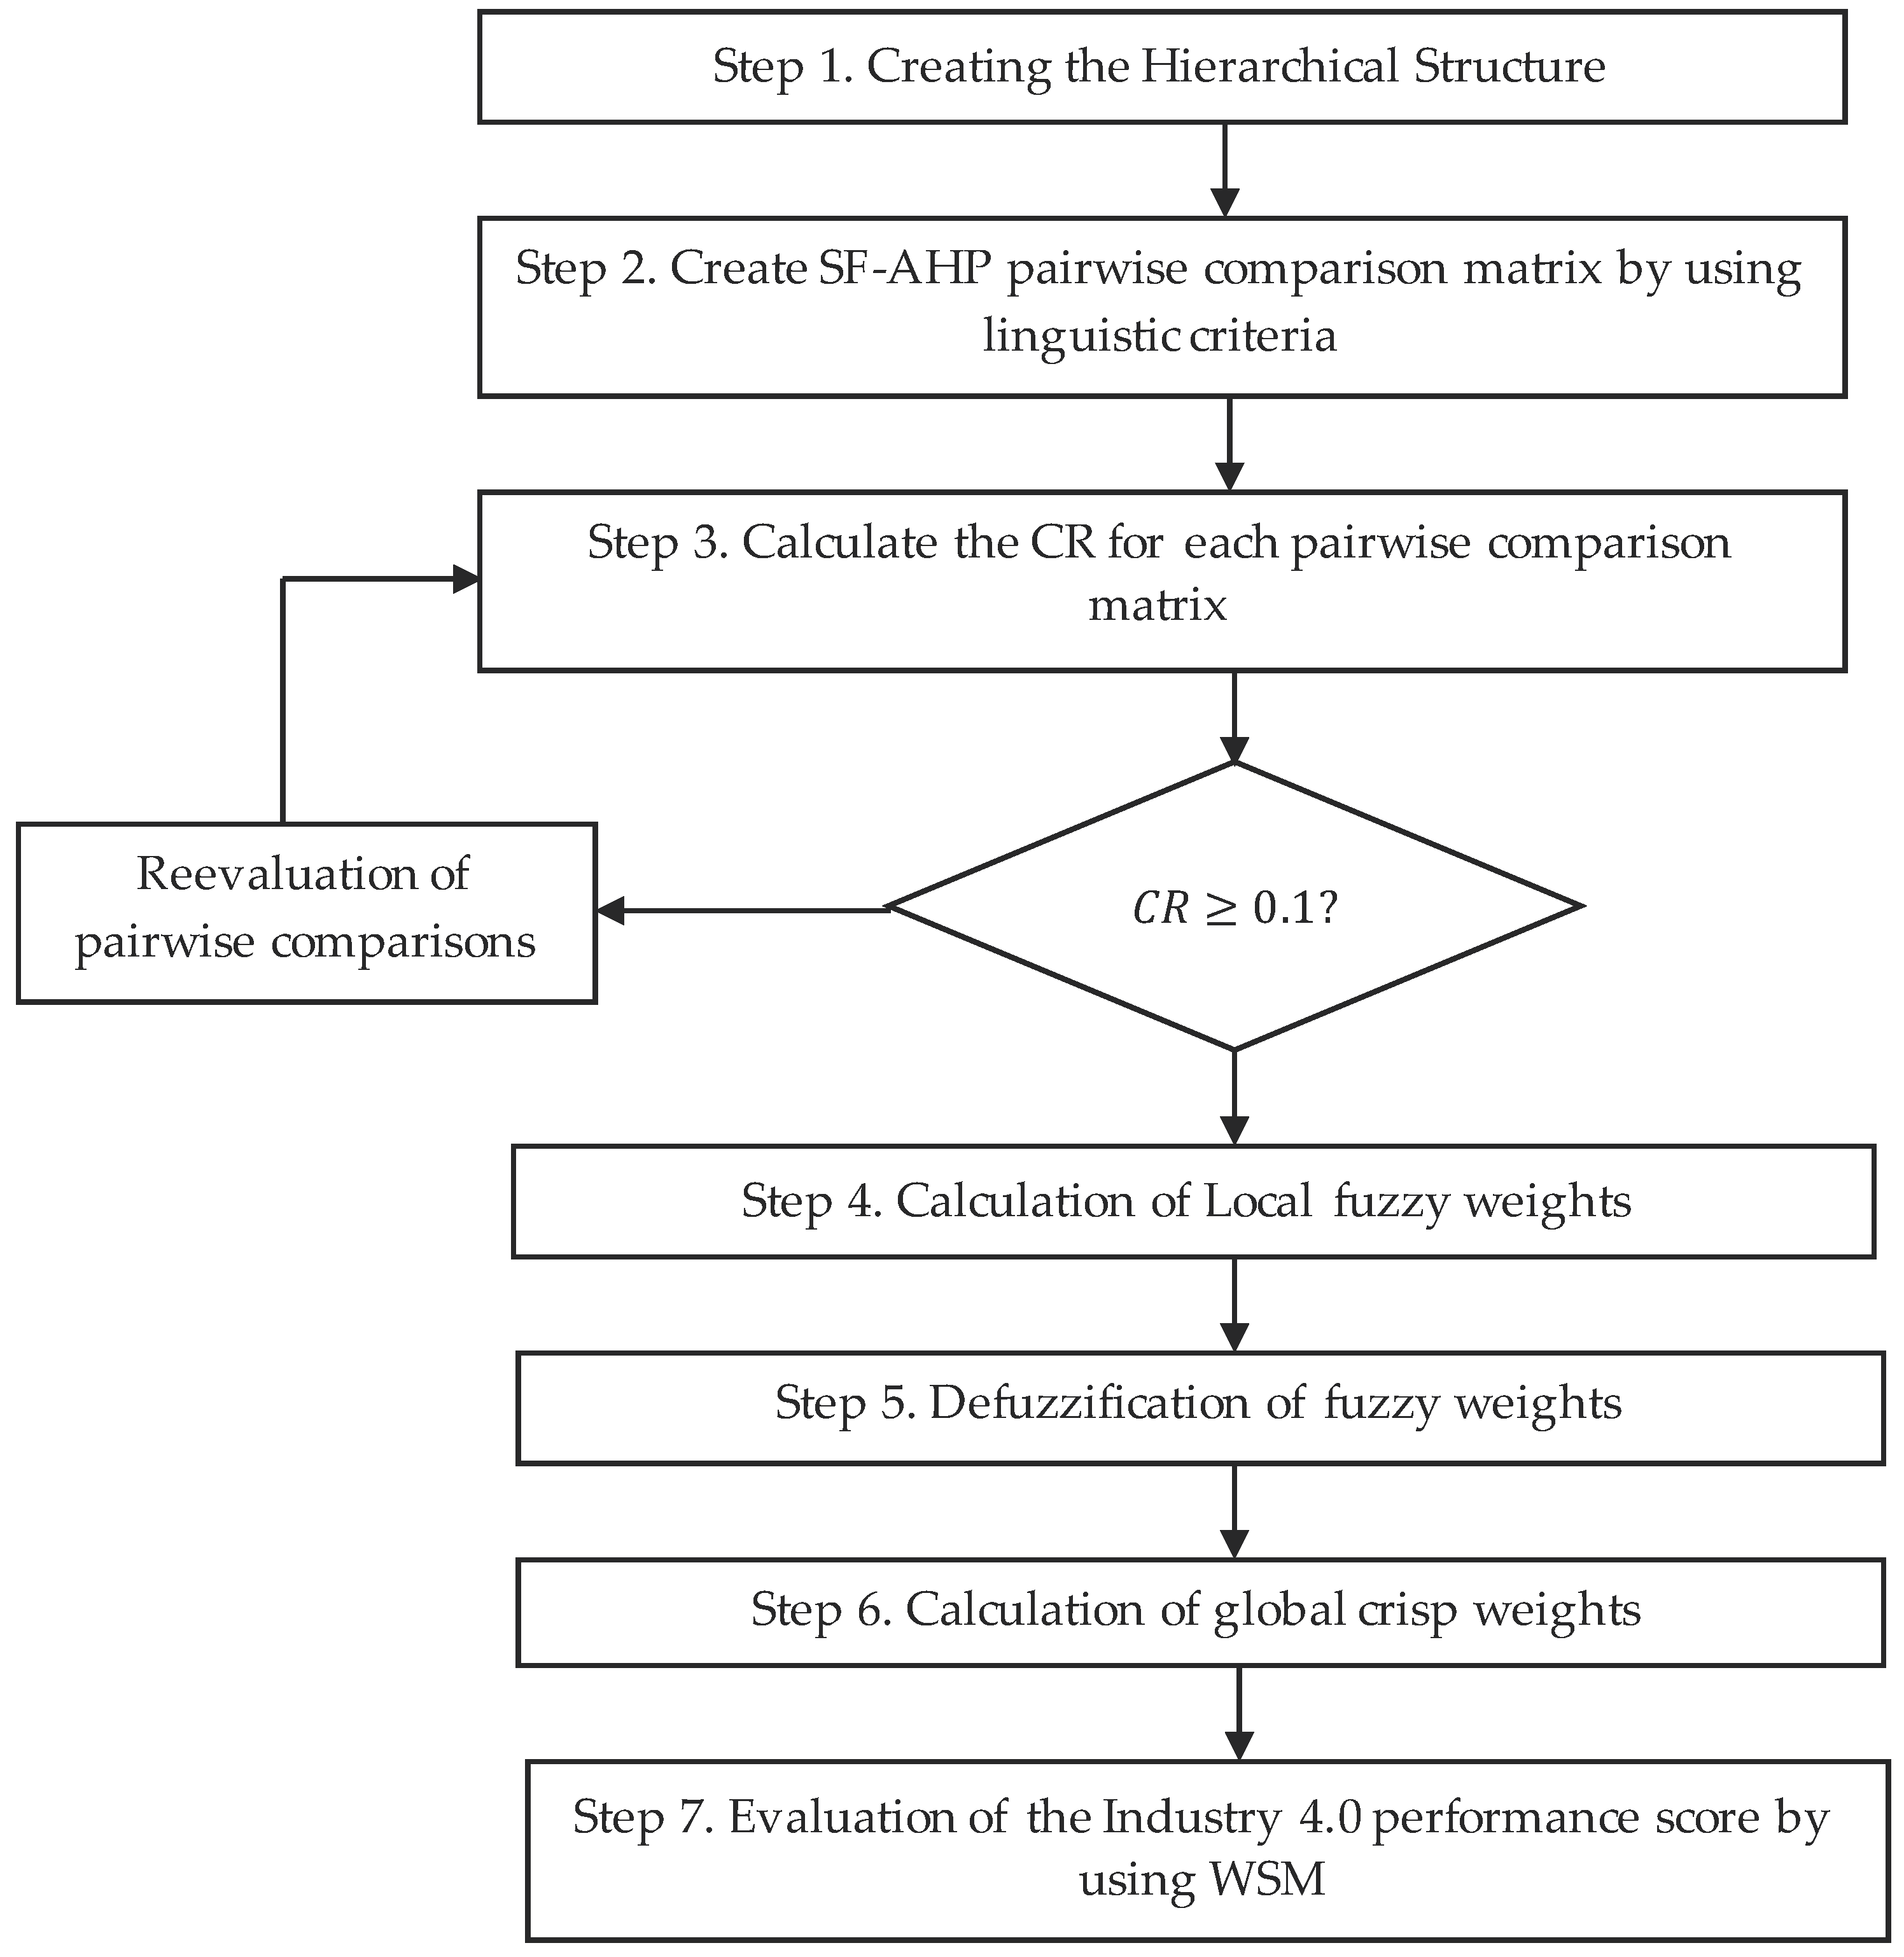
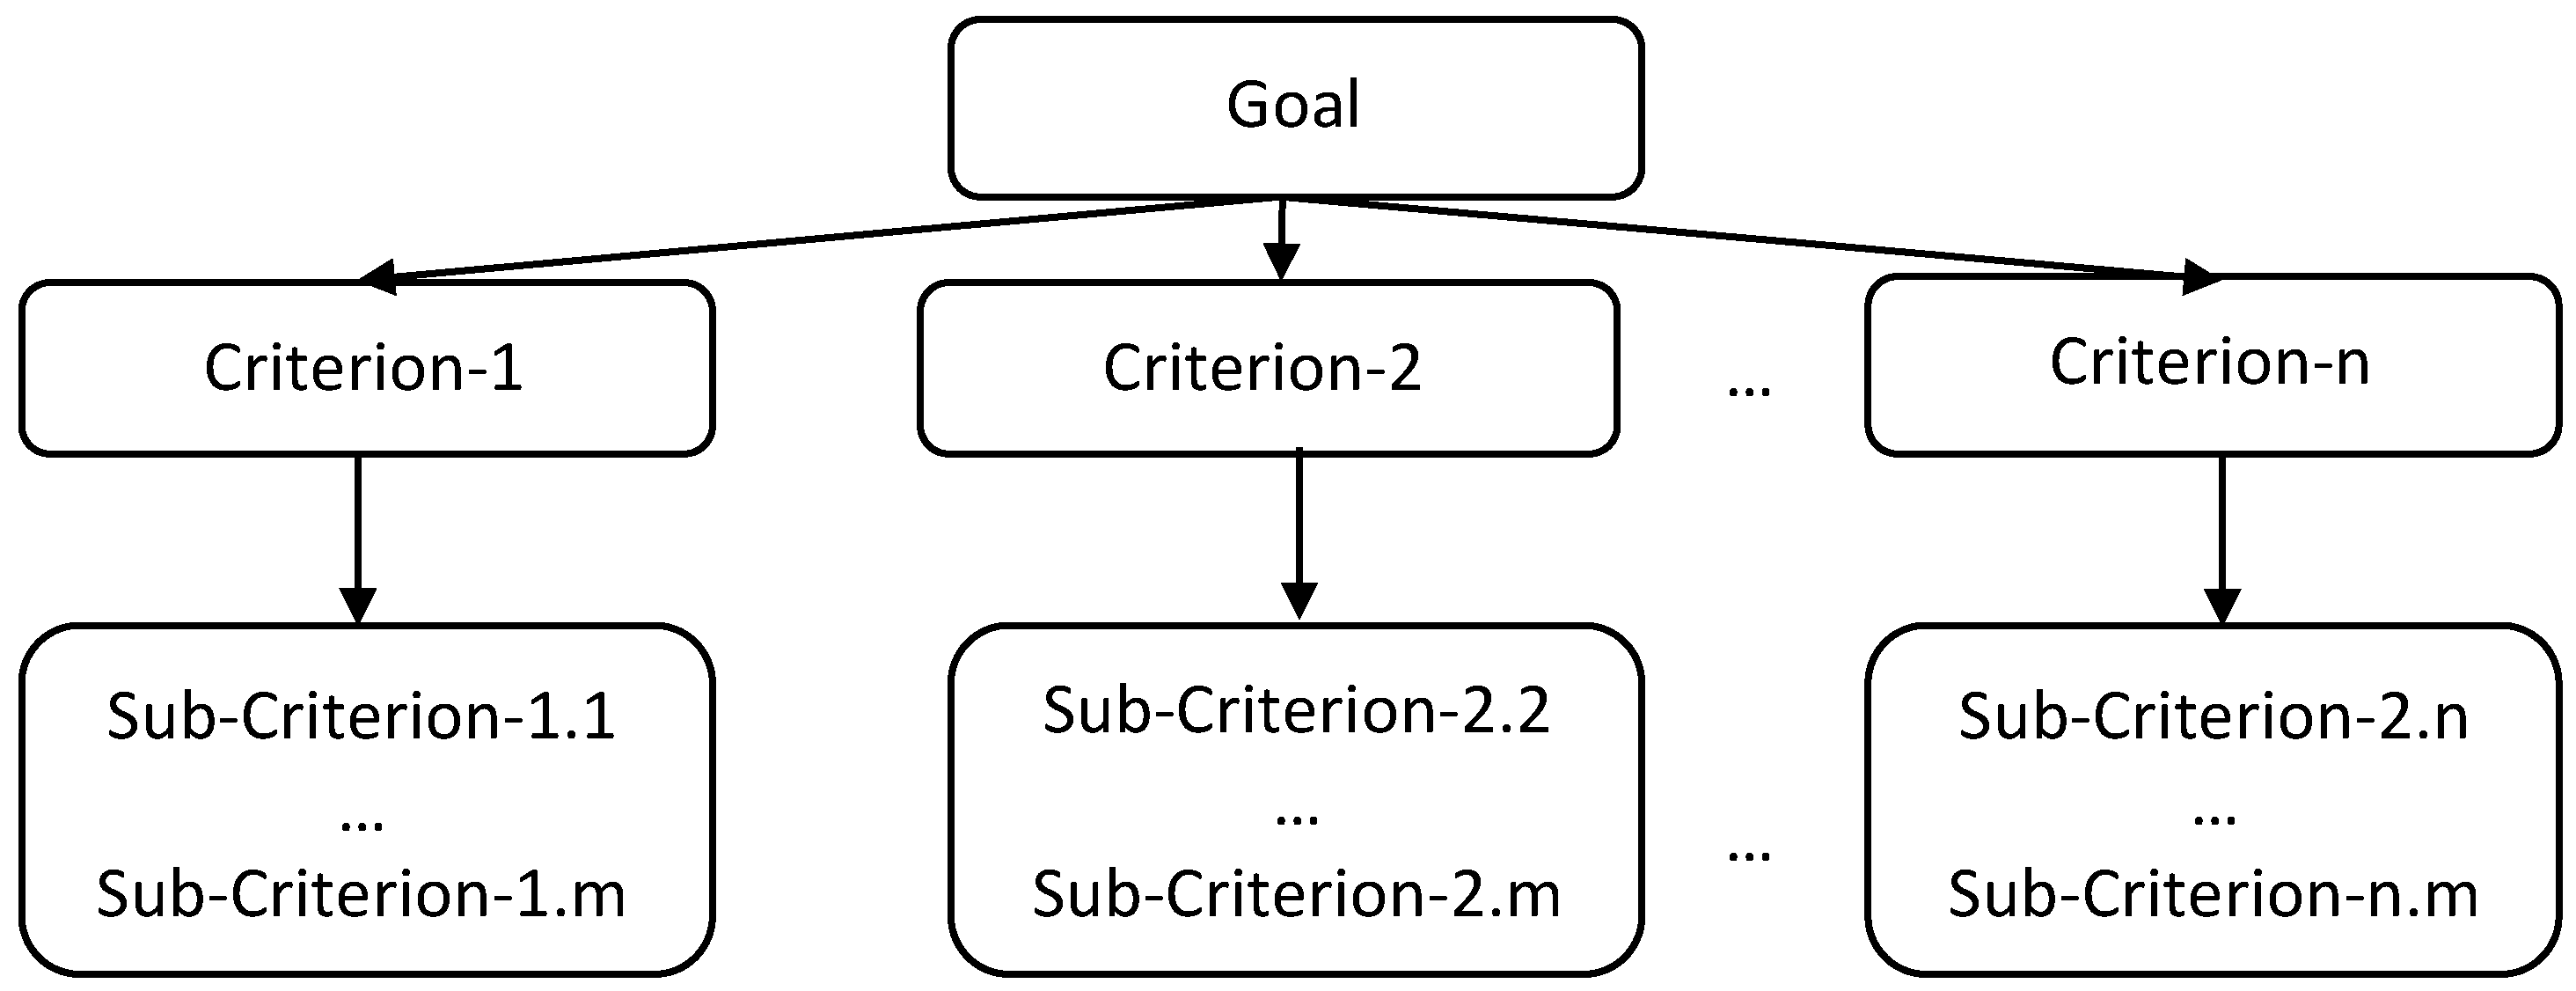
Step 1. Creation of Hierarchical Structure: In this step, the hierarchical structure of the problem is created, as given in Figure 1. The goal, criteria, sub-criteria, and SMEs to be evaluated are determined. If there is a group decision, the decision-making group is selected at this stage.
Step 2. Creation of pairwise comparison matrices: Pairwise comparison matrices are evaluated by decision makers according to the linguistic measurements, which are given in Table 1.
The comparison matrix is represented in Equation (14).
A ˜ k = EI d ˜ k 12 d ˜ 1 n k d ˜ 21 k EI d ˜ 2 n k d ˜ n 1 k d ˜ n 2 EI
Step 3. Calculation of the consistency ratio (CR): SI values are calculated by using Equation (15).
S I = 100 μ A ˜ s π A ˜ s 2 υ A ˜ s π A ˜ s 2
The calculated SI values are given in Table 1. SI, random index (RI), and consistency index (CI) values are used in the calculation of CR for each comparison matrix. The RI values are given in Table 2.
CI formula is given in Equation (16).
C I = λ m a x n n 1
If the calculated CR (Equation (17)) is greater than 0.1, the decision maker is asked to reconsider the comparison matrix [47].
C R = C I / R I
Step 4. Calculation of local fuzzy weights: SWAM operator, given in Equation (18), is used to calculate fuzzy weight values from pairwise comparison tables.
S W A M = 1 i = 1 n 1 μ A s i 2 w i 1 / 2 , i = 1 n v A s i w i , i = 1 n 1 μ A s i 2 w i i = 1 n 1 μ A s i 2 π A s i 2 w i 1 / 2
where w = 1 / n .
Step 5. Defuzzification of fuzzy weights: The defuzzification formula is given in Equation (19).
S w j = 100 3 μ A ˜ s π A ˜ s 2 2 v A ˜ s 2 π A ˜ s 2
Step 6. Calculation of global weights: Global weights are obtained from defuzzified local weights.
Step 7. Evaluation of the Industry 4.0 performance score by using WSM: In the last step, the weighted performance score of the enterprise is calculated. This method allows researchers to evaluate and score more than one enterprise at the same time. If there is more than one candidate, the companies can be ranked.
The flow chart of the proposed methodology is given in Figure 2.

4. Application

In this study, the SF-AHP—WSM approach is proposed for the Industry 4.0 performance measurement of SMEs operating in manufacturing. According to the proposed methodology’s first step, a hierarchical structure was constructed. The criteria used in this study were created by combining findings from a literature review and expert opinions. There are three main criteria and twelve sub-criteria. The main criteria are software, production, and external stakeholders. Each main criterion has four sub-criteria. The proposed hierarchical structure of SF-AHP and the explanations of the criteria are given in Table 3.
In the second step, pairwise comparison matrices were conducted. There may be one or more than one decision makers in the decision-making process. It depends on the content and type of decision-making problem. In the scope of this research, weights were evaluated by a group of three experts: one expert from the university who has scientific works on Industry 4.0, one software and technology expert, and one expert from the manufacturing sector. An example of a linguistic pairwise comparison matrix is given in Table 4.
In the third step, for all comparison matrices, CR was evaluated. All CRs are smaller than 0.1. It shows that all comparisons are consistent.
Local fuzzy weights of criteria and sub-criteria are calculated in step four. Then, in step five, defuzzified weights are found by using Equation (19). For the main criteria, fuzzy weights and defuzzified weights are given in Table 5.
Evaluation of sub-criteria under software is given in Table 6. Here, cyber security and ERP software are the most important sub-criteria.
Sub-criteria of production are given in Table 7. As seen in the table, IoT is the most important factor.
Local weights of external stakeholders are given in Table 8. According to evaluations, the most important sub-criteria is customer relations. Public relations, digital supply chain, and online orders are followed, respectively.
In step six, global weights of sub-criteria were evaluated. The results are given in Table 9. According to the results, IoT and cyber security are the two most important sub-factors. Although the criteria sets are different, IoT was found to be important in the first place in other studies in the literature [51]. After that, five different SMEs were evaluated in the seventh step. Each company was evaluated with a group of three high-level white-collar company employees. These employees are responsible for the I4.0 process. A scale ranging from 1 to 10 was used in the evaluation. The results are given in Table 9.
The weighted SME scores are given in Table 9. According to the results, the highest-ranked SME is 3rd enterprise. Furthermore, each company could be aware of both its strong and weak points in the I4.0 implementation process.

5. Conclusions and Future Works

As a result of technological improvements and customer demands, competition between enterprises increased in the last decades. It is of vital importance for businesses to capture technological innovations and integrate them into their systems. After the integration process, performance management evaluation of Industry 4.0 will contribute to SMEs’ productivity, competitiveness, and growth of the company. This study presents a hybrid SF-AHP—WSM Industry 4.0 performance evaluation approach proposed for SMEs operating in the field of manufacturing. Performance measurements were examined under three main criteria: software, production, and external partners. Fuzzy sets were used to incorporate linguistic uncertainties into the criterion evaluation process.
The proposed approach was applied in a real-life evaluation process for demonstration of the potential use. In further studies, the criteria set and weights defined in the scope of this research could be used for other MCDM approaches. Different fuzzy approaches like type-2 fuzzy sets, intuitionistic fuzzy sets, or q-rung Orthopair fuzzy sets can be applied with the AHP method together. The results can be compared by using different methods such as TOPSIS, PROMETHEE, and WASPAS. Furthermore, more than five SMEs can be evaluated and performance results compared.

Funding

This research received no external funding.

Institutional Review Board Statement

Not applicable.

Informed Consent Statement

Not applicable.

Data Availability Statement

Not applicable.

Conflicts of Interest

The author declares no conflict of interest.

References

  1. Henning, K.; Wolfgang, W.; Johannes, H. Recommendations for Implementing the Strategic Initiative INDUSTRIE 4.0. Final. Rep. Ind. 2013, 4, 82. [Google Scholar]
  2. Sung, T.K. Industry 4.0: A Korea Perspective. Technol. Forecast. Soc. Change 2018, 132, 40–45. [Google Scholar] [CrossRef]
  3. Sevinc, E. A Novel Evolutionary Algorithm for Data Classification Problem with Extreme Learning Machines. IEEE Access 2019, 7, 122419–122427. [Google Scholar] [CrossRef]
  4. Stock, T.; Seliger, G. Opportunities of Sustainable Manufacturing in Industry 4.0. Procedia CIRP 2016, 40, 536–541. [Google Scholar] [CrossRef] [Green Version]
  5. Beltrami, M.; Orzes, G.; Sarkis, J.; Sartor, M. Industry 4.0 and Sustainability: Towards Conceptualization and Theory. J. Clean. Prod. 2021, 312, 127733. [Google Scholar] [CrossRef]
  6. Liao, Y.; Deschamps, F.; de Loures, E.F.R.; Ramos, L.F.P. Past, Present and Future of Industry 4.0—A Systematic Literature Review and Research Agenda Proposal. Int. J. Prod. Res. 2017, 55, 3609–3629. [Google Scholar] [CrossRef]
  7. Frederico, G.F.; Garza-Reyes, J.A.; Kumar, A.; Kumar, V. Performance Measurement for Supply Chains in the Industry 4.0 Era: A Balanced Scorecard Approach. Int. J. Product. Perform. Manag. 2021, 70, 789–807. [Google Scholar] [CrossRef]
  8. Kamble, S.S.; Gunasekaran, A.; Ghadge, A.; Raut, R. A Performance Measurement System for Industry 4.0 Enabled Smart Manufacturing System in SMMEs—A Review and Empirical Investigation. Int. J. Prod. Econ. 2020, 229, 107853. [Google Scholar] [CrossRef]
  9. Büyüközkan, G.; Feyzioğlu, O.; Havle, C.A. Analysis of Success Factors in Aviation 4.0 Using Integrated Intuitionistic Fuzzy MCDM Methods. In Proceedings of the Advances in Intelligent Systems and Computing; Springer: Berlin/Heidelberg, Germany, 2020; Volume 1029, pp. 598–606. [Google Scholar]
  10. Veza, I.; Celar, S.; Peronja, I. Competences-Based Comparison and Ranking of Industrial Enterprises Using PROMETHEE Method. Procedia Eng. 2015, 100, 445–449. [Google Scholar] [CrossRef] [Green Version]
  11. Medic, N.; Marjanovic, U.; Zivlak, N.; Anisic, Z.; Lalic, B. Hybrid Fuzzy MCDM Method for Selection of Organizational Innovations in Manufacturing Companies. In Proceedings of the TEMS-ISIE 2018—1st Annual International Symposium on Innovation and Entrepreneurship of the IEEE Technology and Engineering Management Society, Beijing, China, 30 March–1 April 2018. [Google Scholar]
  12. Kazancoglu, Y.; Ozkan-Ozen, Y.D. Analyzing Workforce 4.0 in the Fourth Industrial Revolution and Proposing a Road Map from Operations Management Perspective with Fuzzy DEMATEL. J. Enterp. Inf. Manag. 2018, 31, 891–907. [Google Scholar] [CrossRef]
  13. Hassanpour, M.; Pamučar, D. Evaluation of Iranian Household Appliance Industries Using MCDM Models. Oper. Res. Eng. Sci. Theory Appl. 2019, 2, 1–25. [Google Scholar] [CrossRef]
  14. Ante, G.; Facchini, F.; Mossa, G.; Digiesi, S. Developing a Key Performance Indicators Tree for Lean and Smart Production Systems. IFAC-Pap. 2018, 51, 13–18. [Google Scholar] [CrossRef]
  15. Lopes, M.A.; Martins, R.A. Mapping the Impacts of Industry 4.0 on Performance Measurement Systems. IEEE Lat. Am. Trans. 2021, 19, 1912–1923. [Google Scholar] [CrossRef]
  16. Kloviene, L.; Uosyte, I. Development of Performance Measurement System in the Context of Industry 4.0: A Case Study. Eng. Econ. 2019, 30, 472–482. [Google Scholar] [CrossRef] [Green Version]
  17. Xie, Y.; Yin, Y.; Xue, W.; Shi, H.; Chong, D. Intelligent Supply Chain Performance Measurement in Industry 4.0. Syst. Res. Behav. Sci. 2020, 37, 711–718. [Google Scholar] [CrossRef]
  18. Yin, Y.; Qin, S.F. A Smart Performance Measurement Approach for Collaborative Design in Industry 4.0. Adv. Mech. Eng. 2019, 11, 1687814018822570. [Google Scholar] [CrossRef] [Green Version]
  19. Sriram, R.M.; Vinodh, S. Analysis of Readiness Factors for Industry 4.0 Implementation in SMEs Using COPRAS. Int. J. Qual. Reliab. Manag. 2021, 38, 1178–1192. [Google Scholar] [CrossRef]
  20. Vinodh, S.; Wankhede, V.A. Application of Fuzzy DEMATEL and Fuzzy CODAS for Analysis of Workforce Attributes Pertaining to Industry 4.0: A Case Study. Int. J. Qual. Reliab. Manag. 2020, 38, 1695–1721. [Google Scholar] [CrossRef]
  21. Gupta, H.; Kumar, A.; Wasan, P. Industry 4.0, Cleaner Production and Circular Economy: An Integrative Framework for Evaluating Ethical and Sustainable Business Performance of Manufacturing Organizations. J. Clean. Prod. 2021, 295, 126253. [Google Scholar] [CrossRef]
  22. Watróbski, J.; Sałabun, W. The Characteristic Objects Method: A New Intelligent Decision Support Tool for Sustainable Manufacturing. In Proceedings of the Smart Innovation, Systems and Technologies; Springer: Berlin/Heidelberg, Germany, 2016; Volume 52, pp. 349–359. [Google Scholar]
  23. Kizielewicz, B.; Shekhovtsov, A.; Sałabun, W. A New Approach to Eliminate Rank Reversal in the MCDA Problems. In Proceedings of the Lecture Notes in Computer Science (including subseries Lecture Notes in Artificial Intelligence and Lecture Notes in Bioinformatics); Springer: Berlin/Heidelberg, Germany, 2021; Volume 12742 LNCS, pp. 338–351. [Google Scholar]
  24. Faizi, S.; Sałabun, W.; Ullah, S.; Rashid, T.; Wieckowski, J. A New Method to Support Decision-Making in an Uncertain Environment Based on Normalized Interval-Valued Triangular Fuzzy Numbers and COMET Technique. Symmetry 2020, 12, 516. [Google Scholar] [CrossRef] [Green Version]
  25. Rehman, A.U.; Shekhovtsov, A.; Rehman, N.; Faizi, S.; Sałabun, W. On the Analytic Hierarchy Process Structure in Group Decision-Making Using Incomplete Fuzzy Information with Applications. Symmetry 2021, 13, 609. [Google Scholar] [CrossRef]
  26. Saaty, T.L. The Analytic Hierarchy Process. Education 1980, 1–11. [Google Scholar] [CrossRef]
  27. Eraslan, E. A Multi-Criteria Usability Assessment of Similar Types of Touch Screen Mobile Phones. J. Multi-Criteria Decis. Anal. 2013, 20, 185–195. [Google Scholar] [CrossRef]
  28. Balaji, K.; Kumar, V.S.S. Multicriteria Inventory ABC Classification in an Automobile Rubber Components Manufacturing Industry. Procedia CIRP 2014, 17, 463–468. [Google Scholar] [CrossRef] [Green Version]
  29. Vaidya, O.S.; Kumar, S. Analytic Hierarchy Process: An Overview of Applications. Eur. J. Oper. Res. 2006, 169, 1–29. [Google Scholar] [CrossRef]
  30. Kahraman, C.; Onar, S.C.; Oztaysi, B. Fuzzy Multicriteria Decision-Making: A Literature Review. Int. J. Comput. Intell. Syst. 2015, 8, 637–666. [Google Scholar] [CrossRef] [Green Version]
  31. Zadeh, L.A. Fuzzy Sets. Inf. Control. 1965, 8, 338–353. [Google Scholar] [CrossRef] [Green Version]
  32. Zadeh, L.A. The Concept of a Linguistic Variable and Its Application to Approximate Reasoning-I. Inf. Sci. 1975, 8, 199–249. [Google Scholar] [CrossRef]
  33. Atanassov, K.T. Intuitionistic Fuzzy Sets. Fuzzy Sets Syst. 1986, 20, 87–96. [Google Scholar] [CrossRef]
  34. Yager, R.R. On the Theory of Bags. Int. J. Gen. Syst. 1986, 13, 23–37. [Google Scholar] [CrossRef]
  35. Atanassov, K.T. More on Intuitionistic Fuzzy Sets. Fuzzy Sets Syst. 1989, 33, 37–45. [Google Scholar] [CrossRef]
  36. Smarandache, F. Neutrosophic Set—A Generalization of the Intuitionistic Fuzzy Set. In Proceedings of the 2006 IEEE International Conference on Granular Computing, Atlanta, GA, USA, 10–12 May 2006; pp. 38–42. [Google Scholar]
  37. Garibaldi, J.M.; Ozen, T. Uncertain Fuzzy Reasoning: A Case Study in Modelling Expert Decision Making. IEEE Trans. Fuzzy Syst. 2007, 15, 16–30. [Google Scholar] [CrossRef]
  38. Torra, V. Hesitant Fuzzy Sets. Int. J. Intell. Syst. 2010, 25, 529–539. [Google Scholar] [CrossRef]
  39. Yager, R.R. Pythagorean Membership Grades in Multicriteria Decision Making. IEEE Trans. Fuzzy Syst. 2014, 22, 958–965. [Google Scholar] [CrossRef]
  40. Yager, R.R. Generalized Orthopair Fuzzy Sets. IEEE Trans. Fuzzy Syst. 2017, 25, 1222–1230. [Google Scholar] [CrossRef]
  41. Gündoğdu, F.K.; Kahraman, C. Spherical Fuzzy Sets and Spherical Fuzzy TOPSIS Method. J. Intell. Fuzzy Syst. 2019, 36, 337–352. [Google Scholar] [CrossRef]
  42. Mendel, J.M.; Wu, H. Type-2 Fuzzistics for Symmetric Interval Type-2 Fuzzy Sets: Part 1, Forward Problems. IEEE Trans. Fuzzy Syst. 2006, 14, 781–792. [Google Scholar] [CrossRef]
  43. Rouyendegh, B.D.; Oztekin, A.; Ekong, J.; Dag, A. Measuring the Efficiency of Hospitals: A Fully-Ranking DEA–FAHP Approach. Ann. Oper. Res. 2019, 278, 361–378. [Google Scholar] [CrossRef]
  44. Ashraf, S.; Abdullah, S.; Mahmood, T.; Ghani, F.; Mahmood, T. Spherical Fuzzy Sets and Their Applications in Multi-Attribute Decision Making Problems. J. Intell. Fuzzy Syst. 2019, 36, 2829–2844. [Google Scholar] [CrossRef]
  45. Ayyildiz, E.; Taskin Gumus, A. A Novel Spherical Fuzzy AHP-Integrated Spherical WASPAS Methodology for Petrol Station Location Selection Problem: A Real Case Study for İstanbul. Environ. Sci. Pollut. Res. 2020, 27, 36109–36120. [Google Scholar] [CrossRef]
  46. Gündoğdu, F.K.; Kahraman, C. Spherical Fuzzy Analytic Hierarchy Process (AHP) and Its Application to Industrial Robot Selection. In Proceedings of the Advances in Intelligent Systems and Computing; Springer: Berlin/Heidelberg, Germany, 2020. [Google Scholar]
  47. Gündoğdu, F.K.; Kahraman, C. A Novel Spherical Fuzzy Analytic Hierarchy Process and Its Renewable Energy Application. Soft Comput. 2020, 24, 4607–4621. [Google Scholar] [CrossRef]
  48. Saaty, T.L. Decision Making with the Analytic Hierarchy Process. Int. J. Serv. Sci. 2008, 1, 83–98. [Google Scholar] [CrossRef] [Green Version]
  49. Yildizbasi, A.; Erdebilli, B.; Barış, Ö.Z.E.N.; Özdemir, Y.S. Evaluation of Augmented Reality Tools Performance in Digital Supply Chain Management: A Group Decision Making Method. Eur. J. Sci. Technol. 2021, 149–162. [Google Scholar] [CrossRef]
  50. Rodriguez, R.M.; Martinez, L.; Herrera, F. Hesitant Fuzzy Linguistic Term Sets for Decision Making. IEEE Trans. Fuzzy Syst. 2012, 20, 109–119. [Google Scholar] [CrossRef]
  51. Yıldızbaşı, A.; Ünlü, V. Performance Evaluation of SMEs towards Industry 4.0 Using Fuzzy Group Decision Making Methods. SN Appl. Sci. 2020, 2, 355. [Google Scholar] [CrossRef] [Green Version]
Figure 1. SF-AHP hieratical structure.
Axioms 11 00325 g001
Figure 2. SF-AHP—WSM flow chart.
Axioms 11 00325 g002
Table 1. SF-AHP preference scale for pairwise comparisons [47].
Linguistic Measurement μ , v , π Score Index (SI)
Absolutely More Important (AMI)(0.9, 0.1, 0.0)9
Very High Important (VHI)(0.8, 0.2, 0.1)7
High Important (HI)(0.7, 0.3, 0.2)5
Slightly More Important (SMI)(0.6, 0.4, 0.3)3
Equally Important (EI)(0.5, 0.4, 0.4)1
Slightly Low Important (SLI)(0.4, 0.6, 0.3)1/3
Low Important (LI)(0.3, 0.7, 0.2)1/5
Very Low Important (VLI)(0.2, 0.8, 0.1)1/7
Absolutely Low Important (ALI)(0.1, 0.9, 0.0)1/9
Table 2. RI values.
Table 2. RI values.
12345678910
0.000.000.580.901.121.241.321.411.451.49
Table 3. The hierarchical structure of the proposed model.
Main CriteriaSub CriteriaExplanation
C1—SoftwareC11—ERP SoftwareEfficiency of Enterprise Resource Planning (ERP) software implementation.
C12—Cyber SecurityTaking cybersecurity measures.
C13—Cloud ComputingCloud and cloud computing applications used in the operations.
C14—Software SolutionsUsing software solutions for specific requirements.
C2—ProductionC21—Process SimulationSimulation usage in the production processes.
C22—IoTIoT device usage in the production line.
C23—Autonomous RobotsAutonomous robot usage in the production line.
C24—Information ShareERP software package utilized to share information between different functional areas.
C3—External StakeholdersC31—Customer RelationsUsing software for Customer Relationship Management (CRM).
C32—Public RelationsUsing the internet or digital platforms for communication with public institutions.
C33—Digital Supply ChainSharing supply chain management information with software.
C34—Online OrdersReceive orders online.
Table 4. Linguistic pairwise comparison matrix.
Main CriteriaSoftwareProductionExternal Stakeholders
SoftwareEIEISMI
ProductionEIEISMI
External StakeholdersSLISLIEI
Table 5. Spherical fuzzy and defuzzified weights for main criteria.
Main Criteria μ v π Weight
Software0.53720.40000.36750.3638
Production0.51110.43090.36670.3442
External Stakeholders0.43720.52410.34130.2920
Table 6. Spherical fuzzy and defuzzified weights for sub-criteria of software.
Software μ v π Local Weight
ERP Software0.52840.40000.37560.2626
Cyber Security0.57150.39360.32540.2930
Cloud Computing0.48700.46810.35360.2422
Software Solutions0.40860.56350.31620.2022
Table 7. Spherical fuzzy and defuzzified weights for sub-criteria of production.
Production μ v π Local Weight
Process Simulation0.43620.50910.34560.2078
IoT0.66210.32240.25320.3409
Autonomous Robots0.52240.46010.31530.2582
Information Share0.40860.53840.34310.1930
Table 8. Spherical fuzzy and defuzzified weights for sub-criteria of external stakeholders.
External Stakeholders μ v π Local Weight
Customer Relations0.58770.37220.32690.2939
Public Relations0.54710.41200.32980.2713
Digital Supply Chain0.52840.41620.34980.2588
Online Orders0.36460.60860.27850.1760
Table 9. Global weights of sub-criteria and performance measurement of enterprises.
Sub CriteriaGlobal WeightSME1SME2SME3SME4SME5
ERP Software0.09550.82840.73290.89150.85990.7959
Cyber Security0.10660.81760.71100.95940.85280.9242
Cloud Computing0.08810.46970.61690.67590.55780.7341
Software Solutions0.07360.41710.56420.61280.51490.6620
Process Simulation0.07150.42910.59570.57210.54850.4055
IoT0.11730.86010.82140.93870.97740.9000
Autonomous Robots0.08890.56260.38480.82920.85940.3848
Information Share0.06640.46510.57600.57600.64240.4205
Customer Relations0.08580.68650.77230.54320.80060.5432
Public Relations0.07920.73930.66000.71310.29080.4754
Digital Supply Chain0.07560.55390.57960.62950.42850.6801
Online Orders0.05140.44550.42810.46250.37670.4111
Industry 4.0 Performance Score:7.27487.44298.40387.70997.3369
Publisher’s Note: MDPI stays neutral with regard to jurisdictional claims in published maps and institutional affiliations.

