Article

Measuring Profitable Efficiency, Technical Efficiency, Technological Innovation of Waste Management Companies Using Negative Super-SBM–Malmquist Model

1
Department of Industrial Engineering and Management, National Kaohsiung University of Science and Technology, Kaohsiung 807618, Taiwan
2
Department of Economics-Business Administration, Thanh Dong University, Tu Minh, Hai Duong 171960, Vietnam
3
Department of Supply Chain Management, National Kaohsiung University of Science and Technology, Kaohsiung 81157, Taiwan
*
Authors to whom correspondence should be addressed.
Axioms 2022, 11(7), 315; https://doi.org/10.3390/axioms11070315
Submission received: 2 June 2022 / Revised: 21 June 2022 / Accepted: 21 June 2022 / Published: 28 June 2022
(This article belongs to the Special Issue Communications in Industrial Statistics—Theory and Methods)

Abstract

:
In recent decades, waste generation has increased gradually because of the development of the quantity and size of businesses, together with the high growth rate of the population. However, in 2019, like other industries, the waste management industry was affected by the COVID-19 pandemic, particularly in relation to aspects concentrated on strategy. Subsequently, appropriate waste management in all aspects of the community, specifically for waste management enterprises, was demanded. This research aims to assess the profitable efficiency, position, technical, and technological innovation and compare the global major waste management corporations by integrating the negative super-slacks-based measure model and the negative Malmquist model in data envelopment analysis. Various inputs and outputs are initially selected from nine waste management companies’ financial statements from 2017 to 2020, including negative values, to attain their performance. The empirical results indicated that waste management companies’ managers could make better investment or strategy decisions for superior performance. At the same time, collaborators from other sectors could find their potential partners in the waste management industry. In general, considering the efficiency, Veolia Environment (DMU3) and Heritage-Crystal Clean Company (DMU8) were the most efficient companies. Meanwhile, Covanta Holding (DMU2) and Republic Services Corporation (DMU5) required additional development to improve their performance. Besides, because of the disparity in technical and technological innovation, most decision-making units could not achieve consistent improvement in terms of technical, technological change, and total production.

1. Introduction

On a global scale, as a result of rapid industrial development and an expanding population, the amount of waste being produced is increasing. Effective waste management plays an important role in maintaining sustainability at all levels of society. Waste management (WM) contains all the activities that involve managing waste from its formation to its final disposal [1]. The WM industry consists of industrial sectors regarding collection, delivery, treatment, dumping, recycling, and waste prevention to reduce the unfavorable impact of waste on human life, animals, the environment, and resources. Waste can be classified into three main types (solid, liquid, and gaseous), and each type will require different processing methods. Over the decades, traditional disposal methods, such as incineration, landfill, and dumping into the ocean, pose a threat to air, land, and water and fail to manage the rising load of waste. Nowadays, the global WM industry is experiencing a considerable change: new processing methods, such as physical reprocessing, biological reprocessing, and resource and energy recovery [2,3], are being invented continuously with cutting-edge technology. Besides, the level of coordination between WM operators, packagers, manufacturers, governments, and related parties for more efficient recycling programs is increasing significantly [4]. Hence, the revenue of WM businesses is mainly derived from the sale of recycling materials, recovered energy, and another part comes from public funds.
According to the World Bank data, more than 2 billion tons of solid waste were generated over the past six years (2016), and over 30 percent was not appropriately handled. Each person accounted for nearly 0.8 kg of waste per day. By 2050, the worldwide waste volume is forecasted to reach 3.40 billion tons [5]. As reported by the Waste Management Market Analysis and Industry Forecast [6], the global waste management market size was valued at USD 1612 billion in 2020, and it can reach USD 2483 billion by the next decade, experiencing a compound annual growth rate (CAGR) of 3.4% from 2021 to 2030. The projected waste generation by region from past to future is presented in Figure 1.
The expansion of the worldwide waste management market is led by the government waste regulations to reduce waste’s negative impacts and the development of industrialization and urbanization activities that generate a huge volume of waste. In addition, the global trend of environmental friendliness encourages an advanced waste management structure and also creates a great chance for market growth. All the solutions, from applying computer technology to waste management processes (such as classifying waste robots, GPS integrated compactors, etc.), decomposing organic material to produce fertilizer, converting waste to energy (WTE), developing new plastic materials, and changing packaging into recyclable forms [7], are outstanding examples of global efforts. However, effective waste management is a major challenge when the operating cost is relatively high, often accounting for from one-fifth to half of the municipal budgets [8]. Moreover, due to the COVID-19 pandemic, the demands for processing industrial and commercial waste were reduced while their businesses were mostly suspended, directly affecting material resources for recycling activities. In contrast, urban waste from civilians and waste from the consumption of pharmaceutical products and vaccination campaigns increased, requiring the waste management operations to work at total capacity for waste treatment, disposal, and recycling.
The current situation of the waste management industry can be a golden opportunity and can also be a major challenge for waste management companies. To sustain a profitable business in this market, they may have to change their strategies to catch up with the global trend by cooperating with governments and partners, modernizing materials, technology, and technical features to optimize the operational process, and providing competitive services for customers. Financial reports have been demonstrated to be a leading component in the stage of making strategic decisions for enterprises [9]; from the analysis of changing economic variables, companies can decide whether they should realign or invest their funds and resources. To define the waste management enterprises’ position in an attempt to improve their efficiency and sustainability, it is crucial to assess their techno-economic performance [10] before and during the COVID-19 pandemic.
Based on all the facts stated above, this paper aims to evaluate the comparative performance of nine significant players in the world in the waste management industry, specifically including the non-positive data from the financial statement from 2017 to 2020. While most investigators collect positive data and might ignore the negativity, this research is conducting objective measurement through valuable tools and narrowing the knowledge gap from earlier studies in the same field. This study also addresses the application of DEA in demonstrating the importance of this method in the assessment of the waste management industry regarding global sustainability. The negative super-SBM and negative Malmquist models in data envelopment analysis (DEA) software are combined to measure the profitable efficiency, ranking, and technical and technological innovation of each decision-making unit (DMU). A decision-making unit (DMU) is the element that will be compared. The DMUs can be peers, such as schools, manufacturing companies, hospitals, countries, states, and cities, to name a few. The research results will directly support the waste management firms and indirectly assist potential investors and coordinators who seek alliances in this industry. Besides, this analysis provides practical evidence for the benefits of the negative super-SBM and negative Malmquist models in the DEA method, which can interpret efficiency and contribute valuable suggestions to improve the performance of each DMU.
This paper is divided into four sections. The first section provides a brief overview of the research, including the global waste management situation, motivation, and the aim of the study. The second section presents theoretical foundations and methodology, which include a literature review, the research process, negative super-SBM model, and negative Malmquist model. The assessed results are analyzed and discussed in the next section. The final section concludes the paper with limitations and recommendations for future research.

2. Theoretical Foundations and Methodology

2.1. Literature Review

Nowadays, waste management is not only a particular country issue but also a global issue. This field is gaining more attention, mainly due to developed countries’ regulations. One of the reasons behind this is the depletion of recoverable resources in linear resource flow systems, leading to a decline in natural resources and environmental degradation [11]. In 2008, the European Commission promulgated a legislative framework called Waste Framework Directive 2008/98/EC (WFD2008) to suggest a way to deal with this issue [12]. The Environmental Protection Agency (EPA) of the United States governs all solid and hazardous wastes across the country under the 1976 Resource Conservation and Recovery Act (RCRA) [13]. It requires a cooperative effort from federal, state, regional, native authorities, and waste enterprises to have effective waste management systems. Thus, to adapt to government regulations and remain profitable, waste management companies have to try to catch up with new techniques and technologies to meet customers’ and partners’ changing needs and expectations and minimize expenses. Khumbo Kalulu and Zvikomborero Hoko identified financial sustainability as an essential factor for waste management companies to ensure their service can satisfy market demands with environmental protection practices [14], and its analysis also involved a more comprehensive assessment framework of WM firms’ performance. In 2018, Francesca Bartolacci and co-workers determined and estimated the components that affect waste management revenue and cost. Separate waste collection has been demonstrated to have a positive impact on WM companies’ financial performance. In contrast, municipalities’ territorial extension negatively influences profitability [15].
In 1978, Data Envelopment Analysis (DEA) was first presented as a nonparametric method supporting the decision-making process for the assessment of production frontiers, which are described as decision-making units (DMUs) by Charnes, Cooper, and Rhodes [16]. A DMU can be an organization, company, etc., that can acquire multiple inputs and convert them to various outputs. The results collected from DEA are relative indicators that can help researchers evaluate the productivity, ranking, and technical and technological changes of DMUs over a period of time. For many years, various models in DEA were designed and developed as beneficial tools for performance evaluation and were widely applied by researchers in multiple fields around the world [17]. CCR (Charnes, Cooper, and Rhodes) was the first model to measure the overall inefficiency, followed by the variable returns-to-scale BBC (Banker, Charnes, and Cooper) model [18], which helps shorten the limitations of the constant returns to scale of the CCR model and identify the difference between technical and scale efficiency. In 2001, Tone [19] introduced the slacks-based measure (SBM) model with regard to a nonradial aspect that considers the proportion changing among inputs/outputs and deals with the slack gap directly. Nevertheless, the SBM model only uses a benchmark score of “1” to present the effectiveness of DMUs. Due to this limitation, after one year, Tone developed a model called super-SBM with unlimited scores to assess the DMU’s performance and ranking [20]. The undesirable data in the process of production are unavoidable. The negative super-SBM model was designed later for DMUs with negative inputs or outputs [21]. It provides an advanced comparison and suggestion for both inefficient and efficient DMUs by scores, rankings, and slack indicators. Many researchers from various fields have always seen these models as valuable measurement tools for their studies. Lee, Y.J., et al. applied a negative super-SBM model to compare the performance of 18 Korean commercial banks with the presence of negative data [22]. Nguyen, X.H. and her co-worker utilized the negative super-SBM model in DEA to determine the efficiency of securities firms in Vietnam [23]. Cui, Q. and Jin, J.Y. demonstrated the benefit of a modified slacks-based measure model in airline environmental efficiency estimation [24]. Another well-known model in DEA that has been widely addressed due to its practical characteristics is the Malmquist model. As stated by Färe, the Malmquist model has two elements, one of which is used for efficiency change assessment and the other for technological change assessment [25]. Similar to the negative super-SBM model, the negative Malmquist model was developed for non-positive data values. Many attempts have been made [26,27,28] based on the principle of the approach. It is undeniable that the Malmquist model is a helpful tool for conducting the productivity changes without limitations of geography, industries, public, or private organizations in various aspects by its specific measurement, which considers technical and technological changes and total factor productivity [29]. In an effort to examine the profitable efficiency and productivity changes of nine waste management companies that contain negative data, this research will apply two DEA models, which are the negative super-SBM and the negative Malmquist model. The main benefit of using DEA is that no prior assumptions about the underlying functional relationship between inputs and outputs are required. DEA can also be used in systems with a variety of input or output variables of various units. In a typical DEA application, efficiency scores are first computed to produce a general efficiency ranking from which inefficient firms can be identified. Through slack analysis, DEA can investigate ways in which inefficient firms can improve to become more efficient.

2.2. Method of Research

2.2.1. Research Process

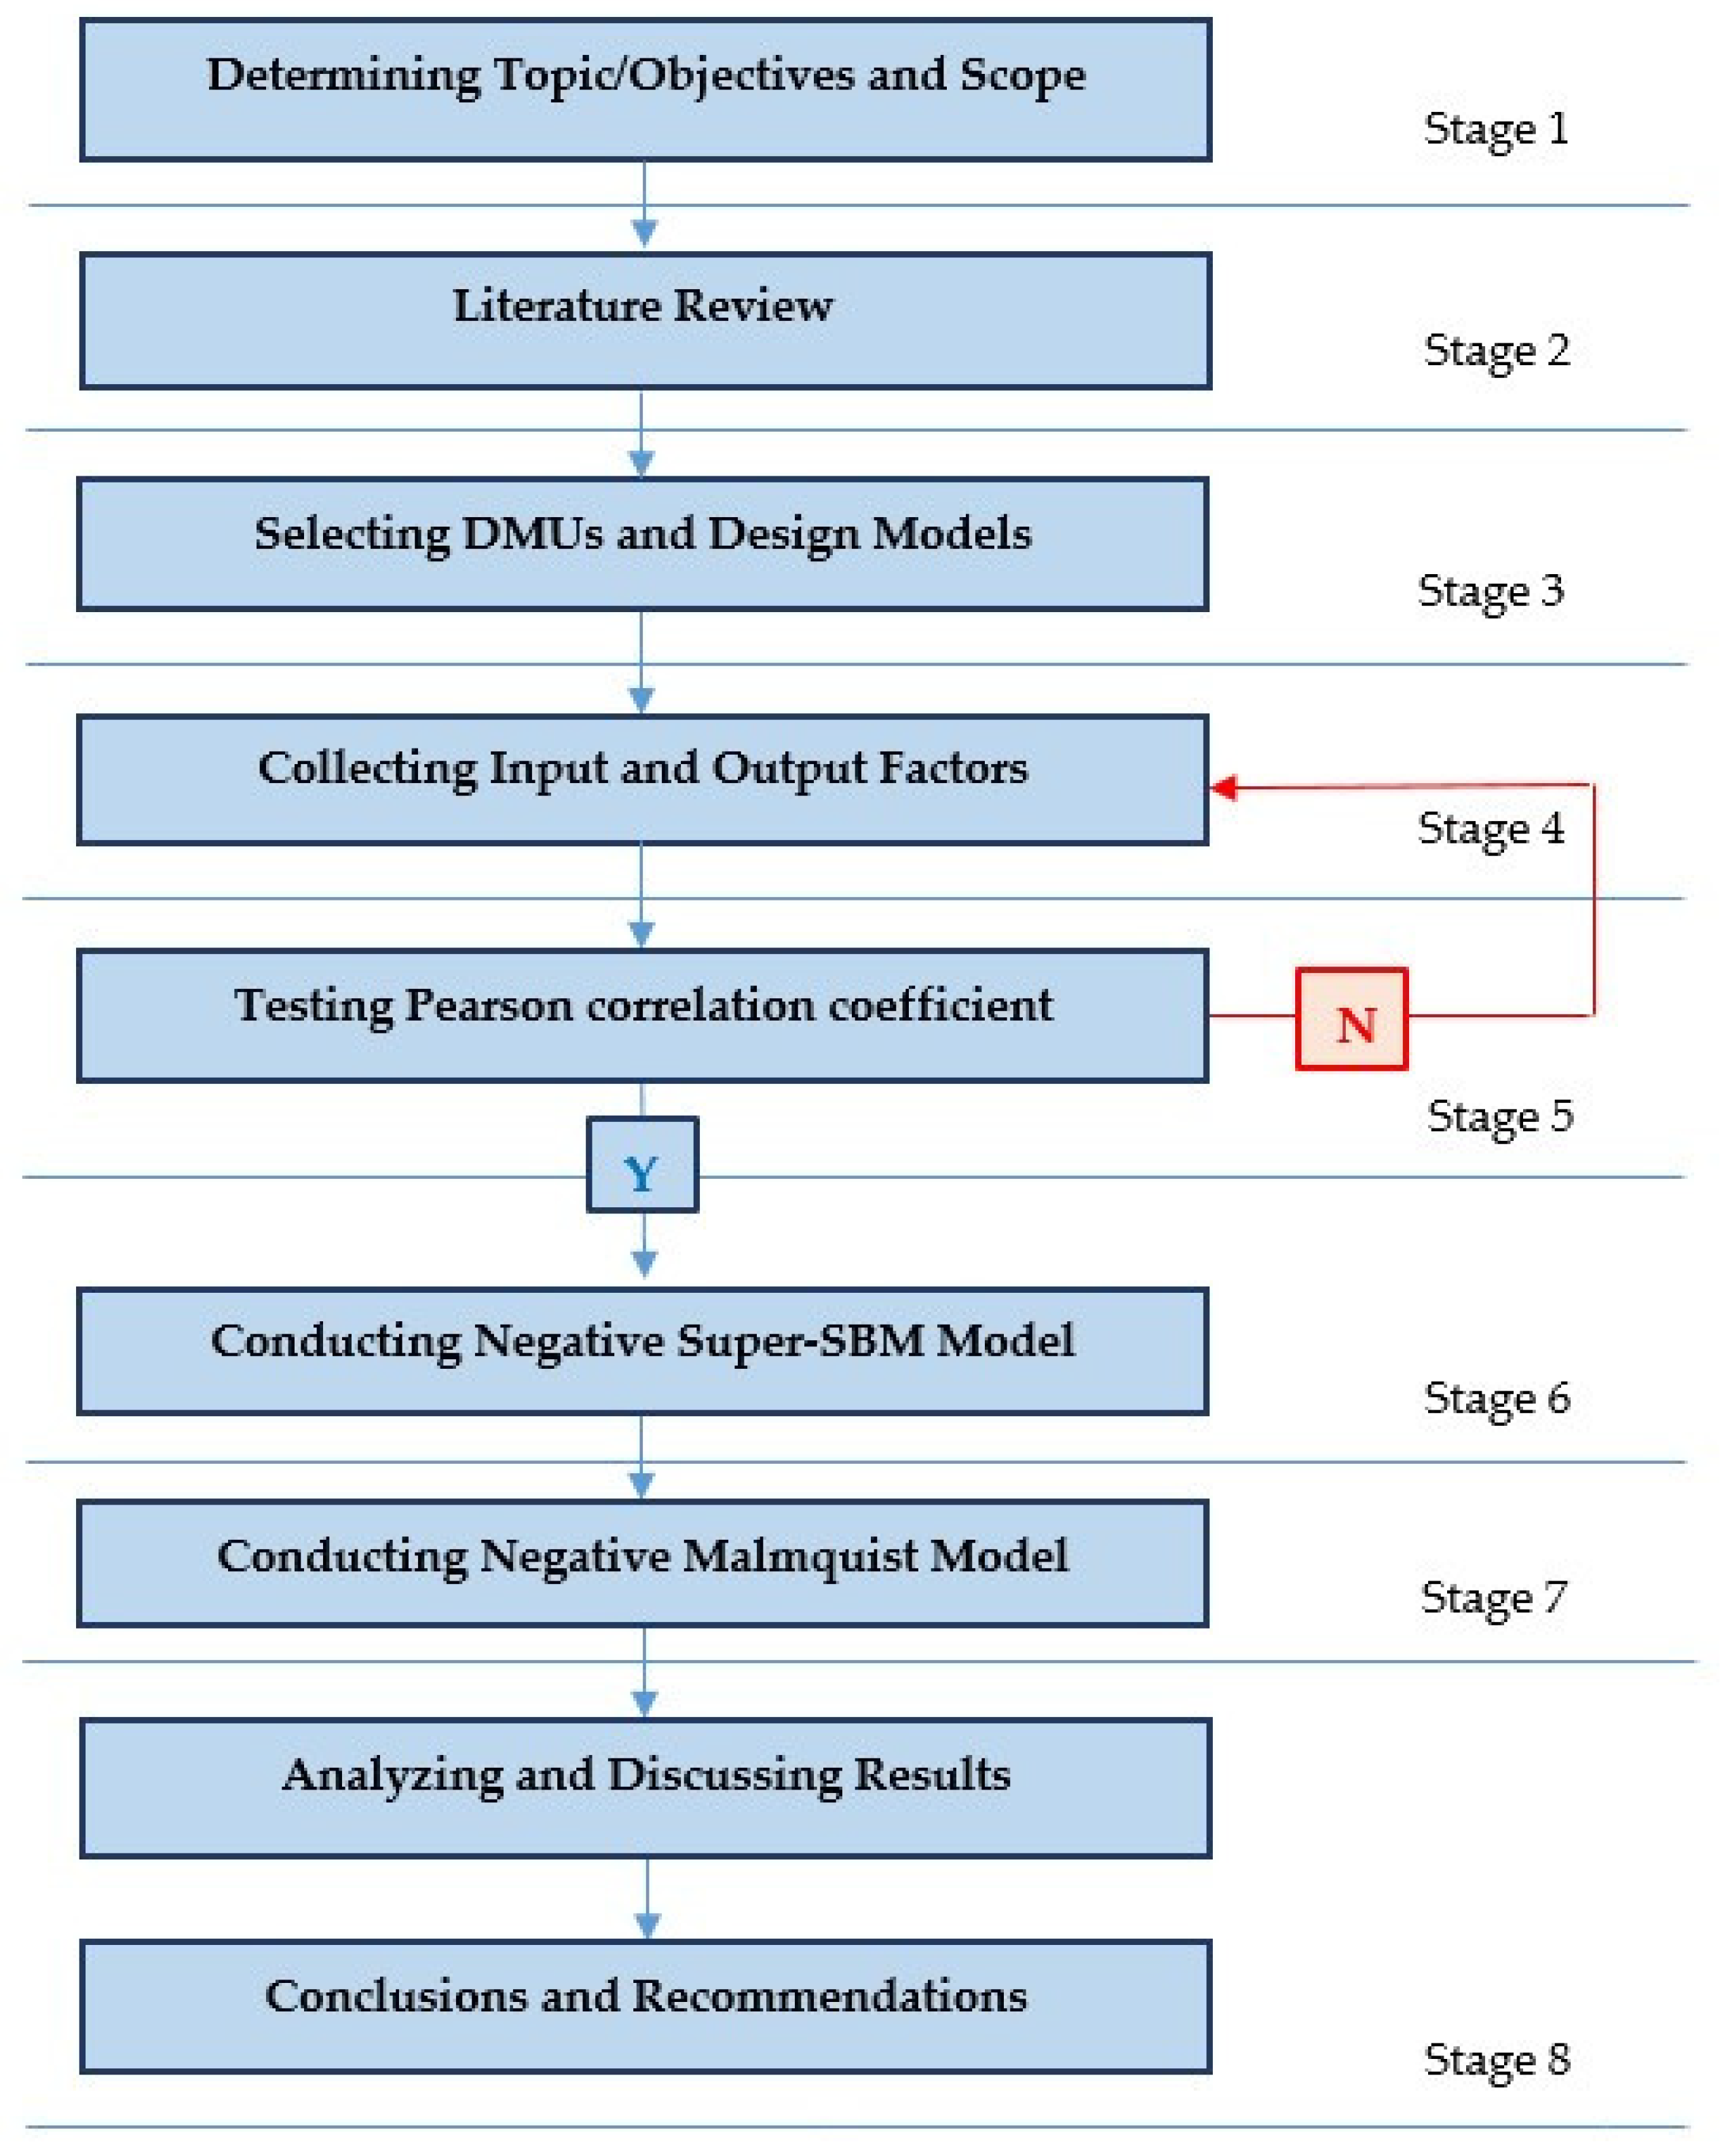
This study integrated the negative super-SBM and the negative Malmquist models to assess the profitable efficiency, technical and technological innovation, and productivity of nine waste management companies through their financial statements. The final empirical results reflect the efficiency and inefficiency of nine waste management manufacturers each year during the period of 2017 to 2020. Figure 2 exhibits eight stages of the research process.
Stage 1: Based on the background information of the waste management industry and the importance of evaluating the waste management firms’ efficiency, research objectives and scope are defined.
Stage 2: From previous studies relating to the topic, the authors reviewed, found fundamental research, and constructed the methodology.
Stage 3: Nine waste management manufacturers were selected from Yahoo Finance [30] as research objects. Hence, the negative super-SBM and negative Malmquist models were utilized to assess DMUs’ efficiency.
Stage 4: Input and output factors were chosen to apply into models. Then, these variables would be tested for their correspondence level. If they were not suitable, they would be substituted by other factors.
Stage 5: The Pearson correlation coefficient indicator would examine the correlation between the input and output variables to check whether they were appropriate or not. The positive correlation is needed.
Stage 6: The research conducted the negative super-SBM model in DEA to evaluate the profitable efficiency of the decision-making unit (DMU) through efficient/inefficient scores, ranks, and slack indexes from 2017 to 2020.
Stage 7: The negative Malmquist model will measure and compare waste management companies’ technical, technological innovation, and productivity change for a four-year span (2017–2020).
Stage 8: The authors analyzed and discussed the empirical results of all DMUs over the experiment period and provided suggestions for unfortunate firms to improve their performance.

2.2.2. Data Source

This study aims to evaluate the performance of nine waste management companies that were listed in the top 50 global waste management manufacturers in 2019 [31] based on their recorded financial statements in Yahoo Finance [30] from 2017 to 2020. Among nine waste management manufactures, seven companies are from America, one from France, and one from Canada, as shown in Table 1 below.
Choosing appropriate and corresponding input and output variables is vital in conducting DEA models. Based on the negative super-SBM and negative Malmquist concepts, the number of DMUs is at least twice the total number of inputs and outputs. This paper considered three inputs (total assets, cost of revenue, operating expenses), two outputs (total revenue, net income), and nine DMUs. Several relevant research studies in the past decade were reviewed to assist in selecting relevant variables for the study. In 2013, to evaluate the sustainability of the main waste management methods in Thailand, Menikpura et al. considered operational and maintenance costs as an element regarding the economic indicator [32]. Besides, to define whether a private waste management service company in Bahir Dar, Ethiopia could create revenue outweighing the cost of its activities, Christian Riuji Lohri and co-workers chose total expenses, revenues, and net income variables to estimate the company financial status [33]. In a significant advance in 2018, Francesca Bartolacci et al. experimented with a group of companies providing municipal solid waste management services for 880 Italian municipalities to determine the influential factors on waste management financial sustainability. It has been suggested that total assets, production cost, revenue, and net profit were reliable factors to identify these companies’ size and financial condition [15].
According to previous research and the aim of this study, the authors selected input factors from financial statements that may require DMUs to balance/reduce the value of these indicators; conversely, output factors may need DMUs to increase the value of the indicators in order to obtain efficiency status. Hence, the researchers determined to choose input and output indicators as stated below:
Input variables:
Total assets (TA) presented the total amount of assets that are owned by an individual, group, or organization.
Cost of revenue (COR) identified the total of all costs related to manufacturing and distributing goods or services of a company to its customers.
Operating expenses (OE) or operating expenditures were the costs that an operation must spend to accomplish its operational activities.
Output variables:
Total revenue (TR) defined the total income that a business generated from all the sales of its commodities or services to buyers.
Net income (NI) or net profit referred to the amount of money that an entity has left over after subtracting all costs and expenses.

2.3. Mathematical Modeling

2.3.1. Negative Super-SBM Model

DEA is a helpful analytical appliance for assessing the performance of DMUs, which is widely addressed in many fields all over the world. Over time, it can be classified into four main groups: radial, nonradial and Oriented, nonradial and nonoriented, and radial and nonradial [34]. While the radial model focuses on the proportion change in input/output and ignores the presence of slacks, the nonradial faces directly with the slacks (input excesses and output shortfalls remaining). The main target of the measurement in an oriented category is either input deduction or output extension, whereas nonoriented faces with both input minimizing and output enlargement at the same time.
In this research, the negative data super-SBM-O-V (nonradial, output-oriented slack-based measure of super-efficiency) model is applied to deal with non-positive inputs/outputs values and evaluate the profitable efficiency of waste management enterprises.
The efficiency of a DMU is identified by the given ratio between inputs and outputs. Let the input be x, output be y, and the efficiency score of DMU be θ = (x,y). Let the set of DMUs be J = (1, 2,…n) with m inputs and s outputs. In the negative super-SBM model, if input/output at time t have negative value, their minimum value will be set as 0. For each input I, the minimum value of x i min   ( i = 1 , , n ) is defined as follows [32,34]:
Let δ i = min { x i 1 , x i 2 , K , x i n } ( i = 1 , K , m )
I f δ i > 0 , t h e n x i min = 0 I f δ i = 0 , t h e n x i min = 0.1 I f δ i < 0 , t h e n x i min = δ i × 1.1
Similarly, the minimum value of output i is identified as:
Let ω i = min { y i 1 , y i 2 , , K , y i n } ( i = 1 , K , s )
I f ω i > 0 , t h e n y i min = ω 1 × 1.1 I f ω i = 0 , t h e n y i min = 0.1 f ω i < 0 , t h e n y i min = ω 1 × 1.1
For the dataset, x i min ( i = 1 , K , m ) and y i min ( i = 1 , K , s ) . In the negative super-SBM output-oriented model, we solve the following equation for efficient DMUs, where the weight to input and output w 1 = 0 , w 0 = 1 corresponds to the output-oriented model:
θ 0 = min 1 + w 1 m i = 1 m s i o x i o x i min 1 w o s i = 1 s s i o + y i o y i m
Subject to
j = 1 , j 0 n x i j λ j + s i o = x i o j = 1 , j 0 n y i j λ j + s i o + = y i o j = 1 , j 0 n λ j = 1 , λ j 0 s i o 0 ( i = 1 , K , m ) , s i o + 0 ( i = 1 , K , s )
where:
λ: the intensity vector.
s and s + : input slack and output slack, respectively.
The efficient score of each unit can be ranged from 0 to ∞. The lower the score, the less efficient the entity is and vice versa.

2.3.2. Negative Malmquist Model

The Malmquist index (MI) [35] assesses the change in the efficiency of a DMU over two time periods. It is calculated as the product of catch-up (CU) and frontier-shift (FS) terms. While the CU term reflects the degree of effort that the DMU has made to improve its productivity, the FS term is related to the change in technology of DMU between the two-time spans 1 and 2.
We denote D M U i in the time span 1 by ( x i 1 ,   y i 1 ) and the time span 2 by ( x i 2 ,   y i 2 ) . The efficiency score of D M U i   ( x i 1 ,   y i 1 ) t 1 is defined by the frontier technology t2:
δ t 2 ( ( x i , y i ) t 1 )   ( t 1 = 1 , 2   a n d   t 2 = 1 , 2 )
Similar to negative super-SBM model, in negative Malmquist model, x i min and y i min   are defined as [34]:
Let   x i min = Min { x i 1 1 , x i 2 1 , K , x i 1 T , K , x i n T } ( i = 1 , K , m ) If   x i min 0 ,   then x i min = 0 If   x i min < 0 ,   then   x i min x i min × 1.1 Let   y i min = Min { y i 1 1 , y i 2 1 , K , y i 1 T , K , y i n T } ( i = 1 , K , s ) If   y i min 0 ,   then y i min = 0 If   y i min < 0 ,   then   y i min y i min × 1.1
The catch-up (CU) effect can be expressed by the following formula:
CU ( γ ) = δ 2 ( ( x i , y i ) 2 ) δ 1 ( ( x i , y i ) 1 )
If CU > 1, it implies a progress in technical efficiency, while CU = 1 and CU < 1 imply the status quo and regress in the relative efficiency among period 1 and 2, respectively.
The frontier-shift (FS) effect is measured by:
FS ( ϕ ) = [ δ 1 ( ( x i , y i ) 1 ) δ 2 ( ( x i , y i ) 1 ) × δ 1 ( ( x i , y i ) 2 ) δ 2 ( ( x i , y i ) 2 ) ] 1 2
The Malmquist index (MI) is given as:
MI ( μ ) = CU × FS = [ δ 1 ( ( x i , y i ) 2 ) δ 1 ( ( x i , y i ) 1 ) × δ 2 ( ( x i , y i ) 2 ) δ 2 ( ( x i , y i ) 1 ) ] 1 2
As can be seen from the above equation, the MI is defined as the output of CU and FS. It also presents the total factor productivity (TFP) advancement of a DMU in technical and technological change efficiency between two spans of time. If μ > 1, this denotes progress in the TFP; meanwhile, μ ≥ 1 denotes the status quo and regress in the TFP of a DMU from period 1 to period 2, respectively.
To examine the tendency in the development rate relatively, cumulative indicators, such as cumulative catch-up (CCU), cumulative frontier-shift (CFS), and cumulative Malmquist index (CMI), are beneficial. These indicators illustrate the progress of all DMUs from the first span, for which the values are standardized to one. The MI is determined on a two-interval base; however, the value of CMI in period 1 (t = 1) is equal to one, when both the CU and the FS are in the status quo ( γ 1 t = 1 and ϕ 1 t = 1 ). Accordingly, the productivity change in each DMU from the first period over numerous periods ( 1 t ) can be captured and compared.
The CMI is described by:
μ ˜ 1 t = μ ˜ 1 2 × μ ˜ 2 t
Hence, the productivity change from period 1 to period t is adjusted by the point at 2, …, t. The CMI can be transformed into a CFS and the equation of the efficiency scores from period 1 to period t:
μ ˜ 1 t = ϕ ˜ 1 t · θ t θ 1
where ϕ ˜ 1 t indicates the CFS between the base period and period t.
Although the CMI obtains the productivity change from the base period (t = 1) and the CMI primary scores of all DMUs are set as one, the biases in the efficiency status at the base span of each DMU are ignored. To solve this gap, the adjusted Malmquist index (AMI) is developed as the output of CMI and the efficiency score at the first span and defined as:
ξ ˜ 1 t = μ ˜ 1 t · θ 1
It can be decomposed into the result of incorporating the CFS and the efficiency score in span t:
ξ ˜ 1 t = ϕ ˜ 1 t · θ 1
The AMI is a useful practical evaluation that can capture not only the corresponding efficiency of the DMUs at the base period but also the productivity change between the base period and period t [32]. Unfortunate DMUs, which have poor efficiency scores even when they gain a considerable productivity change, can be assessed.

3. Empirical Results

3.1. Pearson Correlation Coefficient

In this part, the negative super-SBM model in DEA is conducted to assess the efficiency of all the DMUs from 2017 to 2020. Table A1 presents the input and output data of all the companies. All the input values and output from “Total Revenues” are positive. We set 0 as their minimum value. However, there are some negative indexes from the output “Net Income”. We determine their minimum value (based point) × 1.1 at the corresponding cell, e.g., −269,170 of DMU7 in 2018; −381,480 in 2019; and −428,295 of DMU9 in 2020 [34]. The Solver software determines the minimum scores (based point) and translates them into non-negative indicators.
In DEA, Pearson’s correlation coefficient plays an essential role in clarifying the isotonic relationship between input and output variables. The values of these indices would be ranged from −1 to +1, representing the linear dependence of two variables or sets of data, where +1 is total positive linear correlation (when one variable increases in value, the other variable will also increase), 0 is no linear correlation (there is no association between the two variables), and −1 is total negative linear correlation (when one variable increases in value, the other variable will have a decrease in value). The Pearson correlation coefficient index results of all DMUs over four years are greater than 0, confirming the appropriateness of this study’s selected input and output data.

3.2. Profitable Efficiency

Table 2 provides the efficiency score and rank of each DMU from 2017 to 2020. In the super-SBM model, when the score is lower than 1, the DMU is inefficient; conversely, the DMU is efficient when the score is equal to or higher than 1. The result reveals that DMU2 (score: 0.36113) and DMU5 (score: 0.97365) were inefficient in 2017. In 2018 and 2019, DMU2, DMU5, and DMU7 were incompetent when they did not obtain the standard level. The following year, 2020, DMU2 and DMU9 took the last positions with 0.79914 and 0.14378, respectively, even though the DMU2 scores were increasing through the years. Although DMU5 had inappropriate scores over the first three years, in the last year, the score had improved to 1.01468 and became one of the efficient DMUs. The remaining DMUs achieved efficiency when their scores were greater than 1. Most DMUs’ rankings changed less in each term. DMU1, DMU2, DMU3, DMU4, DMU5, and DMU8 have remained in the same position for the last three years (2018–2020). DMU8 and DMU3 were the most efficient units over time, followed by DMU4 and DMU1.
Table A2 details the slack indices of the inefficient DMUs. Slack in the negative data super-SBM model is the slacks to the efficient frontiers excluding itself [34]; it constitutes the possible enhancements for inefficient DMUs compared with the reference set of efficient DMUs by cutting down input excess or intensifying output shortage.

3.3. Technical and Technological Innovation

In this part, the negative data Malmquist model is applied to evaluate the technical efficiency and technological change, total productivity change, and adjusted and cumulative Malmquist indexes for all DMUs.

3.3.1. Technical Efficiency Change (Catch-Up Index)

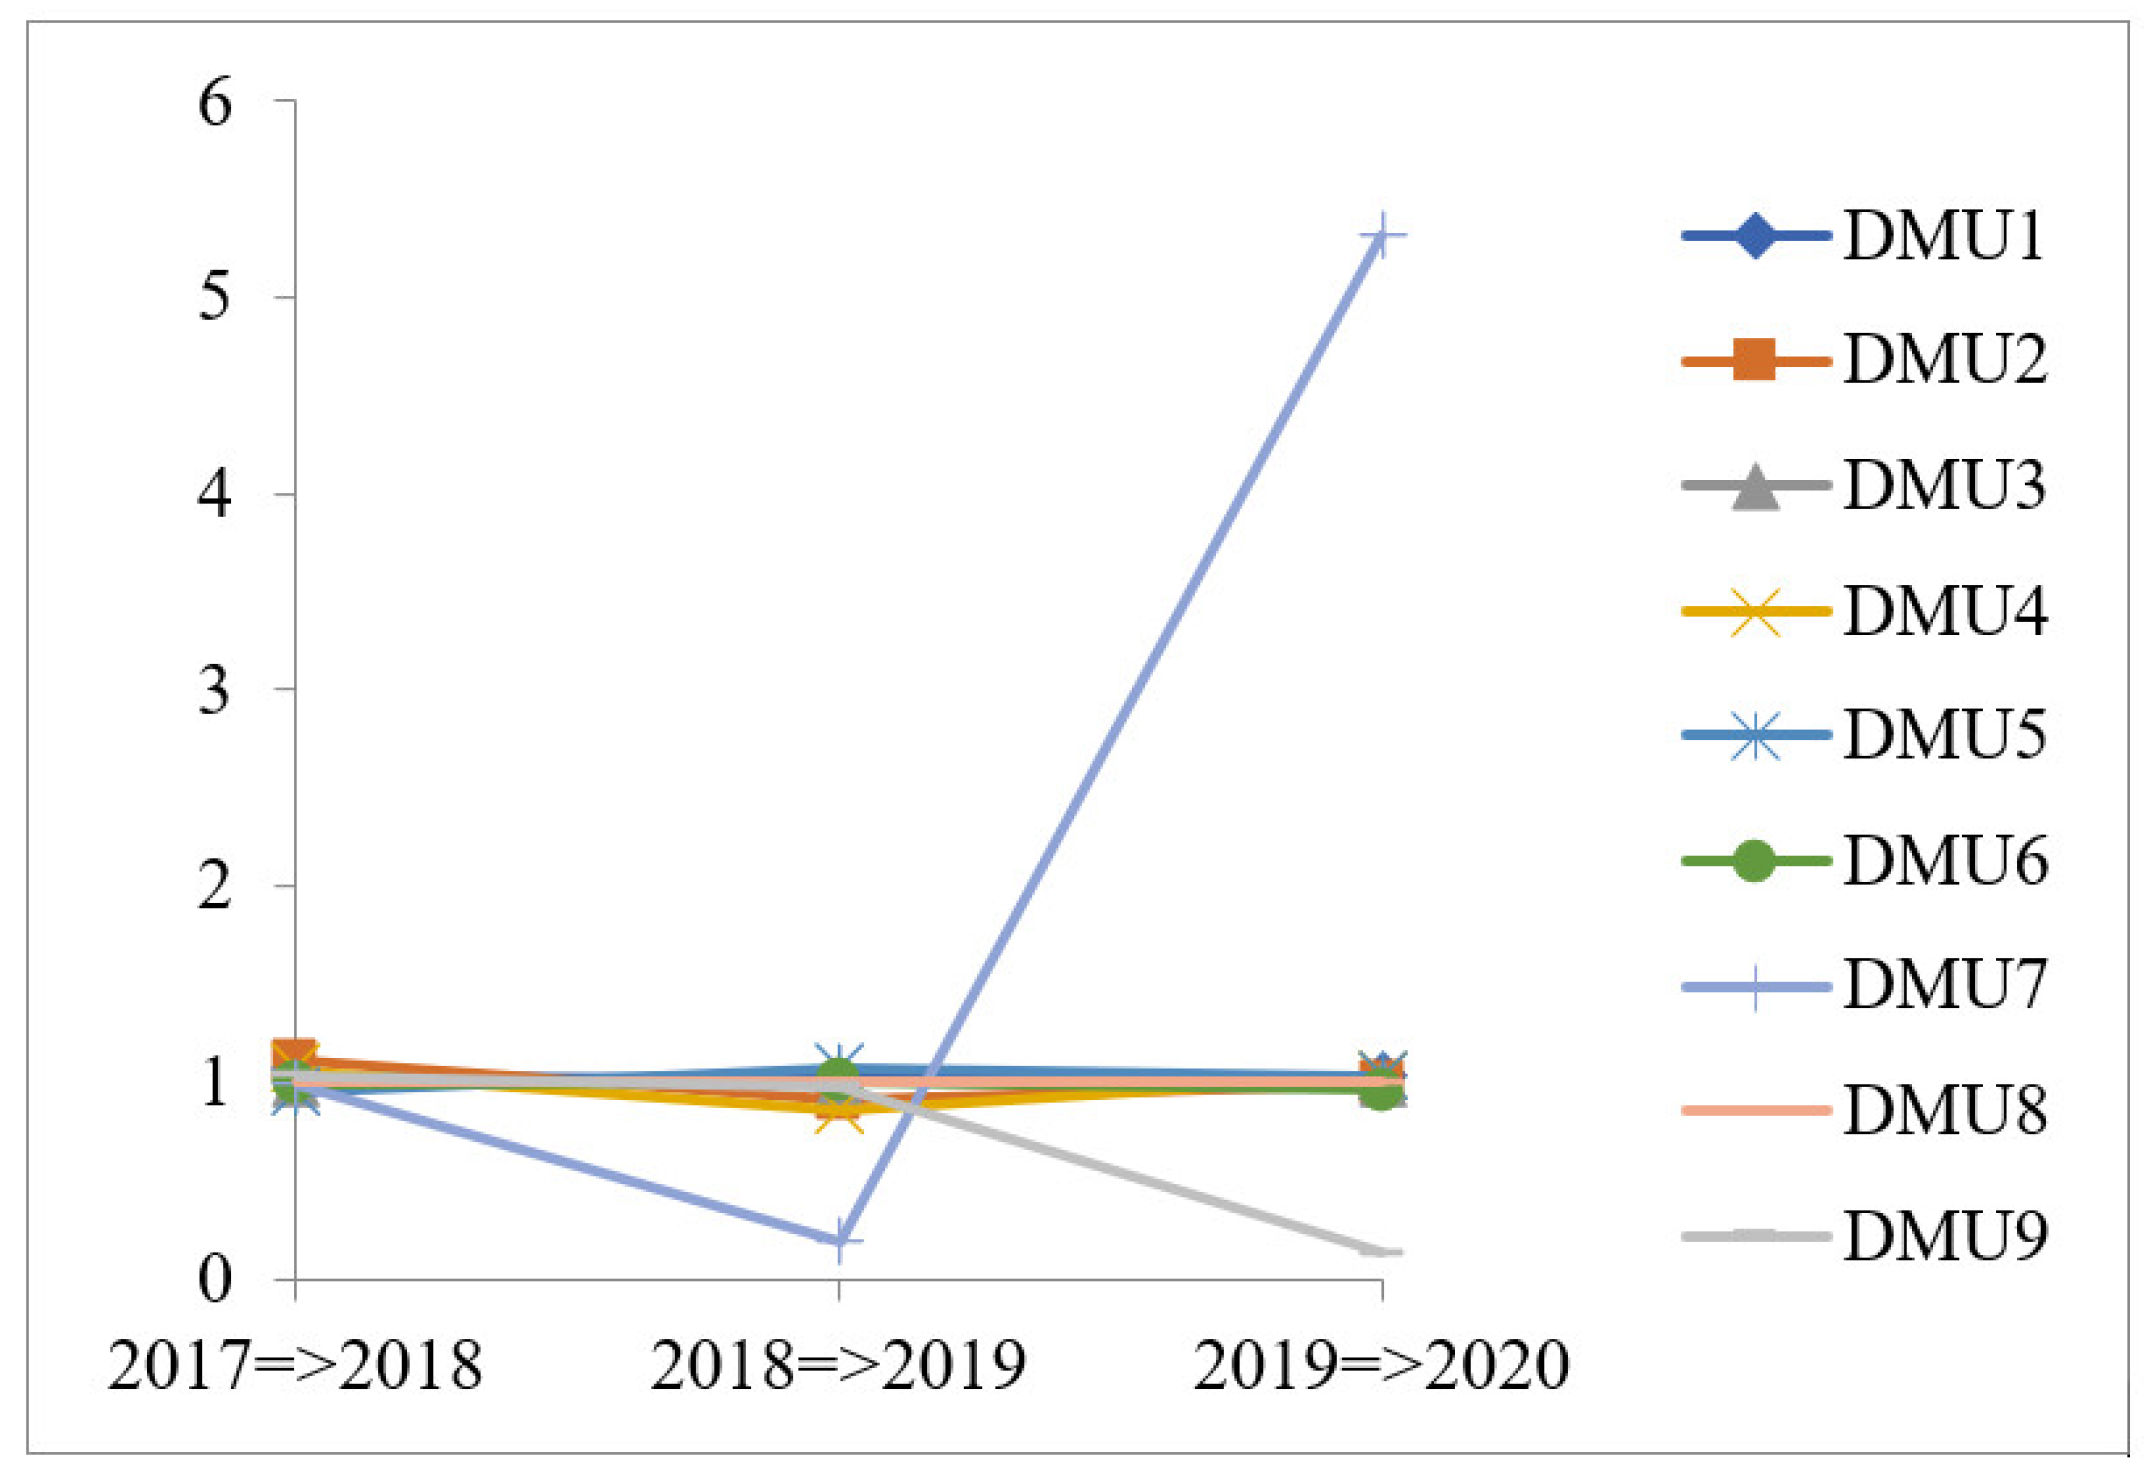
The catch-up (CU) term describes how much effort a DMU has made to improve its efficiency. Table 3 and Figure 3 exhibit the technical efficiency changes of the DMUs through the research spans. According to the Malmquist model, if CU (γ) > 1, it implies progress in efficiency between two periods; in contrast, (γ) ≤ 1 manifests decay in relative efficiency.
With the average scores > 1, DMU1,2,3,5,7 gained technical performance development between 2017 and 2020. Among these, DMU1 was the most stable in technical efficiency while its scores were > 1 over the three periods, and DMU2 and 3 achieved scores greater than 1 from the beginning but regressed in the following period. Conversely, DMU5 and 7 scores revealed an improvement in the last span compared with the first span. It should be noted that DMU7 obtained an impressive advancement in technical efficiency when its score jumped to the highest point (5.311656) in the last period (2019–2020), even though, in the second period (2018–2019), it had the lowest score (0.190107). In comparison, other DMUs were recognized as inefficient operators in technical change when their average CU index scores were ≤ 1. With the average score of 0.981351, DMU4 experienced a fluctuation; it achieved technical efficiency in the first and last period, when the second period’s value was lower than 1 (0.859401). DMU6 did not reach progressive technical efficiency overall when it only attained that in the span 2018–2019. Besides, DMU8 showed insignificant changes while its score remained the same as 1 over the three spans. Meanwhile, DMU9 miscarried to sustain its technical efficiency in the first period (2017–2018) and suffered a tough recession in the next two periods, particularly in the last span, when it became the last company regarding efficiency change with a CU value of 0.139162.

3.3.2. Frontier-Shift Index (Technological Change)

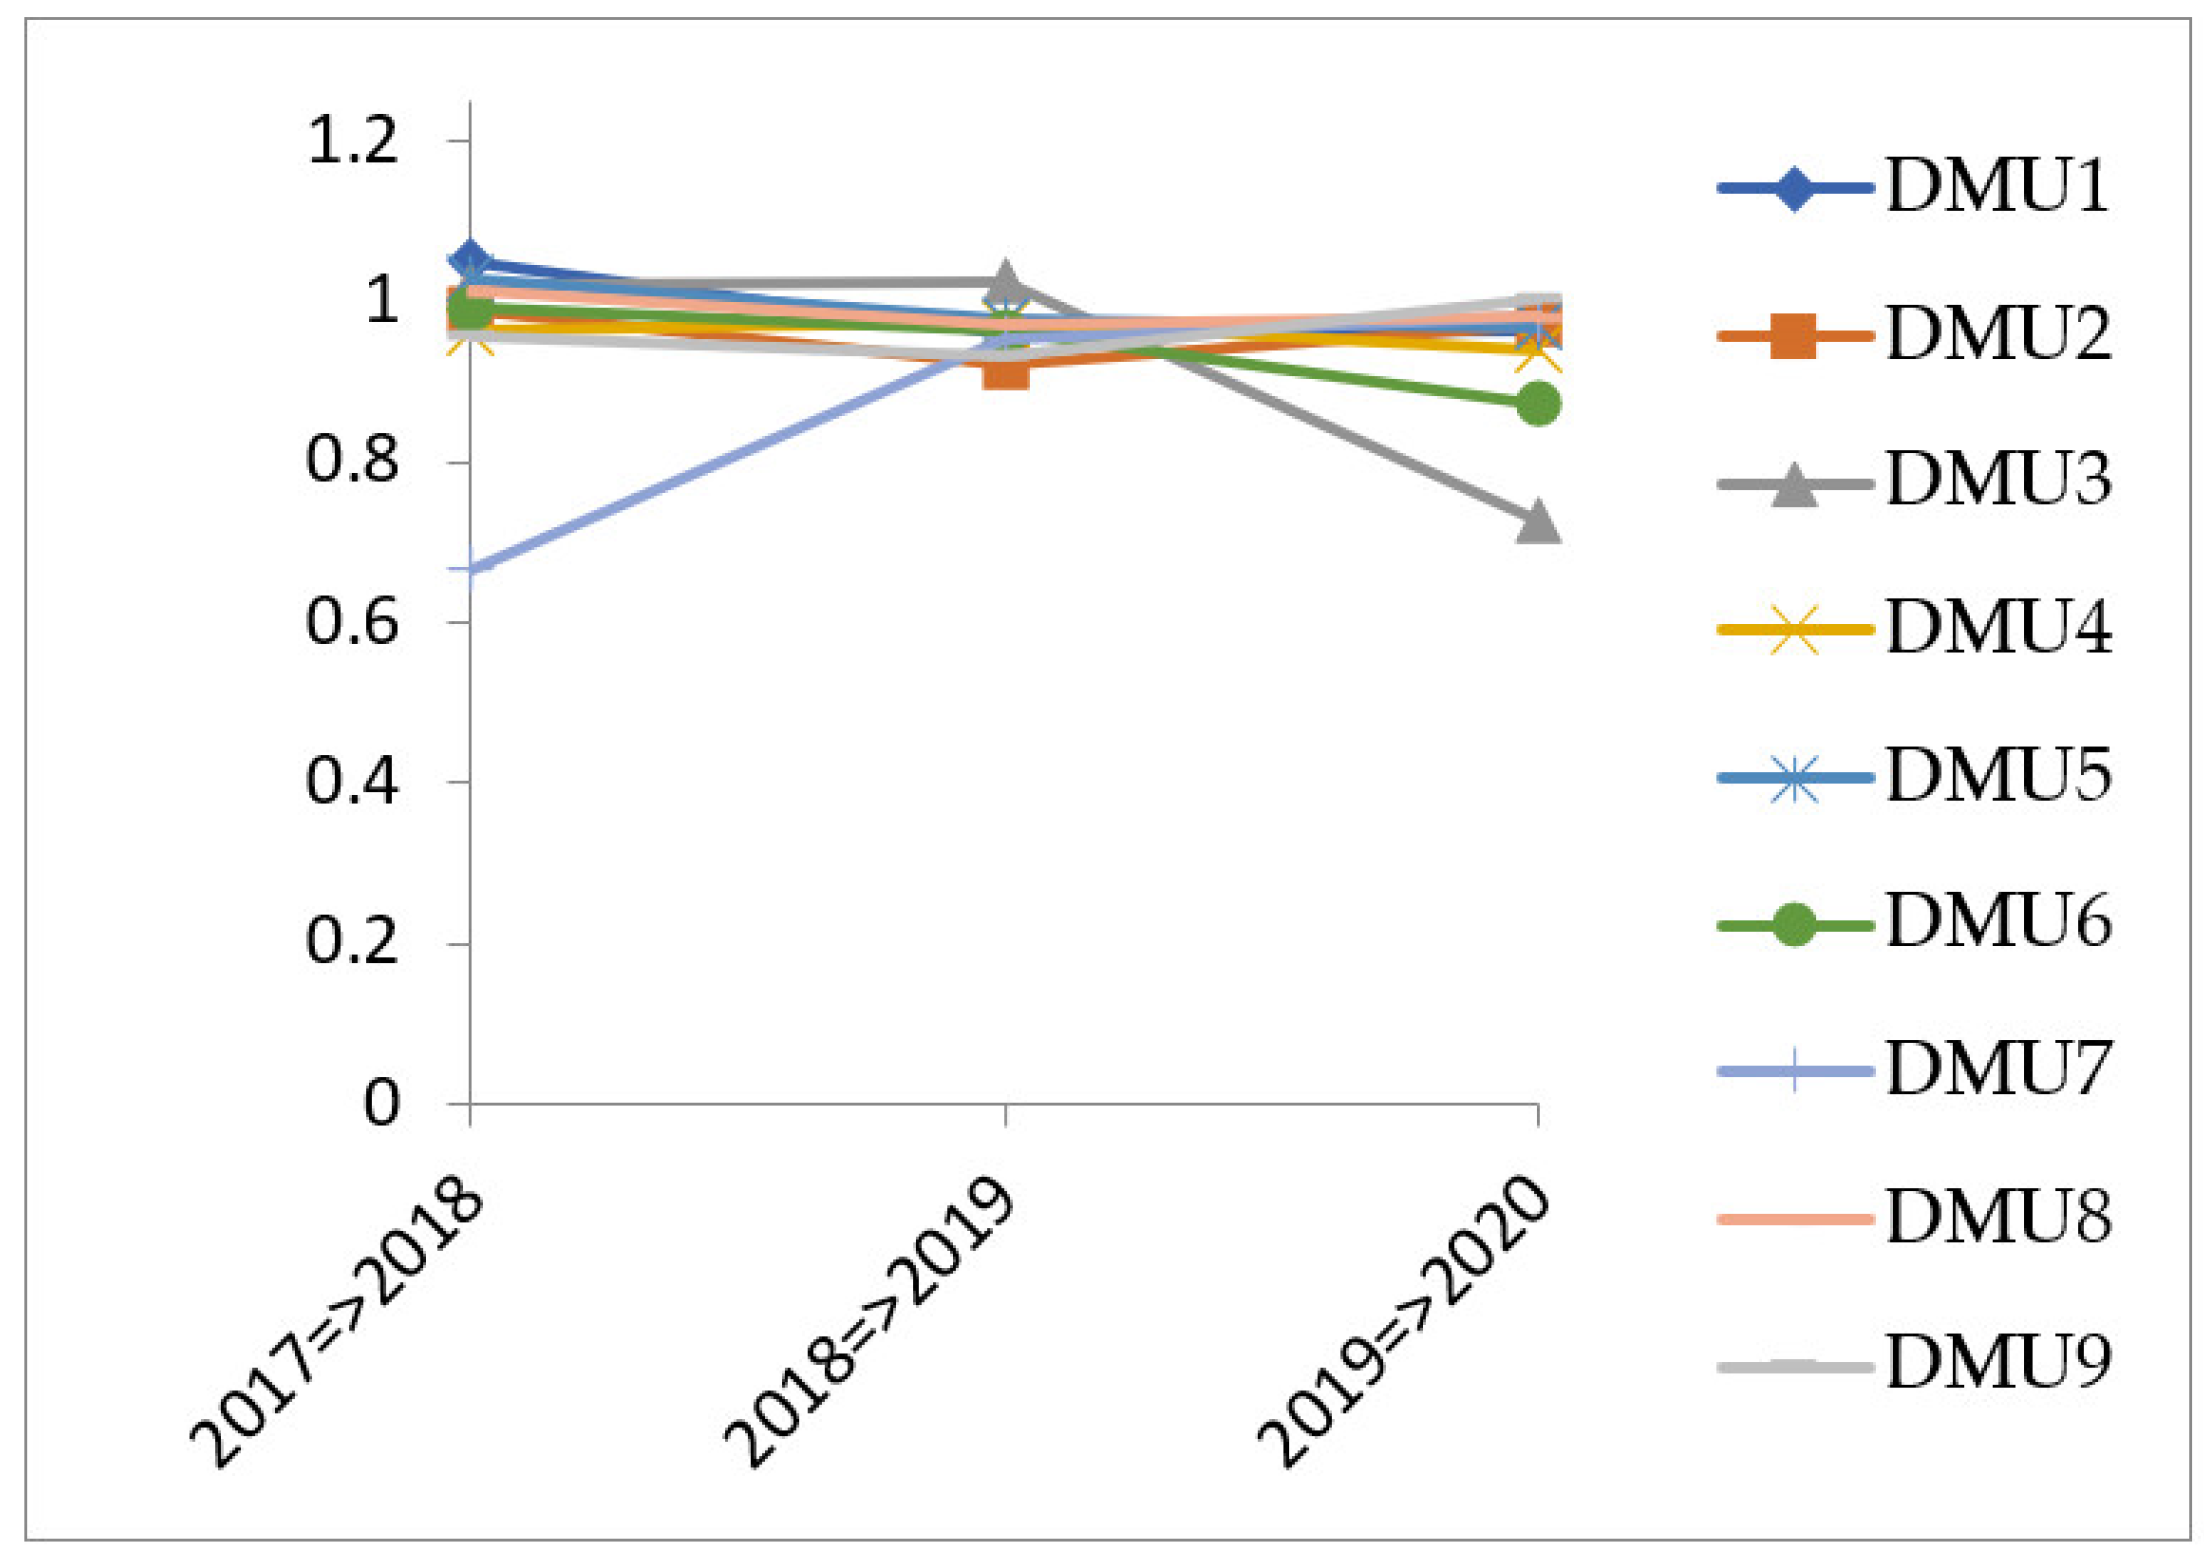
The frontier-shift term expresses the change in the efficient frontiers (technological change) of DMUs between two periods. Table 4 and Figure 4 present the frontier-shift index (FS) of the WM firms from 2017 to 2020. It can be seen from Table 4 that the average FS values of the DMUs are under 1, although, in some periods, several companies had a score greater than 1.
In the first period (2017–2018), except for DMU1, DMU3, DMU5, and DMU8 with scores greater than 1, the other companies did not accomplish the progress in terms of technical efficiency change. However, in the following period (2018–2019), only DMU3 maintained its advanced status. Even though DMU4 and DMU7 had improved, resulting in higher scores than in the previous span, their scores are still lower than 1. The remaining DMUs during the second period did not achieve progressive indexes, and their FS values declined. Compared with the first period, in the last period, DMU7 and 9 are two firms that demonstrated their attempts in technology innovation by obtaining better scores. Specifically, DMU7’s score started at the lowest point (0.663869) and increased to 0.951609 and 0.981953 for the following two periods; however, these results still could not take this company out of the last position in the average scores compared with its competitors. After two spans of regress, in the third period, DMU9 was the only one that obtained an FS value of more than 1 (1.002283), confirming its improvement in technological efficiency. Other DMUs showed a downward trend in the last period. These findings point to the probable common trend that the advancement in technology of the WM industry in this period did not have proper development to go beyond limitations; no DMU demonstrated a stable improvement and getting ahead for the breakthrough in technological performance.

3.3.3. Malmquist Productivity Index (MPI)

The Malmquist index (MI) assesses the change in the efficiency of an operator over two periods of time. If μ > 1, this implies progress in the total factor productivity of DMU, whereas μ ≥ 1 implies the status quo and a regress in the total factor productivity (TFP) in a defined interval, respectively.
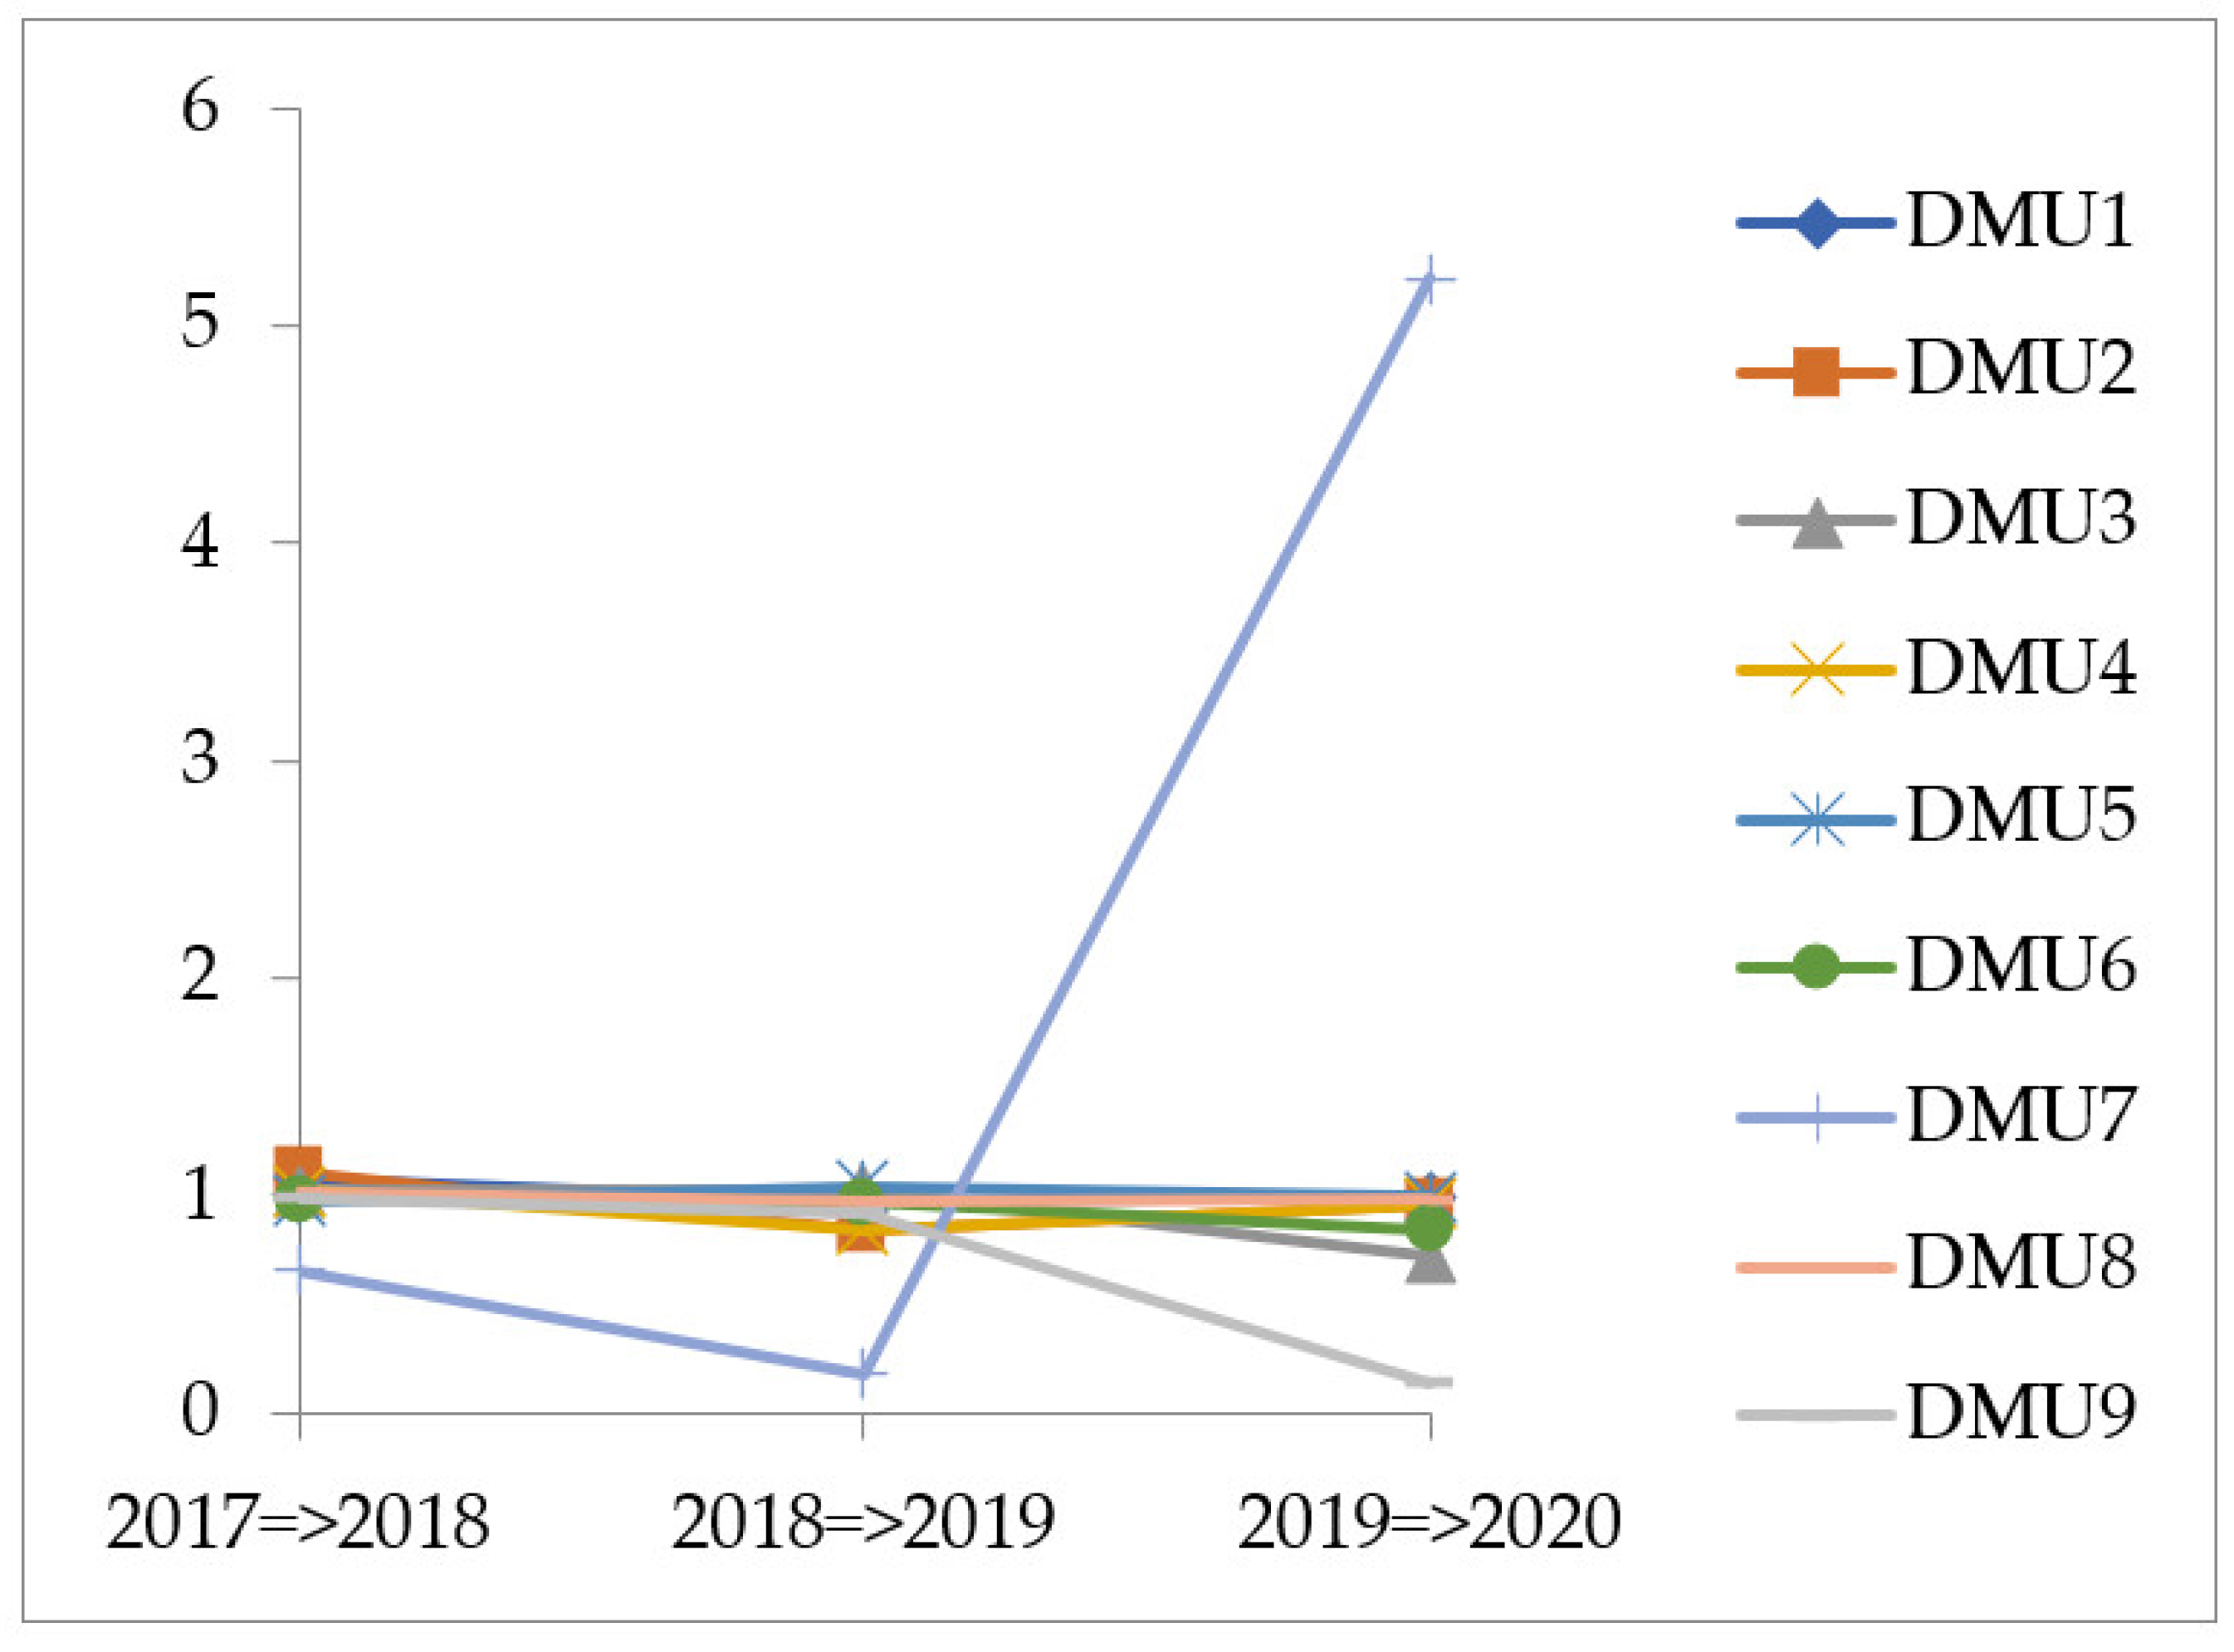
Table 5 and Figure 5 display the TFP of each firm in three periods from 2017 to 2020. Compared with other DMUs, the average scores of DMU1, DMU5, and DMU7 were more than 1, intimating progress in the TFP. In the first period (2017–2018), DMU5, DMU6, DMU7, and DMU9 showed decay in TFP. Except for DMU3 and 5, the TFP of the remaining DMUs declined in the second period (2018–2019). In the last period, most DMUs could not maintain their advanced status and became inefficient, with an MPI under 1. It is noticeable that DMU7 in the first two periods was the least efficient company, followed by the poorest scores (0.659127, 0.180908); however, in the last period, by improving its technical and technology, it reached its peak with the score of 5.215798 and became the most outstanding company, exceeding its rivals. In contrast, DMU6 and 9 during three spans could not achieve the progress in TFP. Specifically, DMU9 had the TFP scores decreased dramatically in the final stage and became the worst performer. The imbalance between the technical efficiency change (CU: 0.139162) and technological efficiency change (FS: 1.002283) in the last span could account for this position of DMU9 in TFP.
Overall, most WM companies did not have a breakthrough performance in their productivity during the experience, excluding DMU7. To make a better TFP, companies should consider improving technical and technological aspects.

3.3.4. Cumulative Malmquist Index (CMI) and Adjusted Malmquist Index (AMI)

The cumulative Malmquist index (CMI) specifies the productivity change from the fundamental span where all DMUs have the same status (original scores for all DMUs are 1) and, therefore, join into a scratch race afterward. An adjusted Malmquist index (AMI), the product of the CMI and the efficiency index in the first span, is defined as actual performance indices [36] and describes the relative efficiency levels in the fundamental period and assesses productivity changes of DMUs afterward. While the ordinary MI takes charge of productivity change over two consecutive periods, the CMI and AMI measure the productivity change from the starting period and help estimate inefficient DMUs, which have approximately low scores. However, they attain a considerable productivity change.
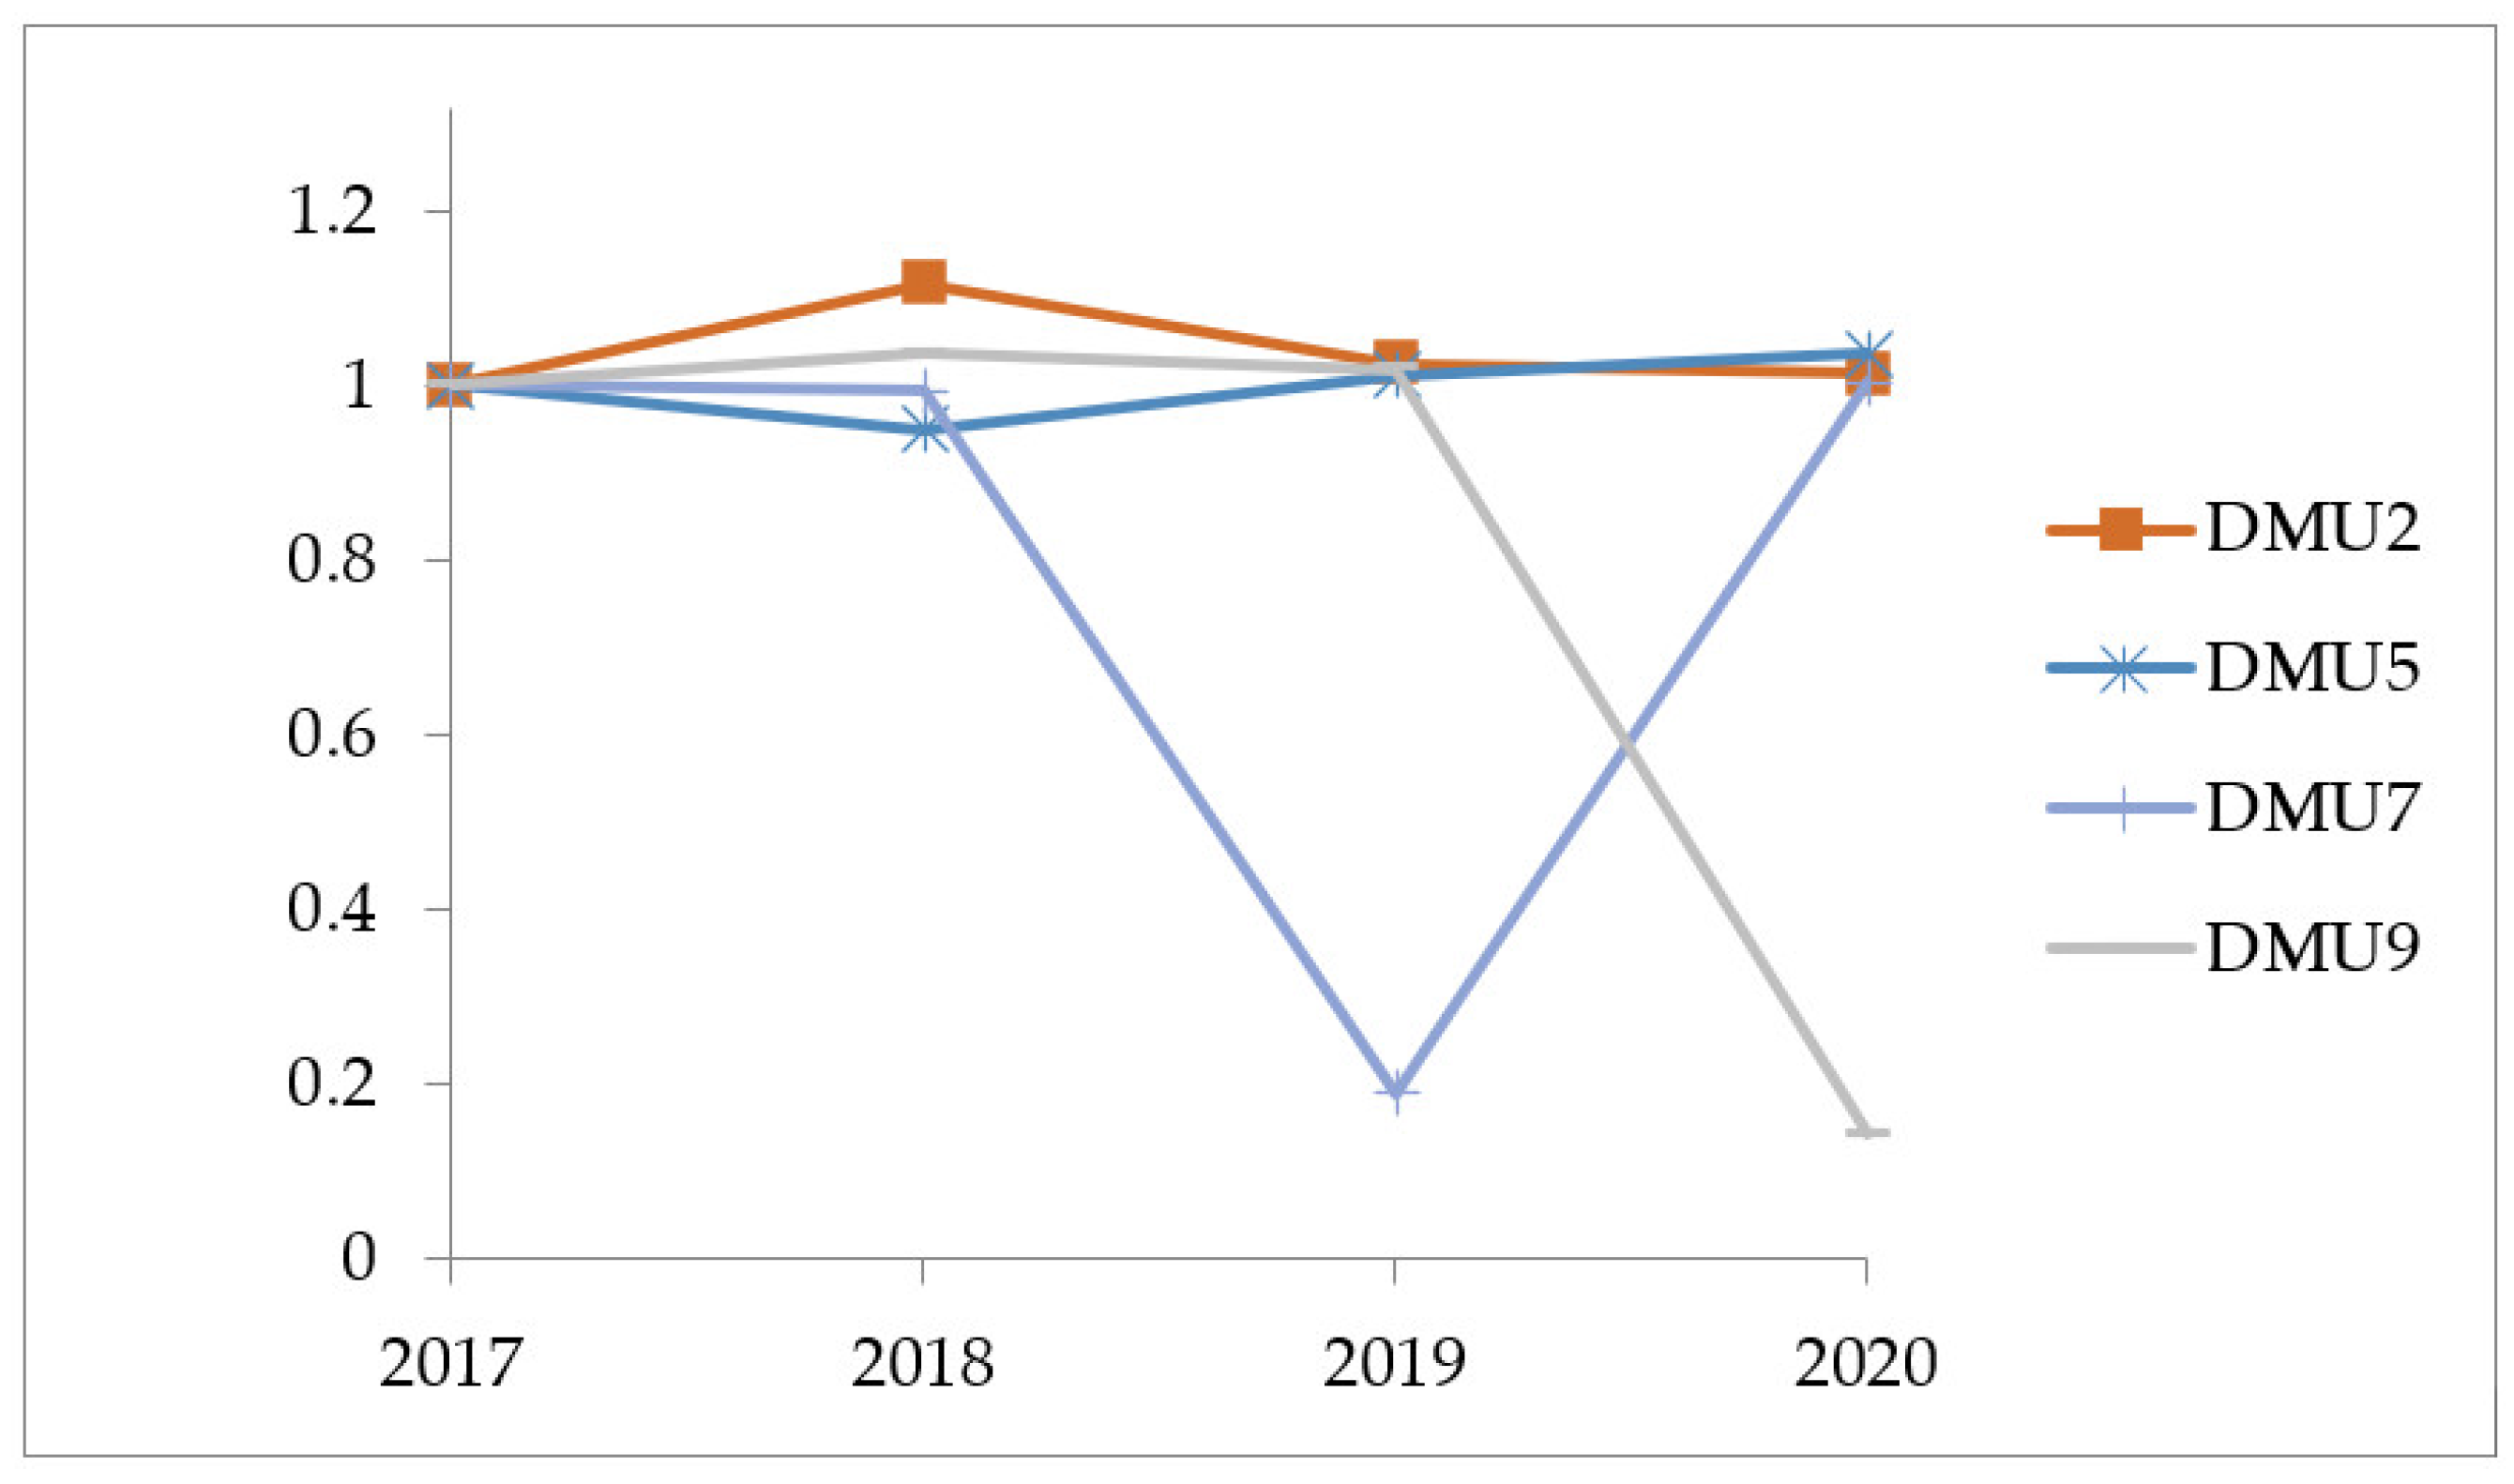
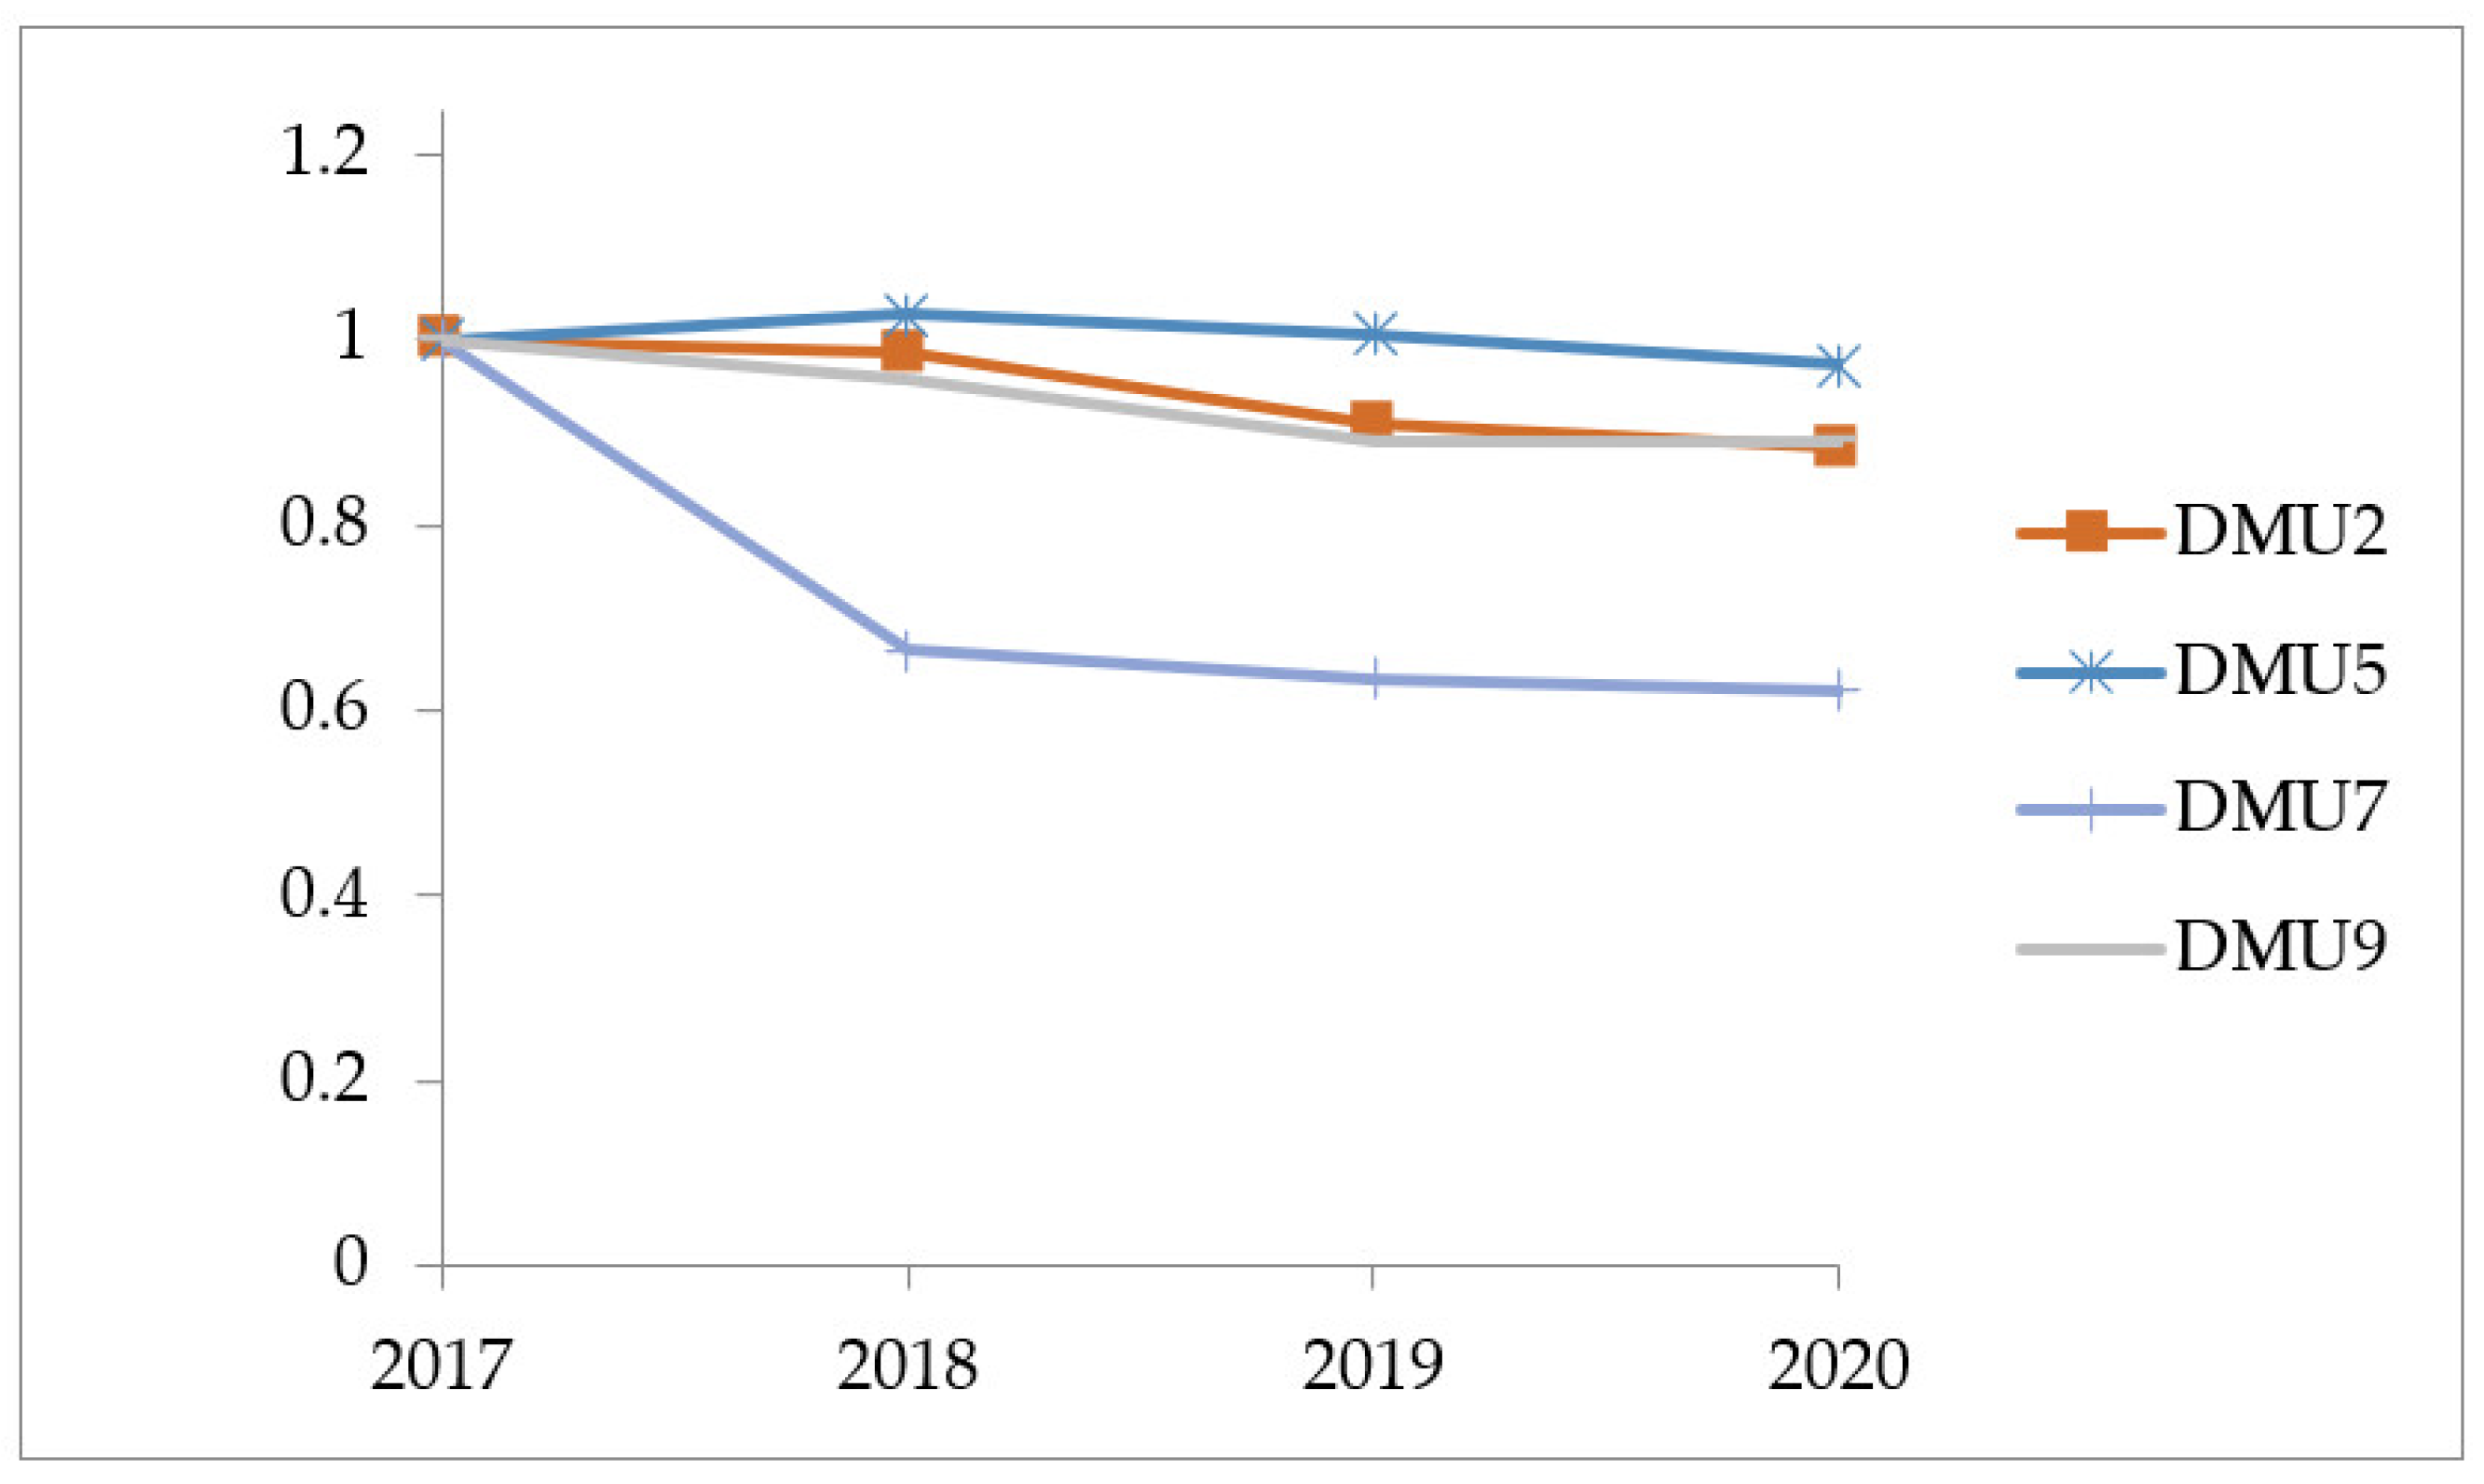
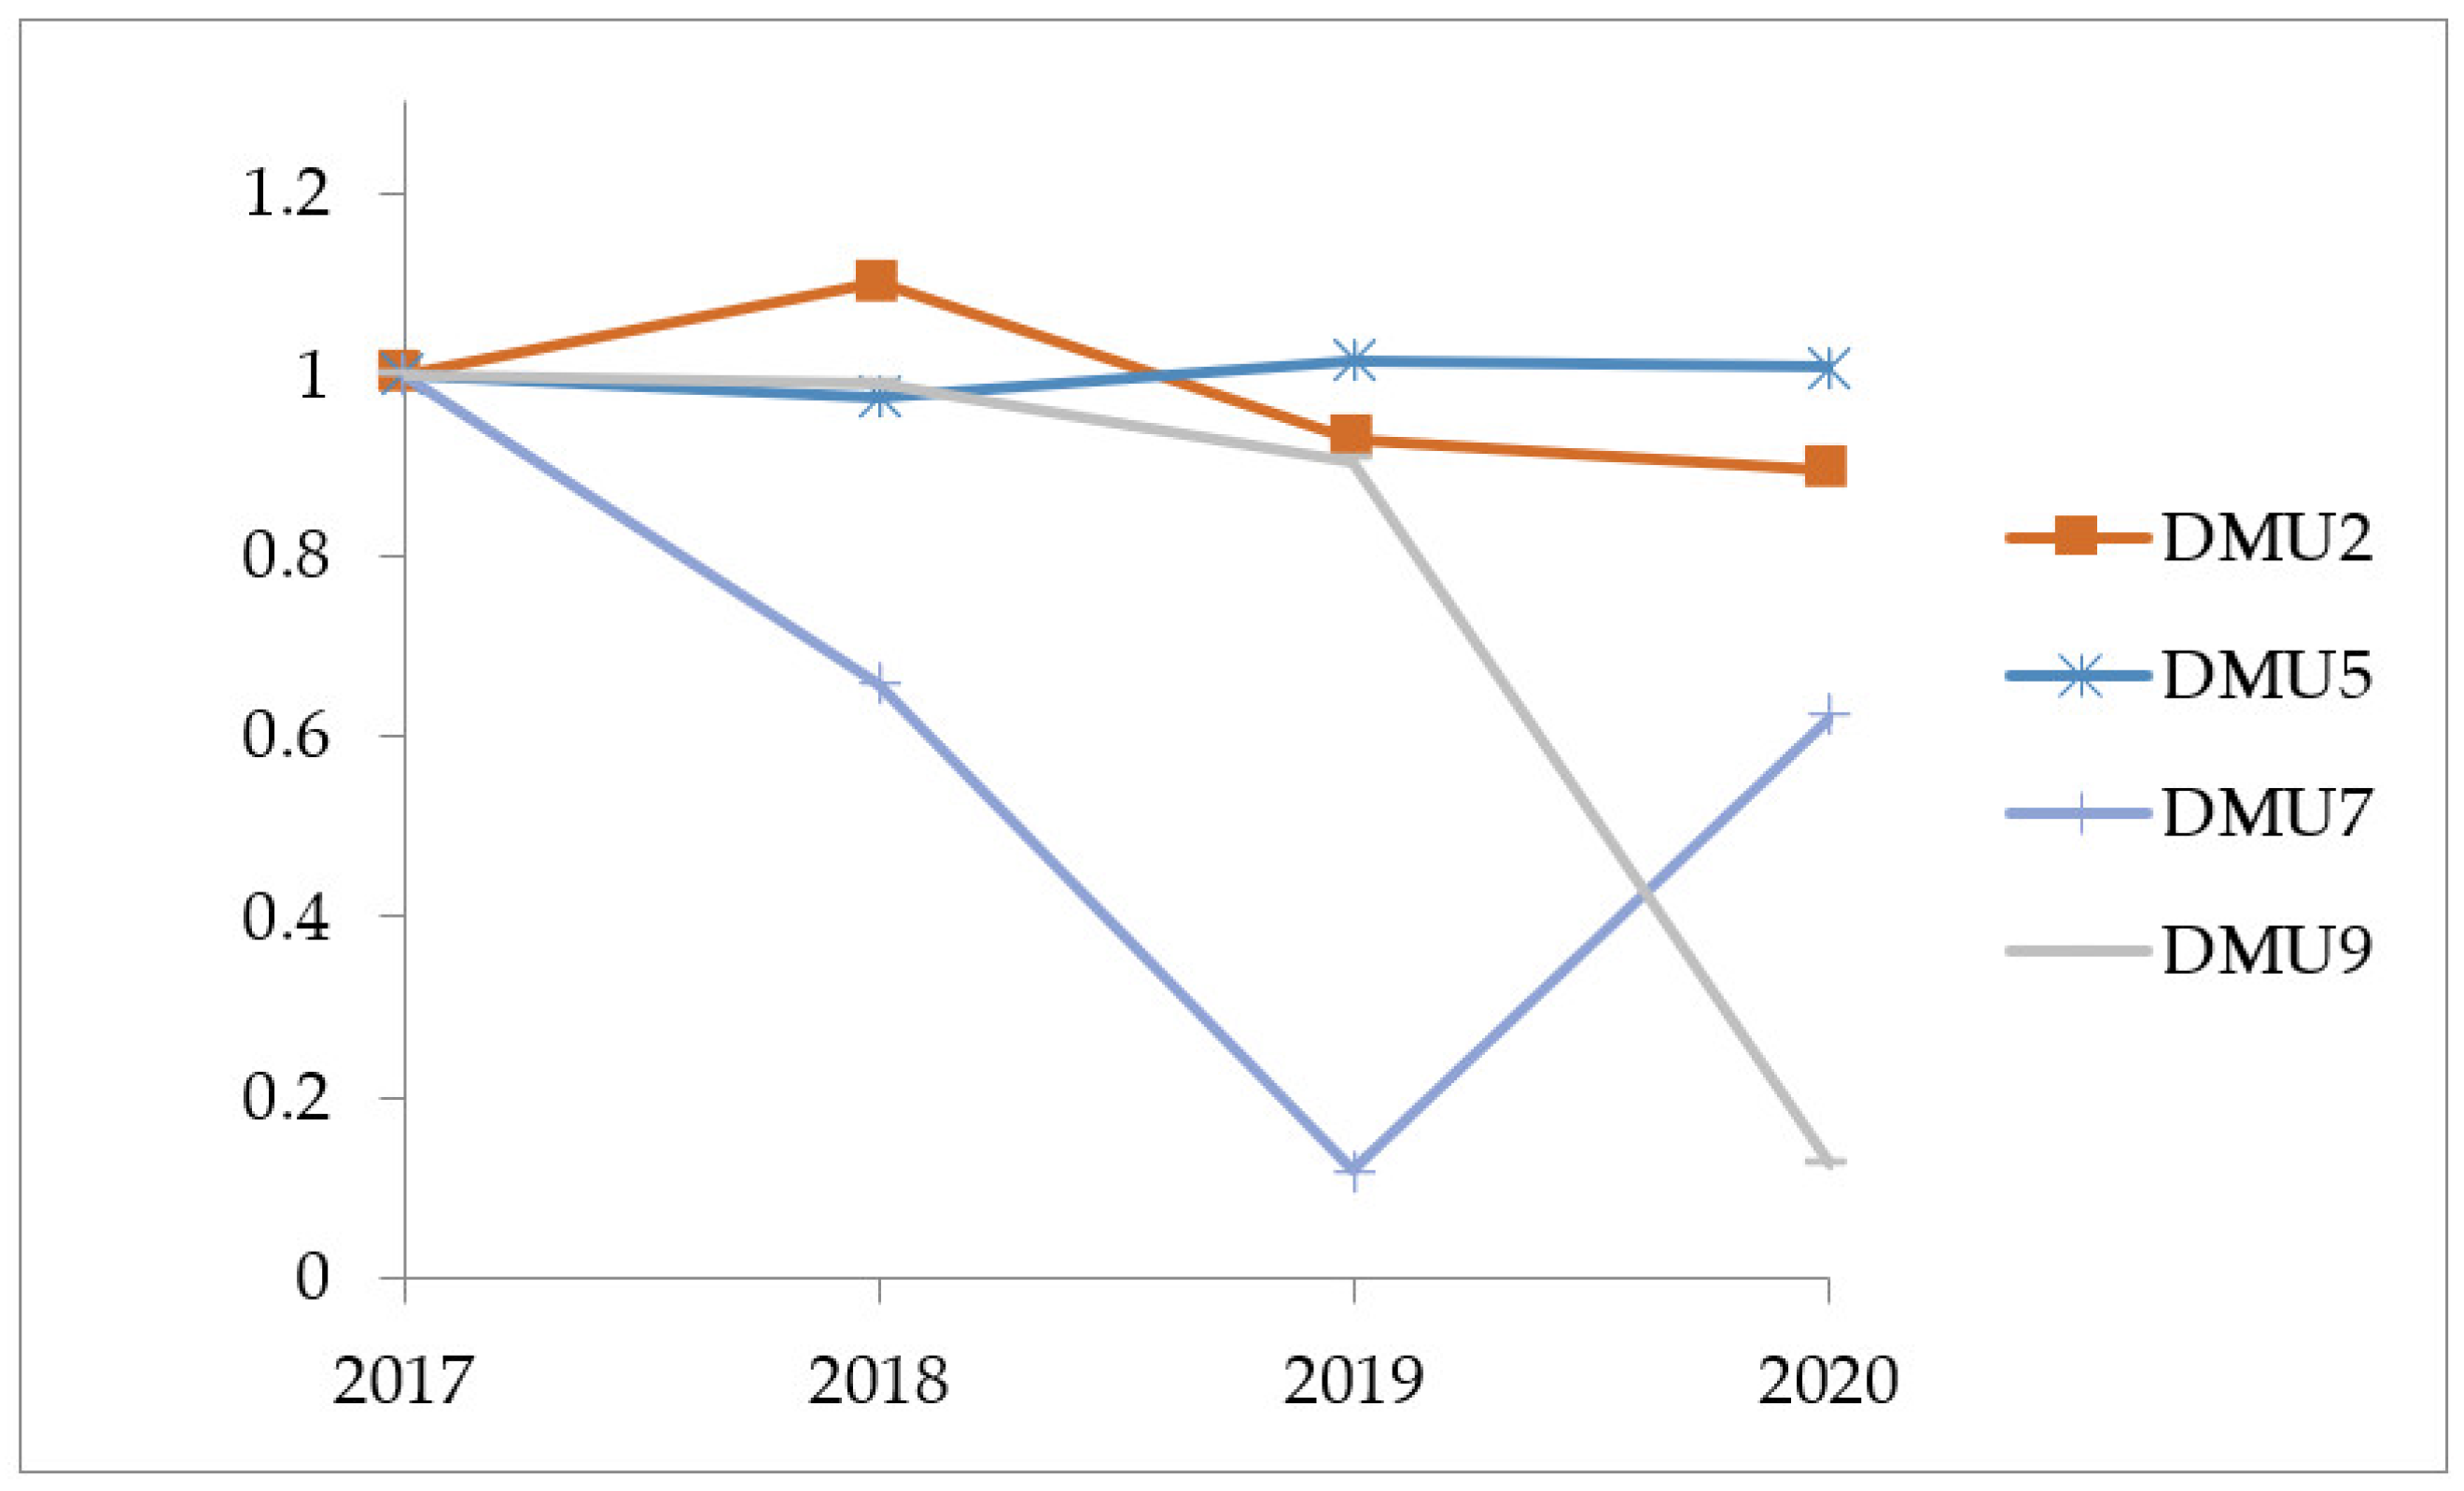
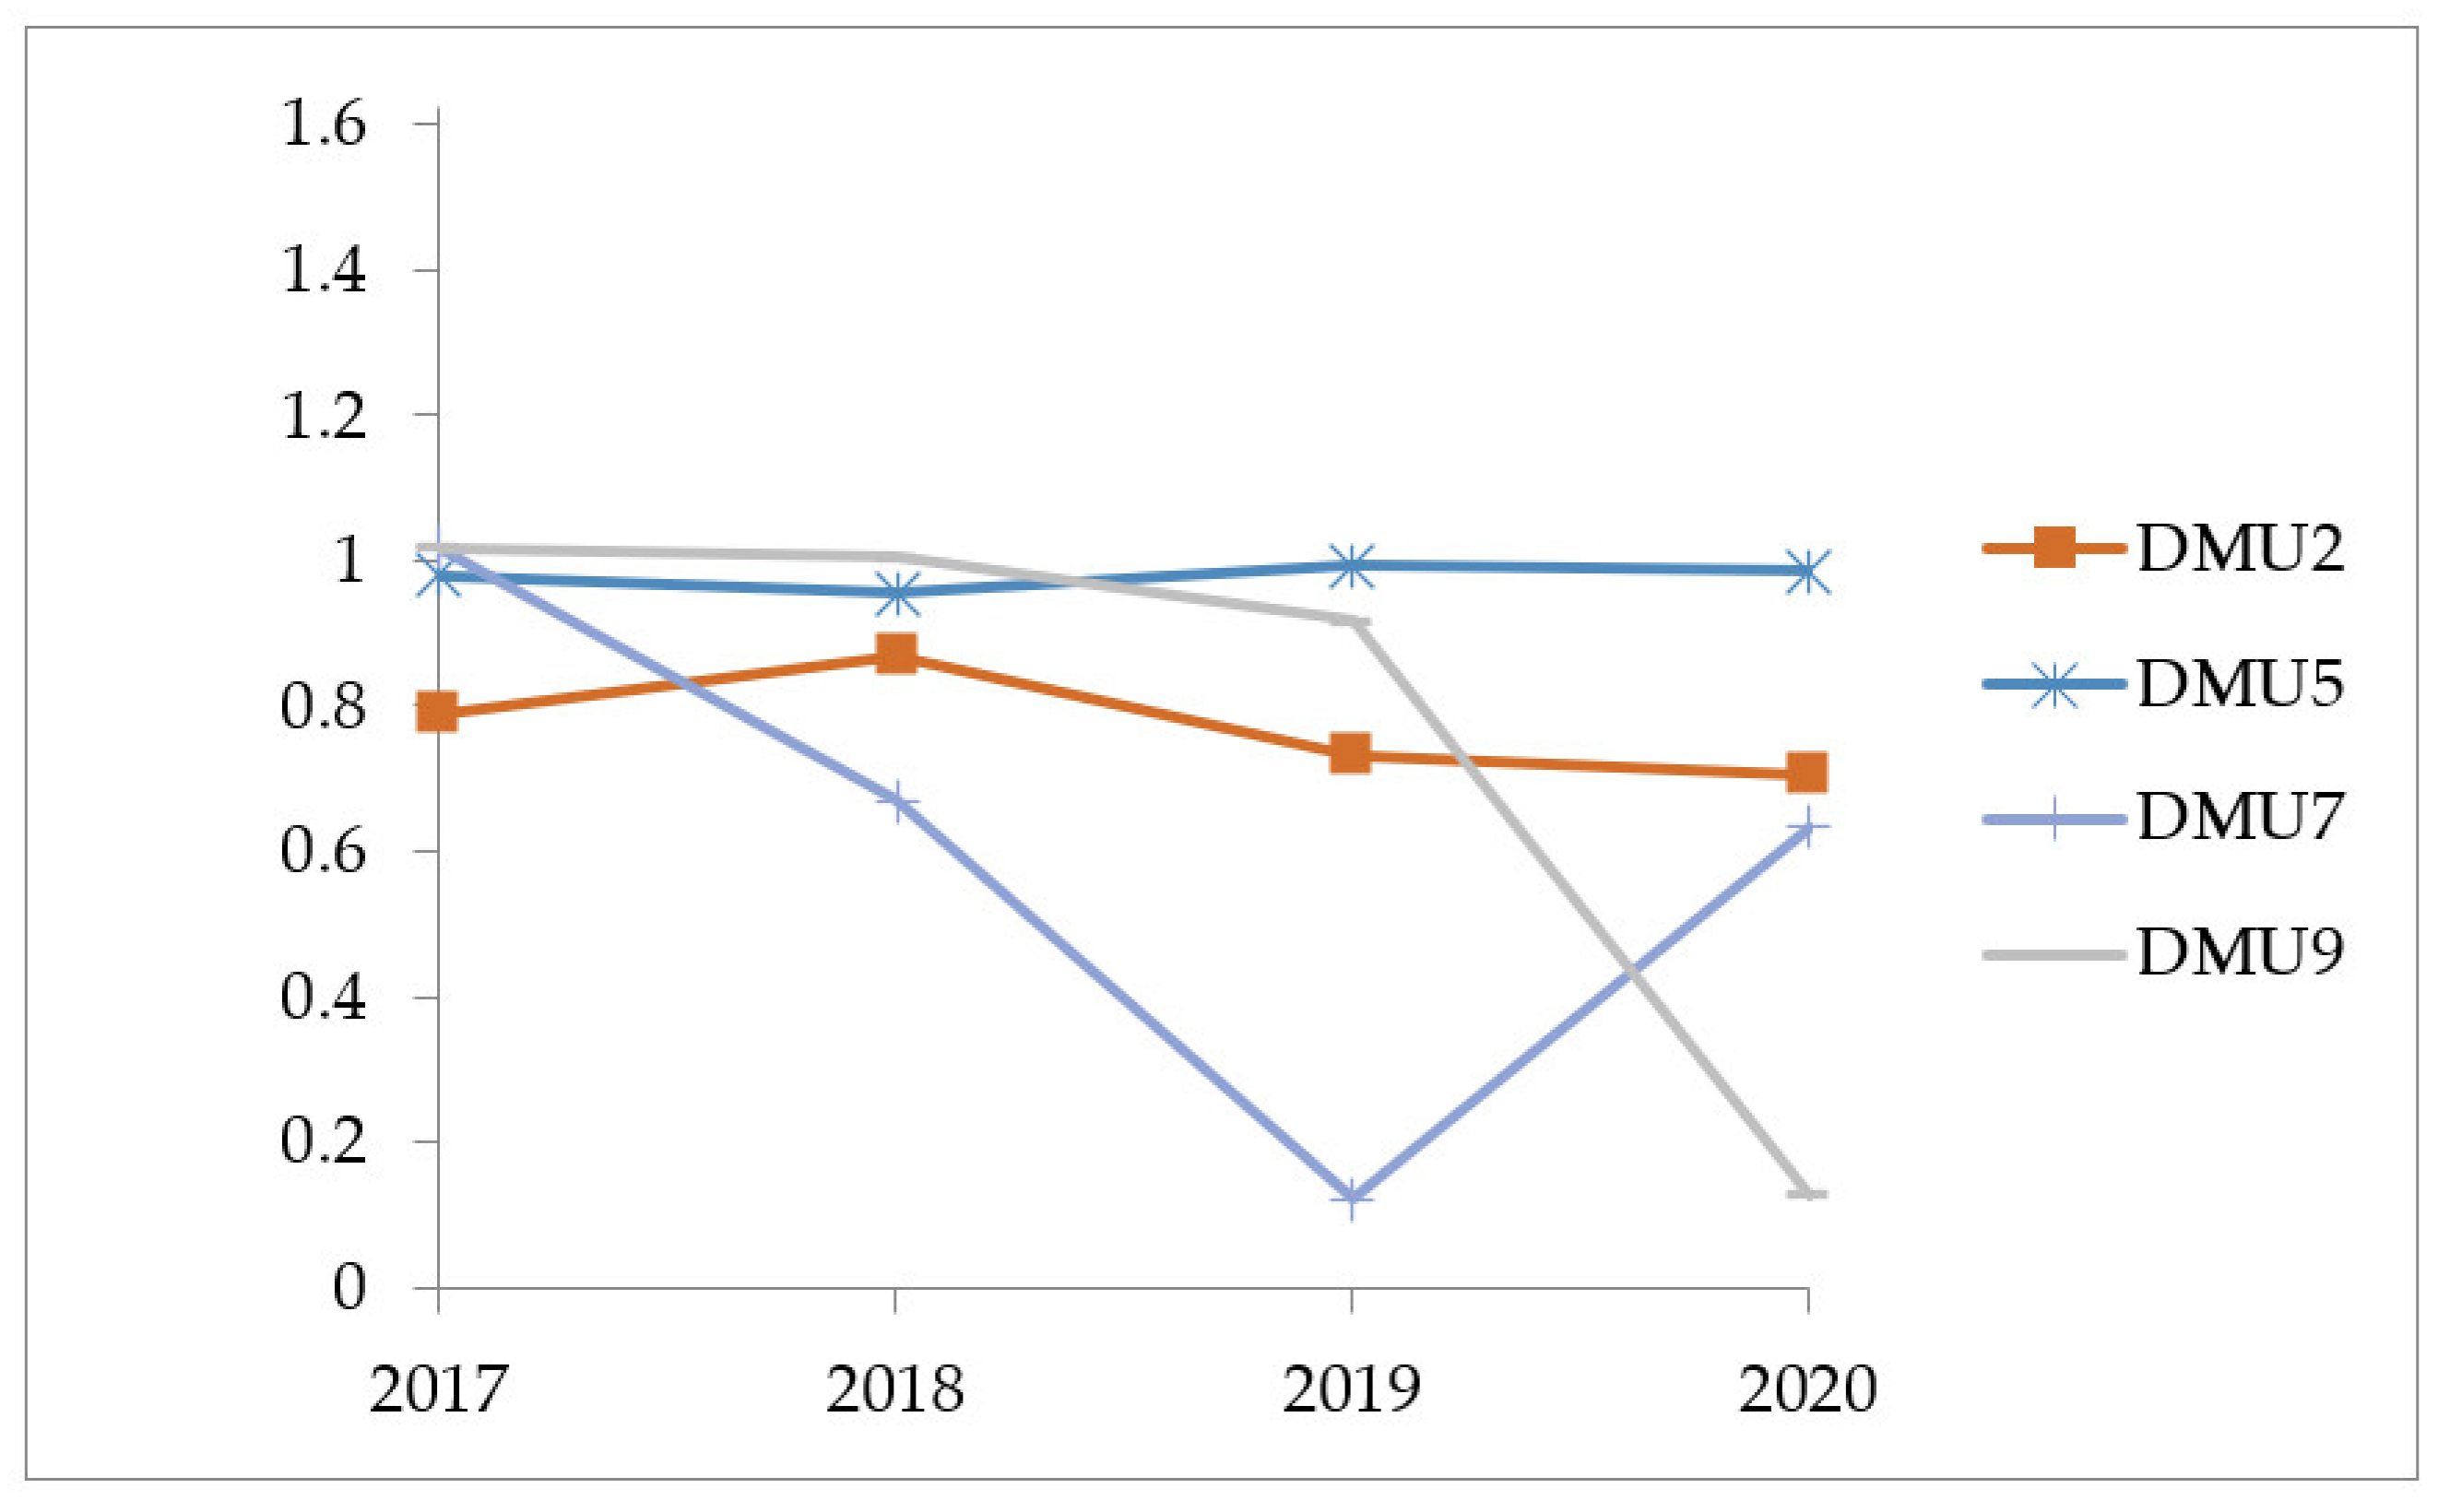
Cumulative indexes, including the CCU, CFS, and CMI, are depicted in Figure 6, Figure 7 and Figure 8 to show the trends in the growth rate of unproductive firms (reference set includes DMU2, DMU5, DMU7, and DMU9) from the base period, comparatively. Figure 9 represents the adjusted Malmquist index (AMI) of inefficient DMUs.
DMU2 obtained the lowest SBM score in the first period, although its scores increased over time. Its frontier shift was less than one and did not change much (the CFSs are smaller than one and regress gradually by periods), and the CCUs were greater than 1. In 2018, its CMI increased more than other DMUs in the reference set, showing its high rate of productivity change. However, in general, because the AMI is incorporated in the first period (<0.8) and the efficient score was low, even though DMU2 had a high rate of productivity change, its position was still lower than the other DMUs in the reference set for the first three years.
DMU5 experienced a growth trend in SBM scores over the four years, although its scores were under 1 for the first three years. The frontier for DMU5 progressed in the first span and regressed in the second and third spans. Excluding the year 2018, the CMI of DMU5 increased slightly and achieved scores of more than 1. When the frontier did not move much, the AMI and growth rate of DMU5 did not change significantly and were close to 1. As a result, DMU5 gained second place for the first two years, 2017 and 2018, and obtained first place in the last two years, 2019 and 2020.
From 2017 to 2019, the CMI of DMU7 dropped dramatically and grew sharply in 2020. Last year, its SBM score increased from 0.09 to 1.02 and obtained efficiency status. However, in 2018 and 2019, AMI declined too low, so, even though it obtained a similar level of SBM score to DMU5 in the last period, it could not obtain the productivity level of DMU5. The trend in the AMI for DMU7 is close to that for DMU2, although the SBM scores exceed those for DMU2.
Because its frontier reduced slightly through the first three years and dropped sharply in the last year, the CMI of DMU9 also declined over time. DMU9′s AMI was similar to its SBM scores for the first two years (>1) and in the last year (<0.2). Even DMU9 received an SBM score > 1 in 2019, but its AMI decreased slightly, and it was unable to obtain DMU5′s efficiency. In 2020, AMI fell to the last position and was as low as DMU7 in 2019; hence, it became the least productive DMU in the previous year.

3.4. Discussion

As other industries, the waste management industry was affected by COVID-19 from the concentration of segment reposition [36]. Concurrently with lockdowns, garbage from residences was produced more than from commercial and industrial zones due to their activities being suspended. Nevertheless, the recovery of manufacturers and businesses, together with the beginning of vaccination campaigns all over the world, have created more waste and led to tremendous demands of recycling for the waste management industry with their extensive competence. To sustain waste management activities, profitable efficiency with technical and technological innovation are prospect points that waste management operators should focus on [15,37]. The research applied negative super-SBM and negative Malmquist models designed for handling negative data, which come up with different aspects of results. While negative super-SBM provides the efficiency scores, ranks, and slack indicators, negative Malmquist interprets the technical and technological innovation and productivity changing of waste management firms over the experiment years.
According to the negative super-SBM results, in general, the rank of each company during the observation years did not change much. In the efficiency score term, DMU2 was an inefficient firm when its scores through 4 years were lower than 1, followed by DMU5 with the same situation in the first three years. DMU7 and 9 had the most fluctuation patterns when their score dropped and increased sharply. In contrast, DMU8 and DMU3 are the most efficient companies. In fact, the DMU3-Veolia Environment S.A. has adapted their strategy for expansion by association with Nestle to develop recycling programs to recycle plastic waste in March 2019 [38].
It is interesting to note that most of the operators obtained their efficiency score in 2020. The growth in the amount of waste from pharmaceuticals, healthcare, and manufacturers reviving activities can provide a reason for this [36]. To maintain profitable efficiency, waste management manufacturers should consider the balance between cost and revenue. While most WM companies’ revenues come from the fee collection from households, commercial, industrial corporations, and the sales of recycling materials and produced energy, their costs come from the waste collection process, treatment, and disposal [33]. To reduce the deficiency in finance, companies should practice cost-efficiency (such as improve waste logistic efficiency and technical and technology efficiency) and diversify their revenue sources [33]. Based on the slacks index in Table A2 of negative super-SBM, to achieve better results, the inefficient firms can reduce the input excess value or increase the output shortage value with the quantity, as suggested.
The further results from the Malmquist model show that more than a half of DMUs (5 over 9) obtained average catch-up indexes of more than 1. Excluding DMU5 and 9, other DMUs attained quite stable performances in technical efficiency change. Regarding technological innovation, except DMU7 and 9, the remaining operators experienced a downward trend. Combining from these two technical and technological innovation terms, the total productivity of all the DMUs demonstrates an unstable performance during the 4-year period, and most of the firms did not achieve a breakthrough advancement. The impact of COVID-19 on the focus of the segment of the waste management industry could account for this unstable status. In order to retain sustainability and avoid the critical situation coming from the pandemic and industry 4.0 era, waste management manufacturers should utilize appropriate methods that include technical aspects and technology [39]. Improper practices in managing and handling operations may have a consequential effect. Besides, as can be seen from the case of unfortunate DMUs mentioned above, the growth rate of a DMU can be large, but its productivity level may not reach the level of other DMUs. Since the TFP is the result of technical efficiency and technological efficiency change, operators should retain the improvement balance between these two factors to obtain the advancing performance status in the long-term.

4. Conclusions

For many years, the waste management field has required involvement from different parties, which are government, society, and WM enterprises. Economic, social, technical and technological, and environment components are supposed to make the waste management process more complex. It is important to note that advanced governance plays an essential role for waste management companies to sustain profits and improve their competitive advantages in this rapidly developing market. Some previous studies have examined the factors that affect the financial sustainability of WM firms [15] and applied successful DEA models to assess the effectiveness of various organizations in multiple fields. However, until now, there has been no study that uses the DEA model to evaluate the productivity of WM companies in the world and, specifically, when the data have non-negative values. In an effort to measure the effectiveness of nine major players in the waste management industry, this paper carried out an integration of the negative super-SBM model and negative Malmquist model. Detailed cost and profit data from financial statements were converted through these frameworks into efficiency scores, ranks, technical efficiency, technological progress, and the total factor productivity indices within four experimental years (2017–2020). At first, Pearson’s correlation coefficient was tested between input and output variables to confirm the isotonic. When the correlation met the requirement, the negative super-SBM model was applied to calculate efficiency scores, rankings, and slacks for each DMU. From the slack indicators, competent operators can find suggestions to increase their performance. Even though the COVID-19 pandemic from the end of 2019 has had a negative impact on the global economy, the empirical results show that most of the waste management companies utilized their opportunities to adopt the new trend for expansion and remain profitable with efficiency, especially DMU3 and 8, which are the most efficient companies. Meanwhile, some other DMUs, such as DMU2 and 5, need more advancement to achieve better performance. In the next step, the technical, technological change, and total productivity were measured by the negative Malmquist model. In general, the majority of the DMUs did not have steady achievement to obtain a progressive outcome due to the disproportionality in technical and technological innovation. To achieve advancing productivity, WM companies should focus on and balance the improvement for both technical efficiency and technological efficiency.
As part of this study, the general view of the world waste management industry is implied by the performance of the world’s top nine waste management companies regarding profitable efficiency, technical and technological innovation, and total productivity. Moreover, a comparative performance of the major players in the WM industry from different locations and countries is also delivered. As a result, this will be a valuable resource for WM executives who must make long-term business decisions, as well as investment decisions for investors and operators. Furthermore, this research sheds light on the negative super-SBM and negative Malmquist models in DEA, which can be used to assess an organization’s productivity and make recommendations for future growth in various fields. The prescribed methodology would be universal and possibly applicable to any similar benchmarking problem, as well as more new aspects and factors, and the results would be more realistic.
It is plausible that a number of limitations could have influenced the results obtained. Firstly, due to the fact that the performance of an organization can be impacted by multiple factors, which could not be shown in financial reports, this research measures the efficiency of WM companies based on the financial data. Secondly, the difficulty of collecting data is considered as one of the shortcomings that led to the limitation of the WM companies list. Therefore, future researchers can consider the relations among the components and their effect on WM productivity, create more input/output factors, or apply other approaches to obtain better comparisons not only between DMUs but also between different models.

Author Contributions

C.-N.W. and H.-P.H.: Conceptualization, Methodology, Software, Project administration. T.-K.-L.N.: Methodology, Resources, Data curation, Writing—Review & Editing. Q.-N.H.: Validation, Formal analysis, Investigation, Writing—Original draft preparation, Visualization. T.-T.D.: Review & Editing. All authors have read and agreed to the published version of the manuscript.

Funding

This research received no external funding.

Institutional Review Board Statement

Not applicable.

Informed Consent Statement

Not applicable.

Data Availability Statement

Data are available in a publicly accessible repository.

Acknowledgments

The authors would like to express our gratitude to the National Kaohsiung University of Science and Technology, Taiwan.

Conflicts of Interest

The authors declare no conflict of interest.

Appendix A

Table A1. Input and output data of DMUs from 2017 to 2020.
DMUsTACOROETRNITACOROETRNI
20172018
13,706,5702,062,673754,5302,944,978100,7393,738,3212,305,551812,1783,300,30365,636
24,441,0001,271,000378,0001,752,00057,0003,843,0001,321,000398,0001,868,000152,000
346,688,44925,416,8583,503,11830,620,104489,44245,815,47326,411,9513,374,17631,578,635535,388
421,829,0009,021,0002,844,00014,485,0001,949,00022,650,0009,249,0002,930,00014,914,0001,925,000
521,147,0006,214,6002,209,50010,041,5001,278,40021,617,0006,150,0002,173,60010,040,9001,036,900
612,014,6812,704,7751,142,1224,630,488576,81712,627,3292,865,7041,204,8754,922,941546,871
76,988,3002,118,2001,470,1003,580,70042,4006,455,5002,109,9001,178,4003,485,900−244,700
8314,657276,10254,428365,95728,123347,822323,16565,477410,18314,728
9802,076350,91584,466504,04249,365947,898395,83492,340565,92849,595
20192020
14,108,9042,387,819794,9153,412,19097,7404,131,5202,137,751755,0103,144,097134,837
23,715,0001,371,000407,0001,870,00010,0003,706,0001,420,000396,0001,904,000−28,000
349,991,08627,820,8033,401,35433,135,684761,58455,286,34626,960,5013,338,58931,699,045108,223
427,743,0009,496,0003,205,00015,455,0001,670,00029,345,0009,341,0003,399,00015,218,0001,496,000
522,683,8006,298,4002,198,40010,299,4001,073,30023,434,0006,100,5002,211,80010,153,600967,200
613,737,6953,198,7571,290,1965,388,679566,84113,992,3643,276,8081,290,0365,445,990204,677
76,437,0002,134,4001,055,1003,308,900−346,8005,581,9001,622,400897,6002,675,500−57,300
8471,314349,60381,963421,7648363461,669321,64866,289381,65211,937
92,231,244475,675141,123685,50933,1401,831,283688,805201,067933,854−389,359
Note: total assets (TA), cost of revenue (COR), operating expenses (OE), total revenue (TR), net income (NI).
Table A2. Slacks of inefficiency DMUs (2017–2020).
TACOROETRNI
2017DMU21,395,245.60.00.0236,463.3193,983.8
DMU53,678,659.20.0121,671.764,982.460,917.1
2018DMU2467,313.90.00.0207,385.492,840.0
DMU53,832,865.10.081,123.822,582.0219,037.8
DMU70.00.0462,165.90.0651,374.0
2019DMU2324,965.10.00.0181,877.5167,337.5
DMU52,634,726.30.00.06722.930,485.5
DMU70.00.0331,946.384,728.9684,925.5
2020DMU20.00.00.0143,997.1170,948.7
DMU90.03674.90.057,954.1461,306.6
Note: total assets (TA), cost of revenue (COR), operating expenses (OE), total revenue (TR), net income (NI).

References

  1. Apsara, D.; Walahapitiya, P.; Perera, D.; Madushan, H.; Abeygunawardhana, L.; Ferdinando, D. Solid Waste Management in Textile Industry. J. Res. Technol. Eng. 2022, 3, 1–7. [Google Scholar]
  2. Demirbas, A. Waste management, waste resource facilities and waste conversion processes. Energy Convers. Manag. 2011, 52, 1280–1287. [Google Scholar] [CrossRef]
  3. Awuchi, C.; Awuchi, C.; Ikechukwu, A.; Victory, I. Industrial and Community Waste Management: Global Perspective. Am. J. Phys. Sci. (AJPS) 2020, 1, 1–16. [Google Scholar]
  4. Wang, C.N.; Hoang, Q.N.; Nguyen, T.K.L. Integrating the EBM Model and LTS(A,A,A) Model to Evaluate the Efficiency in the Supply Chain of Packaging Industry in Vietnam. Axioms 2021, 10, 33. [Google Scholar] [CrossRef]
  5. Kaza, S.; Yao, L.C.; Bhada-Tata, P.; Woerden, F.V. What a Waste 2.0: A Global Snapshot of Solid Waste Management to 2050; Urban Development; World Bank: Washington, DC, USA, 2018. [Google Scholar]
  6. Alliedmarketresearch. Available online: https://www.alliedmarketresearch.com/waste-management-market (accessed on 12 October 2021).
  7. Lichpinseo. Available online: https://linchpinseo.com/trends-waste-management-industry/ (accessed on 15 October 2021).
  8. The World Bank. Available online: https://www.worldbank.org/en/topic/urbandevelopment/brief/solid-waste-management (accessed on 28 February 2022).
  9. Papadakis, V.; Lioukas, S.; Chambers, D. Strategic decision-making processes: The role of management and context. Strateg. Manag. J. 1998, 19, 115–147. [Google Scholar] [CrossRef]
  10. Gollakota, A.R.K.; Gautam, S.; Shu, C.M. Inconsistencies of e-waste management in developing nations—Facts and plausible solutions. J. Environ. Manag. 2020, 261, 110234. [Google Scholar] [CrossRef]
  11. Gharfalkar, M.; Court, R.; Campbell, C.; Ali, Z.; Hillier, G.; Court, R. Analysis of waste hierarchy in the European waste directive 2008/98/EC. Waste Manag. 2015, 39, 305–313. [Google Scholar] [CrossRef]
  12. EURLex. Available online: https://eur-lex.europa.eu/legal-content/EN/TXT/?uri=CELEX%3A32008L0098 (accessed on 3 March 2022).
  13. EPA. Available online: https://www.epa.gov/rcra/resource-conservation-and-recovery-act-rcra-regulations (accessed on 3 March 2022).
  14. Kalulu, K.; Hoko, Z. Assessment of the performance of a public water utility: A case study of Blantyre Water Board in Malawi. Phys. Chem. Earth. 2010, 35, 806–810. [Google Scholar] [CrossRef]
  15. Bartolacci, F.; Paolini, A.; Quaranta, A.G.; Soverchia, M. Assessing factors that influence waste management financial sustainability. Waste Manag. 2018, 79, 571–579. [Google Scholar] [CrossRef]
  16. Charnes, A.A.; Cooper, W.W.; Rhodes, E. Measuring the efficiency of decision-making units. Eur. J. Oper. Res. 1978, 2, 429–444. [Google Scholar] [CrossRef]
  17. Hotelling, H. The economics of exhaustible resources. J. Political Econ. 1931, 39, 137–175. [Google Scholar] [CrossRef]
  18. Banker, R.D.; Charnes, A.; Cooper, W.W. Some models for estimating technical and scale inefficiencies in data envelopment analysis. Manag. Sci. 1984, 30, 1078–1092. [Google Scholar] [CrossRef] [Green Version]
  19. Tone, K. A slacks-based measure of efficiency in data envelopment analysis. Eur. J. Oper. Res. 2001, 130, 498–509. [Google Scholar] [CrossRef] [Green Version]
  20. Tone, K. A slacks-based measure of super-efficiency in data envelopment analysis. Eur. J. Oper. Res. 2002, 143, 32–41. [Google Scholar] [CrossRef] [Green Version]
  21. Tone, K.; Chang, T.S.; Wu, C.H. Handling negative data in slacks-based measure data envelopment analysis models. Eur. J. Oper. Res. 2020, 282, 926–935. [Google Scholar] [CrossRef]
  22. Lee, Y.J.; Joo, S.J.; Park, H.G. An application of data envelopment analysis for Korean banks with negative data. Benchmarking 2017, 24, 1052–1064. [Google Scholar] [CrossRef]
  23. Nguyen, X.H.; Nguyen, T.K.L. Approaching the Negative Super-SBM Model to Partner Selection of Vietnamese Securities Companies. J. Asian Financ. Econ. Bus (JAFEB) 2021, 8, 527–538. [Google Scholar] [CrossRef]
  24. Cui, Q.; Jin, J.Y. Airline environmental efficiency measures considering negative data: An application of a modified network Modified Slacks-based measure model. Energy 2020, 207, 118221. [Google Scholar] [CrossRef]
  25. Färe, R.; Grosskopf, S.; Lindgren, B.; Roos, P. Productivity changes in Swedish pharmacies 1980–1989: A non-parametric Malmquist approach. J. Prod. Anal. 1992, 3, 85–101. [Google Scholar] [CrossRef]
  26. Egilmez, G.; McAvoy, D. Benchmarking road safety of U.S. states: A DEA-based Malmquist productivity index approach. Accid. Anal. Prev. 2013, 53, 55–64. [Google Scholar] [CrossRef]
  27. Pan, W.T.; Zhuang, M.E.; Zhou, Y.Y.; Yang, J.J. Research on sustainable development and efficiency of China’s E-Agriculture based on a data envelopment analysis-Malmquist model. Technol. Forecast. Soc. Chang. 2021, 162, 120298. [Google Scholar] [CrossRef]
  28. Wang, C.N.; Nguyen, T.L.; Dang, T.T.; Bui, T.H. Performance Evaluation of Fishery Enterprises Using Data Envelopment Analysis- A Malmquist Model. Mathematics 2021, 9, 469. [Google Scholar] [CrossRef]
  29. Bjurek, H. The Malmquist total factor productivity index. Scand. J. Econ. 1996, 98, 303–313. [Google Scholar] [CrossRef]
  30. Yahoo Finance. Available online: https://finance.yahoo.com/ (accessed on 29 June 2021).
  31. Wastetodaymagazine. Available online: https://www.wastetodaymagazine.com/article/waste-todays--top-50-haulers-list/ (accessed on 30 November 2021).
  32. Menikpura, S.N.M.; Gheewala, S.H.; Bonnet, S.; Chiemchaisri, C. Evaluation of the Effect of Recycling on Sustainability of Municipal Solid Waste Management in Thailand. Waste Biomass Valorization 2013, 4, 237–257. [Google Scholar] [CrossRef]
  33. Lohri, C.R.; Camenzind, E.J.; Zurbrügg, C. Financial sustainability in municipal solid waste management—Costs and revenues in Bahir Dar, Ethiopia. Waste Manag. 2014, 34, 542–552. [Google Scholar] [CrossRef] [PubMed] [Green Version]
  34. Cooper, W.W.; Seiford, L.M.; Tone, K. Data Envelopment Analysis-A Comprehensive Text with Models, Applications, References and DEA-Solver Software, 2nd ed.; Springer: Berlin/Heidelberg, Germany, 2006. [Google Scholar]
  35. Thore, S.; Kozmetsky, G.; Phillips, F. DEA of financial statements data: The U.S. computer industry. J. Product. Anal. 1994, 5, 229–248. [Google Scholar] [CrossRef]
  36. Tone, K. Advances in DEA Theory and Applications: With Extensions to Forecasting Models; John Wiley & Sons Ltd.: Hoboken, NJ, USA, 2017. [Google Scholar]
  37. Astuteanalytica. Available online: https://www.astuteanalytica.com/request-toc/waste-management-market (accessed on 5 March 2022).
  38. Tey, J.S.; Goh, K.C.; Kek, S.L.; Goh, H.H. Current practice of waste management system in Malaysia: Towards sustainable waste management. Environ. Eng. Manag. J. 2013, 6, 261–336. [Google Scholar]
  39. Recyclingtoday. Available online: https://www.recyclingtoday.com/article/nestle-veolia-plastic-recycling-cooperation/ (accessed on 12 December 2021).
Figure 1. Projected waste generation by region (millions of tons/year) [5].
Axioms 11 00315 g001
Figure 2. Research process.
Axioms 11 00315 g002
Figure 3. Technical efficiency change in DMUs (catch-up index).
Axioms 11 00315 g003
Figure 4. Technological change in DMUs (frontier-shift index).
Axioms 11 00315 g004
Figure 5. Total factor productivity of DMUs from 2017 to 2020.
Axioms 11 00315 g005
Figure 6. Cumulative catch-up (CCU).
Axioms 11 00315 g006
Figure 7. Cumulative frontier-shift (CFS).
Axioms 11 00315 g007
Figure 8. Cumulative Malmquist index (CMI).
Axioms 11 00315 g008
Figure 9. Adjusted Malmquist index (AMI).
Axioms 11 00315 g009
Table 1. List of waste management companies.
DMUsCompany NameHeadquarters
DMU1 Clean Harbors, Inc. (CLH) USA
DMU2Covanta Holding Corporation (CVA)USA
DMU3Veolia Environment S.A. (VEOEY)France
DMU4Waste Management, Inc. (WM)USA
DMU5Republic Services, Inc. (RSG)USA
DMU6Waste Connections, Inc. (WCN)Canada
DMU7Stericycle, Inc. (SRCL)USA
DMU8Heritage-Crystal Clean, Inc (HCCI)USA
DMU9US Ecology, Inc. (ECOL)USA
Source: Yahoo Finance [30].
Table 2. Efficiency scores and ranks of DMUs.
2017201820192020
ScoreRankScoreRankScoreRankScoreRank
DMU11.06251.08741.09841.1274
DMU20.36190.85880.79280.7998
DMU31.40011.38021.34921.4262
DMU41.31241.33931.21431.2293
DMU50.97480.92270.98971.0157
DMU61.04671.03461.04451.0186
DMU71.31830.07090.09291.0255
DMU81.38621.54111.71611.6801
DMU91.05661.06051.03260.1449
Table 3. Catch-up index over the period 2017–2020.
Catch-up2017 => 20182018 => 20192019 => 2020Average
DMU11.0291921.0126381.0337061.025179
DMU21.1161090.9160790.9905571.007581
DMU31.0005261.0040000.9962421.000256
DMU41.0610000.8594011.0236520.981351
DMU50.9490741.0647161.0255291.013107
DMU60.9924751.0086610.9603400.987158
DMU70.9928570.1901075.3116562.164873
DMU81.0000001.0000001.0000001.000000
DMU91.0366010.9816140.1391620.719126
Average1.0197590.8930241.3867601.099848
Max1.1161091.0647165.3116562.164873
Min0.9490740.1901070.1391620.719126
SD0.0481940.2703051.4995490.410407
Table 4. Frontier-shift index of DMUs from 2017 to 2020.
Frontier2017 => 20182018 => 20192019 => 2020Average
DMU11.0488800.9612870.9650760.991748
DMU20.9872550.9199070.9718540.959672
DMU31.0201741.0223770.7256460.922732
DMU40.9626810.9725620.9393850.958209
DMU51.0275530.9777460.9679950.991098
DMU60.9903370.9636440.8718280.941936
DMU70.6638690.9516090.9819530.865810
DMU81.0117910.9712270.9803340.987784
DMU90.9557490.9303891.0022830.962807
Average0.9631430.9634160.9340390.953533
Max1.0488801.0223771.0022830.991748
Min0.6638690.9199070.7256460.865810
SD0.1162220.0294830.0865800.040263
Table 5. Total factor productivity of DMUs from 2017 to 2020.
Malmquist2017 => 20182018 => 20192019 => 2020Average
DMU11.0794990.9734360.9976051.016847
DMU21.1018840.8427080.9626770.969089
DMU31.0207111.0264660.7229190.923365
DMU41.0214040.8358210.9616040.939610
DMU50.9752241.0410220.9927071.002985
DMU60.9828850.9719890.8372510.930708
DMU70.6591270.1809085.2157982.018611
DMU81.0117910.9712270.9803340.987784
DMU90.9907310.9132830.1394790.681164
Average0.9825840.8618731.3122641.052240
Max1.1018841.0410225.2157982.018611
Min0.6591270.1809080.1394790.681164
SD0.1285420.2653111.4892300.375896
Publisher’s Note: MDPI stays neutral with regard to jurisdictional claims in published maps and institutional affiliations.