
A Novel Integration Method for D Numbers Based on Horizontal Comparison


Abstract
:1. Introduction
2. Preliminaries
2.1. Dempster–Shafer Theory
2.2. D Numbers Theory
3. Limitations and Proposed Method
3.1. Limitations
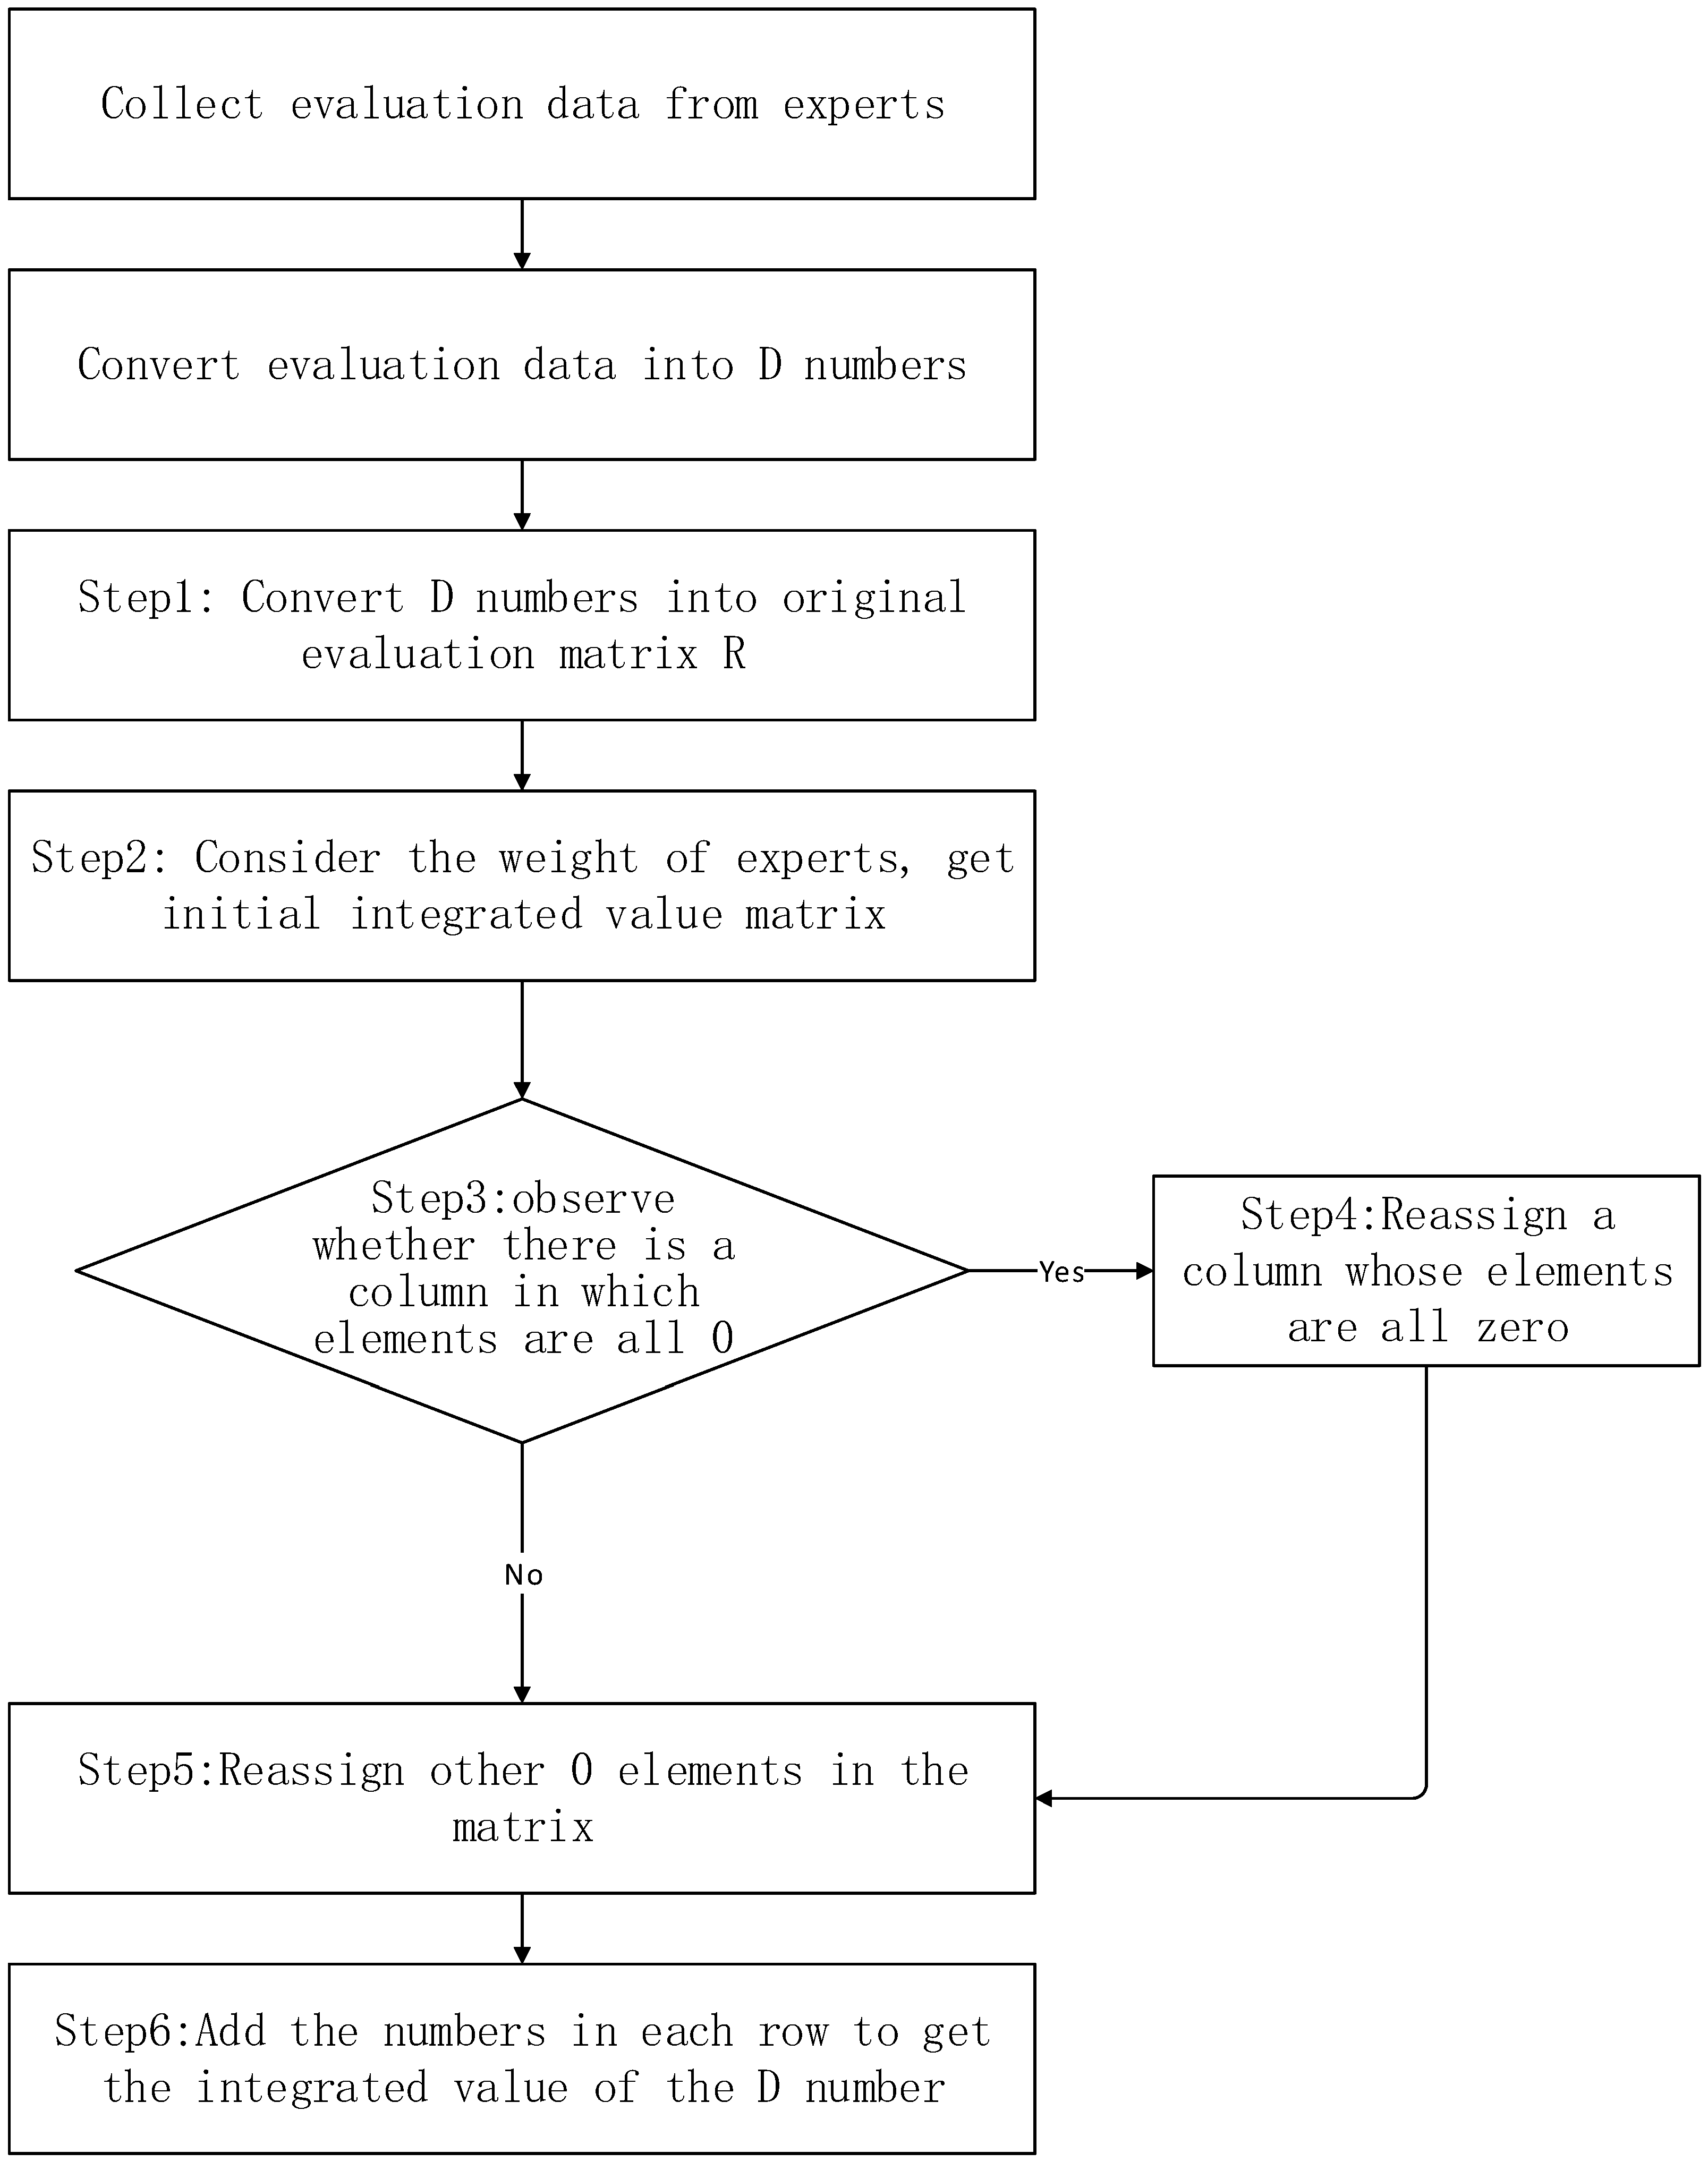
3.2. Proposed Method (Stepwise Comparison and Replacement Integration (SCRI) Method)
4. Applications in MADM
5. Conclusions and Future Work
Author Contributions
Funding
Data Availability Statement
Conflicts of Interest
References
- Hwang, C.L.; Yoon, K. Multiple Attribute Decision Making—Methods and Applications: A State-of-the-Art Survey; Springer: New York, NY, USA, 1981. [Google Scholar]
- Deng, J.L. The control problem of gray systems. Syst. Control. Lett. 1982, 1, 288–294. [Google Scholar]
- Dempster, A.P. Upper and lower probabilities induced by a multivalued mapping. Ann. Math. Stat. 1967, 38, 325–339. [Google Scholar] [CrossRef]
- Shafer, G. A Mathematical Theory of Evidence; Princeton University Press: Princeton, NJ, USA, 1976. [Google Scholar]
- Yager, R.R. Generalized dempster—Shafer structures. IEEE Trans. Fuzzy Syst. 2019, 27, 428–435. [Google Scholar] [CrossRef]
- Zadeh, L.A. Fuzzy sets. Inf. Control. 1965, 8, 338–353. [Google Scholar] [CrossRef] [Green Version]
- Atanassov, K. Intuitionistic fuzzy sets. Fuzzy Sets Syst. 1986, 20, 87–96. [Google Scholar] [CrossRef]
- Yager, R.R.; Reformat, M.; To, N.D. Drawing on the ipad to input fuzzy sets with an application to linguistic data science. Inf. Sci. 2019, 479, 277–291. [Google Scholar] [CrossRef]
- Pawlak, Z. Rough sets. Int. J. Inf. Comput. Sci. 1982, 11, 341–356. [Google Scholar] [CrossRef]
- Xiong, W.; Su, Q.; Li, J. The group decision-making rules based on rough sets on large scale engineering emergency. Syst. Eng. Procedia 2012, 4, 331–337. [Google Scholar] [CrossRef] [Green Version]
- Eisa, M. Improving group decision support systems using rough set. Int. J. Comput. Appl. 2013, 69, 9–13. [Google Scholar] [CrossRef]
- Xiao, F.Y. A new divergence measure for belief functions in D—S evidence theory for multisensor data fusion. Inf. Sci. 2020, 514, 462–483. [Google Scholar] [CrossRef]
- Zhang, H.; Deng, Y. Engine fault diagnosis based on sensor data fusion considering information quality and evidence theory. Adv. Mech. Eng. 2018, 10, 1–10. [Google Scholar] [CrossRef] [Green Version]
- Song, Y.; Wang, X.; Zhu, J.; Lei, L. Sensor dynamic reliability evaluation based on evidence theory and intuitionistic fuzzy sets. Appl. Intell. 2018, 48, 3950–3962. [Google Scholar] [CrossRef]
- Su, X.Y.; Mahadevan, S.; Xu, P.D.; Deng, Y. Dependence Assessment in Human Reliability Analysis Using Evidence Theory and AHP. Risk Anal. 2015, 35, 1296–1316. [Google Scholar] [CrossRef] [PubMed]
- Deng, Y. D numbers: Theory and applications. J. Inf. Comput. Sci. 2012, 9, 2421–2428. [Google Scholar]
- Deng, X.Y.; Hu, Y.; Deng, Y.; Mahadevan, S. Environmental impact assessment based on D numbers. Expert Syst. Appl. 2014, 41, 635–643. [Google Scholar] [CrossRef]
- Deng, X.Y.; Hu, Y.; Deng, Y.; Mahadevan, S. Supplier selection using AHP methodology extended by D numbers. Expert Syst. Appl. 2014, 41, 156–167. [Google Scholar] [CrossRef]
- Wang, N.K.; Liu, F.Y.; Wei, D.J. A modified combination rule for D numbers theory. Math. Probl. Eng. 2016, 2016, 1–10. [Google Scholar] [CrossRef]
- Guan, X.; Liu, H.Q.; Yi, X.; Zhao, J. The improved combination rule of D numbers and its application in radiation source identification. Math. Probl. Eng. 2018, 2018, 6025680. [Google Scholar] [CrossRef] [Green Version]
- Mo, H.M.; Deng, Y. A new MADA methodology based on D numbers. Int. J. Fuzzy Syst. 2018, 20, 2458–2469. [Google Scholar] [CrossRef]
- Li, M.Z.; Hu, Y.; Zhang, Q.; Deng, Y. A novel distance function of D numbers and its application in product engineering. Eng. Appl. Artif. Intell. 2016, 47, 61–67. [Google Scholar] [CrossRef]
- Wang, N.K.; Liu, X.M.; Wei, D.J. A modified D numbers’ integration for multiple attributes decision making. Int. J. Fuzzy Syst. 2018, 20, 104–115. [Google Scholar] [CrossRef]
- Zhou, X.Y.; Deng, X.Y.; Deng, Y.; Mahadevan, S. Dependence assessment in human reliability analysis based on D numbers and AHP. Nucl. Eng. Des. 2017, 313, 243–252. [Google Scholar] [CrossRef]
- Deng, X.Y.; Jiang, W. Evaluating Green Supply Chain Management Practices Under Fuzzy Environment: A Novel Method Based on D Number Theory. Int. J. Fuzzy Syst. 2019, 21, 1389–1402. [Google Scholar] [CrossRef]
- Zhou, X.Y.; Shi, Y.; Deng, X.Y.; Deng, Y. D-DEMATEL: A new method to identify critical success factors in emergency management. Saf. Sci. 2017, 91, 93–104. [Google Scholar] [CrossRef]
- Zong, F.; Wang, L. Evaluation of university scientific research ability based on the output of sci-tech papers: A D-AHP approach. PLoS ONE 2017, 12, e0171437. [Google Scholar] [CrossRef] [PubMed] [Green Version]
- Bian, T.; Zheng, H.; Yin, L.; Deng, Y. Failure mode and effects analysis based on D numbers and topsis. Qual. Reliab. Eng. Int. 2018, 34, 501–515. [Google Scholar] [CrossRef]
- Seiti, H.; Hafezalkotob, A.; Herrera-Viedma, E. A novel linguistic approach for multi-granular information fusion and decision-making using risk-based linguistic D numbers. Inf. Sci. 2020, 530, 43–65. [Google Scholar] [CrossRef]
- Mousavi-Nasab, S.H.; Sotoudeh-Anvari, A. An extension of best-worst method with D numbers: Application in evaluation of renewable energy resources. Sustain. Energy Technol. Assess. 2020, 40, 100771. [Google Scholar] [CrossRef]
- Xiao, F. A novel multi-criteria decision making method for assessing health-care waste treatment technologies based on D numbers. Eng. Appl. Artif. Intell. 2018, 71, 216–225. [Google Scholar] [CrossRef]
- Wang, S.R.; Liu, Y.; Song, F.H.; Xie, X.J.; Yu, D. Research on evaluation system of user experience with online live course platform. IEEE Access 2021, 9, 23863–23875. [Google Scholar] [CrossRef]

| Basic Attribute | Ding Talk | Tencent Classroom | Tencent QQ |
|---|---|---|---|
| Y1 | {(9, 0.2), (8, 0.5), (7, 0.3)} | {(8, 0.5), (7,0.2), (6, 0.2), (5, 0.1)} | {(7, 0.5), (6, 0.2), (5, 0.2), (4,0.1)} |
| Y2 | {(9, 0.2), (8, 0.5), (6, 0.2)} | {(8, 0.2), (7, 0.2), (6, 0.2), (5, 0.2)} | {(8, 0.2), (7, 0.3), (6, 0.1), (5, 0.1)} |
| Y3 | {(9, 0.2), (8, 0.2), (7, 0.3), (6, 0.1)} | {(8, 0.4), (7, 0.3), (6, 0.2)} | {(8, 0.2), (7, 0.4), (5, 0.1)} |
| Y4 | {(8, 0.2), (7, 0.2), (6, 0.4)} | {(8, 0.2), (7, 0.2), (6, 0.6)} | {(7, 0.2), (6, 0.4), (5, 0.2), (4, 0.1)} |
| Y5 | {(9, 0.6), (8, 0.2), (7, 0.2)} | {(8, 0.2), (7, 0.2), (6, 0.1), (5, 0.4)} | {(8, 0.4), (7, 0.2), (5, 0.2)} |
| Y6 | {(7, 0.2), (6, 0.2), (5, 0.1), (4, 0.2)} | {(7, 0.2), (5, 0.4), (4, 0.2)} | {(9, 0.2), (8, 0.2), (7, 0.3), (5, 0.1)} |
| Y7 | {(8, 0.2), (6, 0.2), (5, 0.4)} | {(9, 0.2), (7, 0.2), (6, 0.4)} | {(7, 0.4), (6, 0.2), (5, 0.2)} |
| Y8 | {(9, 0.4), (8, 0.4), (6, 0.2)} | {(9, 0.2), (8, 0.3), (6, 0.2), (5, 0.2)} | {(8, 0.4), (7, 0.1), (5, 0.2), (4, 0.1)} |
| Y9 | {(9, 0.1), (8, 0.4), (6, 0.3)} | {(8, 0.1), (7, 0.6), (6, 0.1)} | {(8, 0.4), (7, 0.3), (4, 0.2)} |
| Y10 | {(9, 0.3), (7, 0.2), (6, 0.4)} | {(8, 0.5), (7, 0.2), (6, 0.2)} | {(9, 0.2), (8, 0.6)} |
| Y11 | {(6, 0.6), (5, 0.2)} | {(8, 0.2), (7, 0.2), (6, 0.2),(4, 0.1), (3, 0.1)} | {(8, 0.4), (6, 0.2), (4, 0.1)} |
| Y12 | {(8, 0.3), (7, 0.4), (5, 0.1)} | {(9, 0.2), (8, 0.2), (6, 0.3), (5, 0.1)} | {(8, 0.3), (7, 0.2), (6, 0.2), (5, 0.1)} |
| Y13 | {(9, 0.4), (8, 0.2), (7, 0.2), (5, 0.2)} | {(8, 0.4), (7, 0.2), (6, 0.2), (5, 0.2)} | {(9, 0.2), (7, 0.4), (6, 0.2)} |
| Y14 | {(9, 0.2), (8, 0.4), (6, 0.3)} | {(7, 0.4), (6, 0.4), (5, 0.2)} | {(8, 0.2), (7, 0.2), (6, 0.2), (5, 0.1), (4, 0.1)} |
| Y15 | { 9, 0.2), (8, 0.4), (7, 0.2), (5, 0.2)} | {(8, 0.2), (7, 0.2), (6, 0.6)} | {(8, 0.2), (7, 0.2), (6, 0.2), (5, 0.4)} |
| Y16 | {(8, 0.4), (7, 0.1), (6, 0.4)} | {(8, 0.3), (7, 0.2), (6, 0.4)} | {(7, 0.5), (6, 0.1),(5, 0.3)} |
| Y2 | {(9, 0.2), (8, 0.5), (6, 0.2)} | {(8, 0.2), (7, 0.2), (6, 0.2), (5, 0.2)} | {(8, 0.2), (7, 0.3), (6, 0.1), (5, 0.1)} |
| Basic Attribute | Ding Talk | Tencent Classroom | Tencent QQ |
|---|---|---|---|
| Y1 | 7.9000 | 7.1000 | 6.1000 |
| Y2 | 7.8286 | 6.4714 | 6.5857 |
| Y3 | 7.4857 | 7.2571 | 6.8000 |
| Y4 | 6.4000 | 6.6000 | 5.8000 |
| Y5 | 8.4000 | 6.3000 | 6.8000 |
| Y6 | 5.4143 | 5.2857 | 7.5714 |
| Y7 | 6.0000 | 7.0000 | 6.2500 |
| Y8 | 8.0000 | 7.0000 | 6.4000 |
| Y9 | 7.0375 | 6.7000 | 6.8125 |
| Y10 | 7.2375 | 7.3500 | 8.0250 |
| Y11 | 5.7714 | 6.2143 | 6.4714 |
| Y12 | 7.1250 | 7.1250 | 6.8750 |
| Y13 | 7.6000 | 6.8000 | 6.8000 |
| Y14 | 7.3000 | 6.2000 | 6.1000 |
| Y15 | 7.4000 | 6.6000 | 6.2000 |
| Y16 | 7.0000 | 6.8889 | 6.2222 |
| Primary Indicators | Ding Talk | Tencent Classroom | Tencent QQ |
|---|---|---|---|
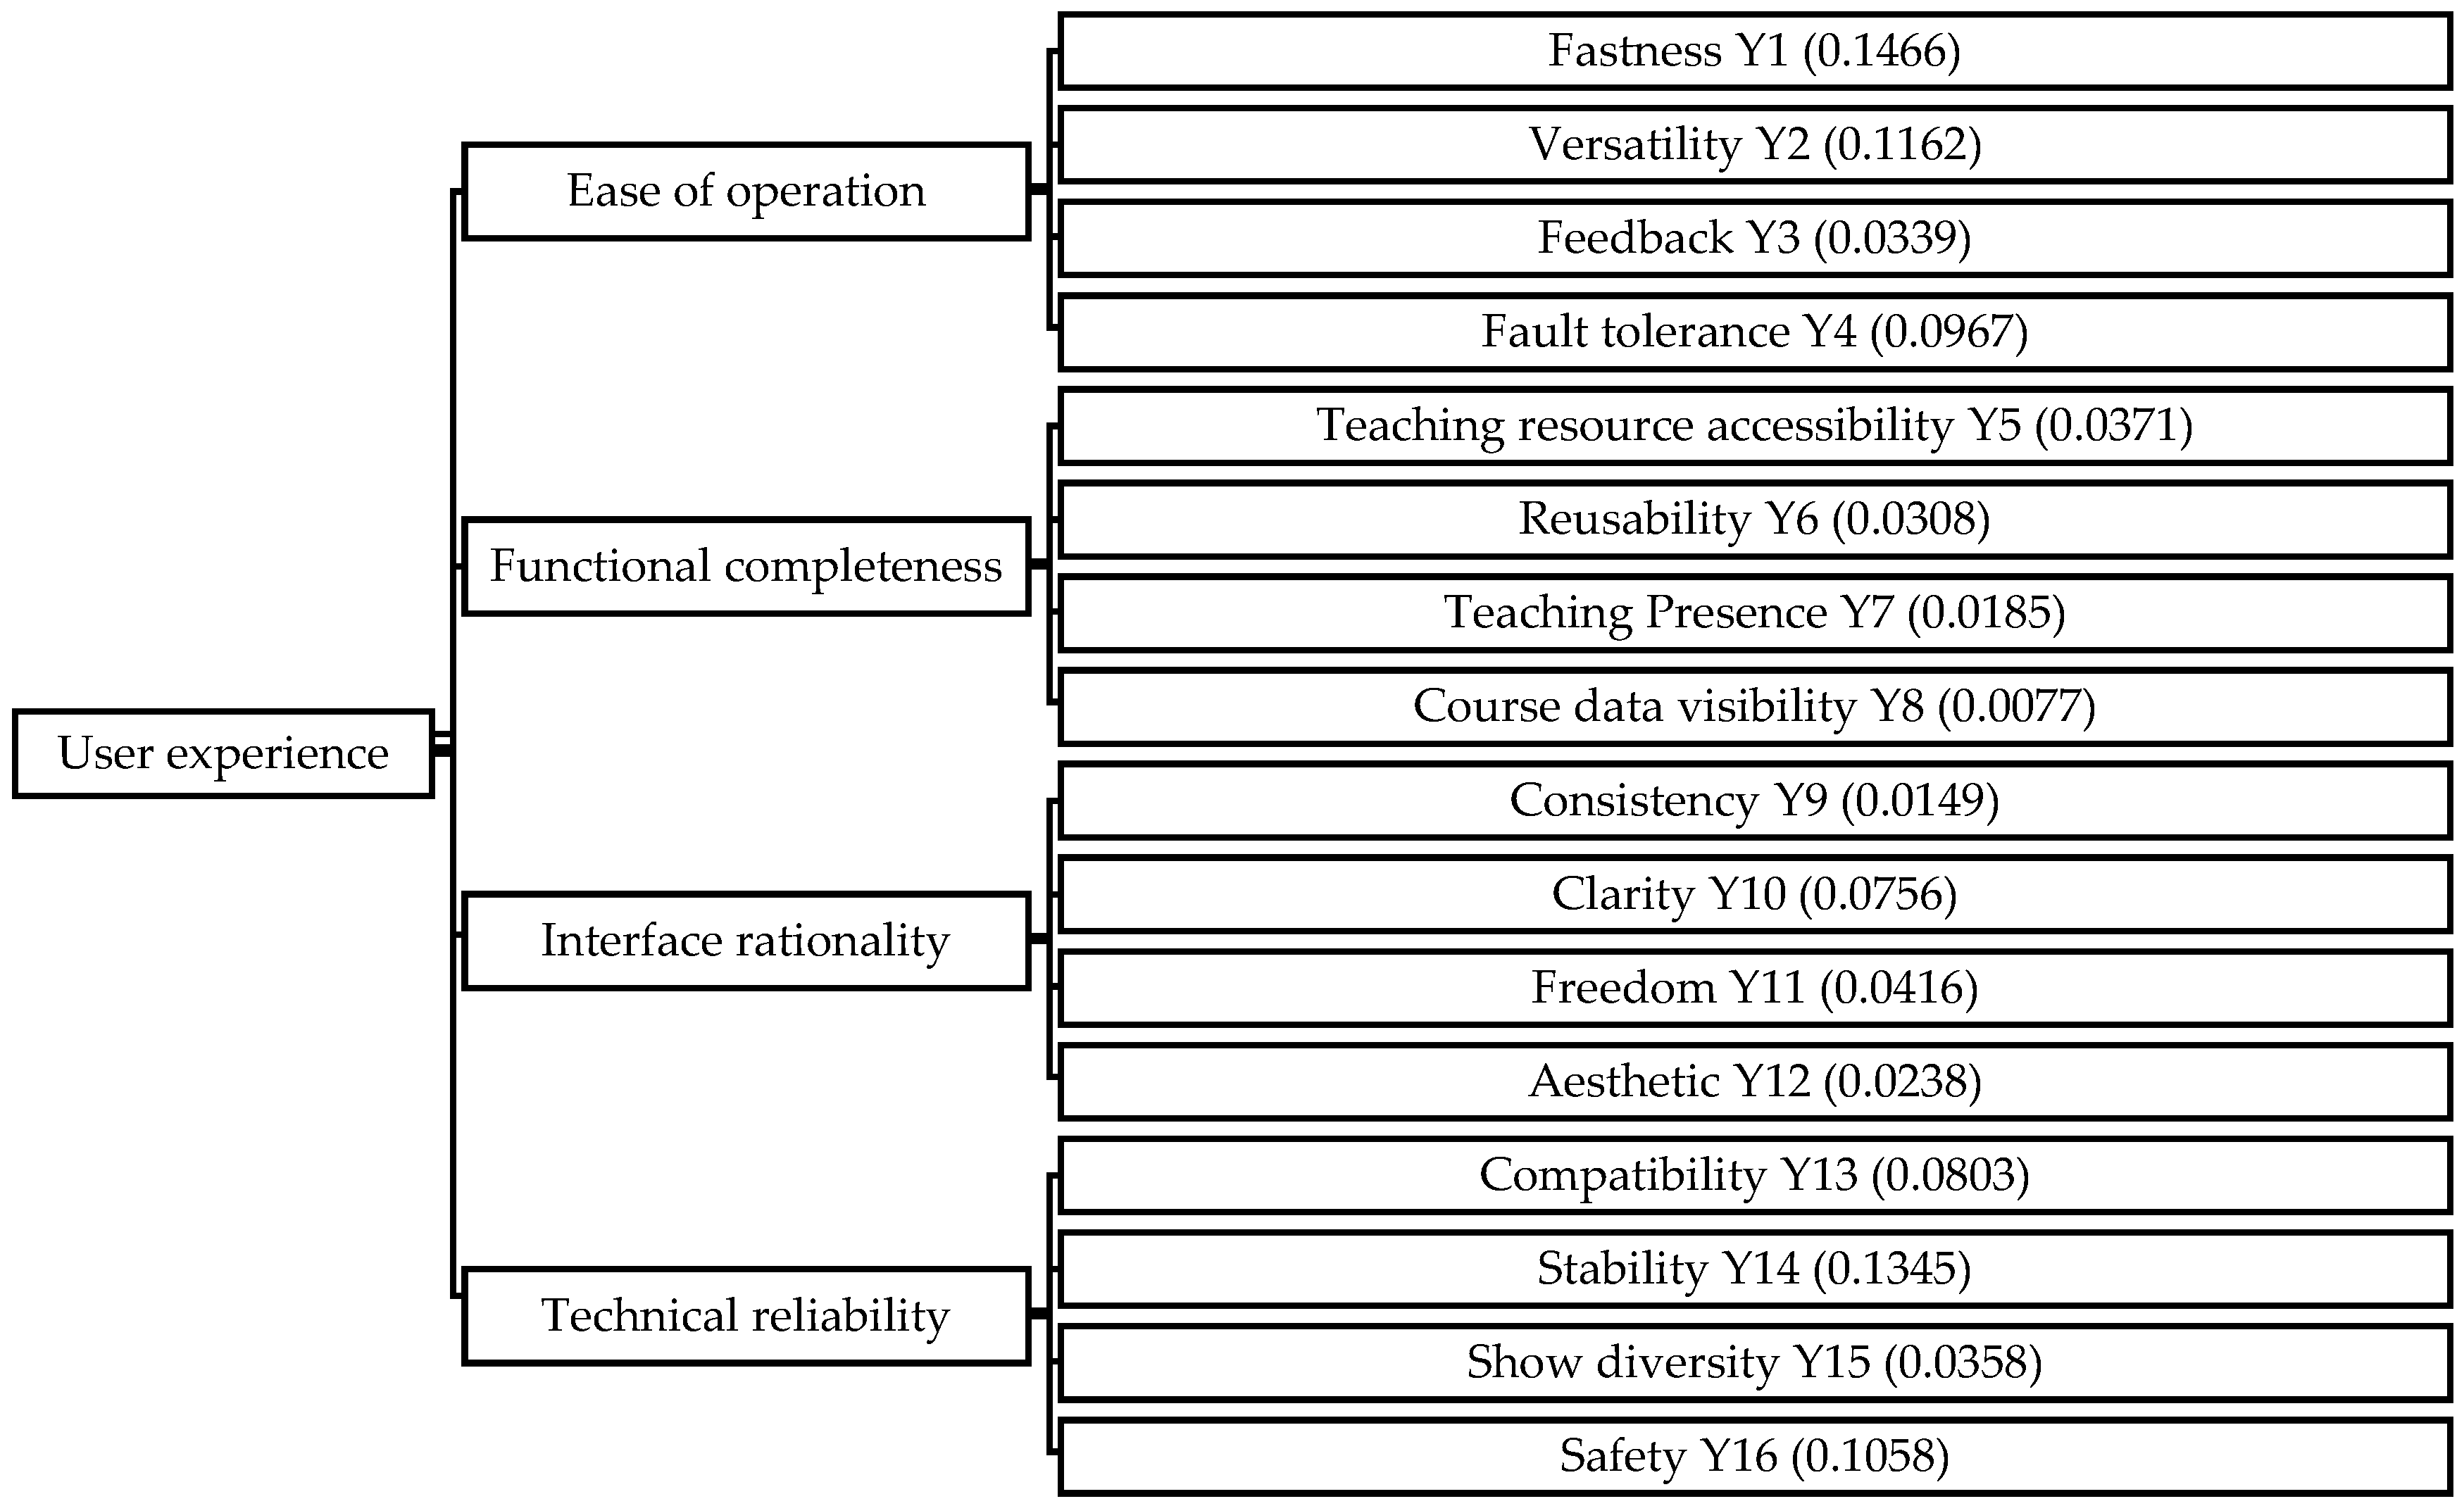
| Ease of operation | 2.9405 | 2.6771 | 2.4509 |
| Functional completeness | 0.6510 | 0.5799 | 0.6504 |
| Interface rationality | 1.0617 | 1.0836 | 1.1410 |
| Technical reliability | 2.5977 | 2.3451 | 2.2468 |
| Aggregate score | 7.2508 | 6.6856 | 6.4891 |
| ranking | 1 | 2 | 3 |
Publisher’s Note: MDPI stays neutral with regard to jurisdictional claims in published maps and institutional affiliations. |
© 2021 by the authors. Licensee MDPI, Basel, Switzerland. This article is an open access article distributed under the terms and conditions of the Creative Commons Attribution (CC BY) license (https://creativecommons.org/licenses/by/4.0/).
Share and Cite
Hou, H.; Zhao, C. A Novel Integration Method for D Numbers Based on Horizontal Comparison. Axioms 2021, 10, 312. https://doi.org/10.3390/axioms10040312
Hou H, Zhao C. A Novel Integration Method for D Numbers Based on Horizontal Comparison. Axioms. 2021; 10(4):312. https://doi.org/10.3390/axioms10040312
Chicago/Turabian StyleHou, Haiyang, and Chunyu Zhao. 2021. "A Novel Integration Method for D Numbers Based on Horizontal Comparison" Axioms 10, no. 4: 312. https://doi.org/10.3390/axioms10040312
APA StyleHou, H., & Zhao, C. (2021). A Novel Integration Method for D Numbers Based on Horizontal Comparison. Axioms, 10(4), 312. https://doi.org/10.3390/axioms10040312