Abstract
During the months of the COVID-19 epidemic, the number of processing and manufacturing agricultural products enterprises in Vietnam faced many difficulties in the consumption of agricultural products, even when they were unable to sell. Therefore, the enterprises are more and more difficult. Many enterprises are not strong enough to restore production, so it is necessary to find solutions to overcome this difficult period. In this research, the author used the application of modern statistical techniques, along with the Grey method, to predict enterprises’ business results in the future, combined with the model of Super-slacks-based-measure efficiency (Super-SBM) to help businesses select the right partners in a supply chain to achieve their business goals. By our proposed approach, the selected solution (AG6 combined with AG10) should be implemented in the future to upgrade efficiency to help stabilize output and raise productivity; thus, both parties are able not only to improve their product quality but also achieve business goals and sustainable development. In fact, it is necessary to further this study, in combination with these factors and other quantitative models, to give investors a more comprehensive view, helping them to make the right decisions and appropriately develop their businesses and social and economic development.
1. Introduction
Currently, the number of businesses processing and manufacturing agricultural products in Vietnam is large; according to the Ministry of Industry and Trade, the number of food manufacturing and processing enterprises, food businesses, and fishery account for 14.85% of overall production [1]. Moreover, recently the Vietnamese government adopted the policy of opening free trade with most countries in the world. Vietnam has attracted many foreign investors to invest in production and food processing in the southern region; foreign investors have invested in nearly 30,827 enterprises, accounting for 58.4% of production [2]. Since 2000, Vietnam’s economy achieved rapid growth, with an average annual rate of about 6.5% per year. Vietnam’s GDP per capita has increased steadily (as Figure 1). Average income, as measured by purchasing power, increased from USD 2562 in 2000, to USD 6172 in 2017 [3].
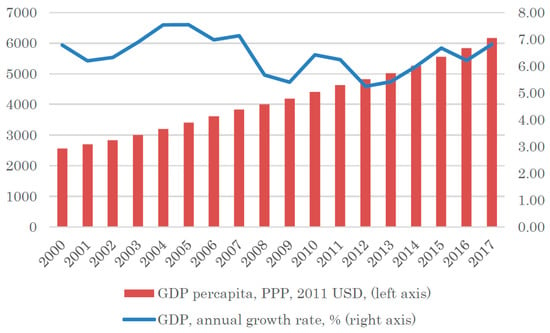
Figure 1.
GDP growth rate and GDP per capita (Data from: https://lienvietpostbank.com.vn/ [3] (accessed on 26 June 2020)).
Vietnam is a country with a developing economy, urbanization, a young population, and a fast population growth rate. These are the main stimuli to the growth of agriculture. The younger population makes processed food more advantageous to be easily accepted and is a leading factor in the growing demand for this type of product. Pandemics such as bird flu and better health education have made people in this country more aware of health problems. Therefore, modern packaged products and retail channels are expected to develop in Vietnam. Supermarket sales reached the highest value, accounting for about 70% of market consumption. According to the survey of the organization Business Monitor International (BMI), in 2015 in Vietnam, there were over 132 emporiums and 724 large supermarkets, with average sales reaching U.S.$102 billion [4].
According to statistics, in the period 2000–2017, the agricultural economy that contributed to the GDP decreased gradually from 24.5% in 2000 to 15.3% in 2017 (as Figure 2). The impact of agriculture moving to other industries and services gradually decreased the GDP from 62.5% in 2000 to 40% in 2017 [3].
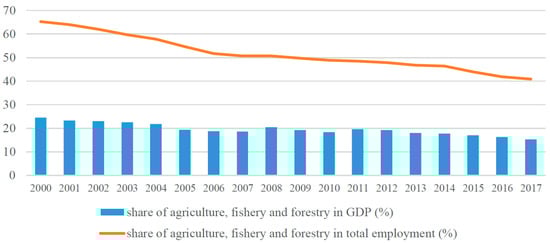
Figure 2.
Share of agriculture in the GDP and employment (Data from: https://lienvietpostbank.com.vn/ [3], accessed on 26 June 2020).
Besides changing the labor structure, total investment in agriculture also decreased. Specifically, in the period of 2005–2016, the total investment capital decreased from 7.5% in 2005 to 6% in 2016 (as Figure 3).
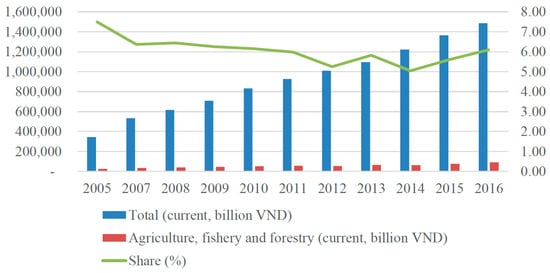
Figure 3.
Realized investment in agriculture (Data from: https://lienvietpostbank.com.vn/ [3], accessed on 26 June 2020).
The situation now is much more serious; the COVID-19 epidemic is seriously impacting Vietnam’s economy, especially agricultural products—one of Vietnam’s key export sectors. In 2019, the export value of major agricultural products reached 18.5 billion USD, down 5.3% compared to 2018. Rice exports reached 6.34 million tons and 2.79 billion USD, up 3.9% in volume but down 9.7% in value compared to 2018. Similarly, pepper increased by more than 20% in volume but decreased by nearly 6% in value; cashew nuts increased by 14% in volume but decreased by nearly 10% in value. According to statistics, the impact of the COVID-19 on enterprises producing and processing agricultural products of Vietnam is very serious (as Figure 4).
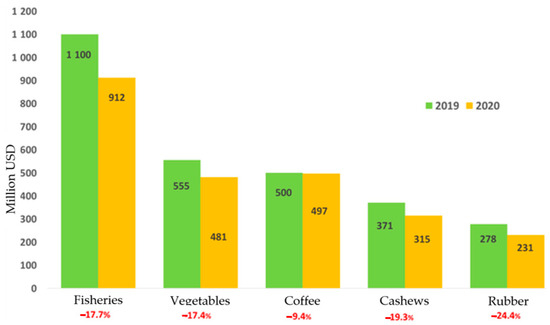
Figure 4.
Vietnam’s total exports of agricultural products were affected by COVID–19 [3].
Meanwhile, the United States, European Union, and Asian countries such as Korea are the main export markets of food products of Vietnam. With trade agreements, such as the ASEAN-South Korea was signed in 2007, Vietnam has given every policy condition for Korean enterprises so that they can invest in Vietnam. Several leading retailers in Korea also officially penetrate the Vietnamese market, such as the Lotte Group, retail Group E-mart, etc. [3].
The growth speed of food consumption is higher than that of the whole country. Specifically, according to the Bureau of Statistics, sales of food recorded a growth of 13.1% in the first six months of 2016 and 14.8% in 2015, which is higher than the growth in retail sales of the whole country (respectively, 9.8% and 10.6%) [3]. Regarding the consumer price index in the first six months of 2016, the prices of food and catering services increased 2.03%, and beverages and tobacco increased 2.37%, which is higher than the consumer price index of the country (1.72%) (as Table 1). This shows that demand for food is quite positive, while the overall index tends to go down [3].

Table 1.
Data and forecasting growth consumption food.
Now, Vietnamese business enterprises processing and manufacturing agricultural products are doing business and competing in a globalized environment with a lot of changes, which requires an appropriate development strategy to exploit opportunities effectively and adequately handle posed challenges in order to ensure high efficiency and sustainable development. Enterprises should seize opportunities and define areas for investing, developing, and finding solutions to take effective advantage of the existing resources of the company. They can develop the sustainable competitiveness in the areas of their operations and create synergy in the development of the entire sectors and businesses. It is impossible to act single-handedly in severe trade cooperation; enterprises have to cooperate and ally with each other to develop together.
Facing the difficult situation of the processing and trading of agricultural products of businesses in Vietnam caused by COVID-19, the authors combined the data envelopment analysis (DEA) and Grey theory to help businesses find the right partners in the supply chain for companies to solve the problems of finding suppliers and finding customers to ensure that businesses overcome the current difficulties and achieve sustainable development in the future (as Figure 5).
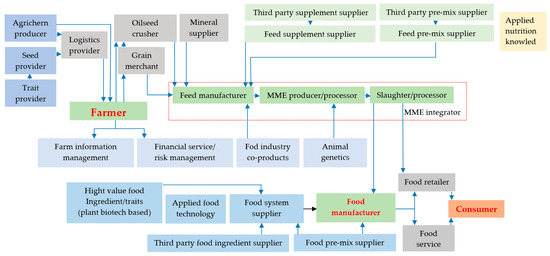
Figure 5.
Total food supply chain (Source: Bruno Walter Castro-Karney [5]).
In fact, there are many methods to choose partners in the supply chain or strategic alliance. In the past, many researchers in the world used the hybrid DEA and GM (1,1) model to research and implement strategic alliances for many businesses and get good results. In 2004, Kauser and Shaw used the DEA and GM (1,1) models to conduct an empirical investigation of strategic alliance agreements between the United Kingdom of Great Britain and Northern Ireland companies and their European, Japanese, and United States of America partners [6]. The results of this study shed light on the international strategic alliance of the United Kingdom of Great Britain and Northern Ireland companies and identified the goals and motives of the international alliance strategy. In 2008, Chia-Nan Wang and Ya-Ru Lee combined hybrid DEA and GM (1,1) models to evaluate efficiency and solve supply chain problems for electronics companies in Taiwan [7]. In 2009, Lin Chin-Tsai, Hwang Shiuh-Nan, and Chan Chia-Ho used the combined DEA’s CCR model and Grey model to select partners for companies in the manufacturing industry of Light Emitting Diode [8]. In 2016, Chia-Nan Wang and Xuan-Tho Nguyen combined DEA and GM (1,1) models to study and evaluate strategic alliances for automobile manufacturers [9]. In 2017, Chia-Nan Wang and Han-Khanh Nguyen combined DEA and the Grey theory models to find a solution to enhance urban development quality [10].
Besides that, there exist much research in the area of partner selection in a supply chain [11,12,13]: In 2000, Feng Wei-dong, Chen Jian, and Zhao Chunjun studied partner selection processes and optimization models for virtual corporations based on genetic algorithms [14]. In 2006, Sheng-Lin Chang, Reay-Chen Wang, and Shih-Yuan Wangahave applied fuzzy linguistic quantifiers to select supply chain partners at different phases of the product life cycle [15].
2. Methodology
In this study, the authors used the Grey system theory to predict the business situation of agricultural production and processing companies in Vietnam in the period of 2020–2023. This was combined with the results of the evaluation of production and business efficiency of these businesses in the period of 2016–2019. From there, the authors propose solutions to help businesses overcome the difficult period due to the COVID-19 pandemic to promote sustainable development in the future.
2.1. Grey Forecasting Model
The Grey system theory, founded in 1982 by Julong Deng, is a new approach that focuses on the study of uncertainty information systems with a small sample size. Grey system theory refers to uncertain information systems with partly known information through data collection or availability. Thus, the development of systematic behavior of businesses and the law can be described and accurately monitored. The applications of the Grey system theory are applied. Officially in 1982, Systems & Control Letters, an international Dutch magazine, published its first paper on the Grey system theory, “Control Issues of Grey Systems,” by Julong Deng [16]. Since then, successful applications in many areas have aroused the attention of researchers around the world [17,18,19,20,21,22].
The process of GM (1,1) prediction in this study is shown in Figure 6:
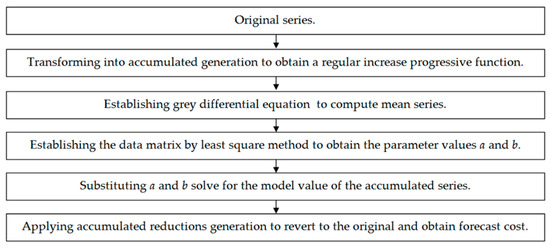
Figure 6.
The process of grey prediction (Data from: http://citeseerx.ist.psu.edu/ [23,24], accessed on 26 June 2020).
Assessment of forecast errors:
To evaluate the accuracy of the forecast results, the authors use the mean absolute percent error (MAPE), which is a tool to measure the exact value in statistics to identify Grey performance models with good performance. The smaller the MAPE, the closer the forecast value is to the actual value [25].
where:
- n is the number of fitted points;
- Ai is the actual value;
- Fi is the forecast value.
- Σ is summation notation (the absolute value is summed for every forecasted point in time).
MAPE divided into four ranks as Table 2 shows.
Table 2.
The grades of MAPE.
2.2. Nonradial Super Efficiency Model (Super–SBM)
DEA analysis is a tool used in the analysis of the performance of the enterprises. The DEA approach applies and develops the integration of linear mathematical models into economic models [26,27]. This method relies on past business data of the enterprise to construct the production boundary in the nonparametric plane (production boundary). People use this production line to calculate and evaluate the performance of a business. Now, researchers are beginning to study a number of extended DEA analysis models that address limitations of the DEA as well as its widespread practice in economic analysis around the world.
In this section, the author use the Super-SBM model. The Super-SBM model is given by the following equation [28]:
Suppose that (p*, λ*, ) is the optimal condition of SBM, and is the SBM-efficient of DMU. When p* = 1, (or there is no excessive input and a short falling output). Hence, a super-efficiency model was introduced for ranking DMUs, and it was defined by the following formula [28]:
Suppose the denominator is 1 so that the objective function is an orientation input of the Super-SBM model. The obtained feedback value of the objective function is larger or equivalent to 1. It is straightforward to realize that the inputs are positive; however, the outputs are able to become a negative value. The proper solution to solve this problem is to use the DEA-Solver Pro 4.1 manual, as follows:
Suppose . It has defined by [28]:
If there is no positive component in the output r, it becomes . The element is used instead of the following, while the is unchanged [28]:
When , the element is:
When , the element becomes:
Here, B represents a large positive value; in the DEA-Solver, the value of B is about 100.
The denominator is certainly lower than , and it increases with the decrease of the distance and vice versa. Hence, this model significantly affects the nonpositive output value. The obtained score is constant, and it is unidimensional to the units of measurement.
3. Data Description
3.1. DMUs Collection
After researching the Vietnam food and beverage industry, the authors discovered 14 companies from the General Statistics Office’s website [29]. The synopsis is shown in Table 3.
Table 3.
Companies’ names.
3.2. Inputs/Outputs Collection
Selecting the analytical elements in the DEA is important because it directly influences the results of the research and analysis as well as the study conclusions. The factors selected for the analysis must ensure the comprehensiveness of the phenomena and events in the study. Factors are only used when and only if they clarify relationships and dependencies between the research phenomena and hypothetical representations, i.e., the hypotheses test, to measure the efficiency adequately and apply our research on the Grey forecasting model and DEA.
Based on literature review, in this paper, the authors choose four inputs and two outputs:
Inputs
- (1)
- Total assets (IP1): The sum of non-current and current assets, and this total should equal the sum of stockholders’ equity and total liabilities combined.
- (2)
- Equity (IP2): The source of capital contributed by business owners.
- (3)
- Cost of goods sold (IP3): The expenses to create one finished product.
- (4)
- Total Operating Expenses (IP4): Total operating expenses of an enterprise are those incurred in connection with production and business activities in a fiscal year, including operating expenses and other expenses.
Outputs
- (1)
- Net sales (OP1): The total value achieved by the sale of goods, products, supplying employees, and services that customers bring.
- (2)
- Profit after tax corporate income (OP2): Reflects the total real after-tax profit from a company’s business activities (after deducting income taxes) incurring in the reporting year.
The inputs and outputs shown above reflect the whole costs and profits of the business; they are the basis of the calculation, analysis, and accurate assessment in the research. The authors show the realistic data in Table 4, Table 5, Table 6 and Table 7 from 2016 to 2019 (currency unit 1000 USD).
Table 4.
Data in 2016 (Unit: 1000 USD).
Table 5.
Data in 2017 (Unit: 1000 USD).
Table 6.
Data in 2018 (Unit: 1000 USD).
Table 7.
Data in 2019 (Unit: 1000 USD).
4. Empirical Results
4.1. Forecasting Results
The GM (1,1) is utilized in this part; the authors used a factor IP1 of AG4 (as Table 8) to explain as follows.
Table 8.
Data of AG4 2016–2019 (Unit: 1000 USD).
First, create the original series:
- X(0) = (24,192.34; 27,012.32; 31,631.81; 37,176.16)
Then, perform the accumulated generating operation (AGO):
- x(1)(1) = x(0)(1) = 24,192.34
- x(1)(2) = x(0)(1) + x(0)(2) = 51,204.66
- x(1)(3) = x(1)(2) + x(0)(3) = 82,836.47
- x(1)(4) = x(1)(3) + x(0)(4) = 120,012.62
Then, create the different equation of GM (1,1).
To find the Z(1) series, the following mean obtained by the mean equation is:
Then, solve equations:
The primitive series values are inserted into the equation below to find a, b:
Then, convert to matrices as follows:
Let
Then, use the least-squares method to find a and b:
Then, use a, b to create the whitening equation of the differential equation:
Then, find the prediction model from the equation:
Then, substitute the values of k into the equation:
| k = 0; | Χ(1)(1) = 24,192.34 | k = 4; | Χ(1)(5) = 163,212.83 |
| k = 1; | Χ(1)(2) = 51,120.30 | k = 5; | Χ(1)(6) = 214,187.38 |
| k = 2; | Χ(1)(3) = 82,706.04 | k = 6; | Χ(1)(7) = 273,979.07 |
| k = 3; | Χ(1)(4) = 119,755.21 | k = 7; | Χ(1)(8) = 344,113.02 |
Then, derive the predicted value of the original series according to the accumulated generating operation as follows:
- – Forecasted for 2020.
- – Forecasted for 2021.
- – Forecasted for 2022.
- – Forecasted for 2023.
Using the same above process, the authors have results of forecasted data, as shown in Table 9, Table 10, Table 11 and Table 12.
Table 9.
Data in 2020 (Unit: 1000 USD).
Table 10.
Data in 2021 (Unit: 1000 USD).
Table 11.
Data in 2022 (Unit: 1000 USD).
Table 12.
Data in 2023 (Unit: 1000 USD).
Evaluating the results of the forecast is important. The forecasting accuracy not only reflects choosing the right method but also directly affects the results of a decision. In this study, the MAPE was used to evaluate the accuracy of forecasting and is shown in Table 13.
Table 13.
MAPE results.
Table 13 indicated that the forecasting value of AGs are good because the MAPE average of all 14 AGs is 3.64% (less than 10%), which confirms that the GM (1,1) model is suitable in this case study. Therefore, this means that the results in Table 9, Table 10, Table 11 and Table 12 have good reliability.
4.2. Pearson Correlation
The standard of conventional DEA models cannot be employed with negative data. In this paper, the Super-SBM is employed to show that an efficiency ranking can be provided for each efficient unit in comparison with other DMUs. Before analyzing the DEA, it is important to ensure that the relationship between inputs and outputs is isotropic [30]. In this study, the authors used Pearson correlation analysis to see if our data were consistent with the DEA assumption. The correlation coefficient is always from (−1) to (+1). When the correlation coefficient is near (+/−1), the relationship is close to the perfect linear relationship.
The results in Table 14 show that a highly positive correlation complies with the prerequisite condition of the DEA model and can be used for analysis of the DEA calculations.
Table 14.
Correlation of inputs and outputs.
4.3. Analysis Alliance
4.3.1. Analysis before Alliance
The results come from the Super SBM-I-V by using the actual data of 2019 to assess the business situation of all DMUs before alliances. This result will be the basis for us to select the target DMU (the results are presented in Table 15).
Table 15.
Rank and score before alliances.
4.3.2. Analysis after Alliance
Here, based on score and ranking of all AGs in 2019, the authors set up AG10 (Mechanics Construction and Foodstuff Joint–StockCompany, Tan An City, Vietnam) as the target AG for strategic alliance. In 2019, AG10Score = 0.8770 < 1; AG10Rank = 11 (11/14 AGs). This demonstrates an inadequate result in their business in this year. Therefore, they should enhance efficiency via alliance models in the future. To implement our empirical research, the authors combine AG10 with the rest of the AGs and use the Super-SBM model (DEA-Solver Pro 8.0) to calculate 27 AGs. Score and ranking of all AGs and virtual alliances are in shown in Table 16.
Table 16.
Performance ranking of virtual.
In this research, AG10 is set up as the target company, which was ranked as 11th in comparison with the other 14 AGs in 2019. AG10, founded in 2005, is now a supplier of input fuels to leading food production companies in the country with a high market share and growth. AG10 is headquartered in the center of the southeastern provinces of rice so it has the advantage of purchasing high-quality, cheap rice in the region. In addition, AG10 is also an enterprise specializing in manufacturing, processing, importing, and exporting, as well as domestic consumption of food products, agricultural products, packaging of all kinds, food processing machinery, trading in goods, and transportation services.
Based on the results in Table 16, the combination of AG10 and other agro-processing enterprises is divided into two main groups as follows:
Group 1: This group is an alliance between AG10 and businesses processing and producing agricultural products that bring good effects to the parties when joining the alliance. The enterprises in this group show that the alliance in this period creates the strength for businesses, and ensures the supply of raw materials, ensures the consumption of output products for businesses, and creates close cohesion of all parties in the supply chain of the manufacturing and processing of agricultural products. This group includes the following combinations: AG7+AG10, AG6+AG10, AG4+AG10, AG13+AG10, AG11+AG10 (as shown in Table 17).
Table 17.
The good alliances cooperative.
Group 2: In this group, there are seven AGs combined with AG10; no progress happens after this alliance. Thus, these combinations will not be a priority when selecting strategic alliance partners in the future. This group includes AG2 + AG10, AG1 + AG10, AG8 + AG10, AG5 + AG10, AG14 + AG10, AG9 + AG10, and AG12 + AG10, which are shown in Table 18.
Table 18.
The inappropriate alliances.
4.4. Partner Alliance Selection
The results from Table 16 and Table 17 show AG7 + AG10, AG6 + AG10, AG4 + AG10, AG13 + AG10, and AG11 + AG10 to be a good result. However, not all of these companies are willing to cooperate and have an alliance with AG10, as it depends on many other factors, such as the product and business sector of the companies that are not really suitable with AG10. In particular, AG6 (Dabaco Group, Bac Ninh, Vietnam), RankAG6 = 4, ScoreAG6 = 1.5029 is shown to be an alliance with AG10 and give a good effect.
The AG6 (Dabaco Group) is a multidisciplinary corporation, in which the main sectors are animal-feed production, livestock breeding, poultry, and food processing. The Dabaco Group is one of the ten biggest feed mills in Vietnam. Currently, the Dabaco Group has six feed mills with a total capacity of 85 tons per hour, one of which specializes in producing fish feed.
Thus, in the supply chain (Figure 7): AG10 is now a supplier of input fuels to leading food production companies in the country with a high market share and growth. When it has an alliance strategy with AG6, it becomes the supplier of input fuels for AG6, reducing the intermediate costs and lowering production costs. In fact, the last time the seafood export market was facing many difficulties such as constantly fluctuating raw material prices and very limited output, the link between AG6 and AG10 in the supply chain became the optimal solution. One side offers a stable supplier, good quality, and low cost. The other side offers a huge consumer base. Therefore, applying an alliance strategy will increase sales and profits as better growth opportunities. Once stable livestock inputs help stabilize output and raise productivity, both parties will be able not only to improve their product quality but also to achieve business goals and sustainable development.
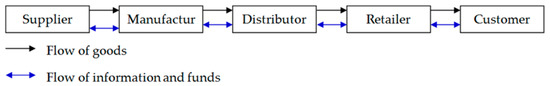
Figure 7.
The basic supply chain (Adapted from: https://www.mdpi.com/2071-1050/11/20/5751 [31], accessed on 26 June 2020).
Thus, AG6+AG10 should incorporate in the future to upgrade their efficiency business. Thus, this alliance cooperative will be first priority when choosing an alliance cooperative. This association has supported enterprises to cooperate to make new products with reasonable costs and help businesses engage in coalitions to overcome business difficulties more easily, thus promoting their sale of goods. In actual production, the implementation of the alliance between AG6 and AG10 will help ensure that the production situation is uninterrupted. AG10 will be a full supplier of key raw materials for AG6, helping AG6 stabilize the production situation and improve business efficiency for the business. On the other hand, AG10 will then ensure the output for businesses thereby strengthening its position in the market. Therefore, this alliance facilitates businesses to achieve the strategic goals of each business.
In a new era of globalization, the alliance is a smart strategy; when competitiveness is getting fiercer, it helps companies reduce risk and penetrate into the market more easily. However, to make the strategic alliance successful is a major challenge. For enterprises desiring to increase operational benefits, strategic alliance is not the only option. Implementing a strategic alliance can lead to lower competitiveness or turn large enterprises into bigger businesses or even smaller ones. For businesses owning fixed assets, capital and operating costs are not guaranteed to possess more efficiency. Businesses want to gain competitiveness; thus, it is not necessary to make an alliance with the best companies in the industry. Small businesses want to form strategic alliances with large enterprises; they must have the unique ability to be recognized by others.
5. Conclusions
This research provides solutions for determining partner selection in a supply chain. Hybrid DEA and GM (1,1) models were used to help businesses determine the partner selection in a supply chain for their company. The chosen solution was suitable and good for strategic enterprises to make the best of their business goals and possibly exploit the opportunities of the environment, address challenges, and take advantage of the capacity of the agriculture industry in Vietnam. Managers can rely on the study results to determine overall strategic decisions for their businesses; industry and trade ministries can also utilize the research results to develop appropriate strategies to make the food beverage industry develop perfectly in modernization and sustainability, thus producing large-scale commodities on the basis of promoting the comparative advantages; apply science and technology to increase productivity, quality, efficiency, and competitiveness; firmly ensure national food security both immediately and in the long term; meet diverse needs of domestic and export goods; improve the efficiency of using land, water, labor, and capital; and raise incomes and living standards for workers.
The results of this study show that the combination of a Hybrid DEA and GM (1,1) model can help businesses producing and processing agricultural products in Vietnam choose the right partner to overcome the period affected by COVID-19 and ensure future sustainable development.
Regarding limitations of this study, in fact, there are many other factors of the supply chain that affect alliances, namely: weather factors, seasonal factors, government policies. Another limitation is that study only focuses on quantitative models.
In fact, it is necessary to further this study, in combination with these factors and other quantitative models, to give investors a more comprehensive view, helping them to make the right decisions and appropriately develop their businesses and social and economic development.
Funding
This research received no external funding.
Institutional Review Board Statement
Not applicable.
Informed Consent Statement
Not applicable.
Data Availability Statement
Data available in a publicly accessible repository.
Conflicts of Interest
The authors declare no conflict of interest.
References
- General Statistics Office. Social and Economic Situation Report of Quarter IV and 2020. Available online: https://www.gso.gov.vn/ (accessed on 10 May 2021).
- Dong Son. More Than 38 Billion USD Invested in Vietnam. Available online: https://doisong.vn/ (accessed on 26 June 2020).
- Report Food-Beverages Production Processing Industry and Expansion Proposal to Grant Credit Sector in Lienviet Postbank. Available online: http://research.lienvietpostbank.com.vn (accessed on 26 June 2020).
- Supermarkets in Vietnam Will Double in the Next 5 Years. Available online: http://nhipcaudautu.vn (accessed on 27 June 2020).
- Castro-Karney, B.W. Reframing Real Food with Supply Chains. Available online: https://courses.washington.edu/ (accessed on 27 June 2020).
- Kauser, S.; Shaw, V. International Strategic Alliances: Objectives, motives and success. J. Glob. Mark. 2004, 17, 7–43. [Google Scholar] [CrossRef]
- Wang, C.-N.; Lee, Y.-R. GM (1, 1) and DEA Application Model for Strategic Alliance in Taiwan. In Proceedings of the 2008 Eighth International Conference on Intelligent Systems Design and Applications, Kaohsiung, Taiwan, 26–28 November 2008. [Google Scholar]
- Tsai, L.C.; Nan, H.S.; Ho, C.C. A Forecasting Model of Data Envelopment Analysis Integrate GM(1,1) with CCR Model. J. Grey Syst. 2009, 21, 337–350. [Google Scholar]
- Wang, C.N.; Nguyen, X.T.; Wang, Y.H. Automobile Industry Strategic Alliance Partner Selection: The Application of a Hybrid DEA and Grey Theory Model. Sustainability 2016, 8, 173. [Google Scholar] [CrossRef]
- Wang, C.N.; Nguyen, H.K. Enhancing Urban Development Quality Based on the Results of Appraising Efficient Performance of Investors—A Case Study in Vietnam. Sustainability 2017, 9, 1397. [Google Scholar] [CrossRef]
- Wang, C.N.; Nguyen, X.T.; Le, T.D.; Hsueh, M.H. A partner selection approach for strategic alliance in the global aerospace and defense industry. J. Air Transp. Manag. 2018, 69, 190–204. [Google Scholar] [CrossRef]
- Wang, C.N.; Ho, H.X.T.; Luo, S.H.; Lin, T.F. An Integrated Approach to Evaluating and Selecting Green Logistics Providers for Sustainable Development. Sustainability 2017, 9, 218. [Google Scholar] [CrossRef]
- Wang, C.N.; Tsai, T.T.; Huang, Y.F. A Model for Optimizing Location Selection for Biomass Energy Power Plants. Processes 2019, 7, 353. [Google Scholar] [CrossRef]
- Weidong, F.; Jian, C.; Chunjun, Z. Partners selection process and optimization model for virtual corporations based on genetic algorithms. Tsinghua Sci. Technol. 2000, 2000, 10. [Google Scholar]
- Chang, S.-L.; Wang, R.-C.; Wang, S.-Y. Applying fuzzy linguistic quantifier to select supply chain partners at different phases of product life cycle. Int. J. Prod. Econ. 2006, 100, 348–359. [Google Scholar] [CrossRef]
- Ju-Long, D. Control problems of grey systems. Syst. Control. Lett. 1982, 1, 288–294. [Google Scholar] [CrossRef]
- Xu, Q.; Xu, K. Statistical Analysis and Prediction of Fatal Accidents in the Metallurgical Industry in China. Int. J. Environ. Res. Public Health 2020, 17, 3790. [Google Scholar] [CrossRef] [PubMed]
- Rezić, I.; Kiš, A. Design of Experiment Approach to Optimize Hydrophobic Fabric Treatments. Polymers 2020, 12, 2131. [Google Scholar] [CrossRef] [PubMed]
- Hao, W.; Liu, F. Axle Temperature Monitoring and Neural Network Prediction Analysis for High-Speed Train under Operation. Symmetry 2020, 12, 1662. [Google Scholar] [CrossRef]
- Manickam, S.; Barros, A. Parsing Synthetic Aperture Radar Measurements of Snow in Complex Terrain: Scaling Behaviour and Sensitivity to Snow Wetness and Landcover. Remote Sens. 2020, 12, 483. [Google Scholar] [CrossRef]
- Kim, S.-K.; Yeun, C.Y. A Versatile Queuing System for Sharing Economy Platform Operations. Mathematics 2019, 7, 1005. [Google Scholar] [CrossRef]
- Li, P.; Liu, J.; Wei, C. A Dynamic Decision Making Method Based on GM(1,1) Model with Pythagorean Fuzzy Numbers for Selecting Waste Disposal Enterprises. Sustainability 2019, 11, 5557. [Google Scholar] [CrossRef]
- Julong, D. Five step modelling of Grey Systems. In Grejf System; China Ocean Press: Beijing, China, 1998; pp. 91–102. [Google Scholar]
- Julong, D. Introduction to grey system theory. J. Grey Syst. 1989, 1, 1–24. [Google Scholar]
- Nguyen, H.-K. Combining DEA and ARIMA Models for Partner Selection in the Supply Chain of Vietnam’s Construction Industry. Mathematics 2020, 8, 866. [Google Scholar] [CrossRef]
- Kaoru, T. A Slacks based measure of efficiency in data envelopment analysis. Eur. J. Oper. Res. 2001, 130, 498–509. [Google Scholar]
- Kaoru, T. Variations on the theme of slacks-based measure of efficiency in DEA. Eur. J. Oper. Res. 2010, 200, 901–907. [Google Scholar]
- Farrell, M.J. The Measurement of Productive Efficiency. J. R. Stat. Soc. Ser. A 1957, 120, 253–290. [Google Scholar] [CrossRef]
- Statistics 2020. General Statistics Office of Vietnam. Available online: https://www.gso.gov.vn (accessed on 27 June 2020).
- Le, T.-M.; Wang, C.-N.; Nguyen, H.-K. Using the optimization algorithm to evaluate and predict the business performance of logistics companies–a case study in Vietnam. Appl. Econ. 2020, 52, 4196–4212. [Google Scholar] [CrossRef]
- Vanichchinchai, A. The Effect of Lean Manufacturing on a Supply Chain Relationship and Performance. Sustainability 2019, 11, 5751. [Google Scholar] [CrossRef]


Publisher’s Note: MDPI stays neutral with regard to jurisdictional claims in published maps and institutional affiliations. |
© 2021 by the author. Licensee MDPI, Basel, Switzerland. This article is an open access article distributed under the terms and conditions of the Creative Commons Attribution (CC BY) license (https://creativecommons.org/licenses/by/4.0/).