Article

Mineral Composition, Pore Structure, and Mechanical Characteristics of Pyroxene Granite Exposed to Heat Treatments

1
State Key Laboratory for Geomechanics and Deep Underground Engineering, School of Mechanics and Civil Engineering, China University of Mining and Technology, Xuzhou 221116, China
2
Department of Civil Engineering, Monash University, Melbourne VIC 3800, Australia
3
School of Architecture and Civil Engineering, Nantong University, Nantong 226019, China
4
Hubei Key Laboratory of Road-bridge and Structure Engineering, School of Civil Engineering and Architecture, Wuhan University of Technology, Wuhan 430070, China
*
Author to whom correspondence should be addressed.
Minerals 2019, 9(9), 553; https://doi.org/10.3390/min9090553
Submission received: 18 June 2019 / Revised: 9 September 2019 / Accepted: 12 September 2019 / Published: 14 September 2019

Abstract

:
In deep geoengineering, including geothermal development, deep mining, and nuclear waste geological disposal, high temperature significantly affects the mineral properties of rocks, thereby changing their porous and mechanical characteristics. This paper experimentally studied the changes in mineral composition, pore structure, and mechanical characteristics of pyroxene granite heated to high temperature (from 25 °C to 1200 °C). The results concluded that (1) the high-temperature effect can be roughly identified as three stages: 25–500 °C, 500–800 °C, 800–1200 °C. (2) Below 500 °C, the maximum diffracted intensities of the essential minerals are comparatively stable and the porous and mechanical characteristics of granite samples change slightly, mainly due to mineral dehydration and uncoordinated thermal expansion; additionally, the failure mechanism of granite is brittle. (3) In 500–800 °C, the diffraction angles of the minerals become wider, pyroxene and quartz undergo phase transitions, and the difference in thermal expansion among minerals reaches a peak; the rock porosity increases rapidly by 1.95 times, and the newly created pores caused by high heat treatment are mainly medium ones with radii between 1 μm and 10 μm; the P-wave velocity and the elastic modulus decrease by 62.5% and 34.6%, respectively, and the peak strain increases greatly by 105.7%, indicating the failure mode changes from brittle to quasi-brittle. (4) In 800–1200 °C, illite and quartz react chemically to produce mullite and the crystal state of the minerals deteriorate dramatically; the porous and mechanical parameters of granite samples all change significantly and the P-wave, the uniaxial compressive strength (UCS), and the elastic modulus decrease by 81.30%, 81.20%, and 92.52%, while the rock porosity and the shear-slip strain increase by 4.10 times and 11.37 times, respectively; the failure mechanism of granite samples transforms from quasi-brittle to plastic, which also was confirmed with scanning electron microscopy (SEM).

1. Introduction

In recent years, with the huge demand for energy and resources promoted by global economic and social development, the associated deep geoengineering (e.g., enhanced geothermal system [1], deep mining of coal and tight oil and gas [2,3], in-situ liquefaction and gasification of coal [4], nuclear waste geological disposal [5], etc.) is becoming the frontier and hotspot of engineering worldwide. A common and urgent issue in these engineering projects is the high-temperature problem causing the reservoir rocks to be damaged thermally, thus leading them to exhibit weakening of physical and mechanical properties [6]. In essence, the decline in the macroscopic physical and mechanical properties of rocks results from the changes in mineral composition and characteristics under high temperatures [7,8,9]. Therefore, comprehensive research ranging from microscopic mineral composition to macroscopic physical and mechanical properties is necessary to better understand the high-temperature effect on rocks.
Pore structure and mechanical properties are the two most important aspects of rock macroscopic properties [10]. The pore structure is closely related to the adsorption and seepage of the fluids in the reservoir rock [11,12], while the mechanical properties contribute to the stability assessment and reinforcement measures of the rock constructions [13,14]. Many researchers have studied the variation of macroscopic rock properties after high-temperature heat treatment and achieved some progress. Regarding the pore structure, various experimental techniques, including CT scanning electron microscope (CT-SEM) [15], mercury intrusion porosimetry (MIP) [16,17,18,19,20], micro-CT [21,22], field emission scanning electron microscopy (FE-SEM) [23,24], low-field nuclear magnetic resonance (NMR) [25], photoacoustic spectrometry (PAS) [26], ultrasonic velocity measurement (UVM) [27], etc., were used to study the high-temperature effects on the porosity, pore size, and pore morphology of various materials such as calcareous sediments [21], coal [15,25], concrete [16], shale [22,23,24], granite [28,29], sandstone [18,19,28], limestone [17,20], and carbonate [27]. Almost all of the above studies have shown that thermal damage and microcracks are induced by high temperature and the rock porosity and permeability gradually increase with temperature, while the pore fractal dimension decreases. In terms of mechanical properties, most laboratory tests focus on stress–strain relationships [30], strength characteristics [9,17,19,20,31,32,33] (such as uniaxial compressive strength (UCS), tensile strength, confined compressive strength, etc.), deformation characteristics [17,19,34,35,36,37] (such as elastic modulus, Poisson’s ratio, peak strain, shear-slip strain, brittle stress drop coefficient, etc.), damage evolution characteristics [38,39,40,41,42,43] (can be calculated by P-wave velocity, acoustic emission, cracks, etc.), and energy characteristics [44,45,46] (such as absorption energy, damage strain energy, elastic energy index, effective impact energy index, etc.). These test results generally indicate that the strength, modulus, and wave velocity all decrease with increasing temperature, and the bearing capacity and deformation resistance of heated rocks are rapidly reduced.
Rock mineral characteristics are also significantly affected by high temperatures [47,48,49,50], including mineral composition [9,51,52], dehydration [53], crystalline state [54], and formation of new phases [55,56,57]. X-ray diffraction (XRD) pattern analysis is often applied to examine the microstructural properties of rock minerals combined with SEM, thermo-gravimetric analyses (TGA), and differential scanning calorimetry (DSC) [7,58]. For instance, Zhang et al. [58] conducted XRD, SEM, TGA, and DSC experiments to investigate thermal influence on the microstructure of limestone and found that thermal treatment not only prompts mineral decomposition, but also changes the crystallization. Shen et al. [7] have done similar work on sandstone.
The above studies have greatly improved the understanding of the high-temperature effects on rock pore structure, mechanical properties, and mineralogy. However, few studies have focused on the combination of macroscopic and microscopic analysis, and the heat treatment temperatures in the tests were mostly from room temperature to about 800 °C, while the range from 800 °C to the melting temperature point was ignored. In addition, there are relatively few studies on granite. Granite forms the basis of the upper continental crust and it is often closely related to tectonism, metamorphism, and mineralization [59], and is one of the most common rocks in deep geoengineering involving high temperature [60].
In the Yanzhou coal mine in Shandong Province, China, there is a plan to carry out an underground coal gasification (UCG) industrial trial. The UCG is a mining technology that burns coal in a controlled manner for producing combustible gas, so the high-temperature gas flow in the combustion space area would bake the surrounding rocks by convective and radiative heat transfer and make the surrounding rocks reach about 1200 °C [61,62]. High temperatures would change the physical and mechanical properties of the granite layer above the coal seam, which affects its stability and the safety of the gasifier in the UCG stope. This paper therefore carried out a series tests including XRD, MIP, P-wave velocity, and uniaxial compression on pyroxene granite collected from the coal mine exposed to heat treatment from 25 °C to 1200 °C; then analyzed the changes in its mineral composition, pore structure, and mechanical properties with temperature; and finally discussed why the heated granite has such a change from the microscopic and macroscopic perspectives. The results will provide basic data for the stability and safety risks assessment of the granite layer during the UCG process, and are also expected to improve the related theory on granite exposed to high temperature.

2. Experimental Material and Methodology

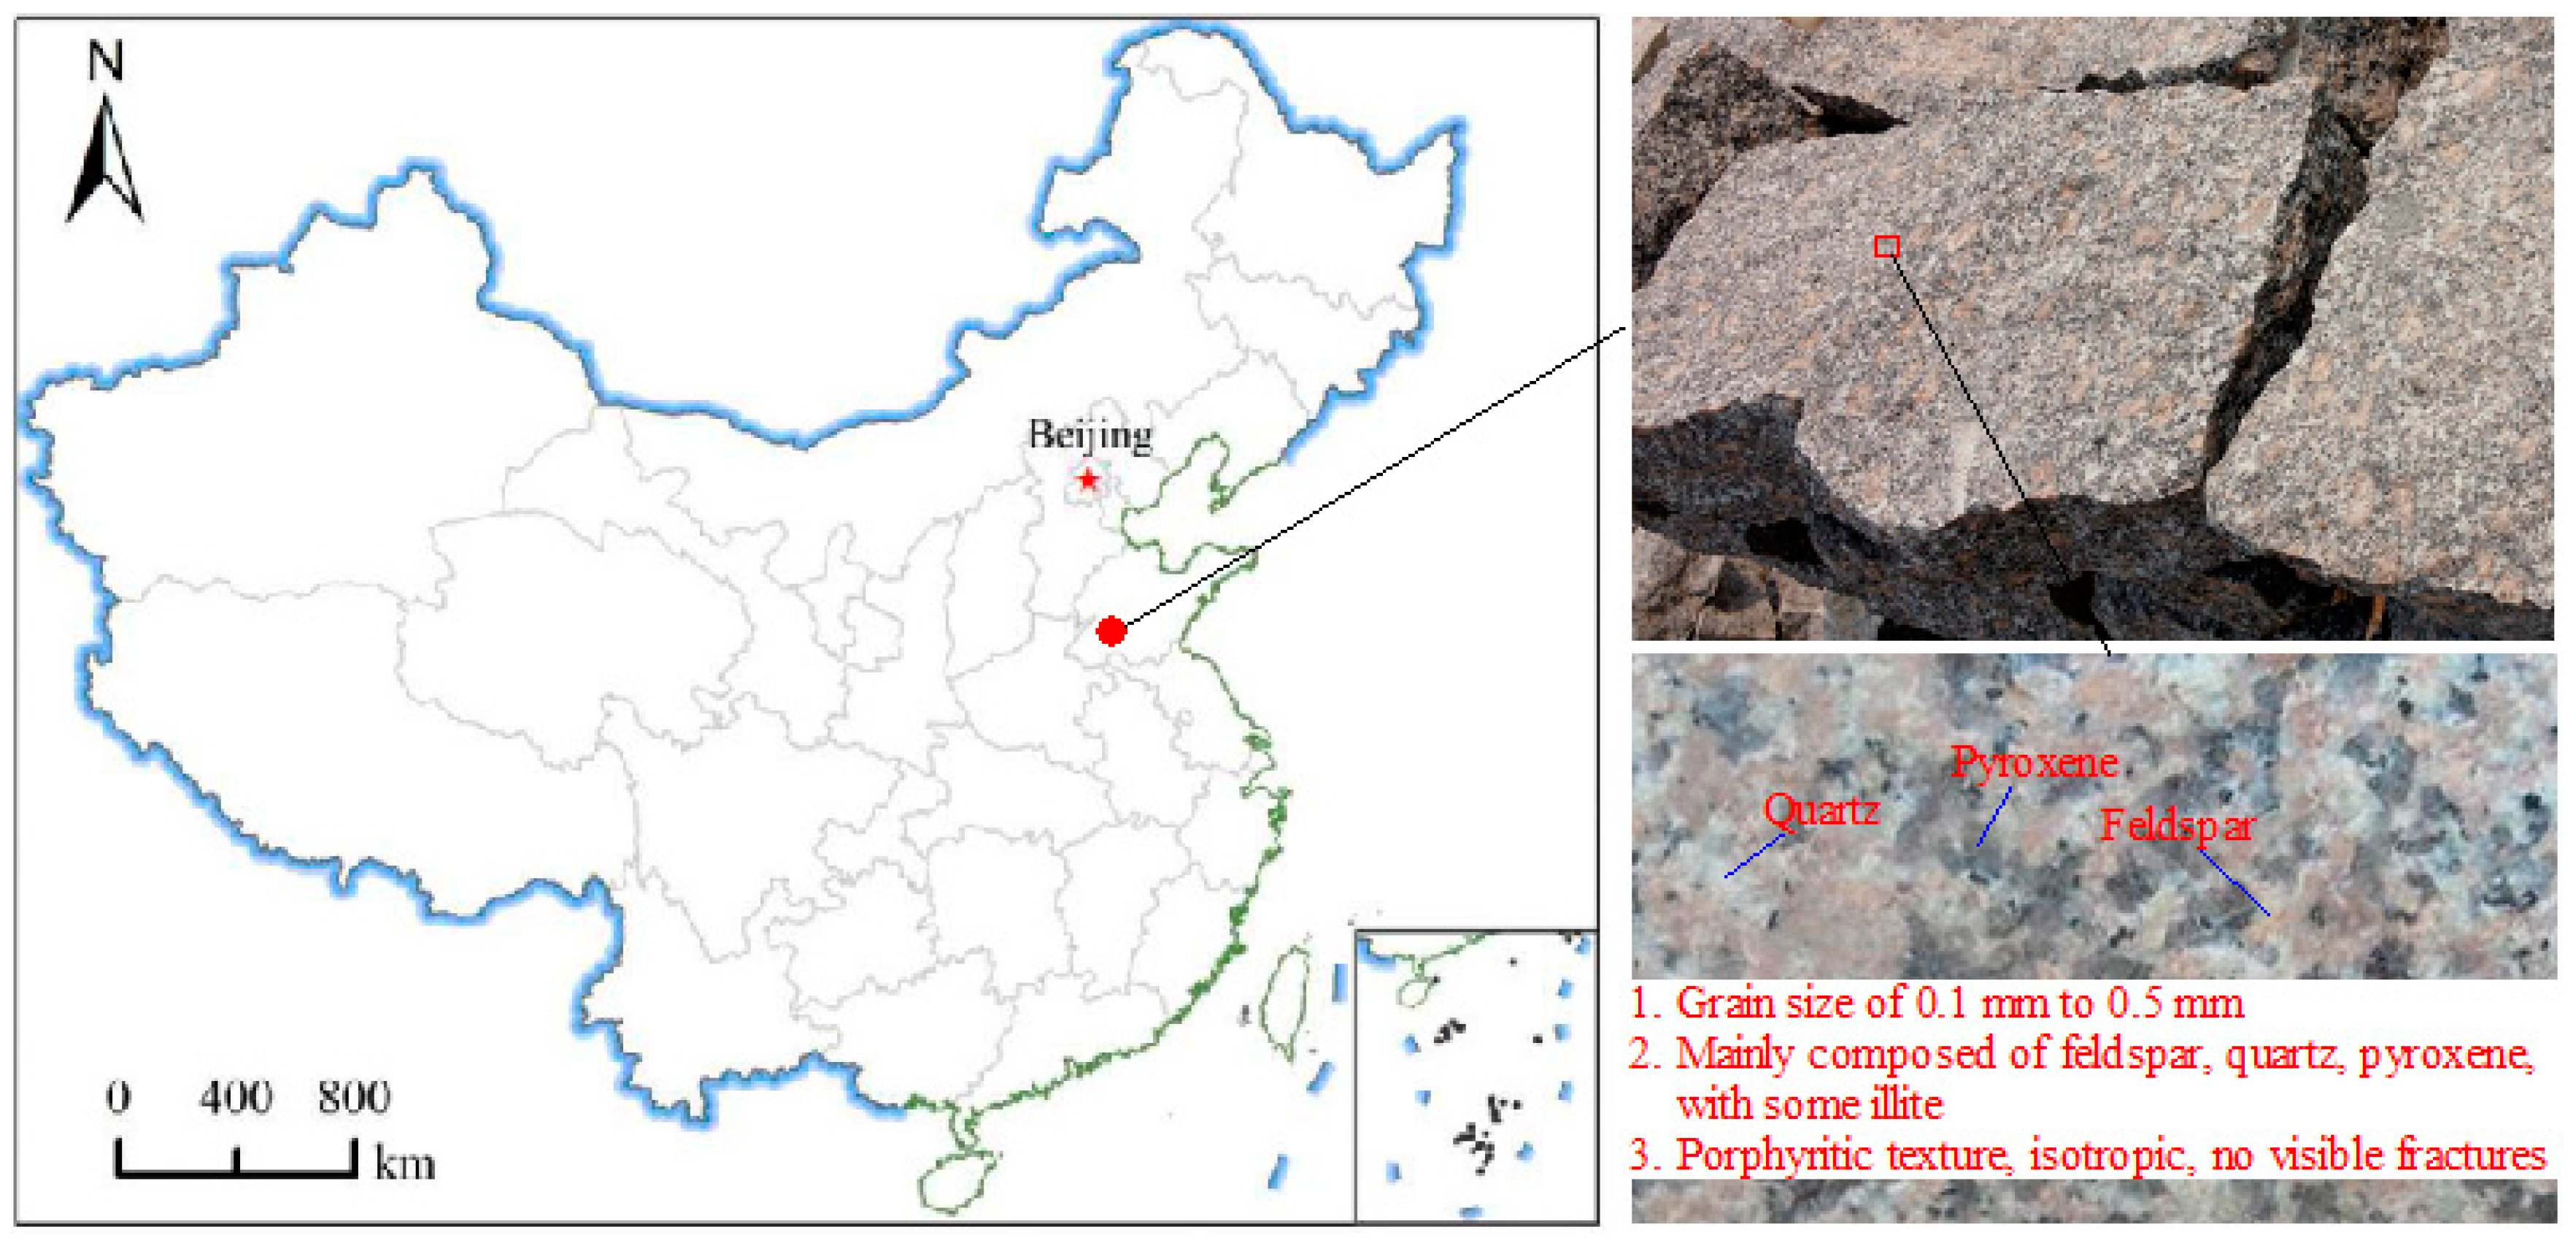
2.1. Sample Description

The rock studied in this experiment was granite rock. It was collected from Yanzhou mining area in the Shandong Province, China (see Figure 1). The granite is a typical igneous rock formed in the process of magmatism, and its color is slightly darker, which indicates that it may be formed in the ground deep in the earth [30]. The collected rock blocks are approximately 500 mm long, 300 mm wide, and 200 mm high. In order to ensure that the properties of the drilled granite samples are basically the same, these rock blocks were collected in adjacent locations. Granite has a porphyritic texture, it is isotropic, and no visible cracks could be found on the rock surface. The grain size is between 0.1 mm and 0.5 mm, which can be categorized as fine-to-medium grained. The main mineralogical components are feldspar, quartz, and pyroxene, with small amount of illite according to the X-ray diffraction (XRD) analysis. The dark minerals in granite are mainly pyroxene, so they can be called pyroxene granites.
In this experiment, all granite cylindrical specimens were cored to an actual diameter of 25 mm and approximately 50 mm in length for the following thermal treatment and laboratory tests, and sample ends were polished carefully by a grinding machine until the deviation ranges of the flatness and roughness were less than 0.5 mm and 0.05 mm, respectively [7].
According to the ISRM’s (International Society for Rock Mechanics) suggested method, the basic physical and mechanical properties of the granite were measured. The average bulk density was 2.76 g/cm3 and the P-wave velocity through the rock samples was approximately 4000 m/s. Moreover, the average elastic modulus was 38.37 GPa, and the uniaxial compressive strength (UCS) was about 191.9 MPa.

2.2. Thermal Treatment

In this experiment, 8 groups of the granite samples were prepared for thermal treatment. The heating was administered to the rock samples using the high temperature furnace MTS653 (see Figure 2a). The furnace had an overall height of 220 mm, a heating zone height of 185 mm, a heating zone width and depth of 62.5 mm, and a maximum applied temperature of 1400 °C. The heating process was conducted in three steps, shown in Figure 2b, as follows:
(1) Eight group samples were heated to their target temperatures (25 °C, 100 °C, 200 °C, 300 °C, 500 °C, 800 °C, 1000 °C, and 1200 °C), respectively, at a rate of 5 °C/min, according to similar previous works for granite [43,63], sandstone [7,64], and limestone [58]. Above 500 °C, the ductility of granite rocks gradually appears, and the changes in the physical and mechanical properties are relatively stable [43,63], so the set temperature step is large.
(2) After reaching the target temperature, all samples were kept in the high temperature furnace for 2 hours, according to the previous experiments [43,58], to ensure that they were heated evenly.
(3) The furnace was turned off and the samples were cooled naturally to room temperature (25 °C) [43].

2.3. Experimental Procedure and Instruments

Firstly, in order to obtain the mineral composition of granite after different high temperature treatments, 8 granite powder samples finer than 400 mesh were prepared corresponding to 8 different heating temperatures. The XRD tests were conducted on the powder samples using the D/Max-3B X-ray diffractometer (Rigaku Corporation, Tokyo, Japan). The XRD instrument uses Cu Kα radiation and graphite monochromator. The voltage of the X-ray tube is 35 kV, and the current is 30 mA. The divergent slit (DS) and receiving slit (RS) are both 1°, scatter slit (SS) is 0.15 mm, receiving slit of monochromator (RSM) is 0.6°. The scanning mode is continuous scanning, the scanning speed is 3°/min, and the sampling interval is 0.02°. Each sample was measured and analyzed by using the software that came with the XRD instrument.
Secondly, the rock samples at each temperature (one from each group) were broken into a piece of about 2 mm, and the mass of approximately 3 g. The MIP (mercury intrusion porosimetry) tests were performed on the piece samples to acquire the pore characteristics of granite samples using the 9310 microporous structure analyzer (Micromeritics Instrument Company, Norcross, GA, USA). The measurement range of the instrument is from 0.006 μm to 360 μm, low-pressure resolution is ±0.001 MPa, and high-pressure resolution is ±0.01 MPa. The variation of pore volume with different sizes in rock samples under different high temperatures could be obtained according to the Washburn equation and the mercury injection and ejection curves [17,20].
Finally, the P-wave velocities of granite specimens subjected to high-temperature heating were measured by using the NM-4A non-metallic ultrasonic testing analyzer (Koncrete Company, Beijing, China). The test range of ultrasonic time of the instrument is 0–0.64 s and the test accuracy is ±0.05 μs. The P-wave velocity of each specimen was tested five times for data reliability. Further, the uniaxial compression tests were performed using the MTS815.02 Rock Mechanical Test System (MTS Systems Corporation, Eden Prairie, Minnesota, USA) to obtain the mechanical properties of the granite rock. The maximum axial load of the MTS815.02 machine is 1700 kN, and the maximum confining pressure is 45 MPa. Axial displacement-controlled loading mode was adopted, and the loading rate was 0.0015 mm/s. During the loading process, the Teststar II control program was completed according to the predetermined requirements, and the values of the mechanical parameters such as axial load, displacement, stress, and strain were recorded. It should be noted that the test procedure in this part was to firstly test the P-wave velocity of the unheated rock samples, then test them again after thermal treatment, and finally perform the uniaxial compression tests. According to the ISRM suggested methods, three samples were tested and averaged at each temperature point to reduce the dispersion of the test results.

3. Results

3.1. Mineral Composition

The XRD patterns of the granite samples at different heating temperatures (25 °C, 100 °C, 200 °C,300 °C, 500 °C, 800 °C, 1000 °C, and 1200 °C) are shown in Figure 3. It can be known that the main components of this group of samples were feldspar, quartz, pyroxene, some illite, and a small amount of other minerals. The feldspar is the most abundant, containing calcium (Ca) feldspar, sodium (Na) feldspar (CaO·Al2O3·2SiO2 and Na2O·Al2O3·6SiO2), and some potassium (K) feldspar (K2O·Al2O3·6SiO2). The maximum diffracted intensity (MDI) of the main minerals with increasing temperature are presented in Table 1 and Figure 4. The changes in mineral contents are shown in Table 2 and Figure 5.
In general, the XRD properties of the granite rocks exposed to different temperatures can be identified as three stages:
(1) Stage Ⅰ: At room temperature (25 °C), the mineral composition in the tested granite sample were as follows: 64.25% feldspar, 19.23% pyroxene, 9.4% quartz, 5.1% illite, and 2.02% others. During the heating process from 25 °C to 500 °C, the mineral contents changed little, and the differences may be due to the heterogeneity of the granite material [43]. The MDI of feldspar and pyroxene both fluctuated. The feldspar fluctuated around 450 CPS, while the pyroxene around 120 CPS. The MDI of quartz and illite was substantially constant and no mullite was detected.
(2) Stage Ⅱ: From 500 °C to 800 °C, the mineral composition of the granite material still changed very little with increasing temperature, but the diffraction intensity of feldspar weakened significantly, and the MDI decreased by 38.4% from 435 CPS at room temperature to 268 CPS at 800 °C. Moreover, the shape of the diffraction peak reflected the crystallinity. If the crystal is perfect, the diffraction peak would be a narrow vertical line, while the broadened peak would indicate the formation of an amorphous phase [58]. The shape of the diffraction peak was characterized by a height–width ratio, which denotes the ratio of the diffraction intensity to the diffraction angle range, and small height–width ratio indicates poor crystallinity. As shown in Figure 6, the height–width ratio of the crystal plane of feldspar at about 28° had a drastic decrease with increasing temperature, indicating that the structure had a tendency to change from crystalline to amorphous. In general, the chemical properties of the mineral components of the granite were stable until 800 °C.
(3) Stage Ⅲ: Between 800 °C and 1200 °C, the contents of quartz and feldspar decreased slightly and pyroxene remained stable. The most striking feature was that the illite vanished and a small amount of mullite appeared. Illite changed from 2.65% to 0, and mullite changed from 0 to 1.05%. Illite is an intermediate mineral among mica, kaolinite, and montmorillonite. It is often formed by the weathering of muscovite and potassium feldspar [65]. It can create mullite by chemical reaction with quartz at high temperature, and mullite crystal has a high mechanical strength and chemical stability [66,67].

3.2. Pore Structure

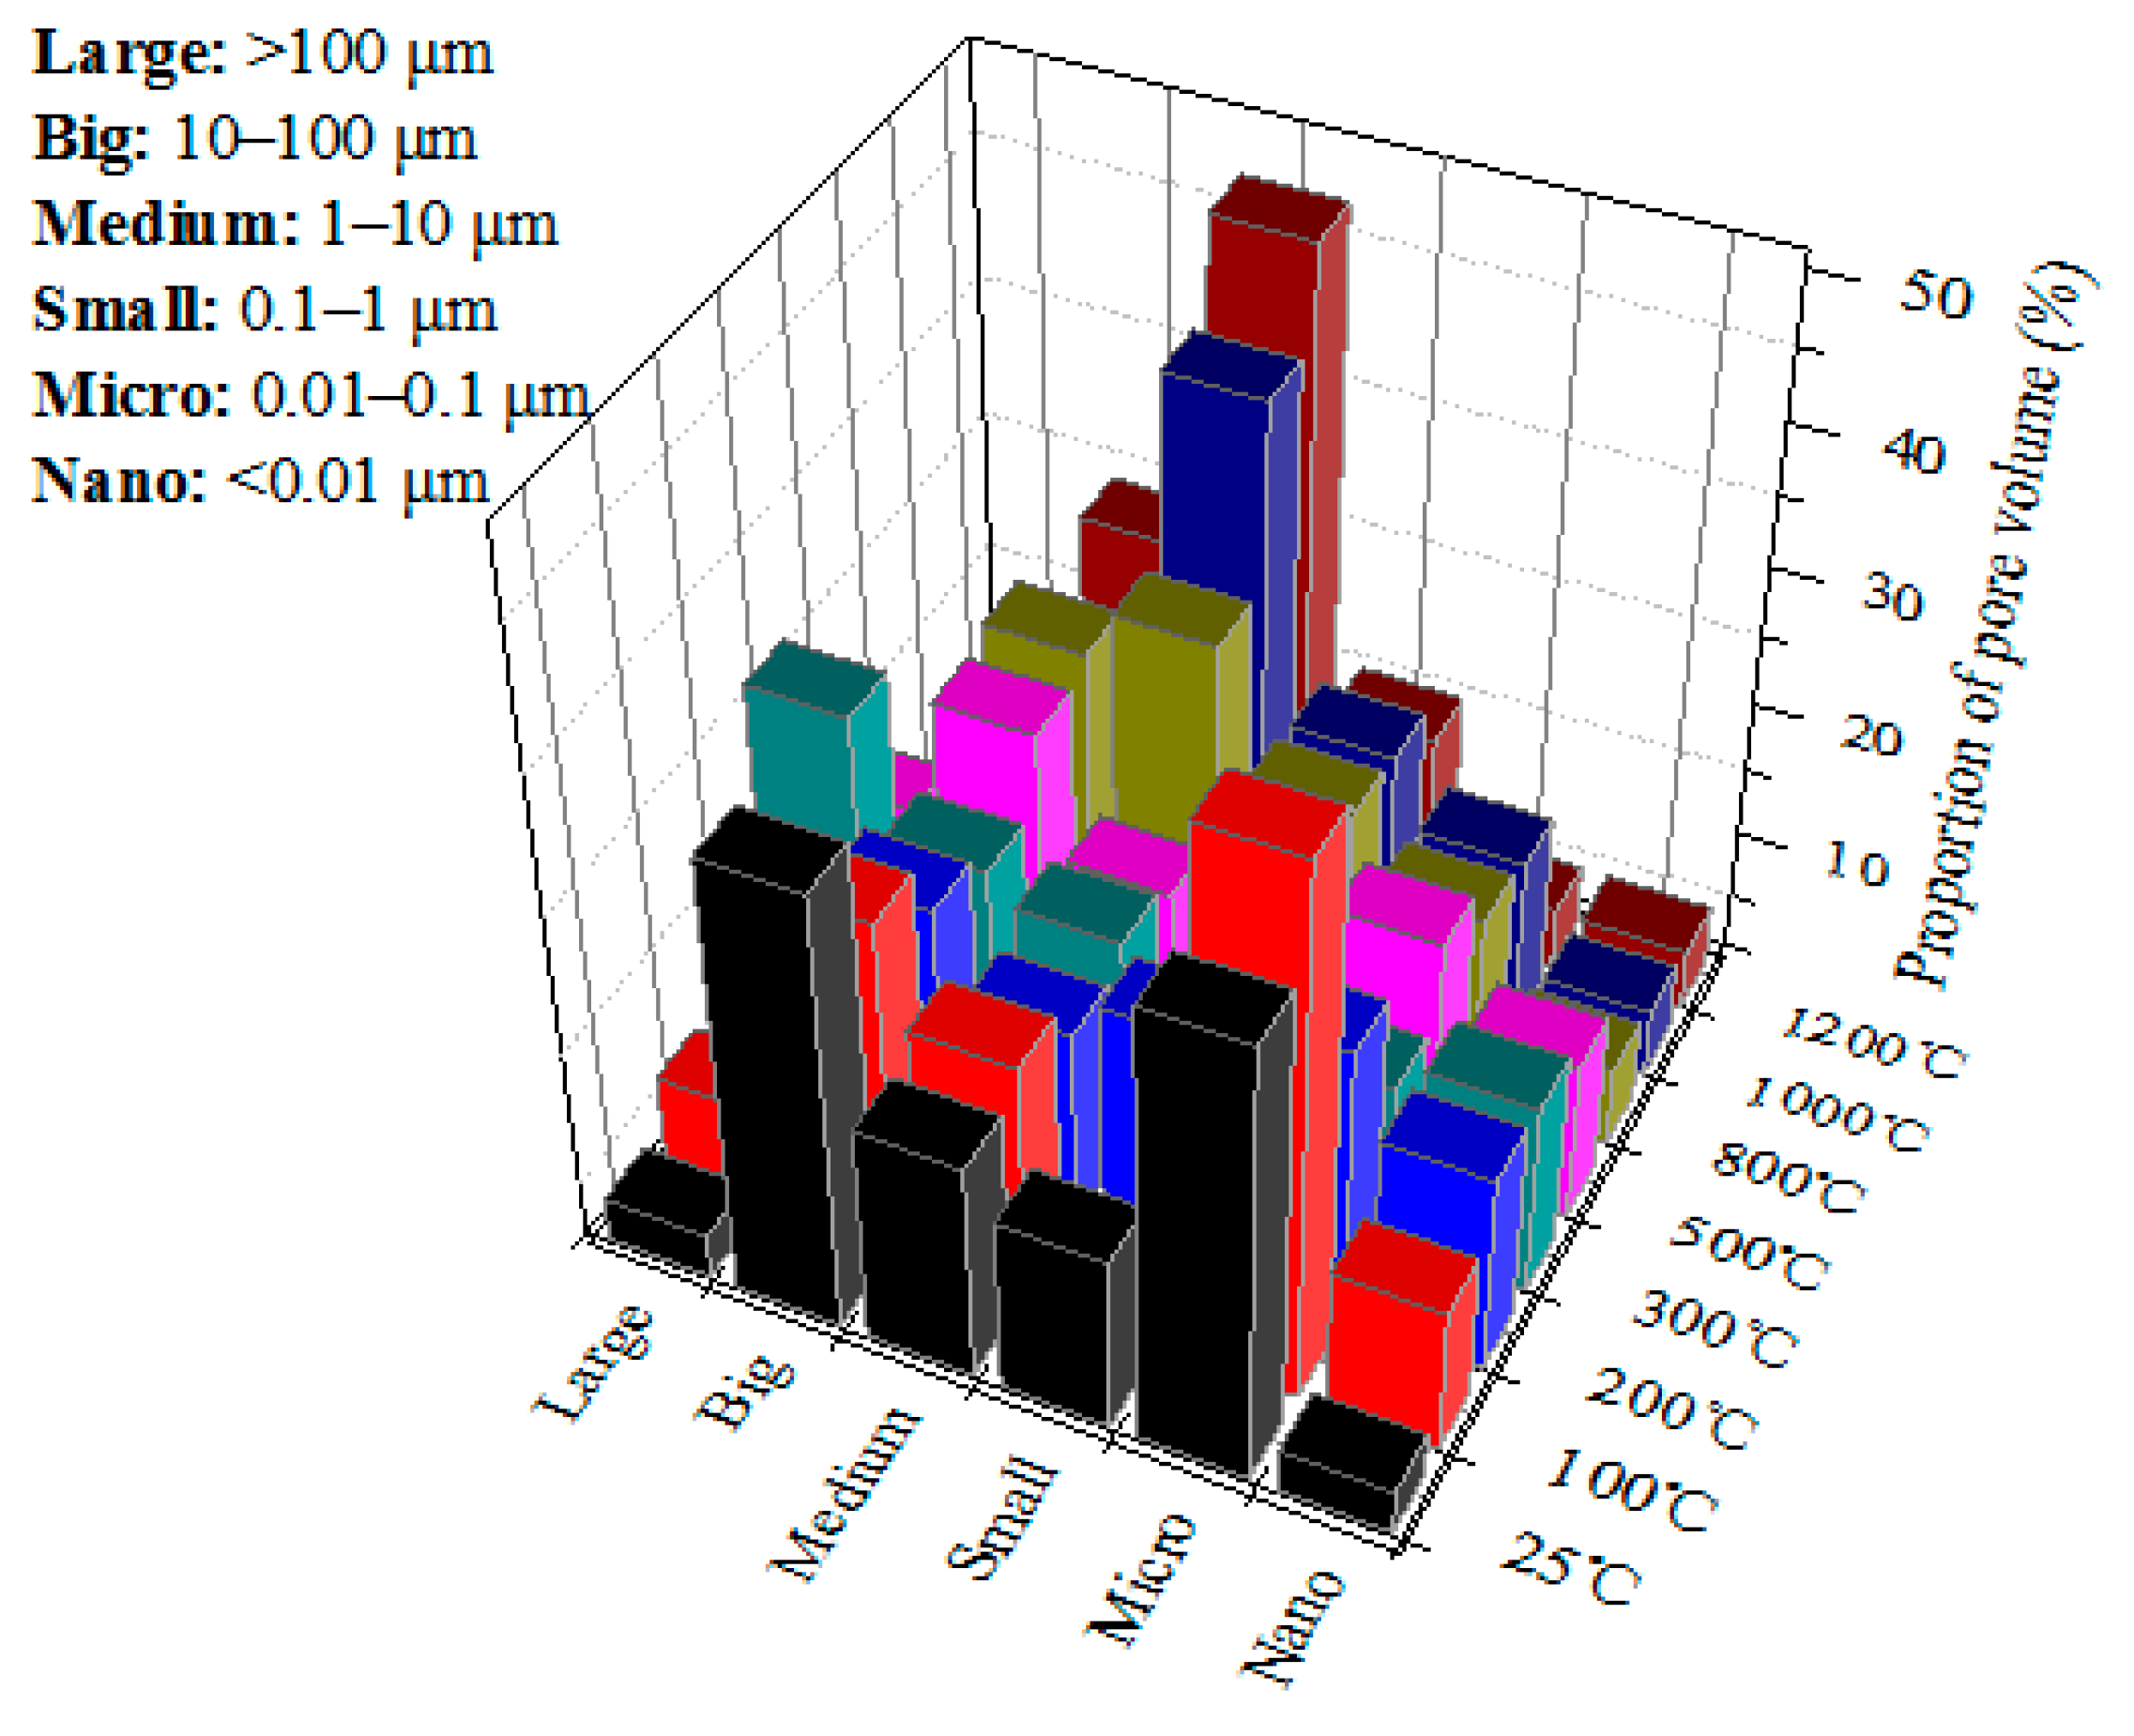
3.2.1. Pore Distribution of Granite Samples at Different Heating Temperatures

In MIP tests, the cumulative mercury volume injected into the granite sample increases as the applied mercury pressure increases. Figure 7 shows the mercury injection and ejection curves (cumulative mercury volume vs. mercury pressure) in granite samples heat-treated at different temperatures. The pore distribution of granite samples at different heating temperatures can be measured by the MIP tests and the Washburn equation was used to express the relationship between the applied pressure and the pore size [17,19].
p ( r ) = 2 γ cos θ r ,
where p(r) is the applied pressure on the mercury meniscus, r is the pore radius of the granite sample, γ is the surface tension of mercury, θ is the contact angle of mercury with the pore wall surface. Usually, γ is equal to 0.48 N/m and θ is taken as 140° because the contact angle of mercury with various substances is between 135° and 150°.
Figure 8 shows the relationship between cumulative pore volume and pore radius in granite samples heat-treated at different temperatures, which was measured by MIP tests based on Equation (1). It can be seen that the cumulative pore volume curve is stepped, and the measurement range of the pore radius is 0.005–120 μm. The maximum cumulative pore volume does not change much below 300 °C (about 2.5–3.5 × 10⁻³ mL/g), it increases slightly at 500 °C (about 5 × 10⁻³ mL/g), and increases greatly above 800 °C (about 9–14 × 10−3 mL/g), which is increased by 3–5 times.
Rock pores are classified as connected pores, dead-end pores, microcapillary-bound pores, and isolated pores, while connected pores are effective for fluid transport [68]. According to pore occurrence, they also can be categorized into intergranular pores, intragranular pores, interstitial pores, and fissures [69]. Regarding the classification criteria of pore size, scholars have proposed different classification results according to different research methods and purposes [17,19,20,70,71]. According to the effect of solid–gas action, Chen et al. [70] considered that the gas is mainly adsorbed in micropores (<10 nm), diffused in small pores (10–100 nm), seeps slowly in the mesopores (100–1000 nm), and flows actively in large pores (>1000 nm). Considering the significance of pores to liquid seepage, Wu et al. [71] found that when the pore size is less than 1 μm, the liquid cannot seep in it; when it is 1–10 μm, the liquid can seep under higher driving pressure, but the permeability is low; for 10–100 μm, water can seep through it under natural conditions; when the pore size is greater than 100 μm, groundwater flows actively. Here, the classification methods proposed by Chen et al. [70] and Wu et al. [71] are integrated, the pores are divided into six categories (see Figure 8): nanopores (r < 0.01 μm), which is the main adsorption site for gas in the rock; micropores (r = 0.01–0.1 μm), constituting the capillary condensation and diffusion zone of the gas; small pores (r = 0.1–1 μm), which constitute a slow laminar flow area of the gas, but the liquid generally cannot seep in them; medium pores (r = 1–10 μm), the gas can flow freely therein, while the liquid can seep at higher pressure, but permeability is low; big pores (r = 10–100 μm), water can seep in them naturally; large pores (r > 100 μm), allowing water to flow smoothly. According to the cumulative pore volume curve in Figure 8, the pore volume of the six pore sizes and their proportion can be obtained, as shown in Table 3.
According to Table 3, Figure 9 shows the volume change of the six types of pores as the heating temperature increases. It can be observed that the pore volume changing curves can be divided into three stages. Below 500 °C, the six pore volumes did not change much and exhibited volatility (Stage Ⅰ). In the temperature range of 500–800 °C, the volume of micropores, small pores, medium pores, and big pores began to increase, while the volume of nano and large pores remained essentially unchanged (Stage Ⅱ). Above 800 °C, the volume of the medium pores increased greatly, from 0.0005 cm3/g at 25 °C to 0.0064 cm3/g at 1200 °C, an increase of 11.8 times, while the volume of micropores reached a maximum at 1000 °C, but decreased much at 1200 °C, even less than that before the heat treatment, in addition, the volume of small and big pores also increased slightly, increasing by 4 times and 2.2 times, respectively, and the volume of nano and large pores remained unchanged (Stage Ⅲ).
Figure 10 shows the volume proportion of the six types of pores in granite samples with increasing temperature. It can be seen that the proportion of the micropores decreased significantly as the heating temperature increased. They accounted for about 35% below 100 °C, 20.59% at 200 °C, further decreased to 12.24% at 300 °C, and finally decreased to 4.44% at 1200 °C. In fact, their volume did not change much (see Figure 9), just the increase in the total pore volume led to a decrease in their proportion. This means that the high heat treatment had practically no effect on the micropores, which constitute the gas diffusion region. On the contrary, the proportion of the medium pores increased observably. It was about 15% below 500 °C, then increased to 28.24% at 800 °C, and further increased to more than 40% above 1000 °C. This indicates that the new cracks in the rock caused by high heat treatment were mainly medium pores. The threshold temperature range was 500–800 °C, and in this range, the volume of medium and big pores increased greatly, which would lead to a great increase in rock permeability. In other words, the seepage-proofing capacity of the rock would be dramatically weakened.

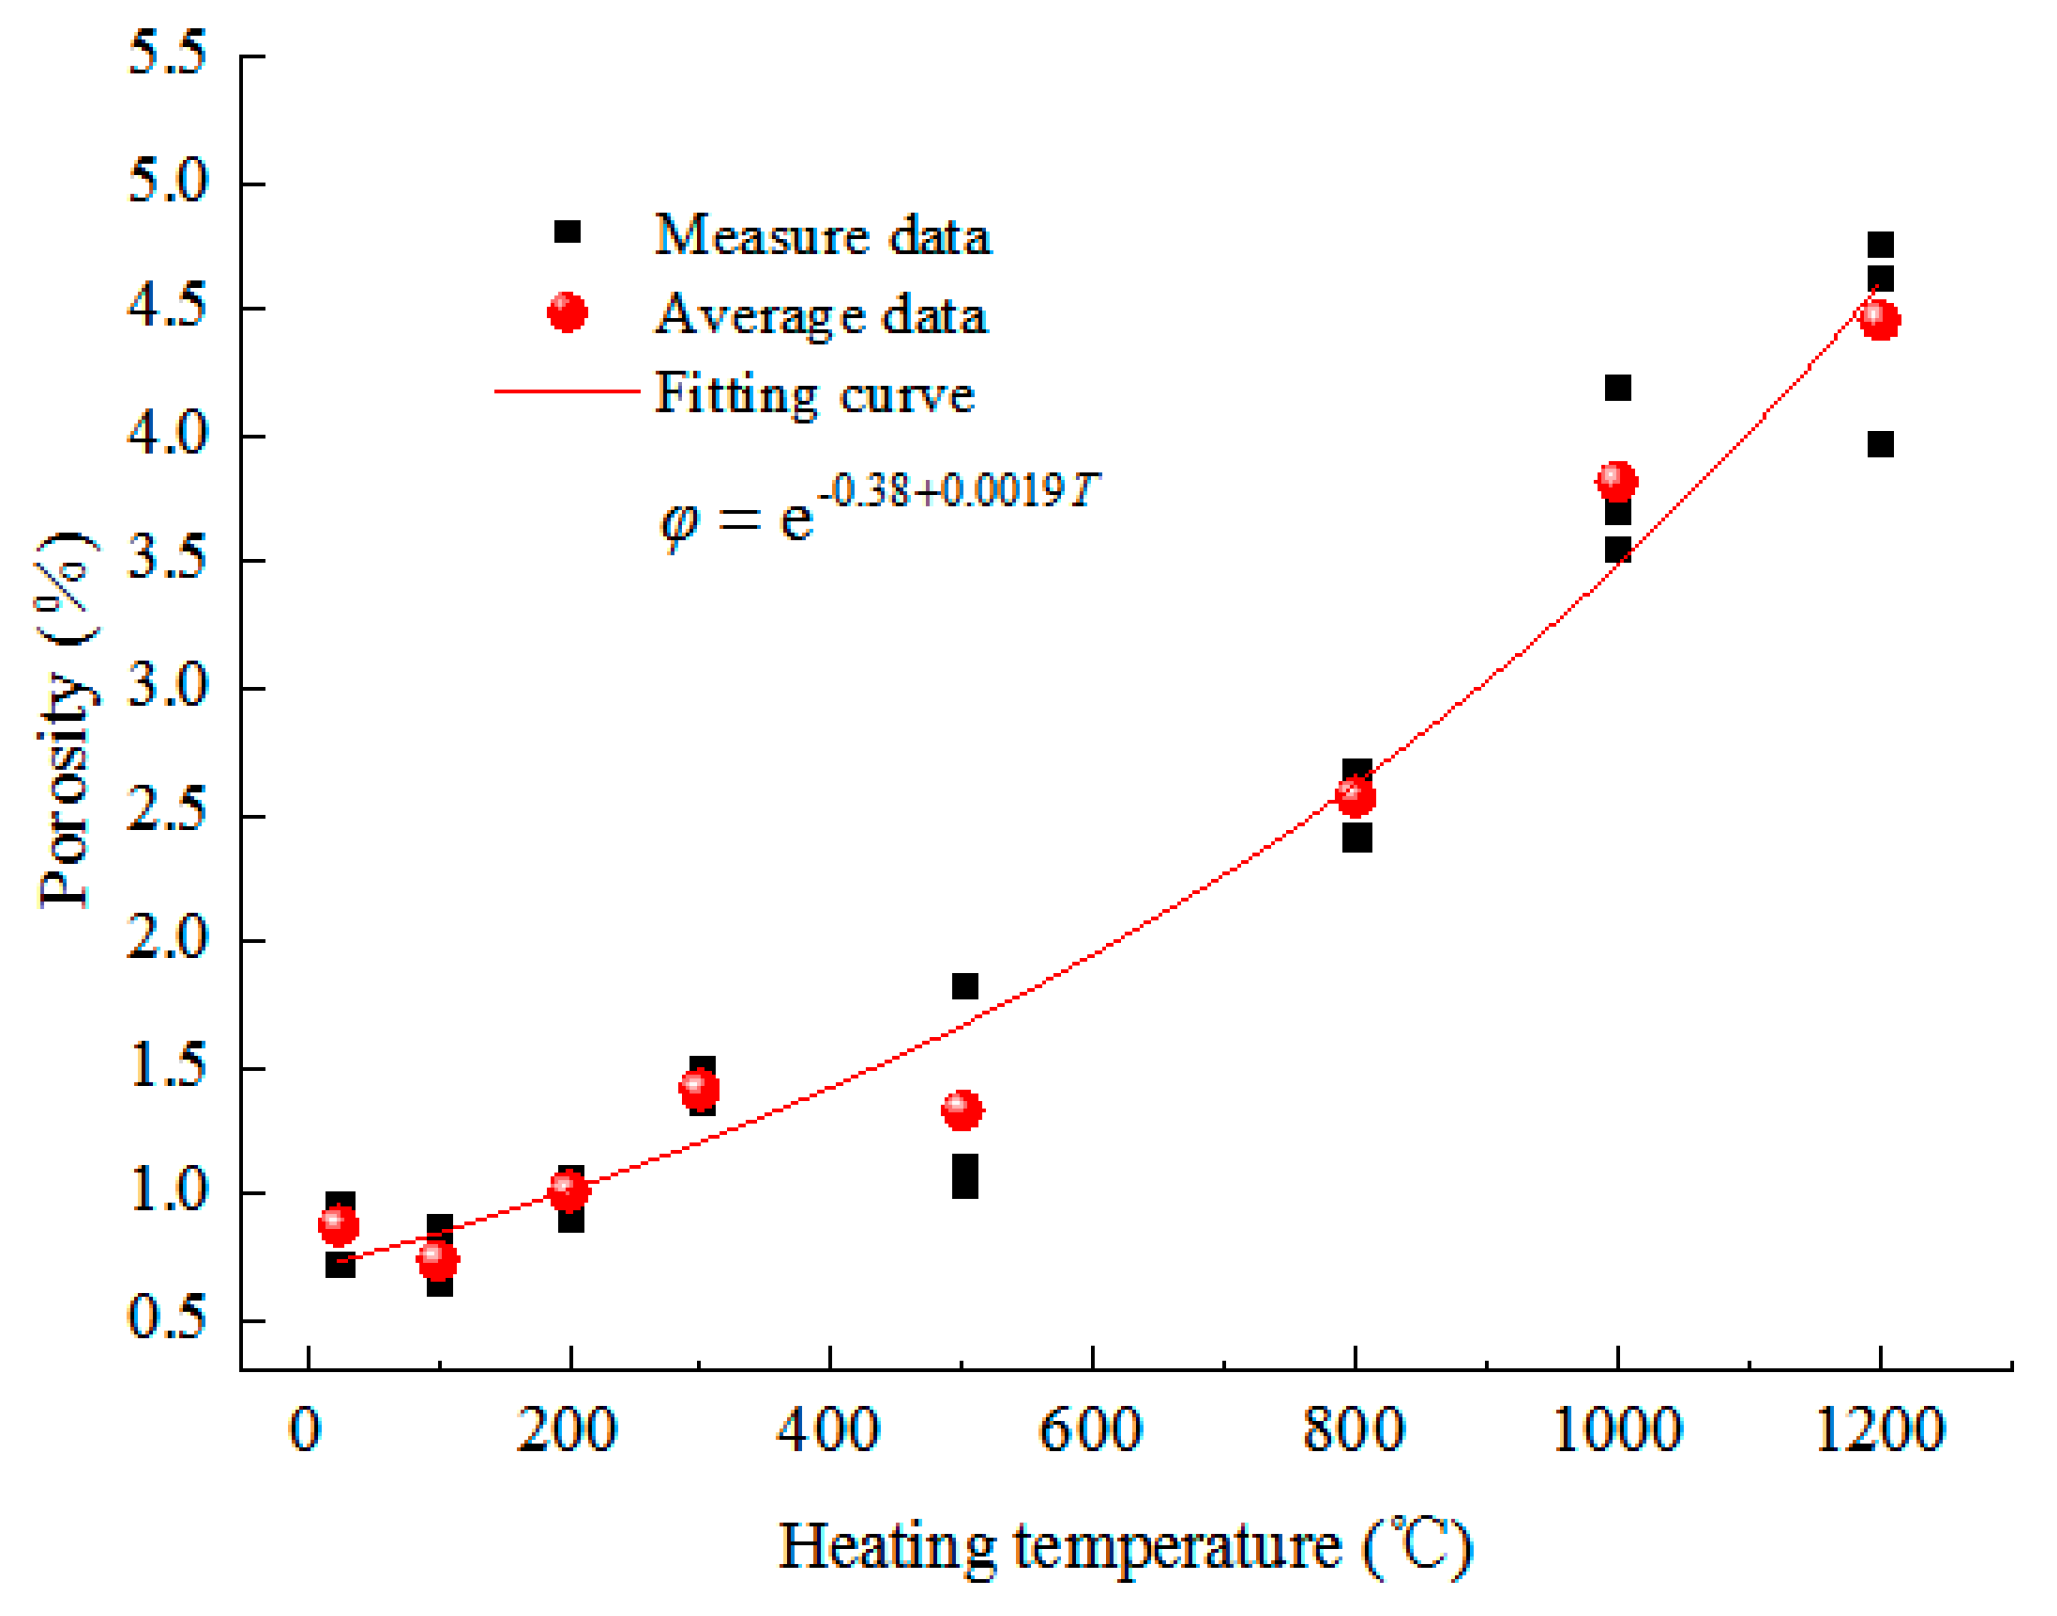
3.2.2. Thermal Effect on the Porosity of Granite Samples

Rock porosity is an important parameter for evaluating fluid storage and transport properties. According to Figure 8 and Table 3, the porosity of rock samples after different high-temperature heat treatments can be obtained, as shown in Figure 11. The trend of rock porosity with temperature can be fitted by an exponential function with a correlation coefficient of 0.98. The porosity of the granite samples continuously increased with the heating temperature, and the increasing rate got faster and faster. It increased little below 500 °C, compared with unheated rock samples, the porosity of samples at 200 °C and 300 °C just increased by 0.15 times and 0.62 times, respectively, and only increased by 0.52 times at 500 °C. After 500 °C, the porosity increased greatly. It reached 2.571% at 800 °C, which is 2.95 times that at 25 °C, then 4.37 times at 1000 °C, and further increased to 5.1 times at 1200 °C. These indicate that 500–800 °C can be regarded as a threshold temperature range.

3.3. Mechanical Characteristics

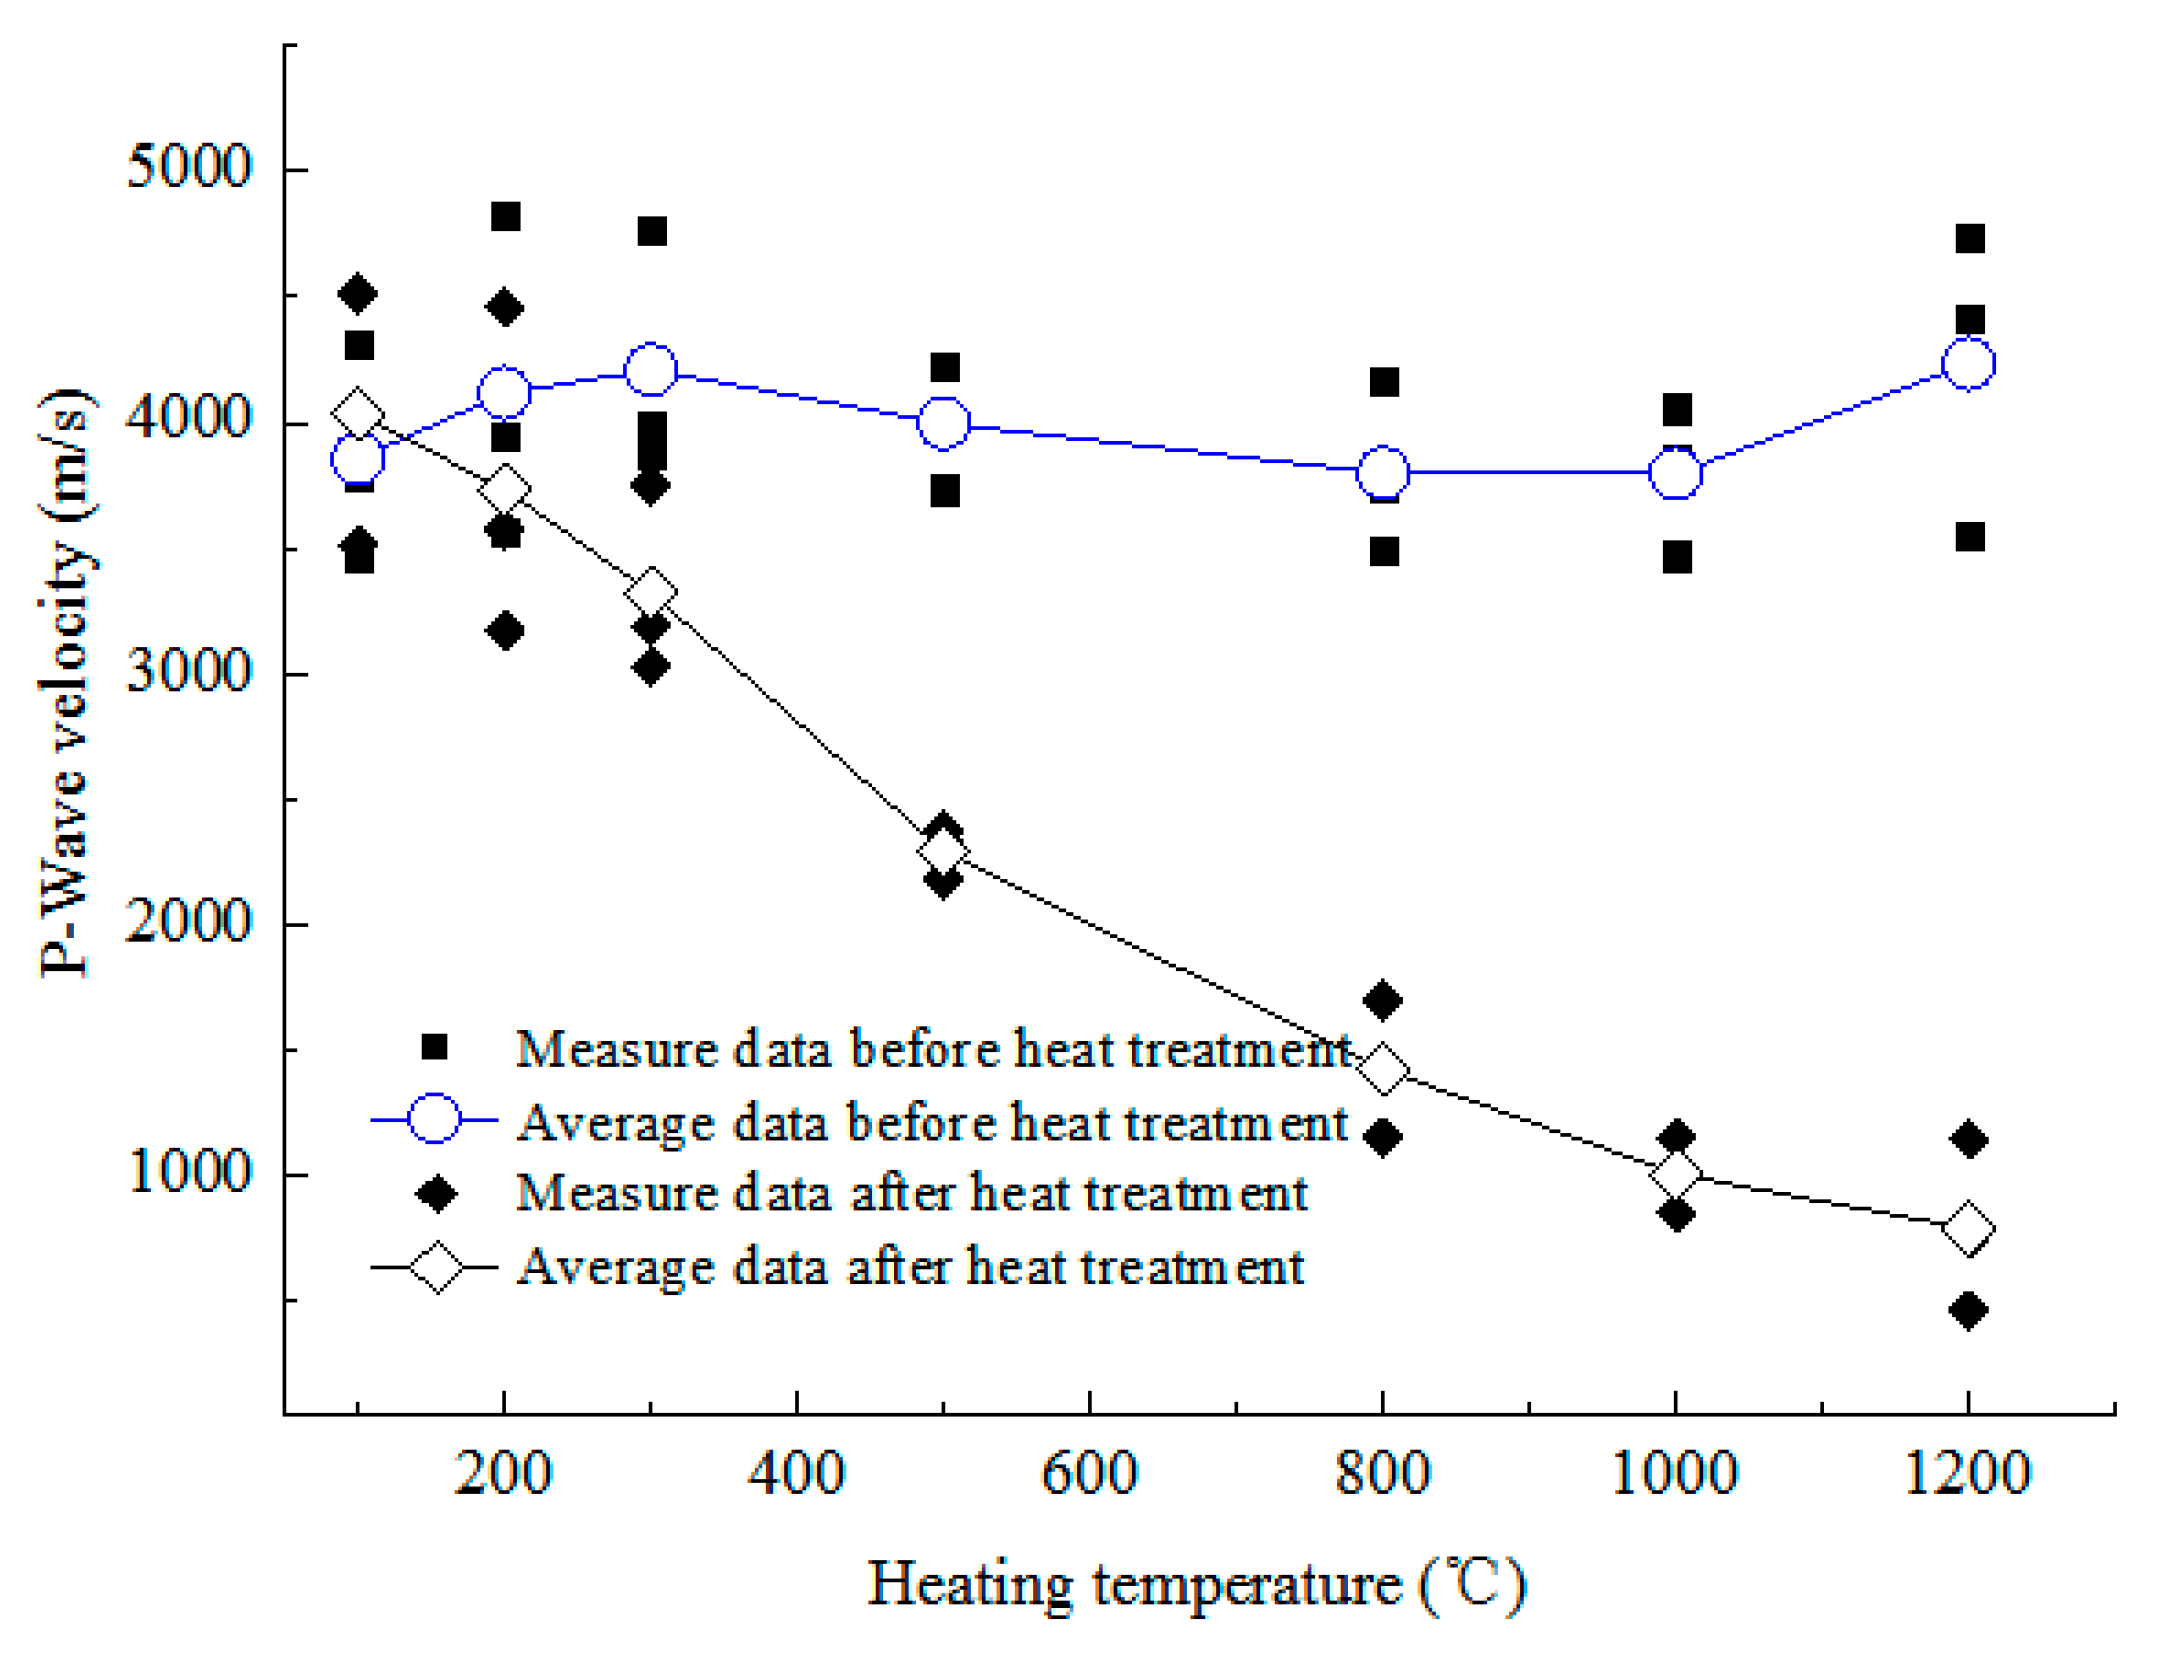
3.3.1. P-Wave Velocity

The P-wave velocity in rock highly depends on its mineral composition and pore structure characteristics, and also can quantitatively reflects the thermally induced microcrack damage [30]. Variations of P-wave velocities of granite rocks before and after heating at different treatment temperatures are presented in Figure 12. It can be observed that the P-wave velocity increased slightly at 100 °C, from 3856 m/s to 4029 m/s, and then it generally decreased linearly with the increase of heating temperature. Below 300 °C, the P-wave velocity did not change much, and decreased by 9.3% and 21.1% at 200 °C, and 300 °C respectively. After the heating temperature exceeded 500 °C, the reduction was much larger, and decreased by 42.6%, 62.5%, and 73.4% at 500 °C, 800 °C, and 1000 °C, respectively. Finally, at 1200 °C, it declined by 81.3% from 4233 m/s to 789.7 m/s. The test results show that the thermal treatment had a very significant influence on the P-wave velocity of the granite.

3.3.2. UCS and Peak Strain

The UCS and peak strain of rock are two basic mechanical parameters. The UCS is the maximum compressive stress before rock failure under uniaxial compression, and can characterize the load-carrying capacity of rock, while the peak strain is the compressive strain corresponding to UCS, reflecting the brittleness of rock to some extent [72,73]. Figure 13 shows the variation of UCS and peak strain of the granite samples with heating temperature. As the heating temperature increased, the UCS decreased almost linearly. At 800 °C, it decreased from 191.9 MPa at room temperature to 136.62 MPa, and the strength was still high, noting the rock still had a high load-carrying capacity. However, it greatly reduced during 800 °C to 1200 °C, to only 36.1 MPa at 1200 °C, and the load-carrying capacity was almost lost. On the other hand, the peak strain monotonically increased with heating temperature, the growth was slow below 500 °C, and then it increased rapidly by 105.7% during 500–800 °C, indicating that the brittleness of rock was significantly weakened. At 1200 °C, it greatly increased to 12.8 × 10⁻³, about three times that of unheated rock sample, showing significant toughness.

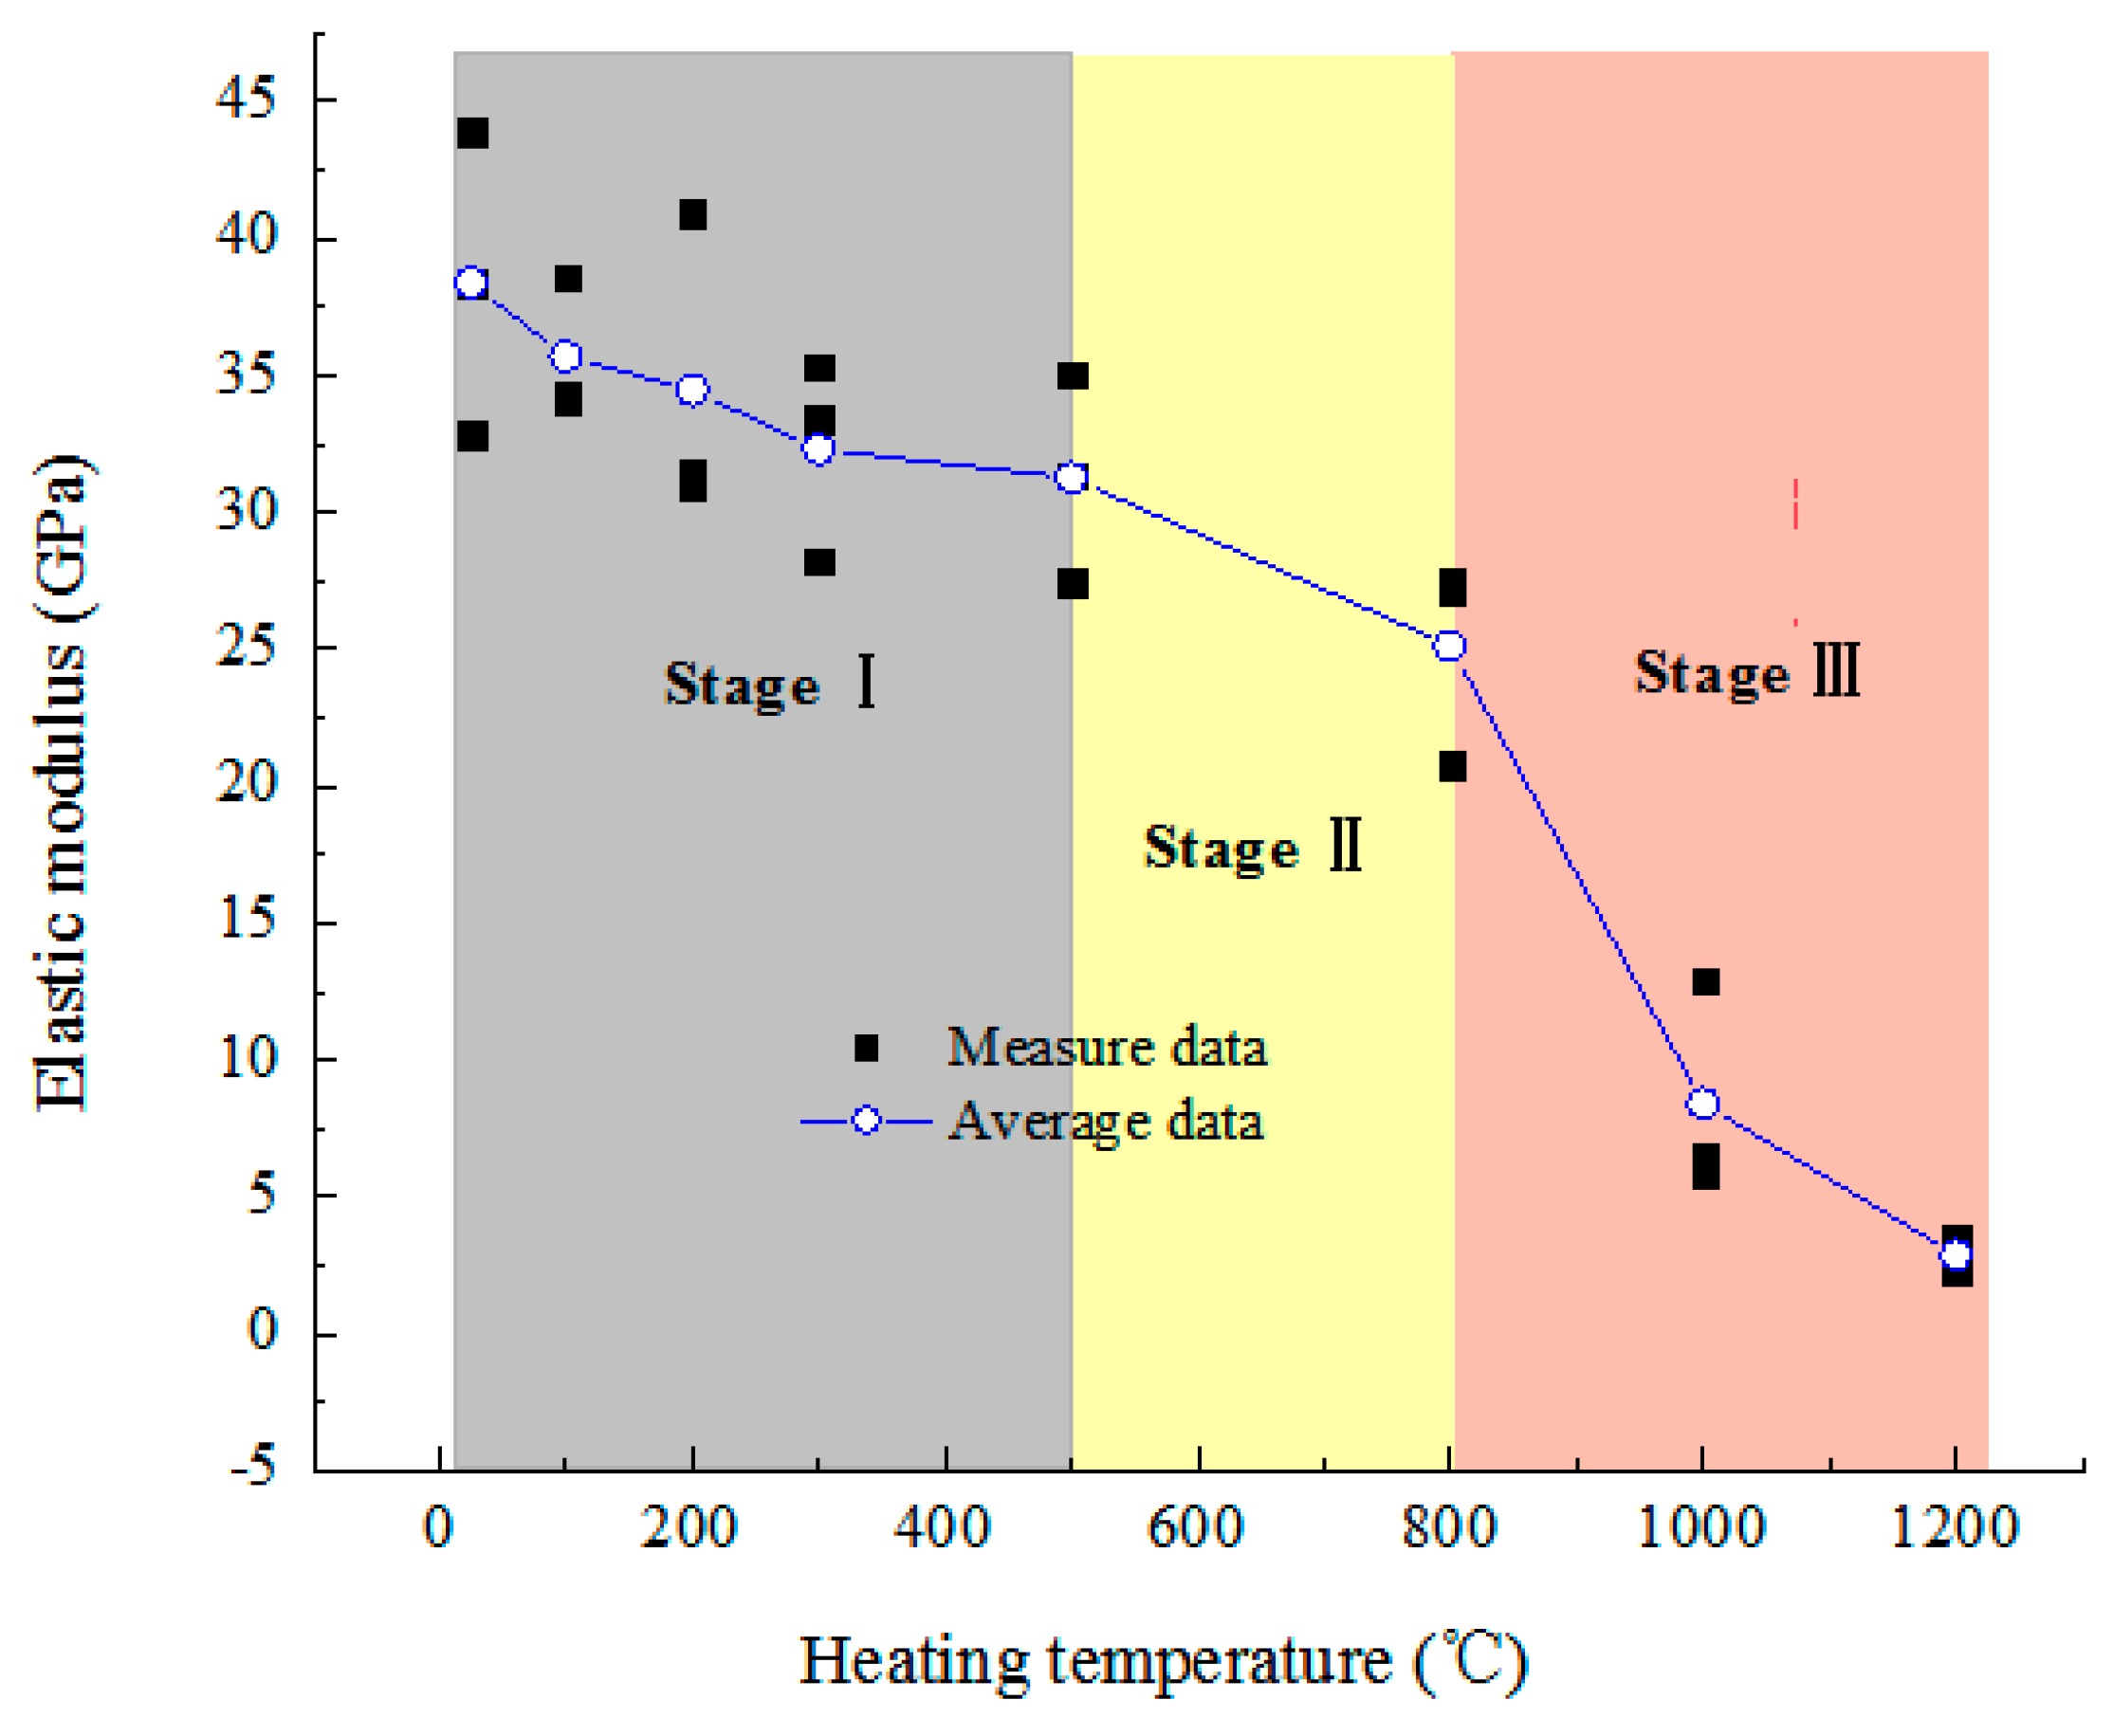
3.3.3. Elastic Modulus

The elastic modulus is the proportional coefficient of stress and strain of rock during elastic deformation. It characterizes the ability of rocks to resist deformation macroscopically, and reflects the bond strength between atoms, ions, or molecules from the microscopical point of view [72,73]. Figure 14 shows the variation of elastic modulus of the granite samples with heating temperature. It can be seen that the elastic modulus generally decreased with increasing temperature. Below 500 °C (Stage Ⅰ), the decrease was not large (from 38.37 GPa before heating to 31.25 GPa at 500 °C, down by 18.5%), this can be called the slowly decreasing stage. During 500–800 °C (stage Ⅱ), called the rapidly decreasing stage, the elastic modulus at 800 °C was just 65.4% of the unheated sample and the ability to resist deformation was greatly reduced. Between 800 °C and 1200 °C (stage Ⅲ), called the dramatically decreasing stage, the rate of decline was greatly accelerated, the elastic modulus dropped to 8.39 GPa at 1000 °C and was only 2.87 GPa at 1200 °C, which is 7.48% of that before heating. The rock was about to melt into a fluid, almost losing its ability to resist deformation.

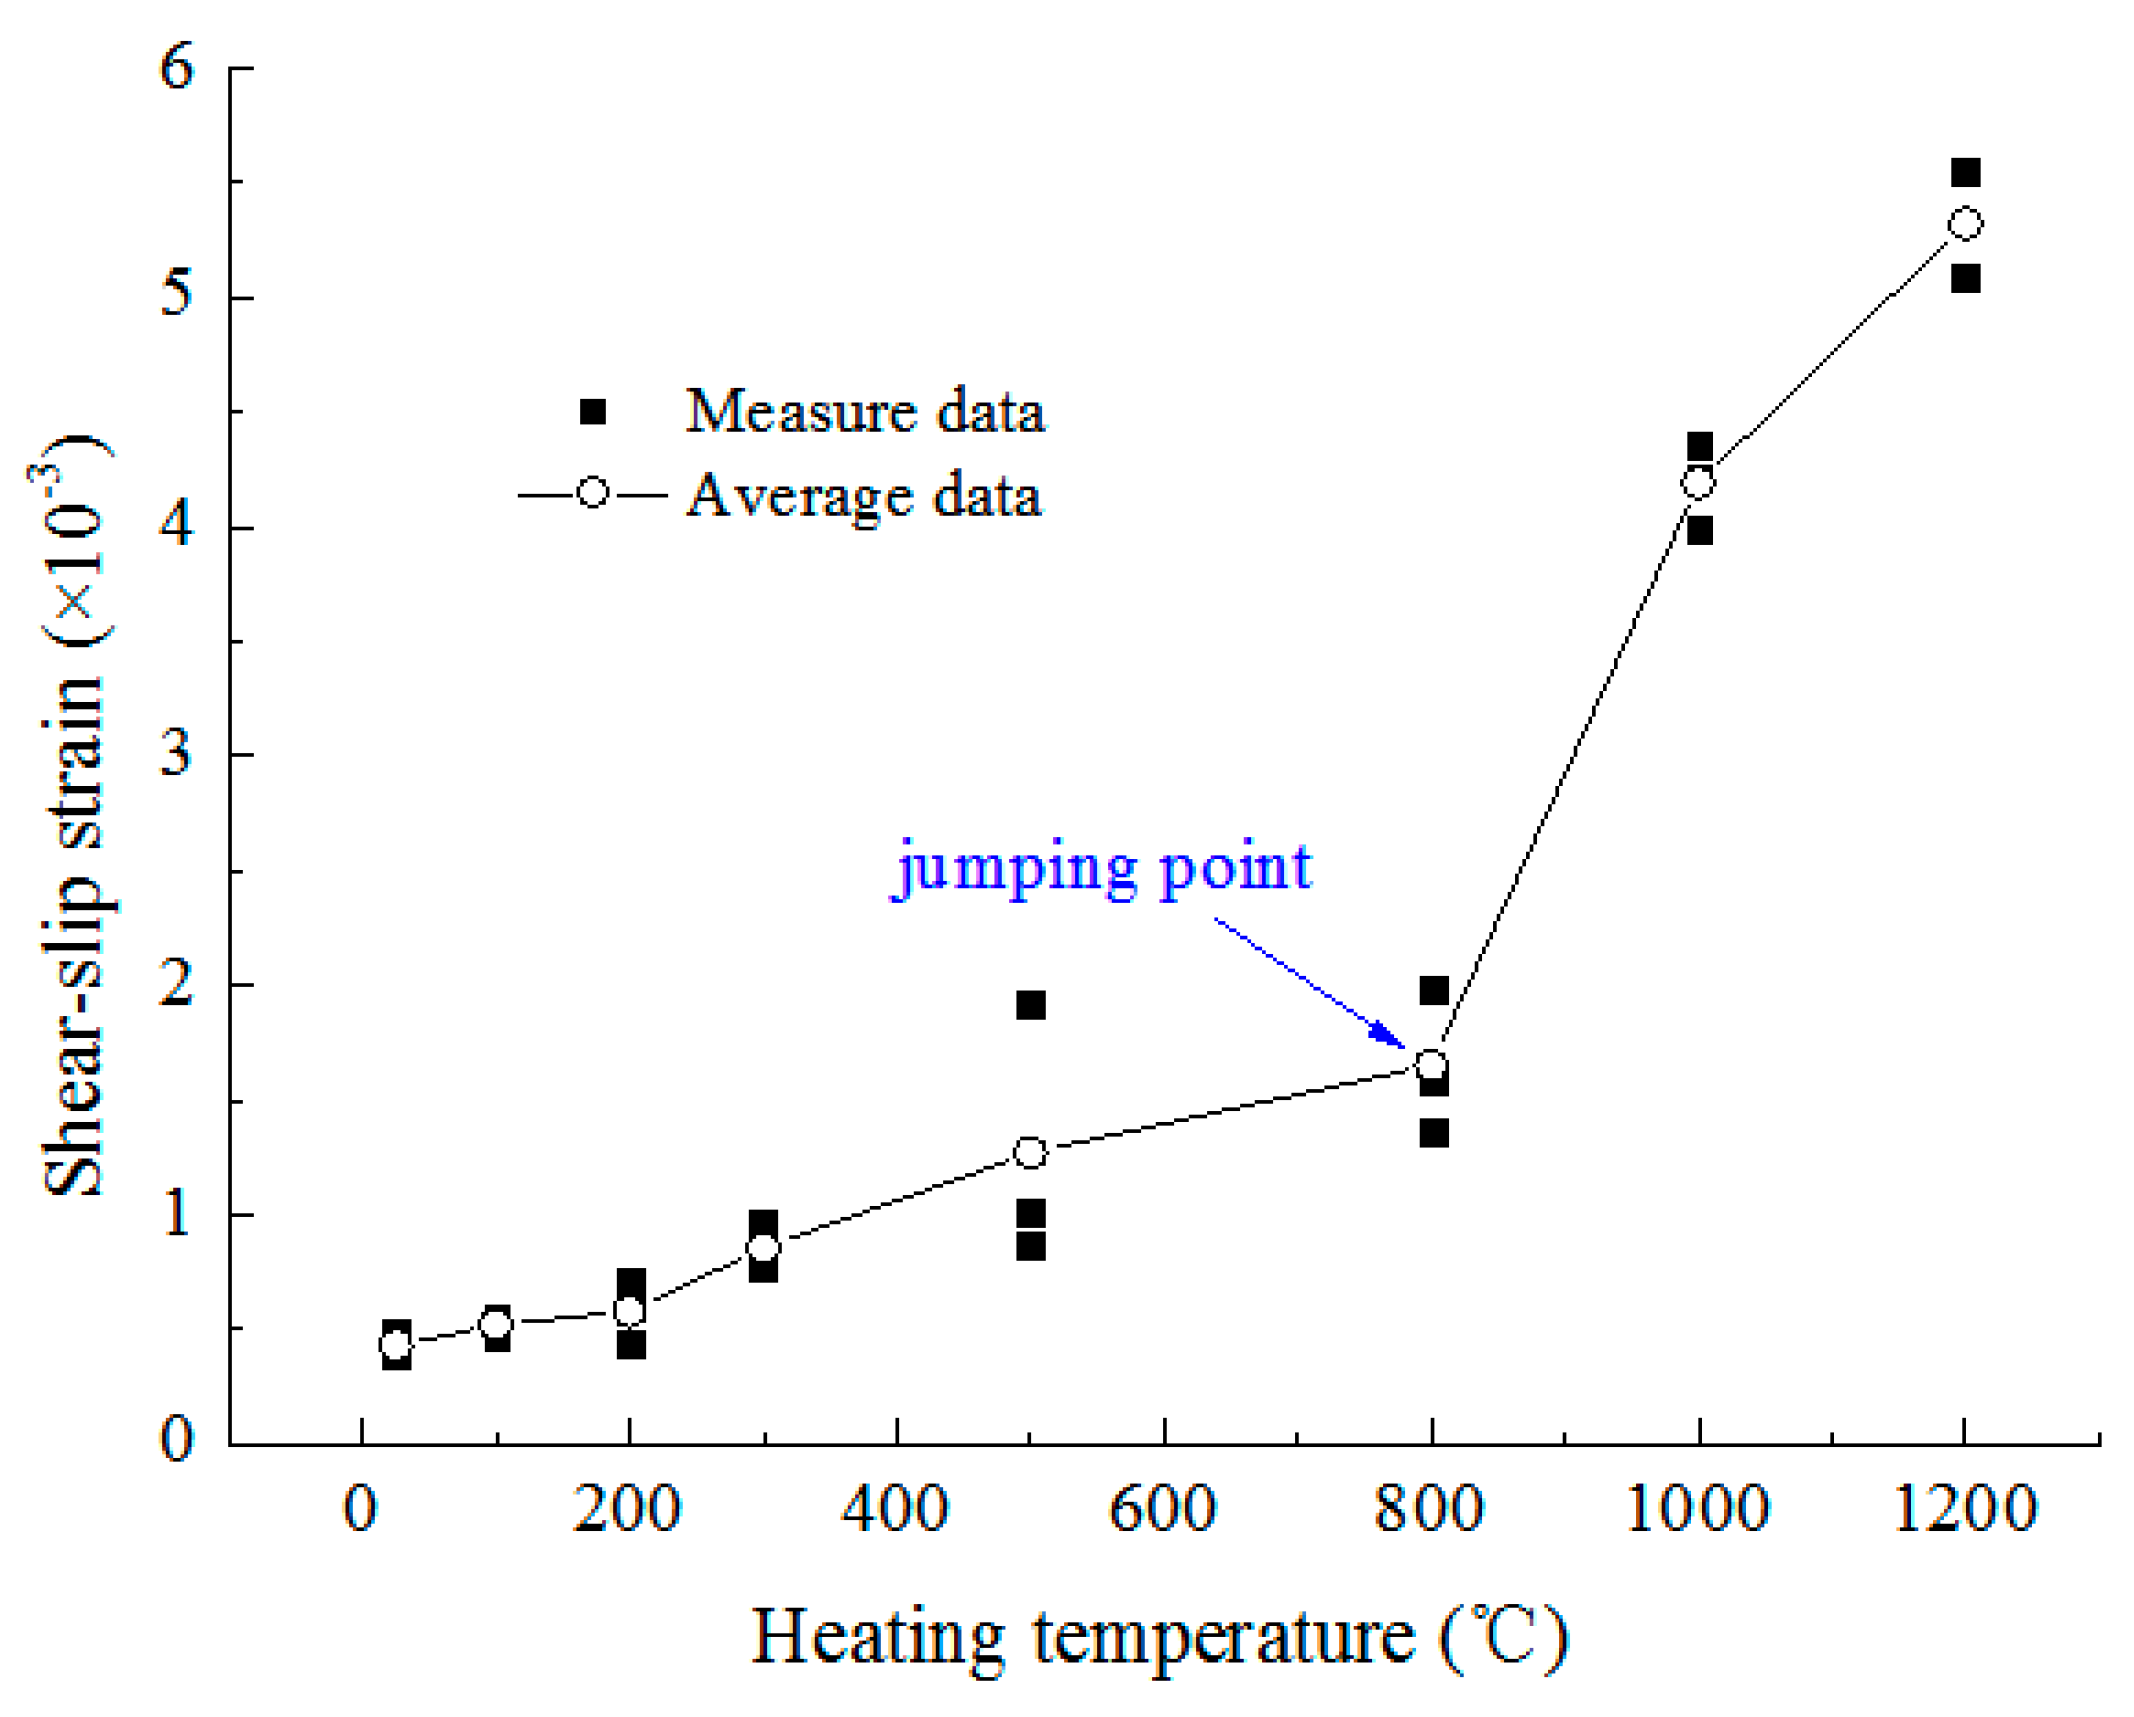
3.3.4. Shear-Slip Strain

In the post-peak phase of the stress–strain curve, the strain usually has a significant increase when the stress changes little but has a downward trend, and it is generally considered that this is caused by the shear slip of the weak surface in the rock [74,75,76]. Therefore, this part of the strain is called shear-slip strain and can be used to characterize the plastic characteristics of the rock [36]. As shown in Figure 15, the shear-slip strain generally increases with the increase of heating temperature. When the heating temperature was lower than 200 °C, it almost had no change. During 200–800 °C, it increased slightly, and rose to 1.65 × 10⁻³ at 800 °C, although it was 2.83 times higher than that of the unheated rock sample, but the rock had not shown significant brittle-ductile transition. At 800 °C is an obvious jumping point. When the temperature was greater than 800 °C, the increasing rate of shear-slip strain was obviously accelerated, and it reached 4.19 × 10⁻³ at 1000 °C, and further increased to 5.32 × 10⁻³ at 1200 °C, which is 12.37 times that of unheated rock samples, showing significant plasticity.

4. Discussion

At room temperature, the internal structure and the original stress distribution of the granite are relatively stable. The high temperature heat treatment changes the mineral composition characteristics (Figure 3 and Figure 4), which causes a major change in the pore structure and mechanical properties of the granite rocks. The specific performances were as follows: the porosity increased exponentially with increasing temperature (Figure 11), and the pore volume and proportion with different sizes greatly changed, especially the medium pores with radius of 1–10 μm (Figure 9 and Figure 10). The P-wave velocity, UCS, and elastic modulus all decreased with increasing temperature (Figure 12, Figure 13 and Figure 14), while the peak strain and the shear-slip strain increased gradually (Figure 13 and Figure 15). In general, these changes were caused by various physical changes within the rock structure, such as water evaporation [77], mineral thermal expansion [78,79], thermal stress-induced microcrack initiation [80,81,82], and some chemical changes, such as crystal phase transformation and mineral composition transformation [83].
Granite samples mainly undergo physical changes when the heating temperature is relatively low, while chemical changes occur when the temperature is high. The whole change process with increasing temperature can be explained as follows:
(1) Below 100 °C, due to the looseness of the combination with rock minerals, the attached water and the interlayer water present in the tiny pores first escape [84]. On the other hand, the heat treatment causes the mineral particles to swell, resulting in the closure of the primary crack [30]. So, the rock porosity decreases a little bit (Figure 11), the water escapes, and the crack closure also causes a slight increase in the P-wave velocity (Figure 12). However, thermal damage has already occurred, so the UCS and the elastic modulus drop slightly (Figure 13 and Figure 14).
(2) At 100–300 °C, the physically combined water in the rock sample is lost in the form of water vapor, and the high-pressure water vapor promotes the initiation and expansion of cracks and pores [84]. In addition, feldspar and quartz, the two most abundant minerals in granite rocks, begin to show obvious differences in thermal expansion, as shown in Figure 16, which presents the curves of the thermal expansion coefficient of quartz and calcium feldspar with heating temperature [85]. It can be seen that the difference in the expansion coefficient between the two minerals gets larger and larger, and their uncoordinated thermal expansion leads to the initiation and propagation of cracks [27], so the porosity increases slightly at this stage (Figure 11), and the P-wave velocity, UCS, and elastic modulus all have a small decrease (Figure 12, Figure 13 and Figure 14).
(3) At 300–500 °C, the attached water and physically combined water in the rock are almost evaporated, and the chemically bound water, such as crystal water and mineral structure water, begin to separate out, resulting in the destruction of the mineral lattice [29,84]. The mineral particles continue to expand thermally and initiate new cracks, but some cracks and pores may close due to the particle expansion, so the porosity increases little or even slightly decreases (Figure 11). The closure of cracks and pores reduces the deformation space of rock under external loads. Therefore, even if thermal damage develops, the ability to resist deformation does not degrade too much, and the elastic modulus changes little (Figure 14). The incompatibility and anisotropy of thermal expansion of feldspar and quartz are further increased (Figure 16) and thermal stresses are generated inside and between the mineral particles, especially at the singular interfaces of the particles and the crack tips. When the strength criterion of the mineral particle or particle interface is met, new cracks are generated and the damage degree of the rock increases, which causes a large drop in the P-wave velocity and the UCS (Figure 12 and Figure 13).
(4) At 500–800 °C, the difference in thermal expansion among minerals reaches a peak (Figure 16). More importantly, the minerals in the rock undergo phase transformations. The pyroxene transforms from monoclinic β phase to tetragonal α phase at about 500 °C [84], the quartz also changes from trigonal α phase to hexagonal β phase at around 573 °C [86,87,88], and the angle between two Si-O tetrahedrons in the quartz lattice changes from 150° to 180° (Figure 17 [89]). The crystallinity of feldspar deteriorates (Figure 6) and this change is also reflected in an endothermic valley on at 700–900 °C on its differential thermal curve, which is equivalent to polymorphic transformation [87,90]. The volume of quartz increases rapidly and anisotropically, which often causes cracks in the quartz crystal, and may connect the original isolated pores and the dead-end pores. These reactions greatly increase the effective porosity of the rock (Figure 11) and significantly reduce the P-wave velocity, the UCS, and the elastic modulus (Figure 12, Figure 13 and Figure 14). The microstructure evolution process of the quartz crystal is shown in Figure 18 [7]. The increase of crack density with temperature and the consequent porosity increases were found to be the main causes of degradation of physical and mechanical properties [91,92].
More noticeably, another change at around 800 °C is a significant increase in peak strain and shear-slip strain (Figure 13 and Figure 15), indicating that the rock has undergone a certain brittle–plastic transition, which can be verified by the SEM tests [93]. Figure 19 shows the SEM images of fracture surfaces of granite specimens under different heating temperatures. When the temperature is lower than 800 °C, the strain energy consumed by cracking along the cleavage is the least [94], so the transgranular cleavage fracture and brittle intergranular fracture are the main fracture modes (Figure 19a–c). For such tensile brittle fractures, the critical stress of crack initiation is usually greater than or equal to the critical stress of crack propagation. Therefore, the fracture is generally the result of high-speed expansion of a main crack, sometimes secondary cracks are induced, and finally the granite samples fail in a brittle splitting manner. When the temperature reaches 800 °C, a mixed fracture of both the transgranular crack and the shear sliding band appears (Figure 19d). The granite samples fail by the coexistence of tension and shear. The failure mode changes from brittle to quasi-brittle [95].
(5) Above 800 °C, feldspar and quartz particles in granite would partially melt along mineral boundaries [96,97] and metal bonds such as Al-O, K-O, Na-O, and Ca-O in rock minerals break. This was confirmed by the SEM images in Figure 19, particularly at 1200 °C, where the fracture aperture and density were both significantly reduced compared to that at 800 °C, indicating rebonding of cracks due to the melting followed by recrystallization of grains [33,98]. Quartz further transforms from β phase to β-tridymite at around 870 °C [29,87], causing a significant reduction in density to 2.25 g/cm3, which is suggested to be the major source for another jump in the thermal expansion [87]. Moreover, the melting points of quartz, potassium feldspar, and albite are 1713 °C, 1290 °C, and 1215 °C, respectively. Alkaline feldspar has a good fluxing action. If feldspar is added to the Al2O3-SiO2 system, the liquid phase begins to appear at 985 °C ± 20 °C, and the higher the content of feldspar, the lower the initial melting temperature [99]. The crystalline state of the minerals deteriorates and produces chemical reactions (Figure 3). These changes result in a further large increase in the number and volume of pores in the rock (Figure 11), thus the P-wave velocity, UCS, and elastic modulus are drastically reduced (Figure 12, Figure 13 and Figure 14). When the temperature reaches 1200 °C, many plastic dimples and microhollows appear on the fracture surface (Figure 19f) and these microhollows may be the escape channels of the gas generated by the mineral decomposition and reaction, because the original channels are blocked by the melt. This explanation needs to be confirmed by future tests. Significant plastic deformation occurs before the rock failure and the peak strain and shear-slip strain increase rapidly with the heating temperature (Figure 13 and Figure 15). The failure mode changes from quasi-brittle to plastic, and the granite becomes more homogeneous and isotropic [100].
In summary, the changes in pore structure and mechanical properties of granite under the influence of heat treatment are the result of physical effects such as mineral dehydration, chemical effects such as mineral phase transformation, and mechanical effects such as thermal cracking caused by uncoordinated thermal expansion of minerals.

5. Conclusions

This study experimentally investigated and analyzed the mineral composition, pore structure, and mechanical characteristics of pyroxene granite rock after exposure to different high temperatures from 25 °C to 1200 °C. The main conclusions are as follows:
(1)
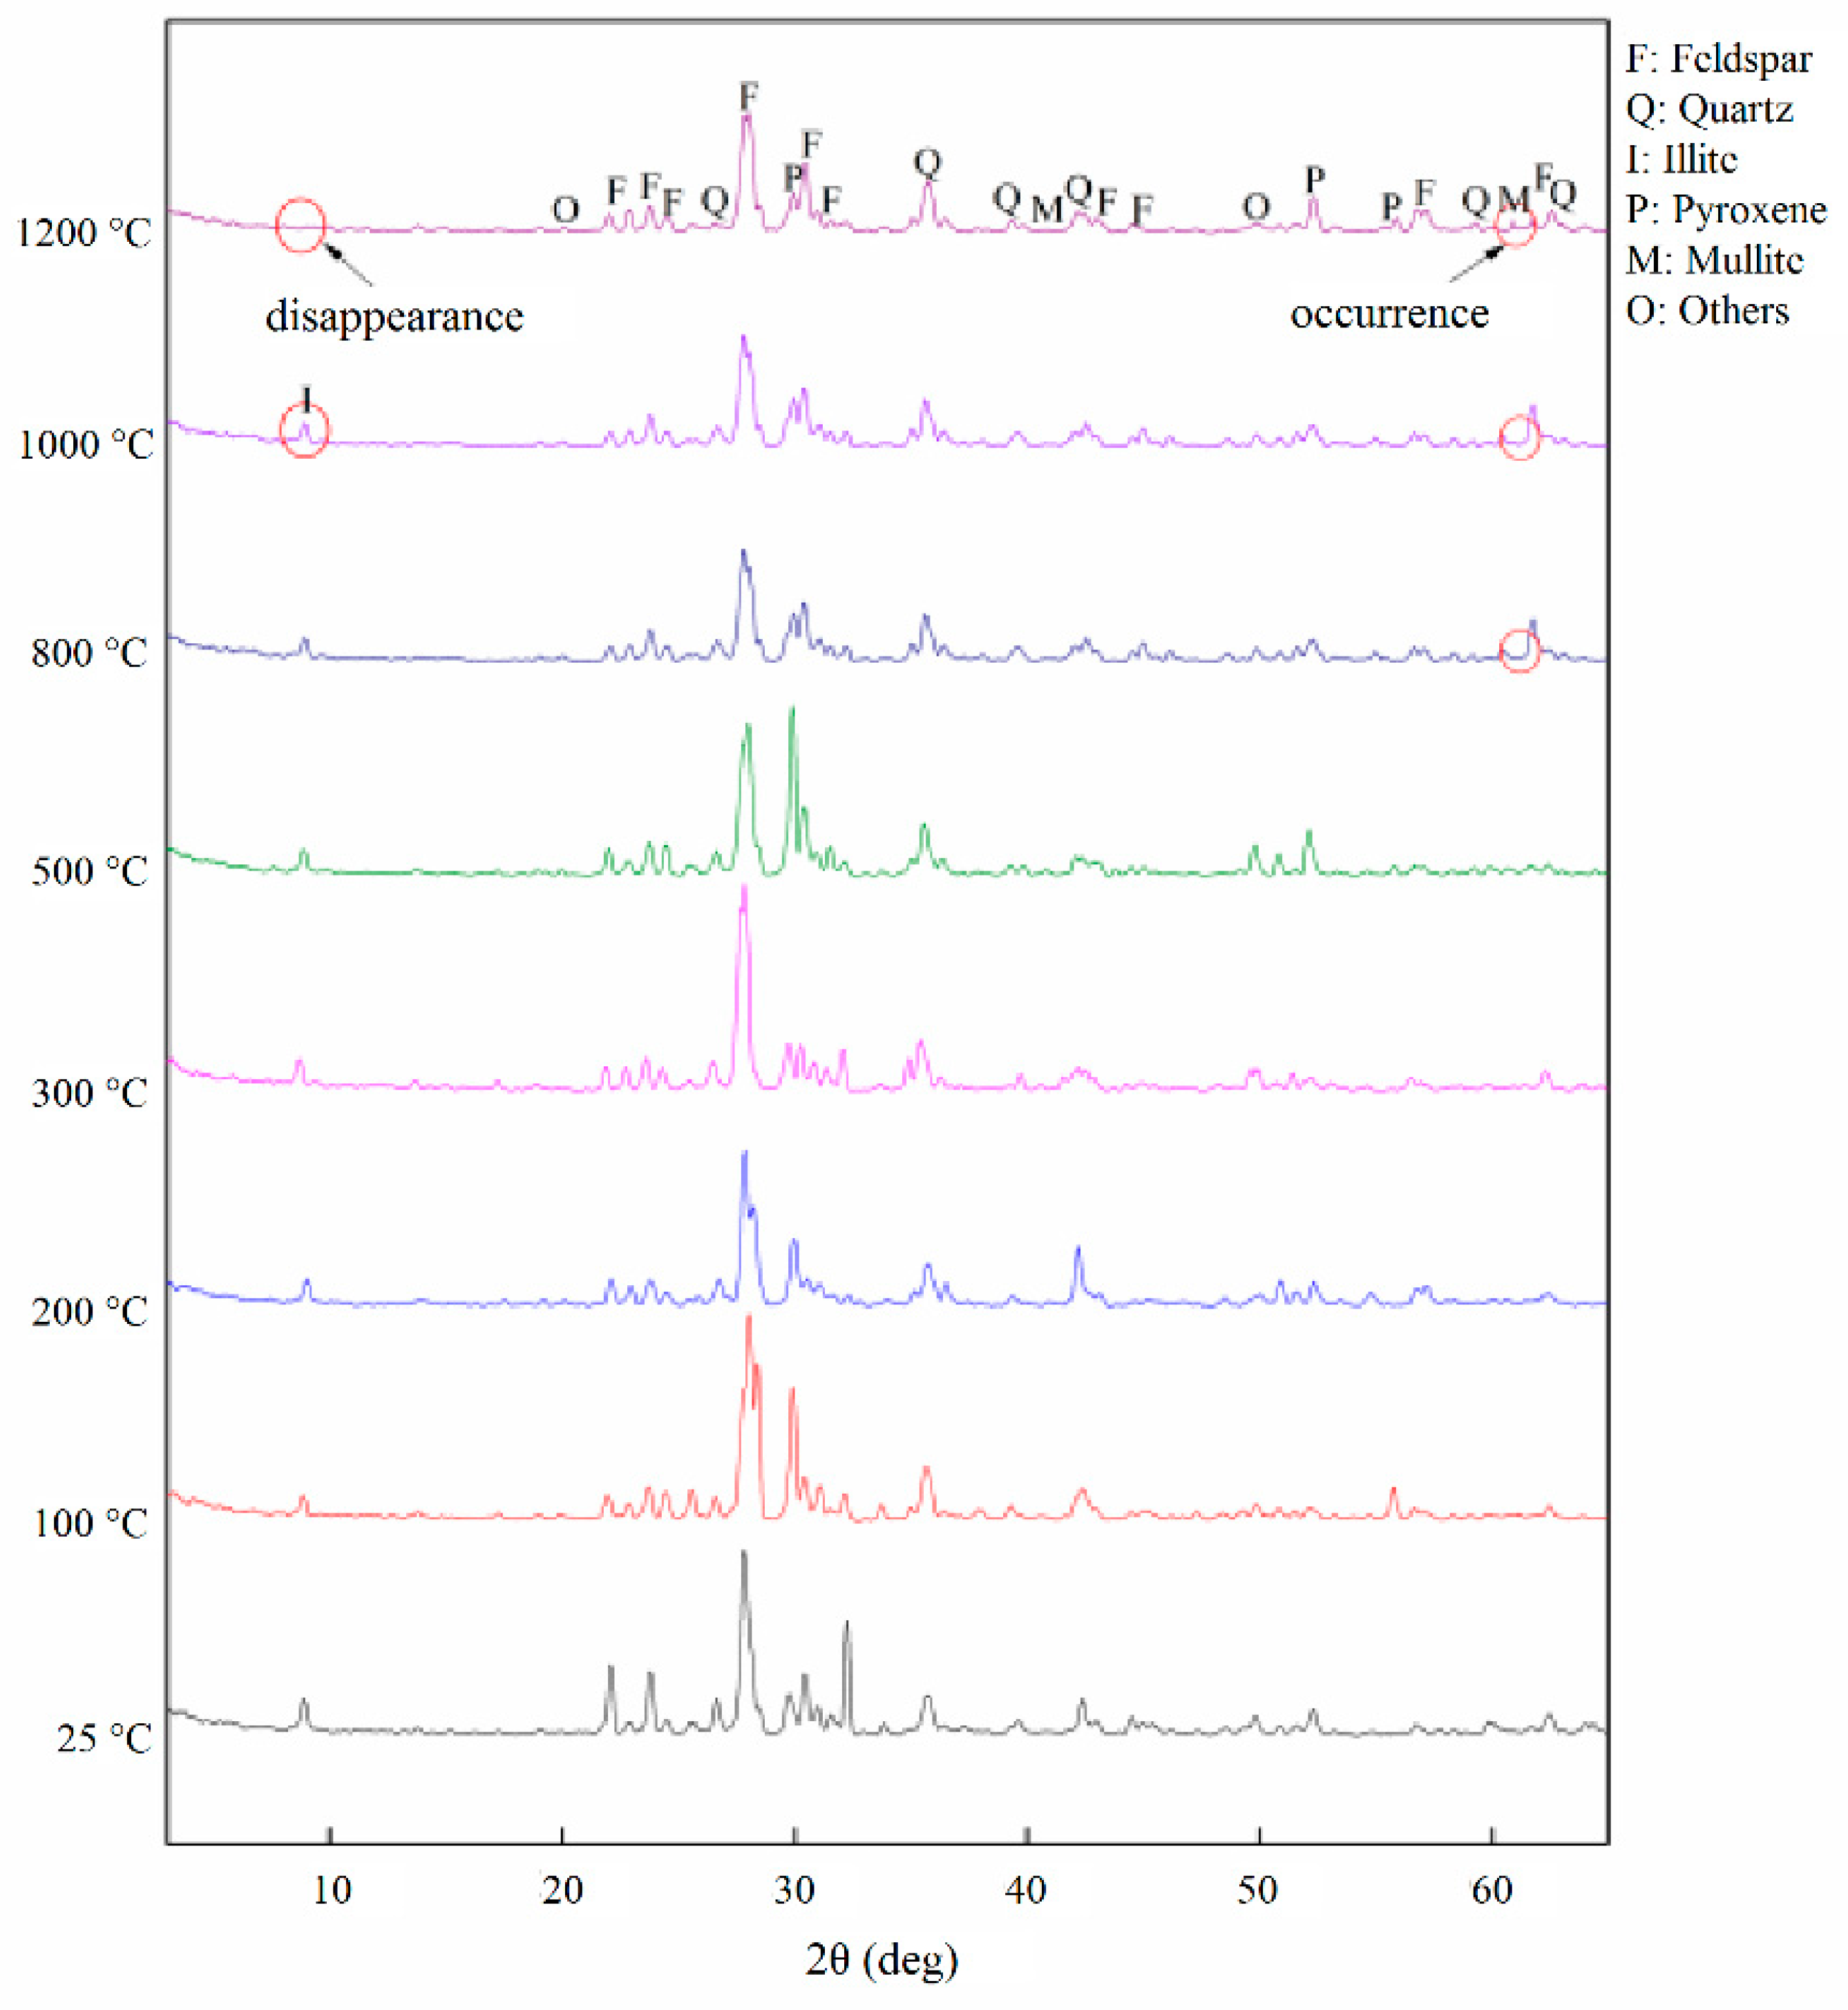
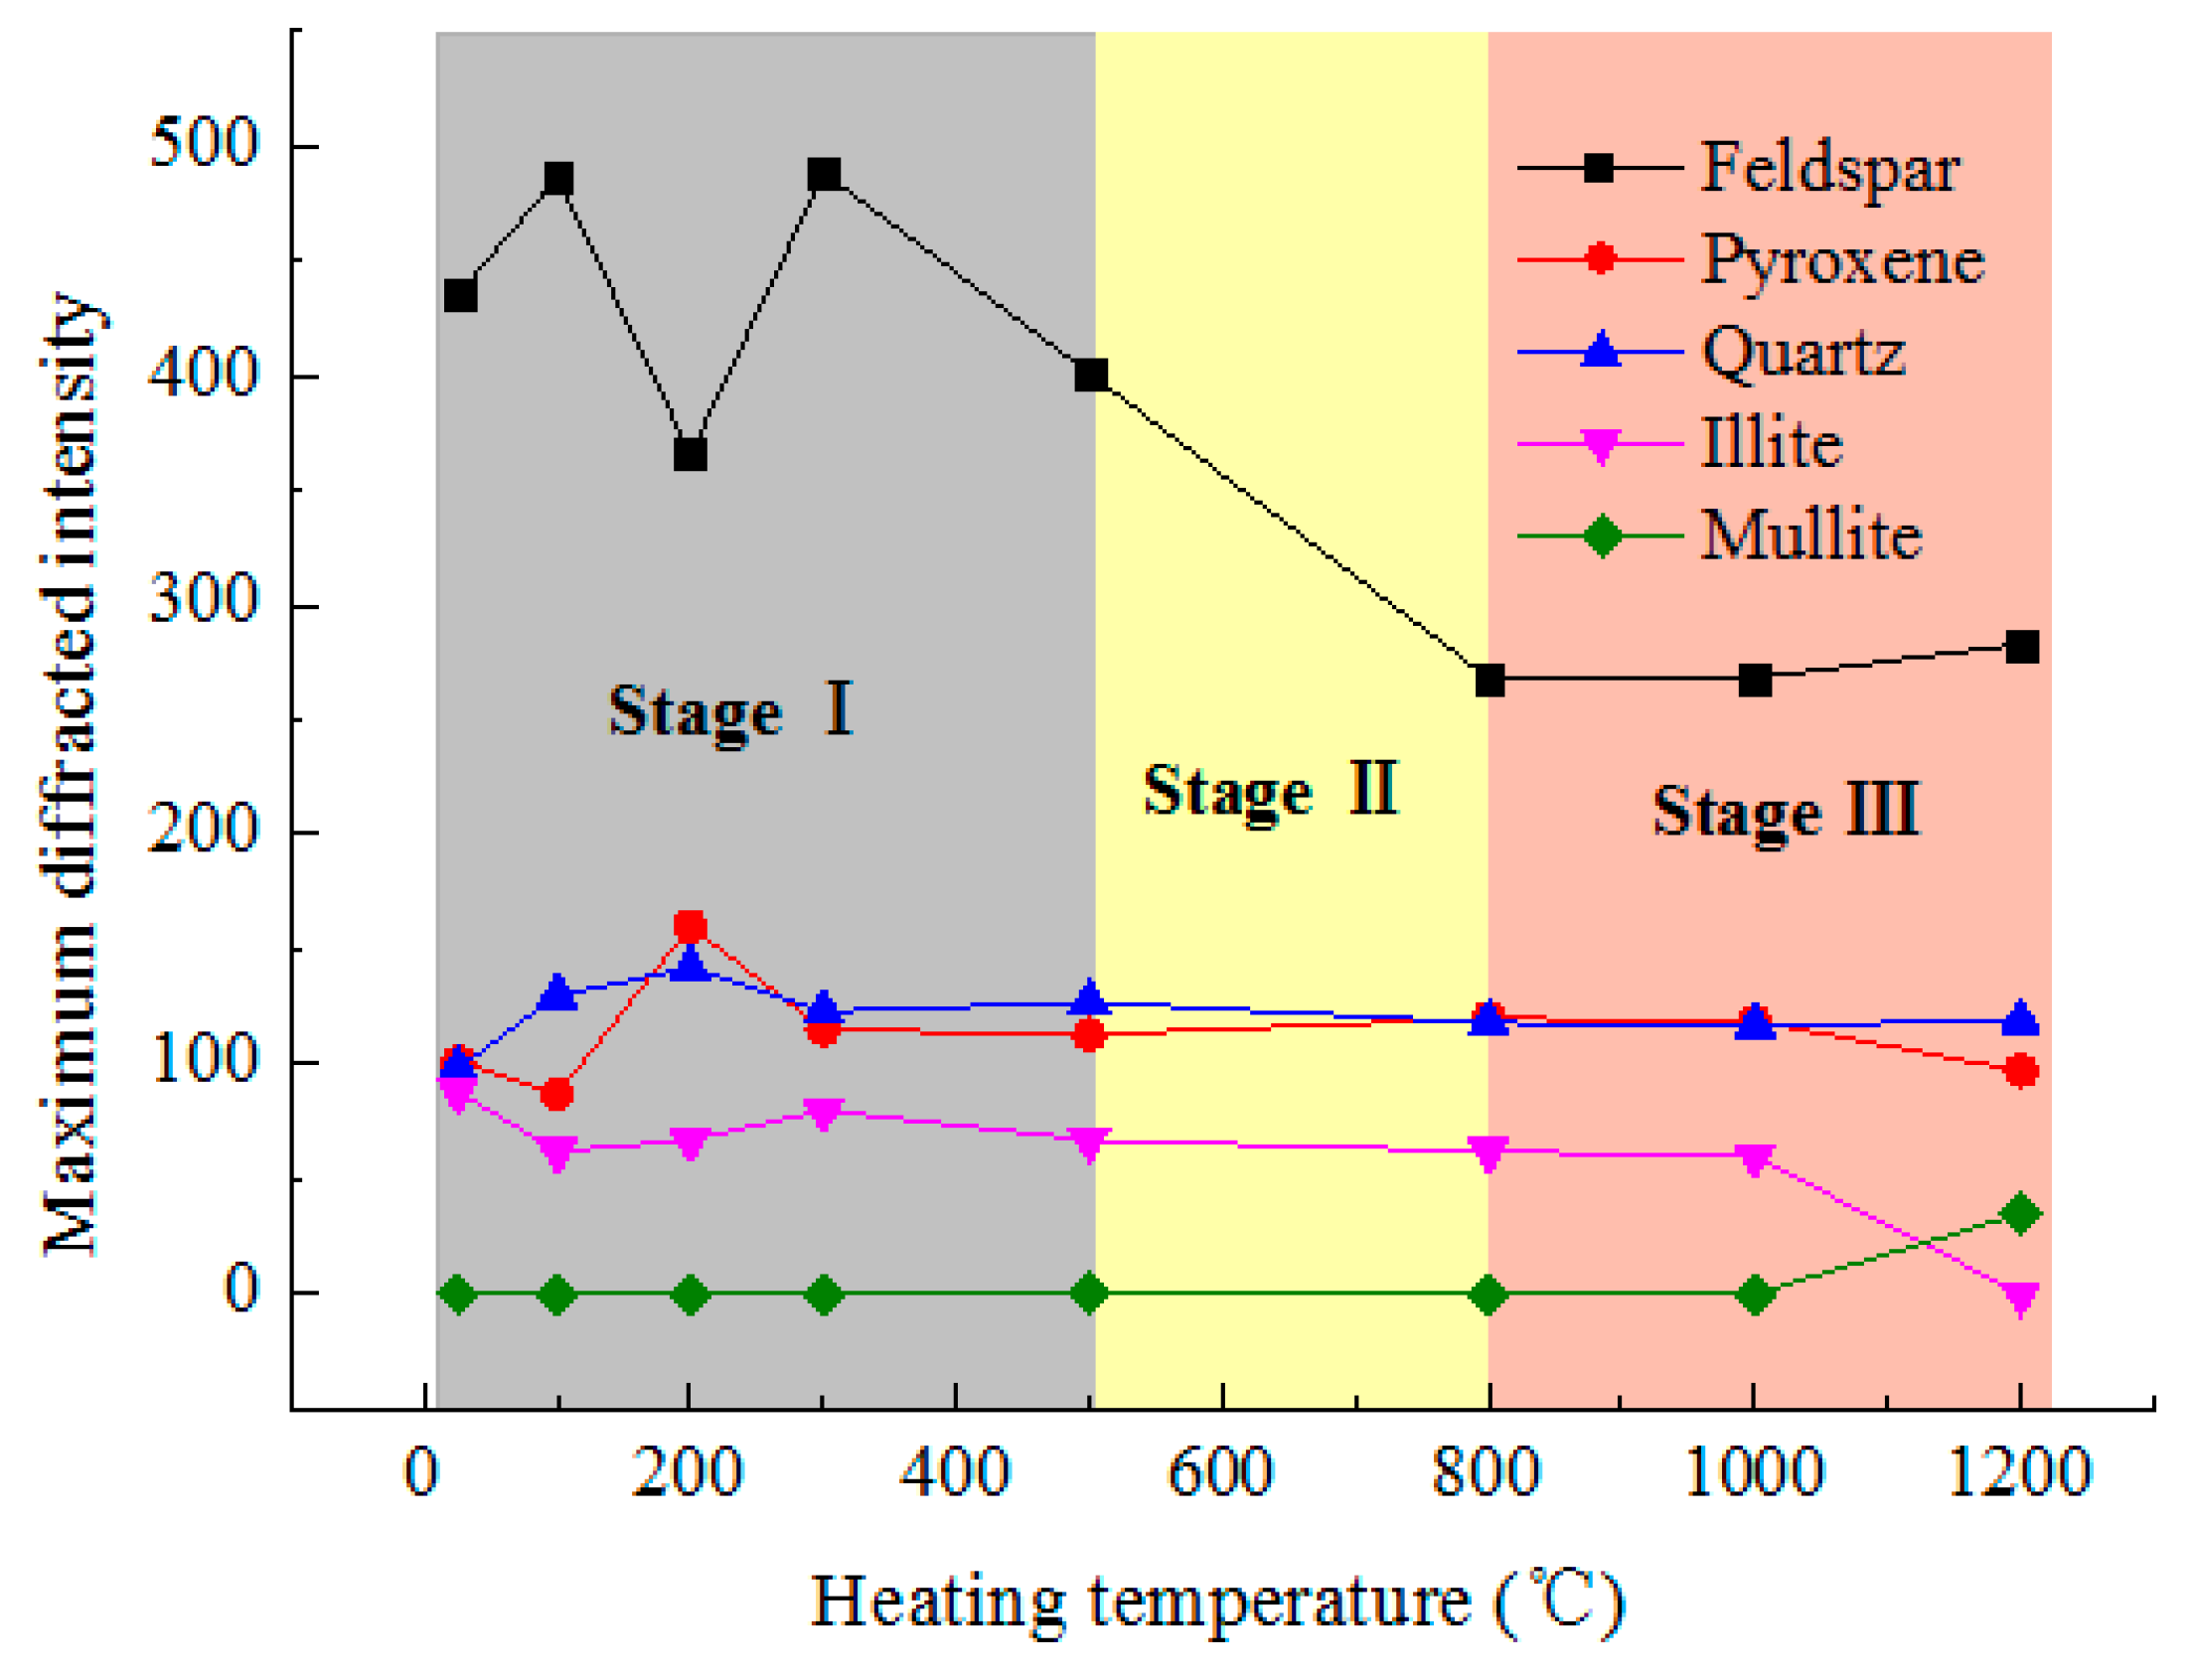
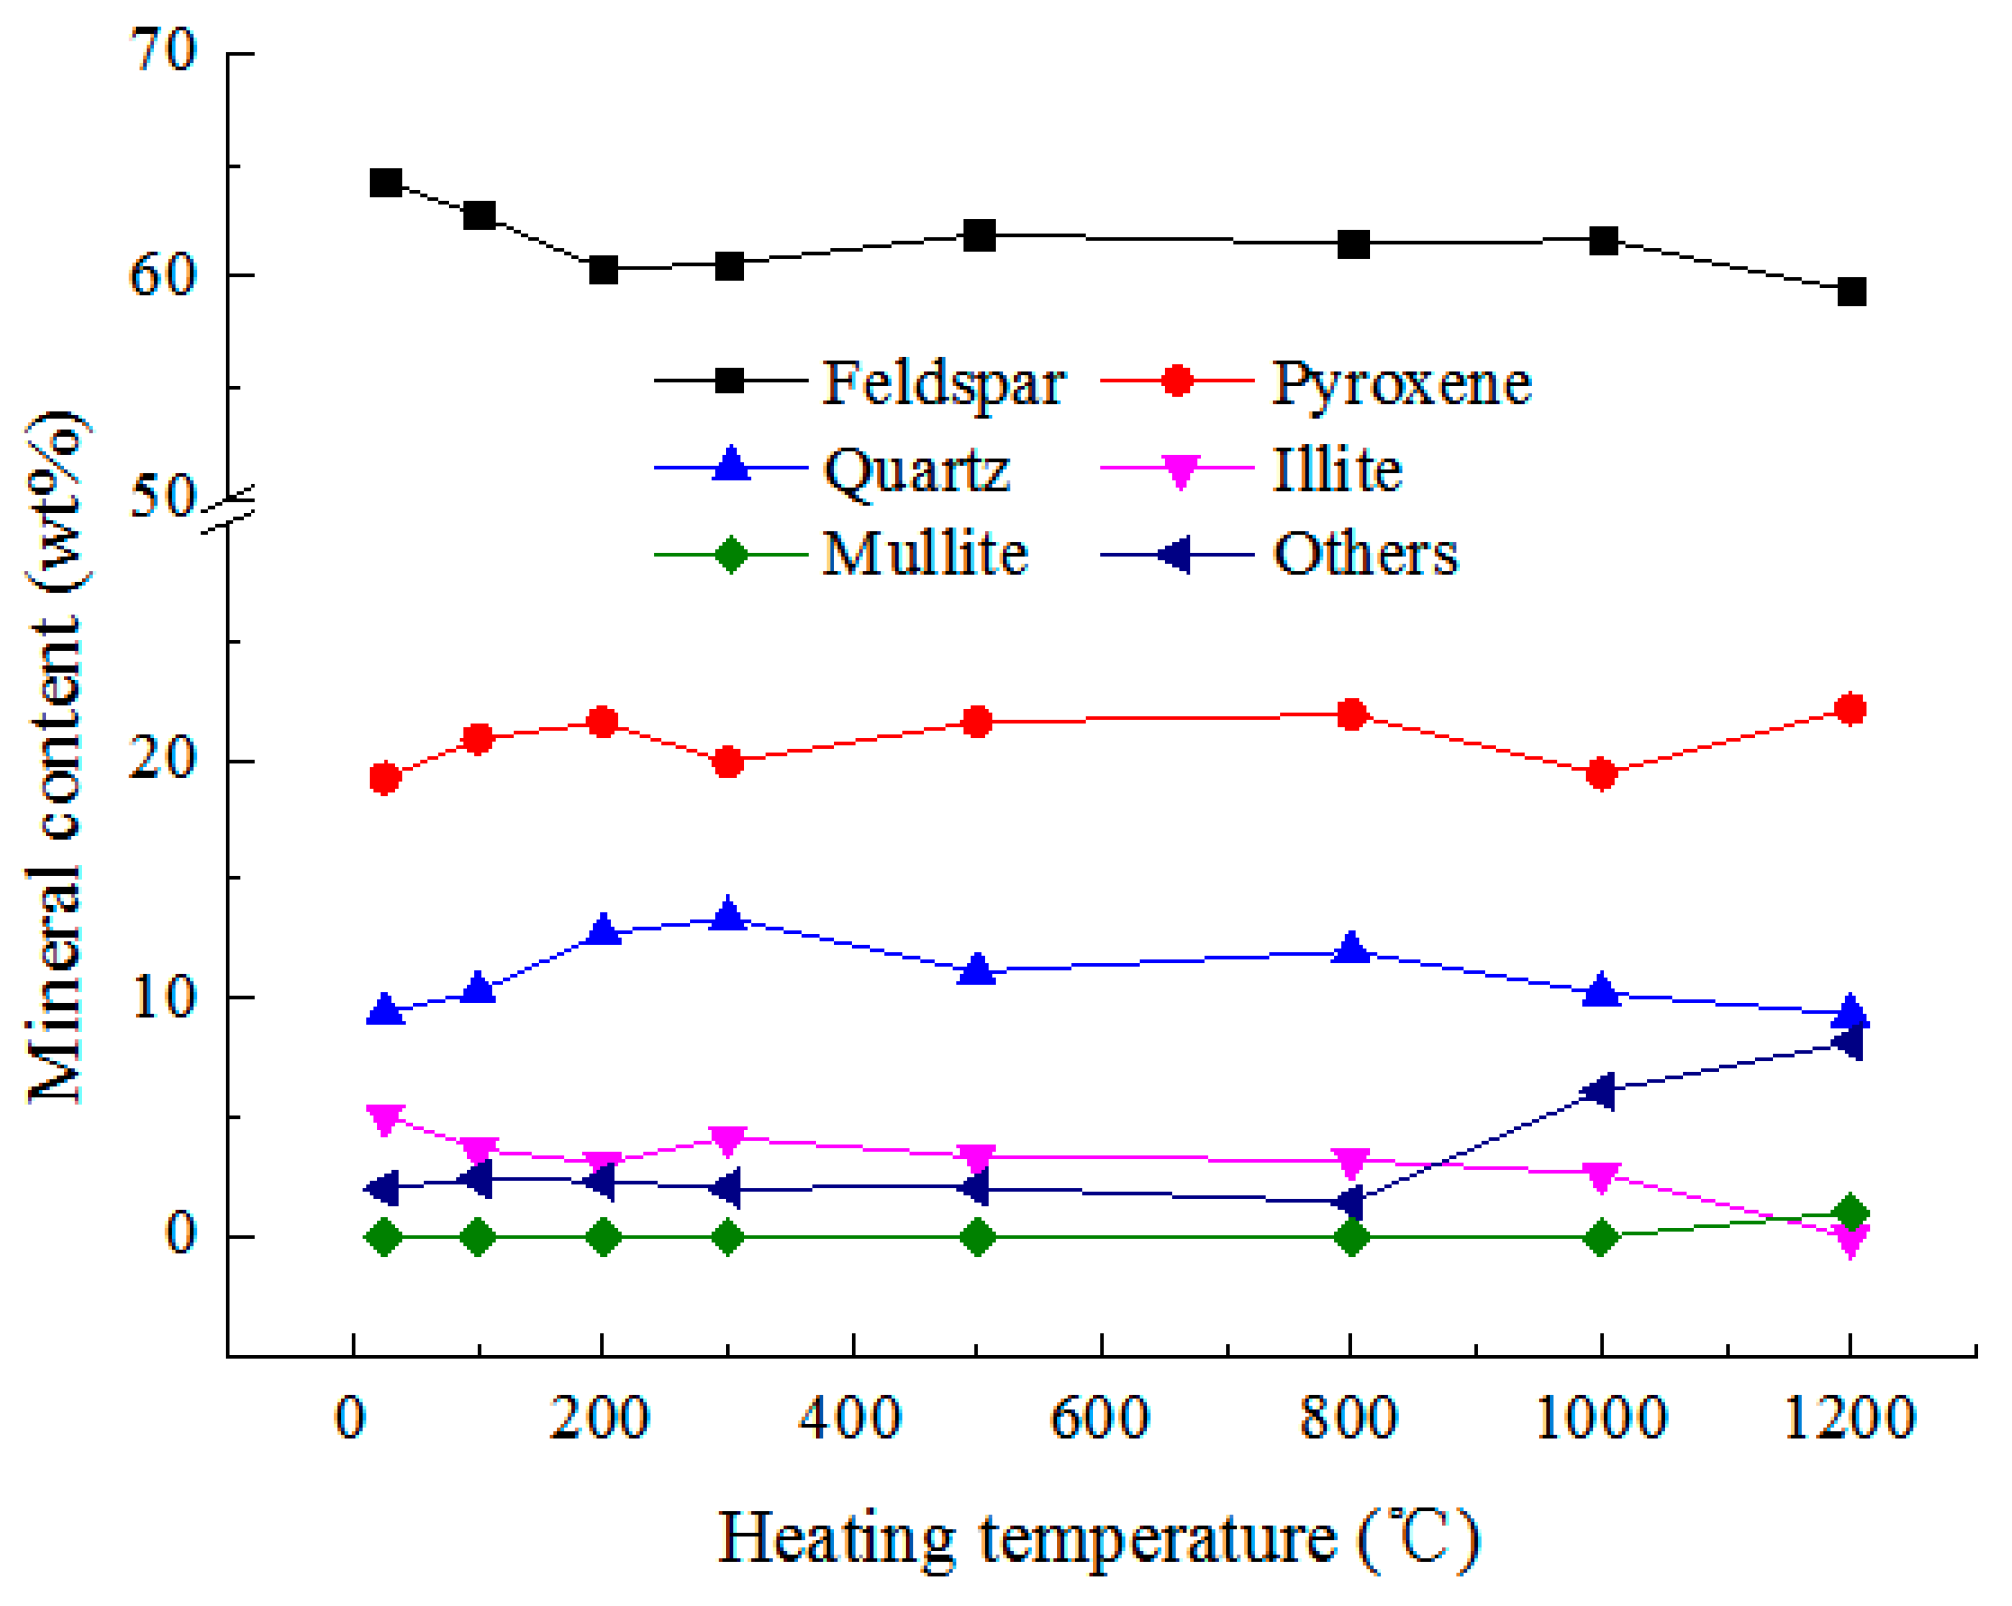
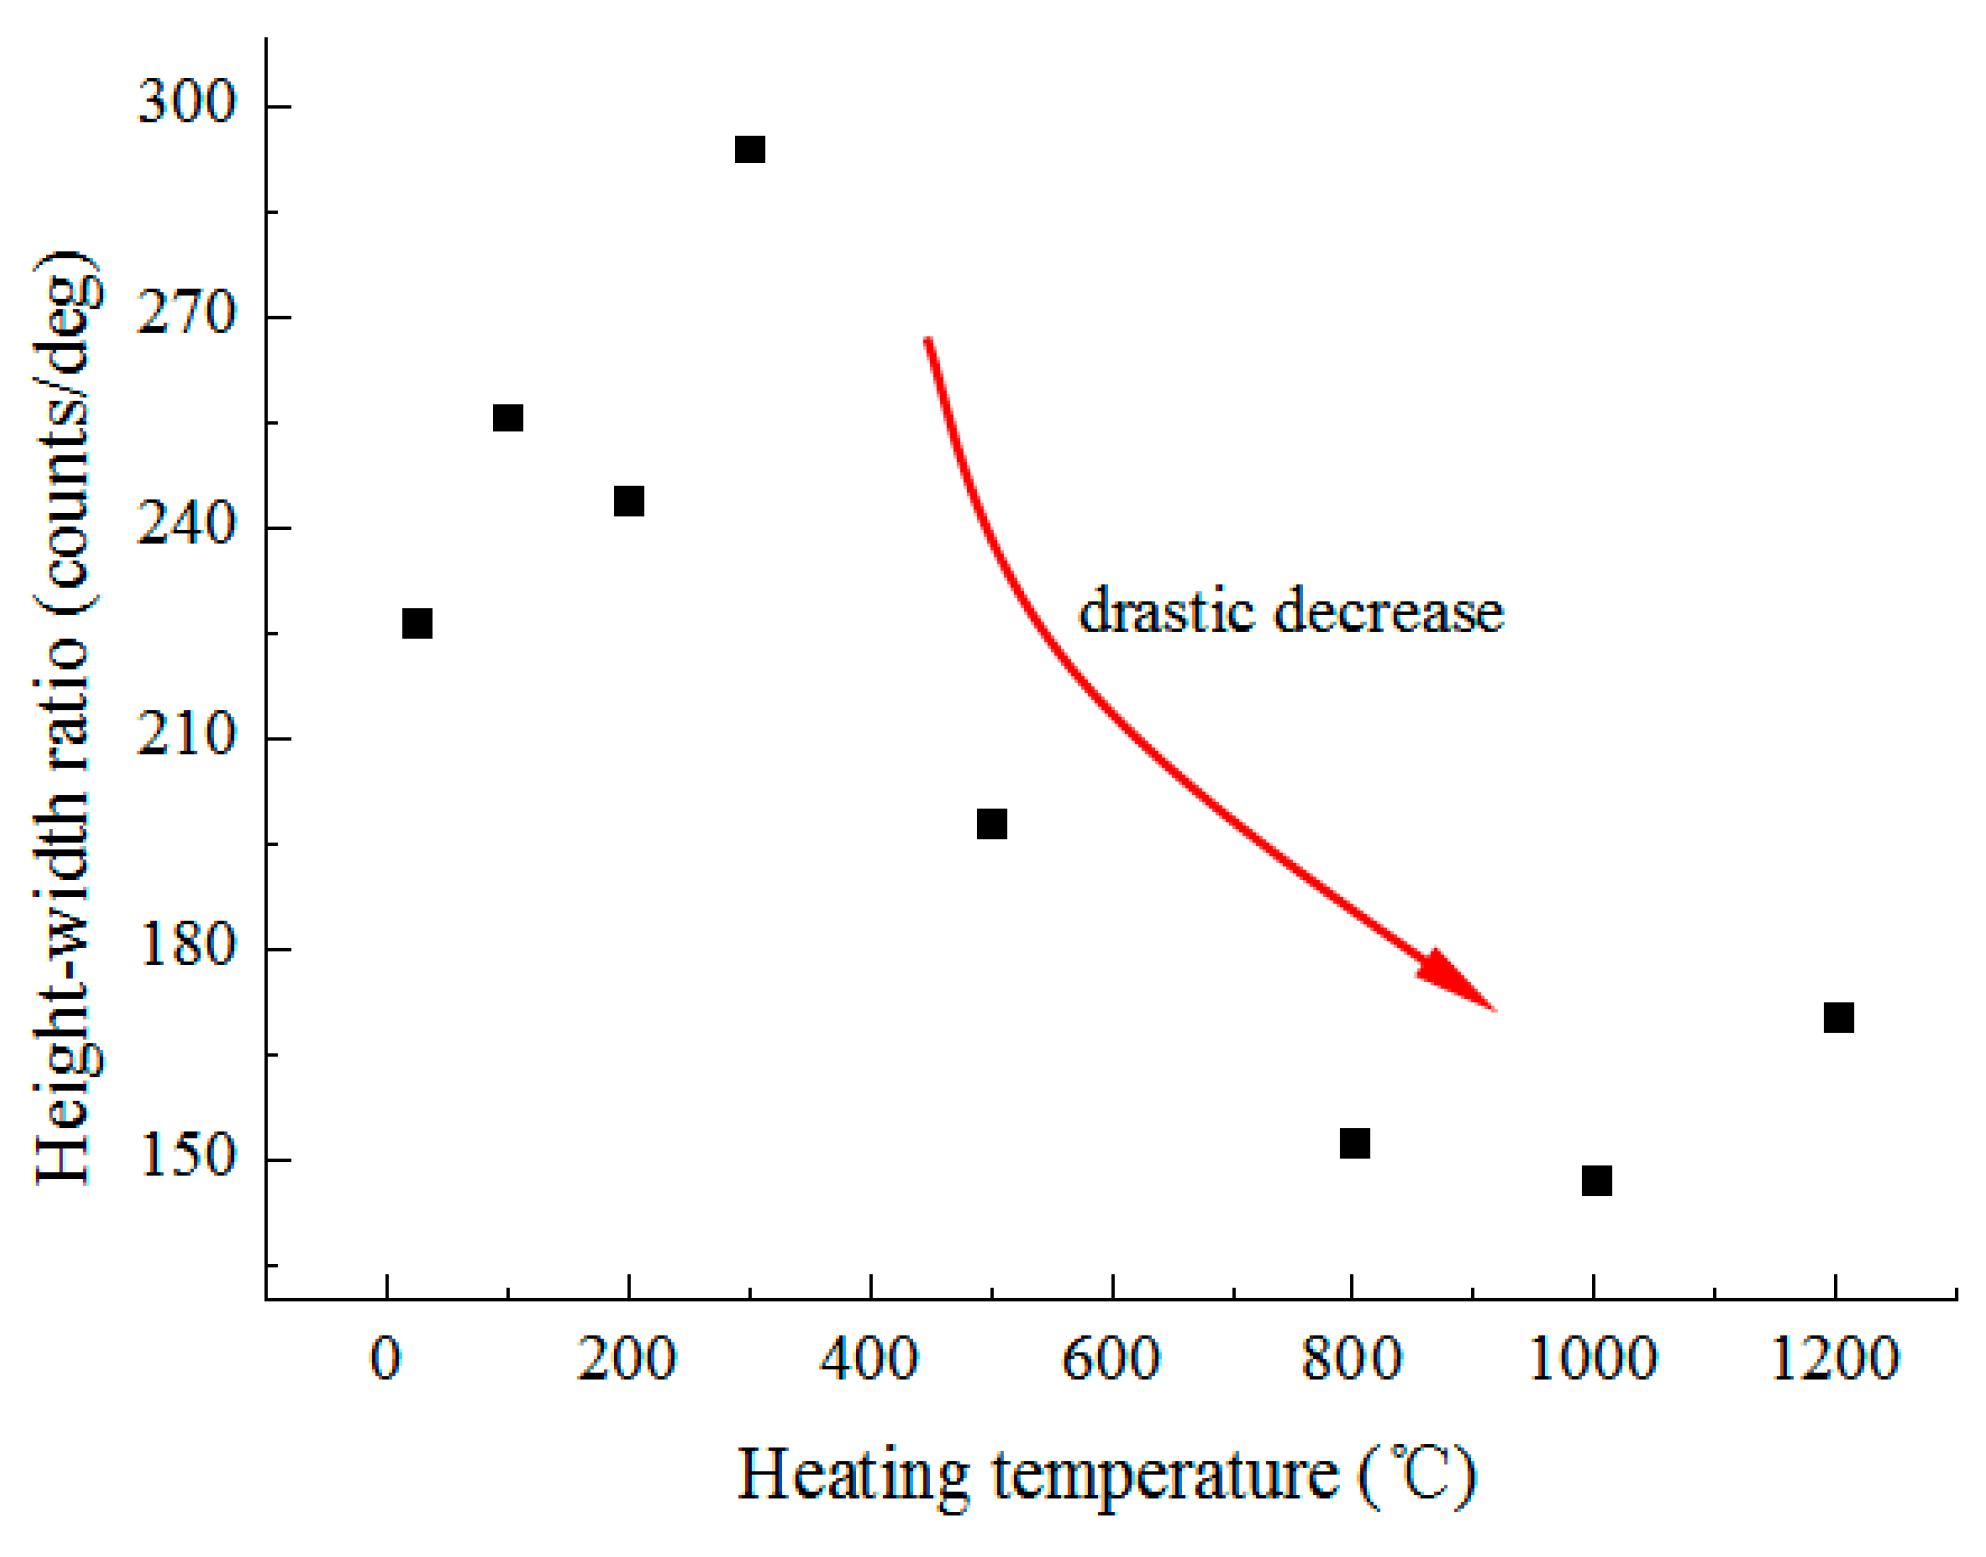
Mineral composition. The main components of the examined pyroxene granite are feldspar, quartz, pyroxene, and some illite. Below 500 °C, the MDIs of the minerals are comparatively stable. In 500–800 °C, the diffraction angles become wider, but the chemical composition does not change. Above 800 °C, illite and quartz react chemically to produce mullite and the crystal state of the minerals deteriorate dramatically.
(2)
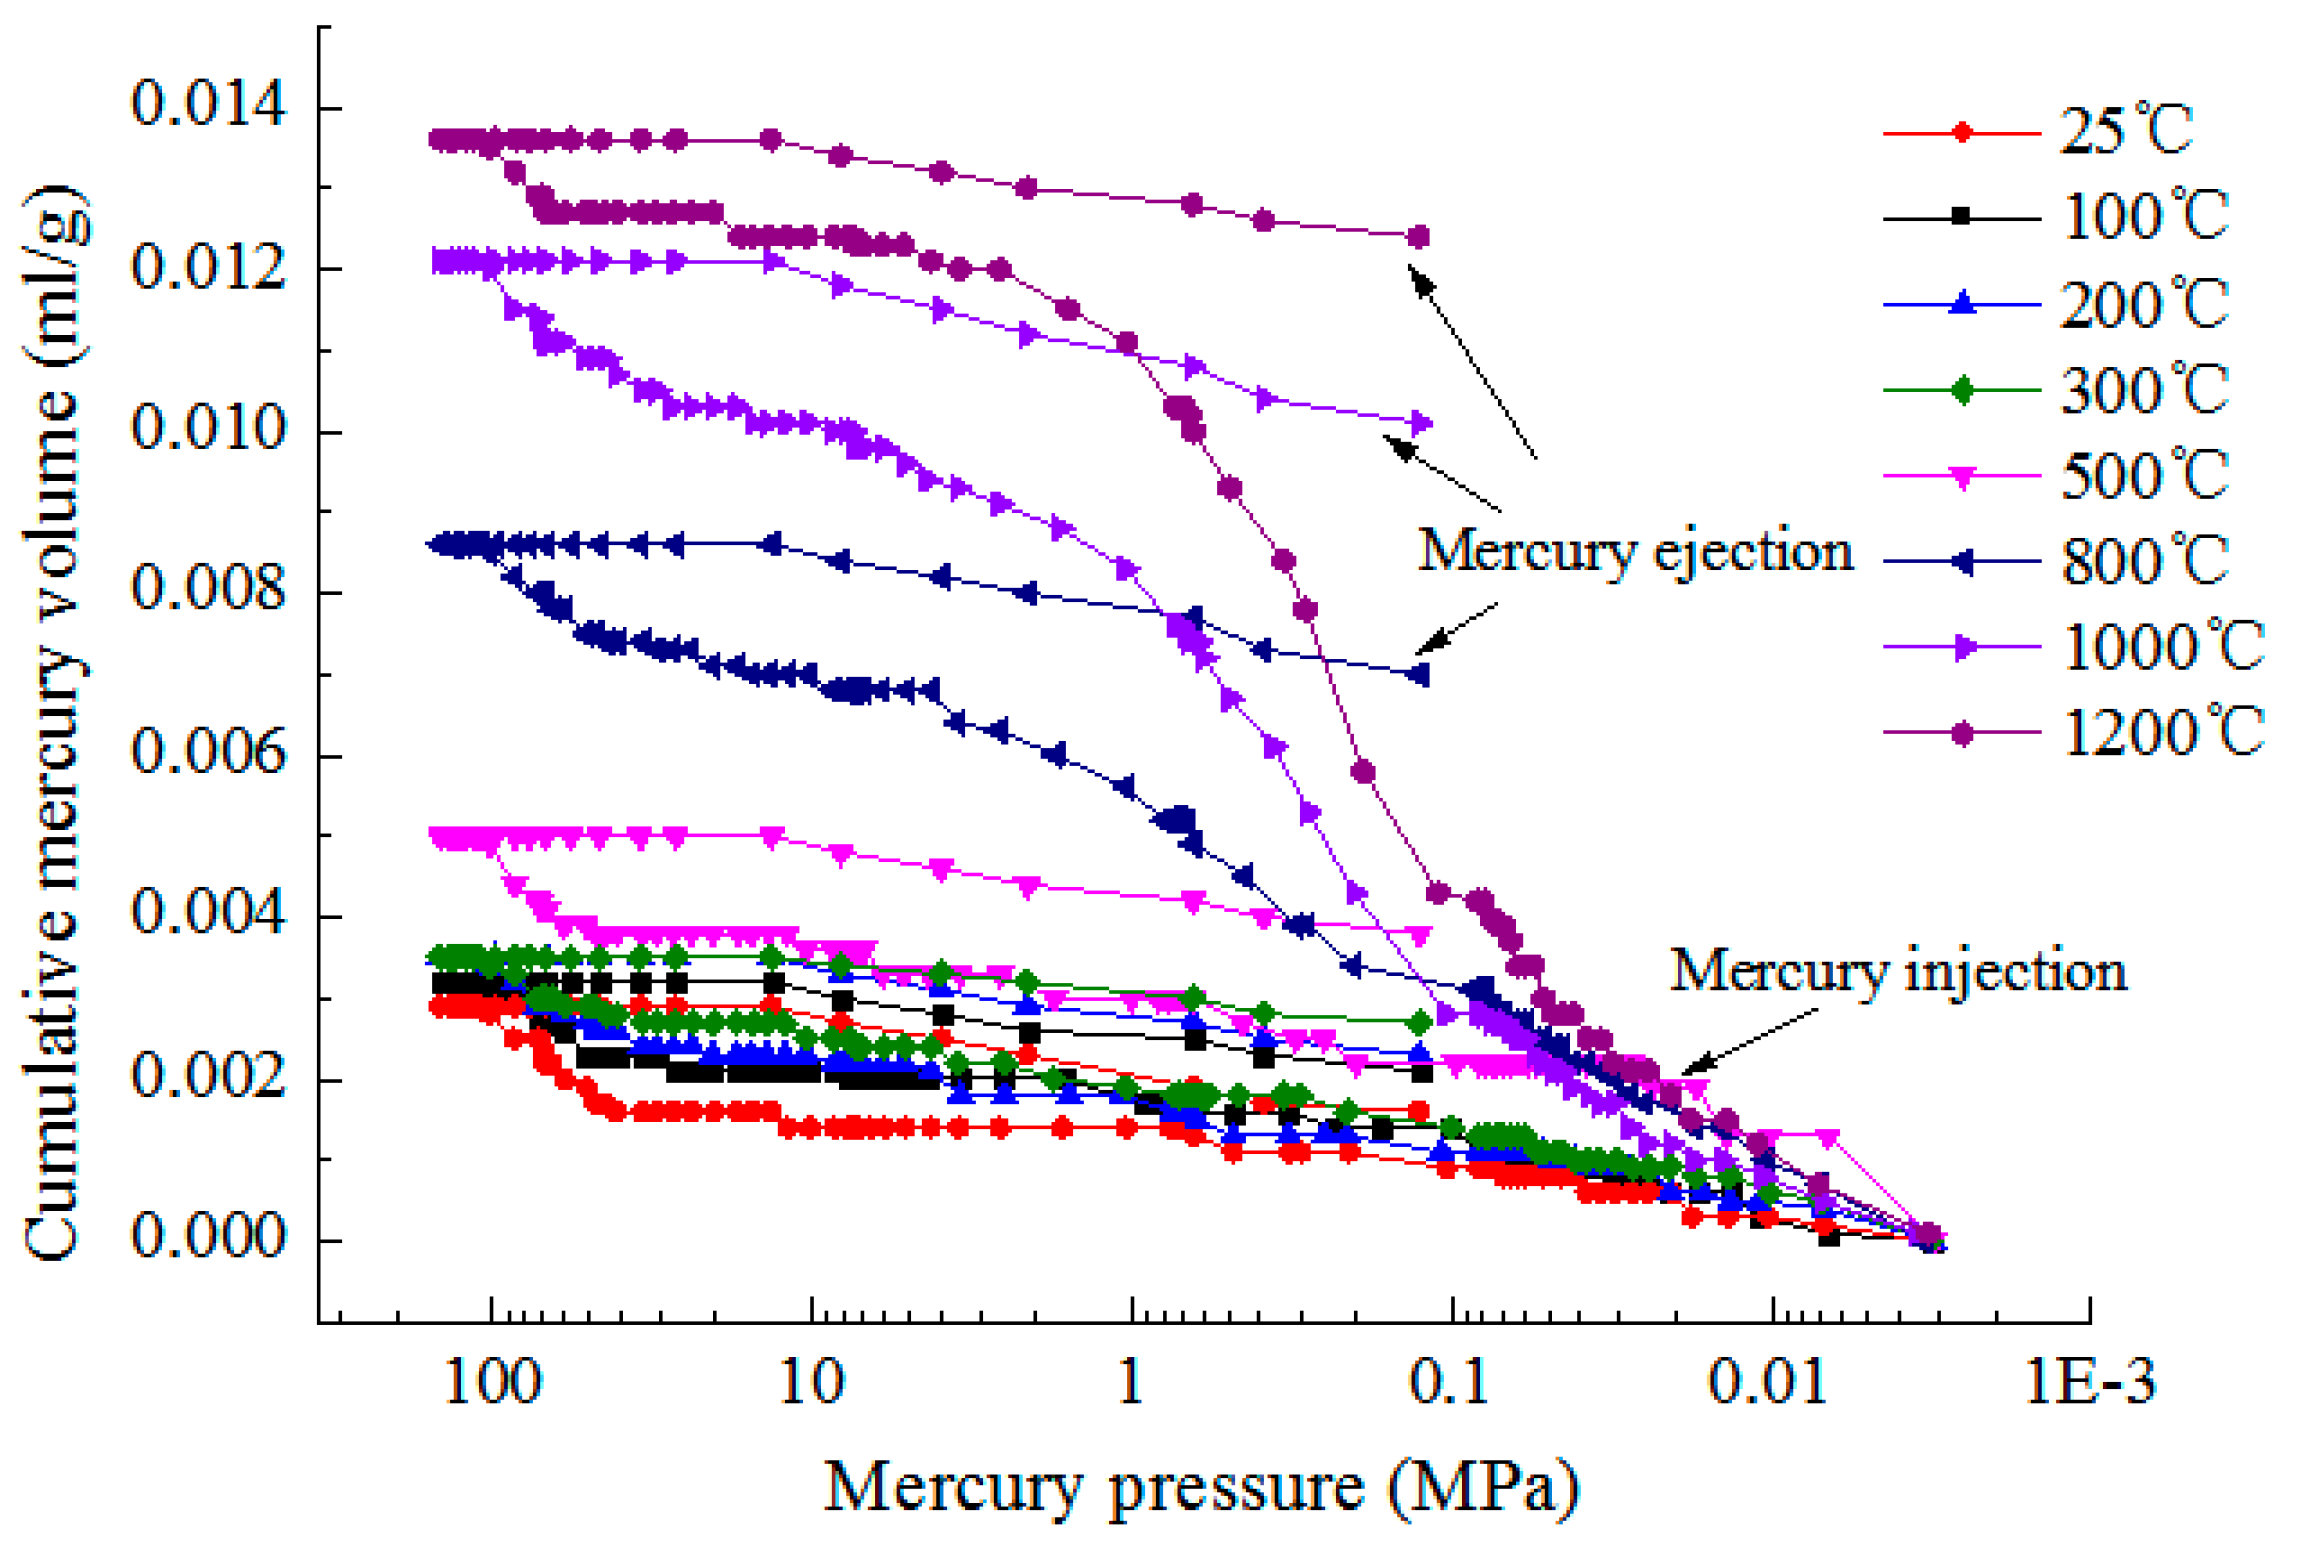
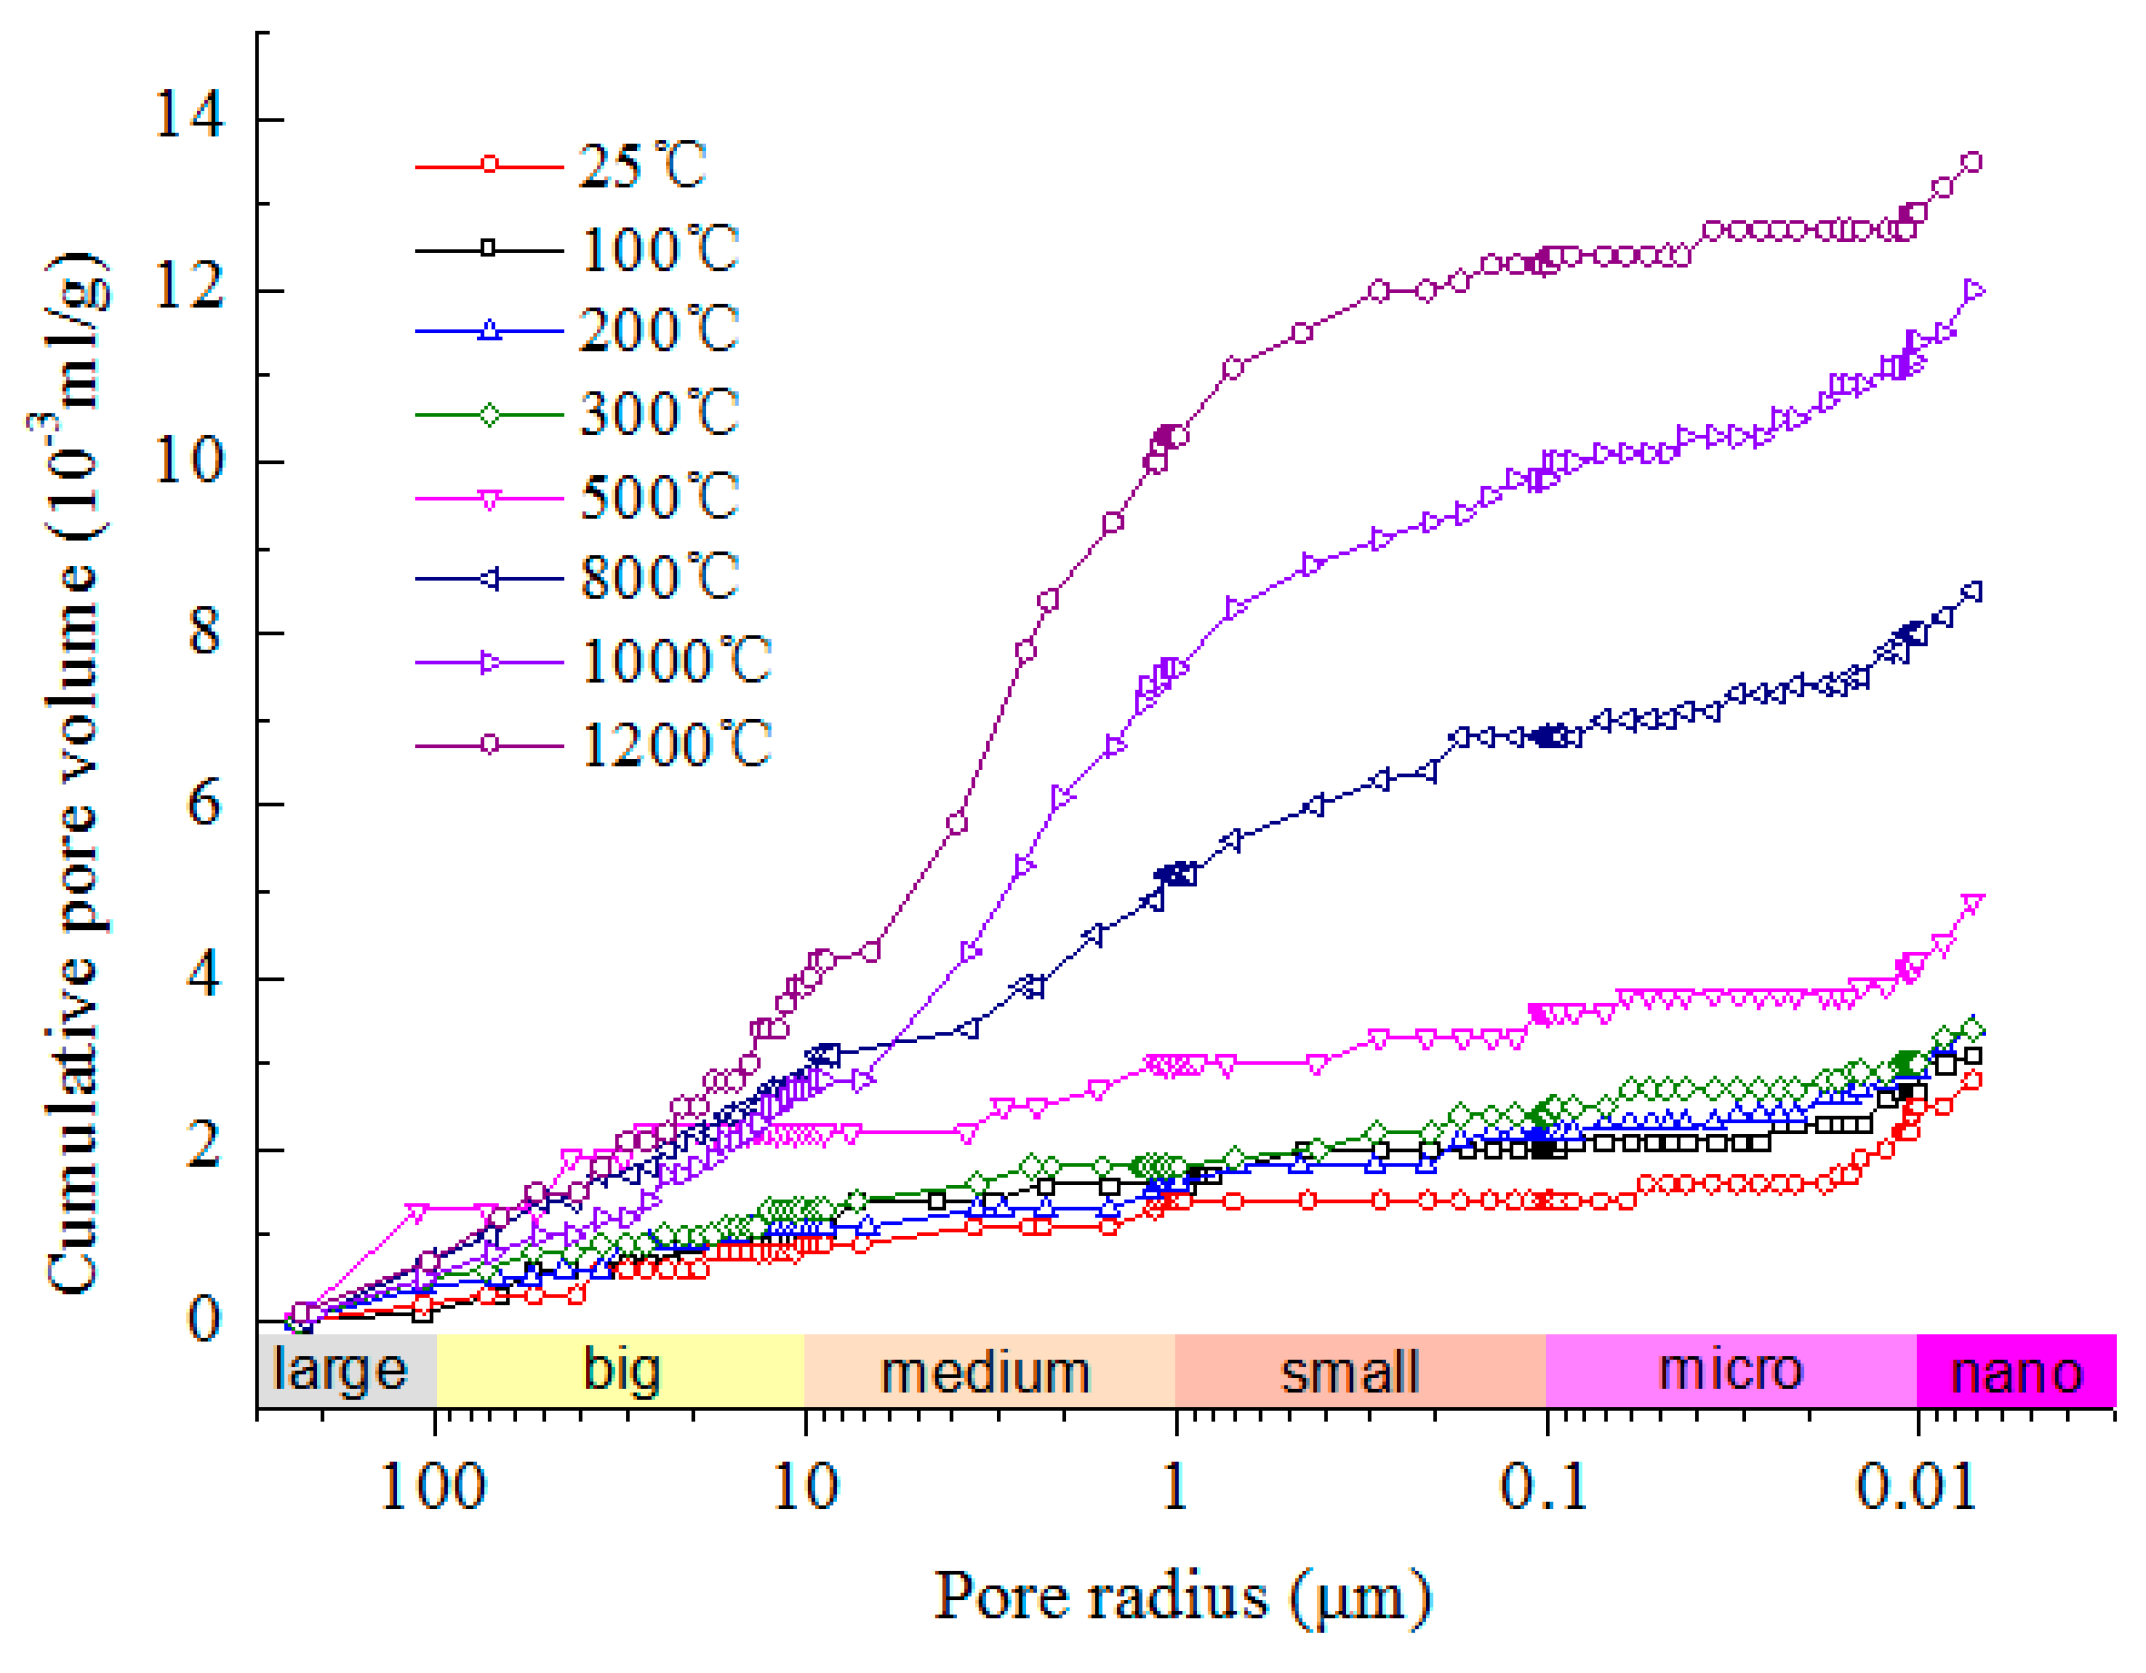
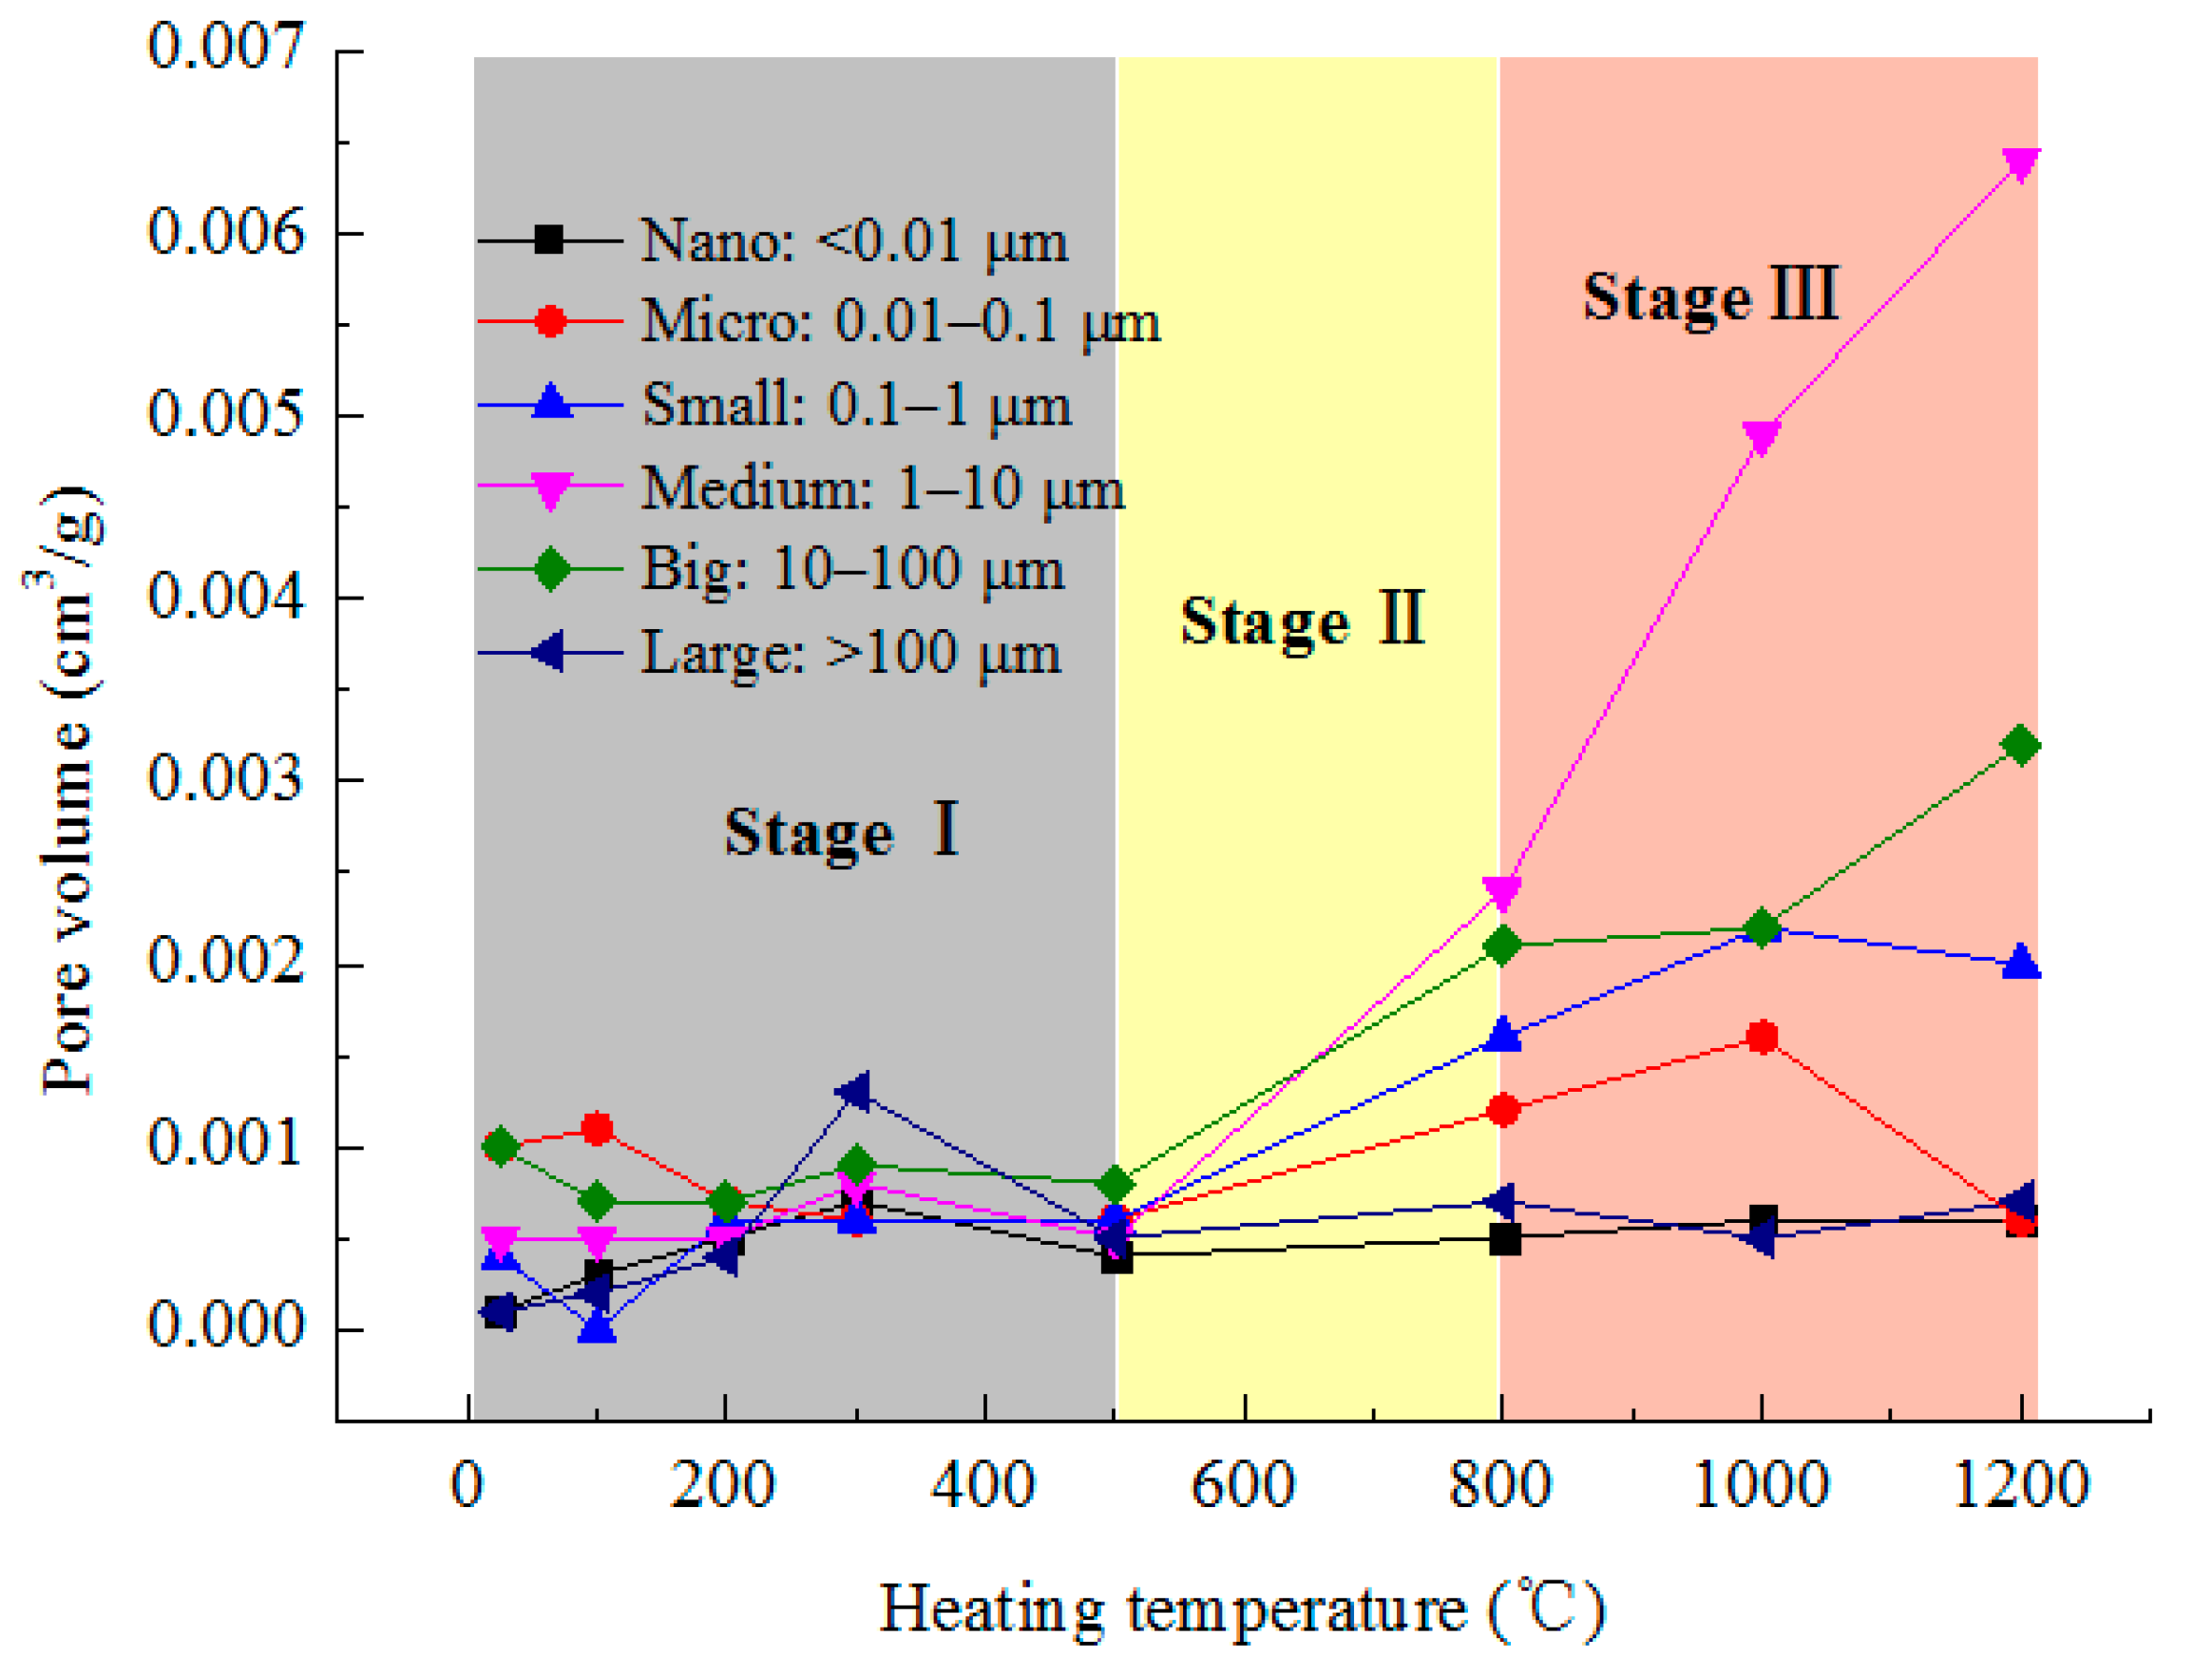
Pore structure. Considering the significance of pore size for gas and liquid adsorption and seepage, the pores are divided into six categories (nanopore, micropore, small pore, medium pore, big pore, large pore), and the effects of the heating temperature on them were obtained. Below 500 °C, the six pore volumes change little. In 500–1200 °C, the volume of medium and big pores increases greatly. The newly created pores caused by high-heat treatment are mainly medium ones. The rock porosity increases exponentially with heating temperature.
(3)
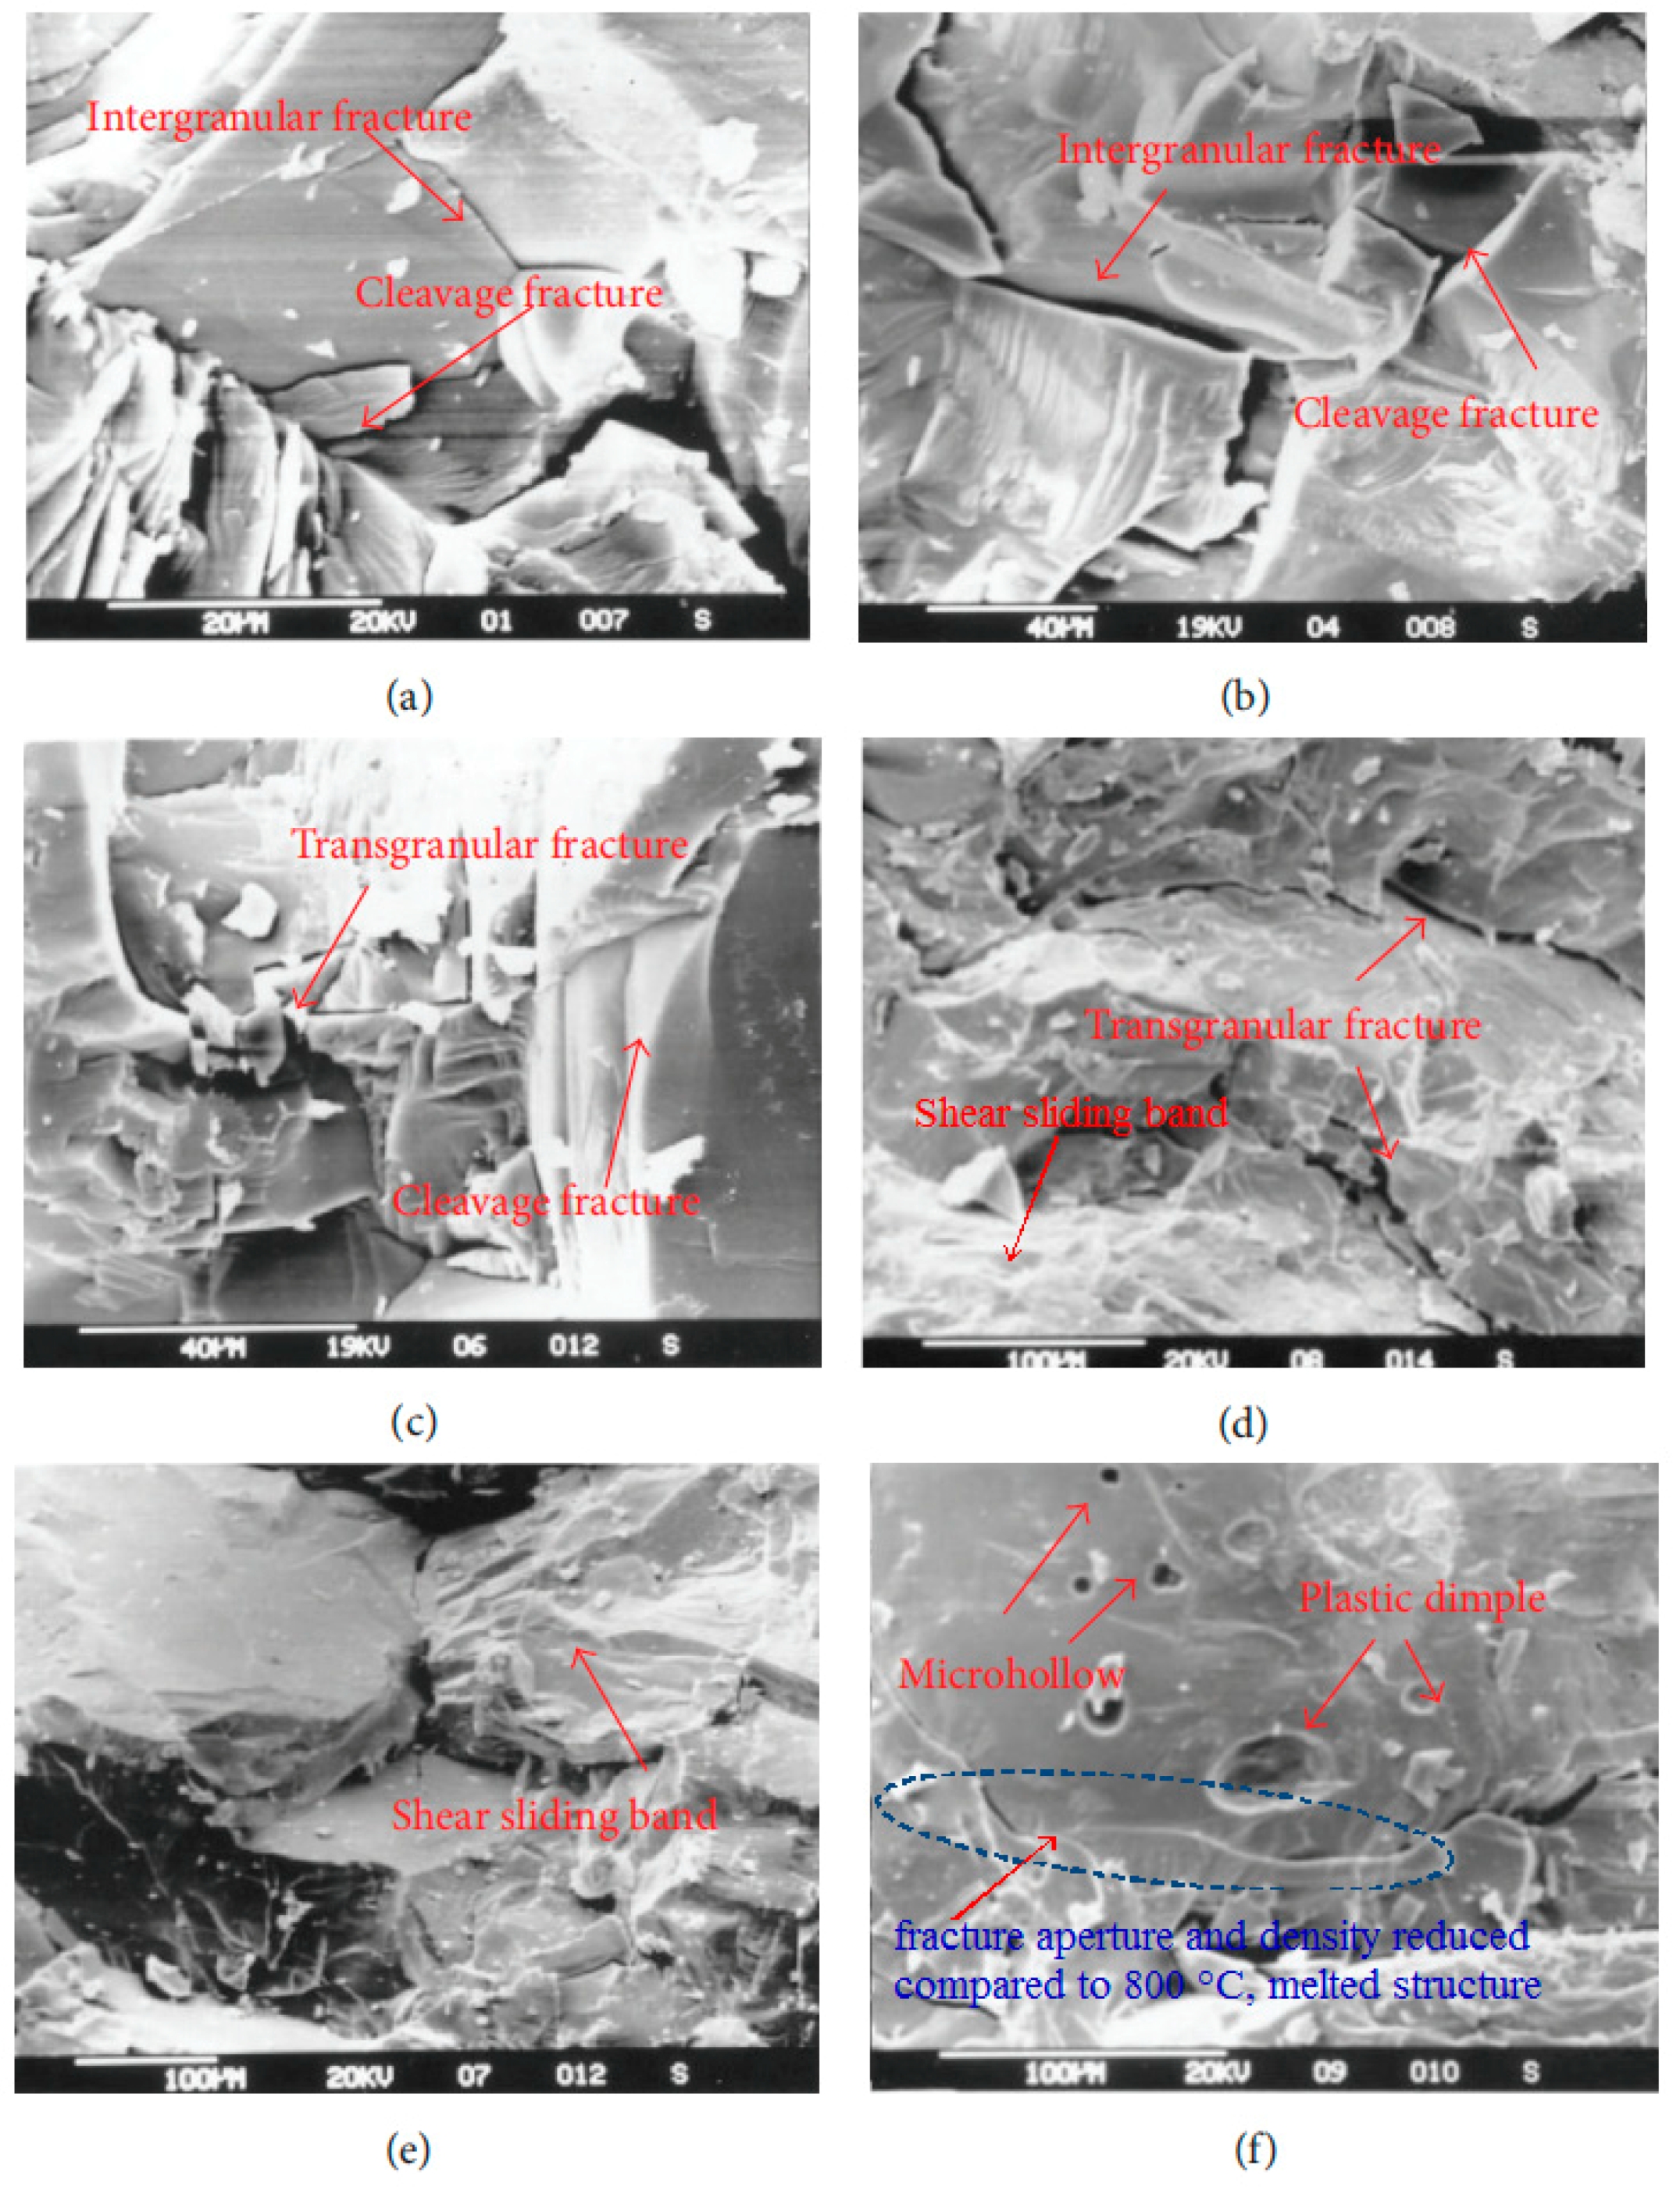
Mechanical characteristics. As the temperature increases, the P-wave velocity increases slightly at 100 °C, then decreases linearly, the UCS and elastic modulus both decrease consistently, and the peak strain and shear-slip strain increase. Below 500 °C, they all change slightly, but above 800 °C, the UCS and elastic modulus decrease dramatically and the increasing rate of shear-slip strain is obviously accelerated, indicating the deformation and failure mode of rock changes from brittle to plastic.
(4)
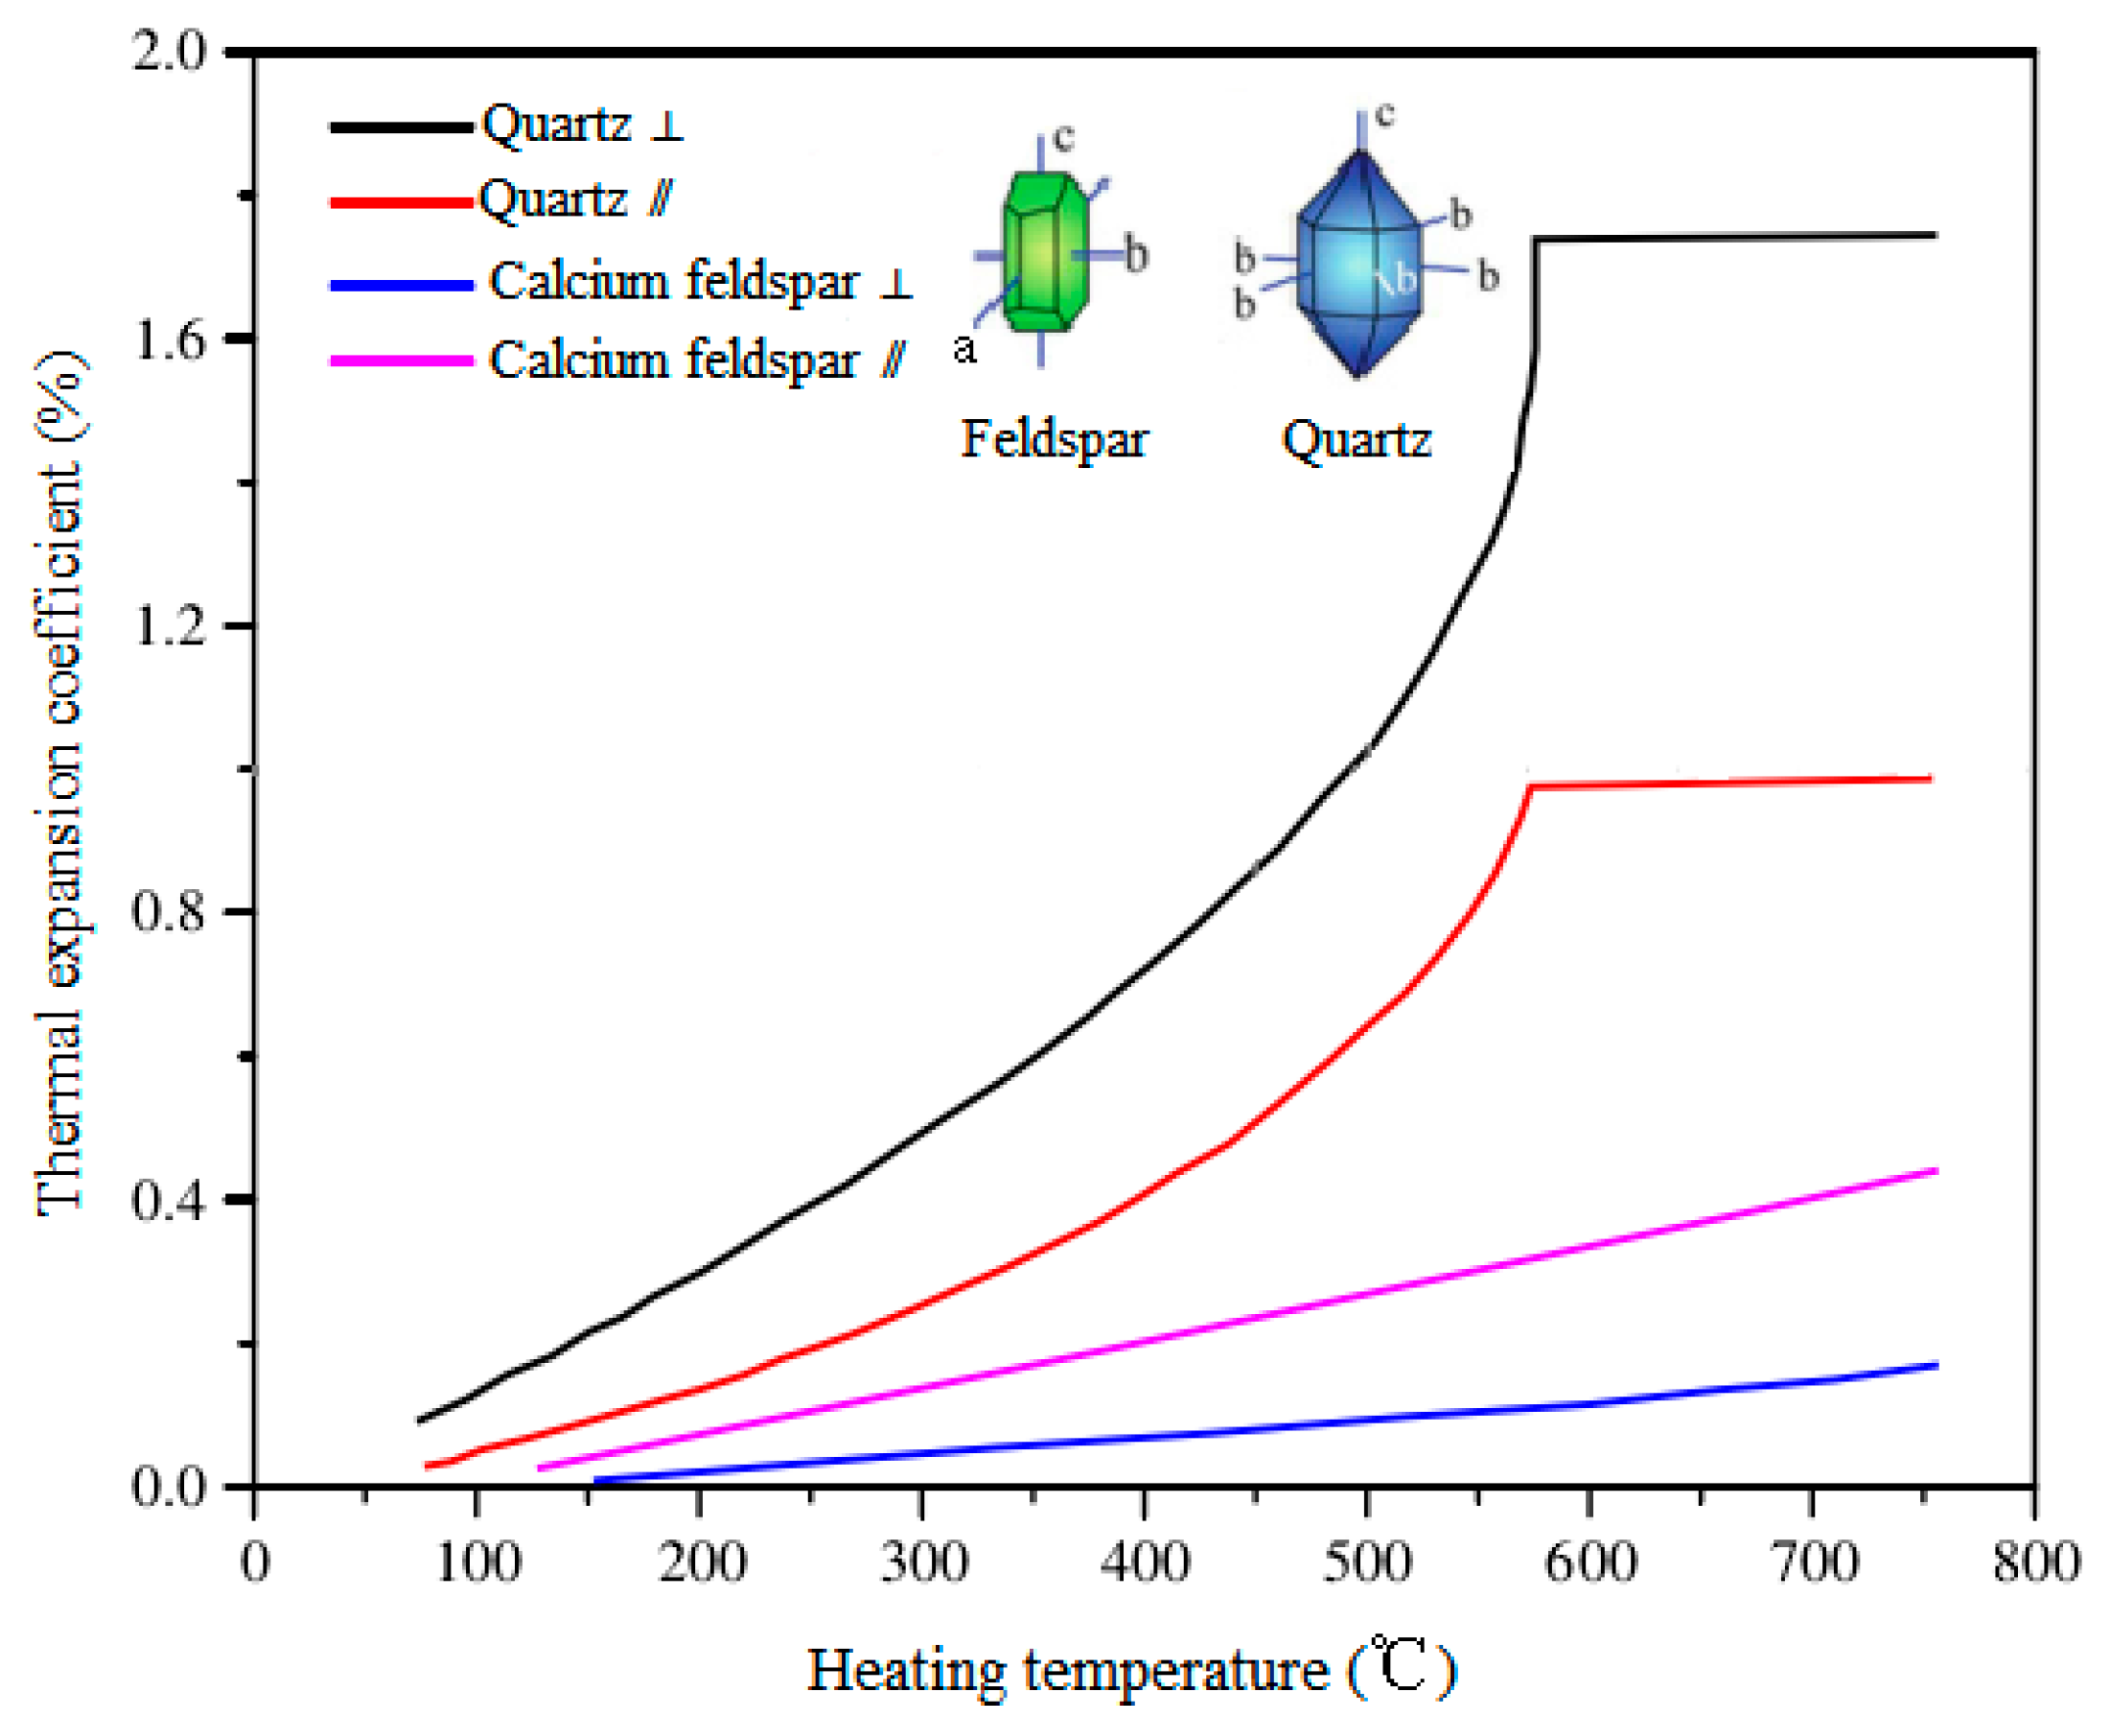
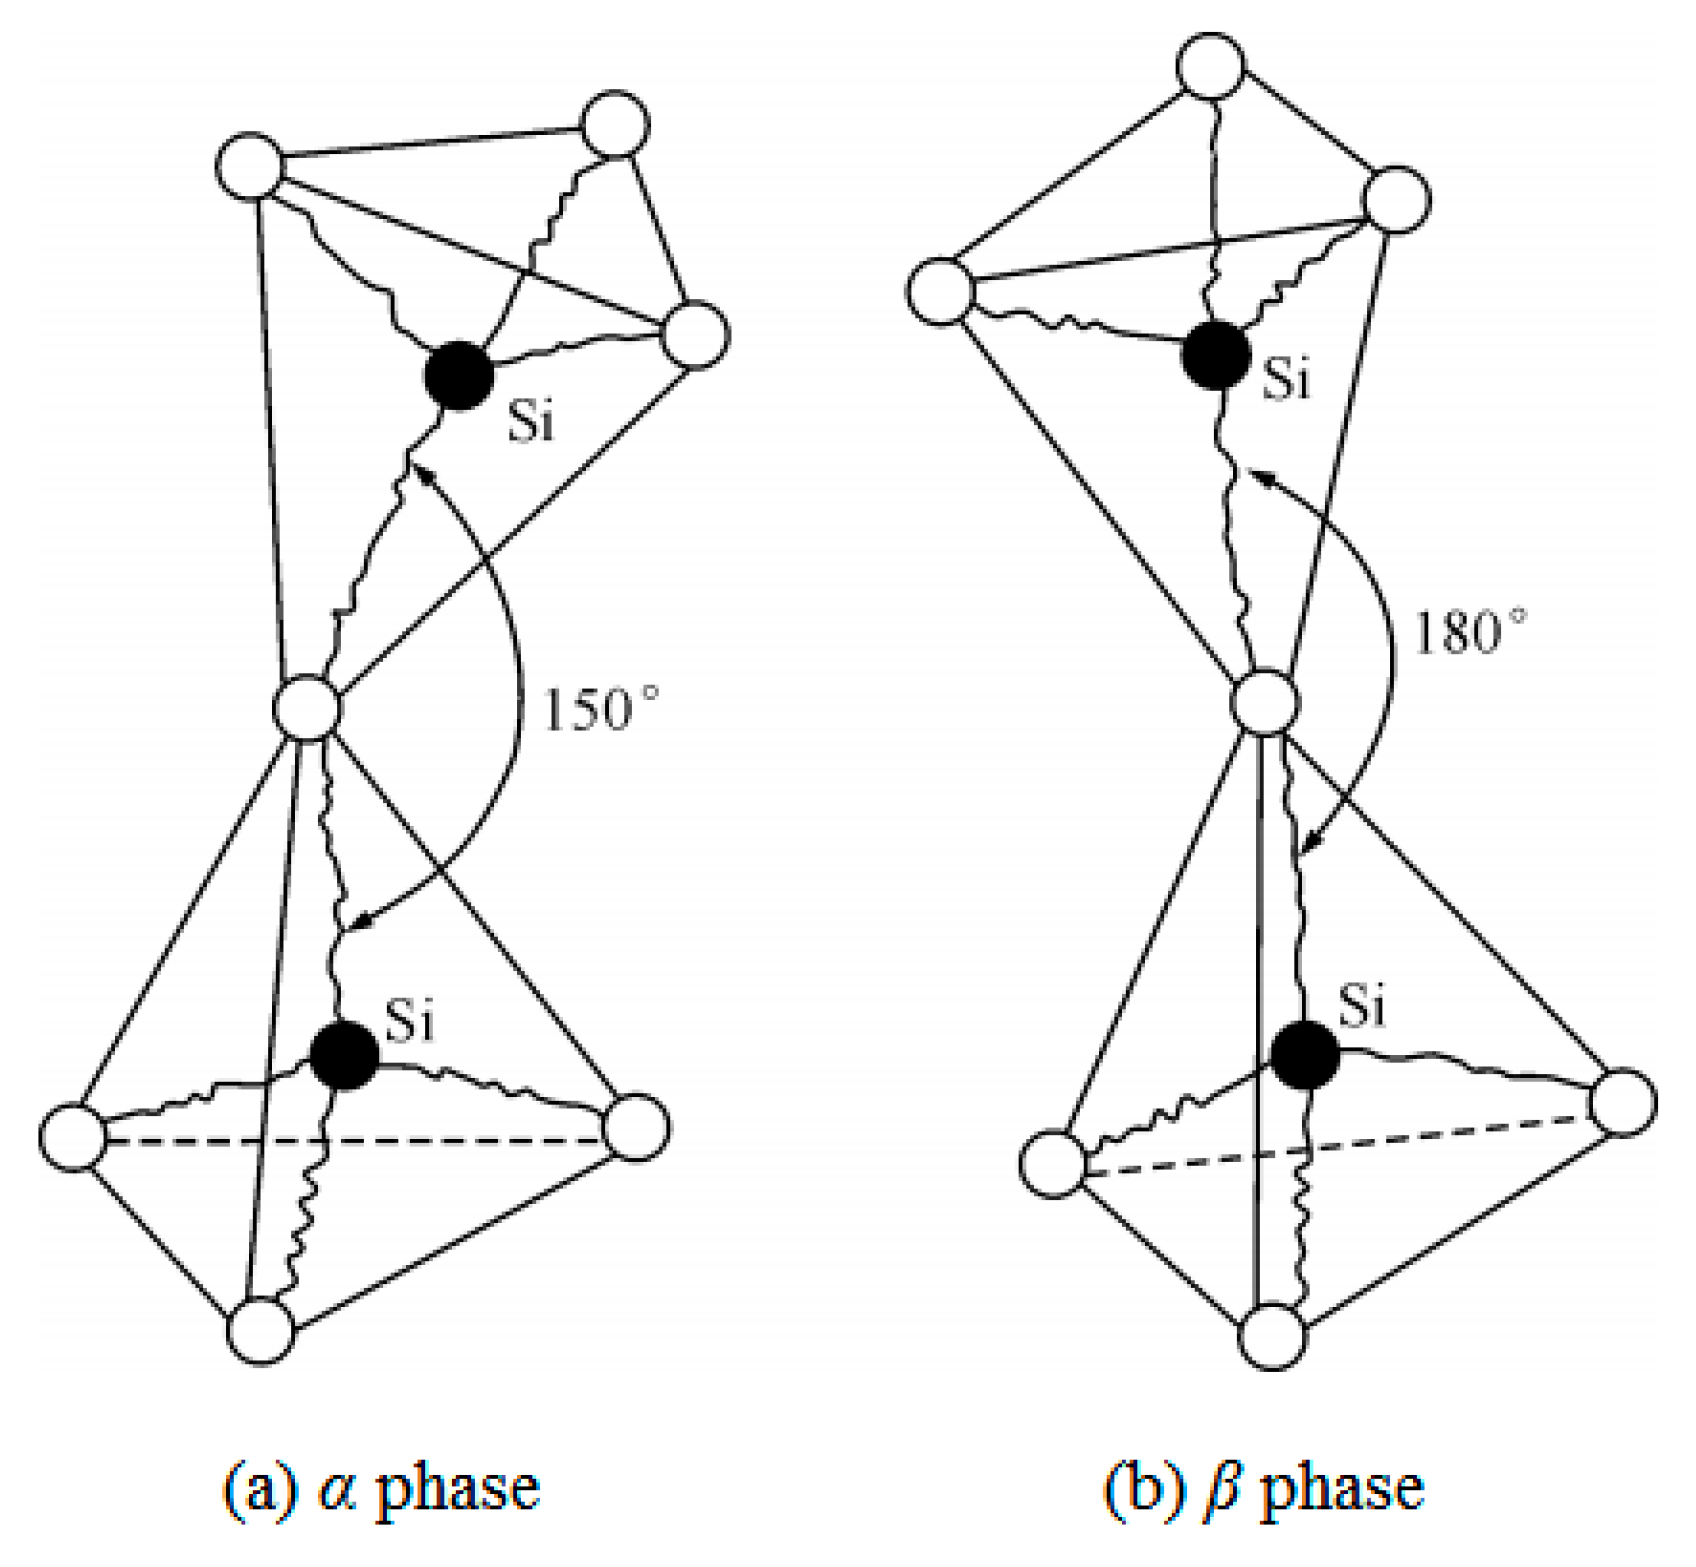
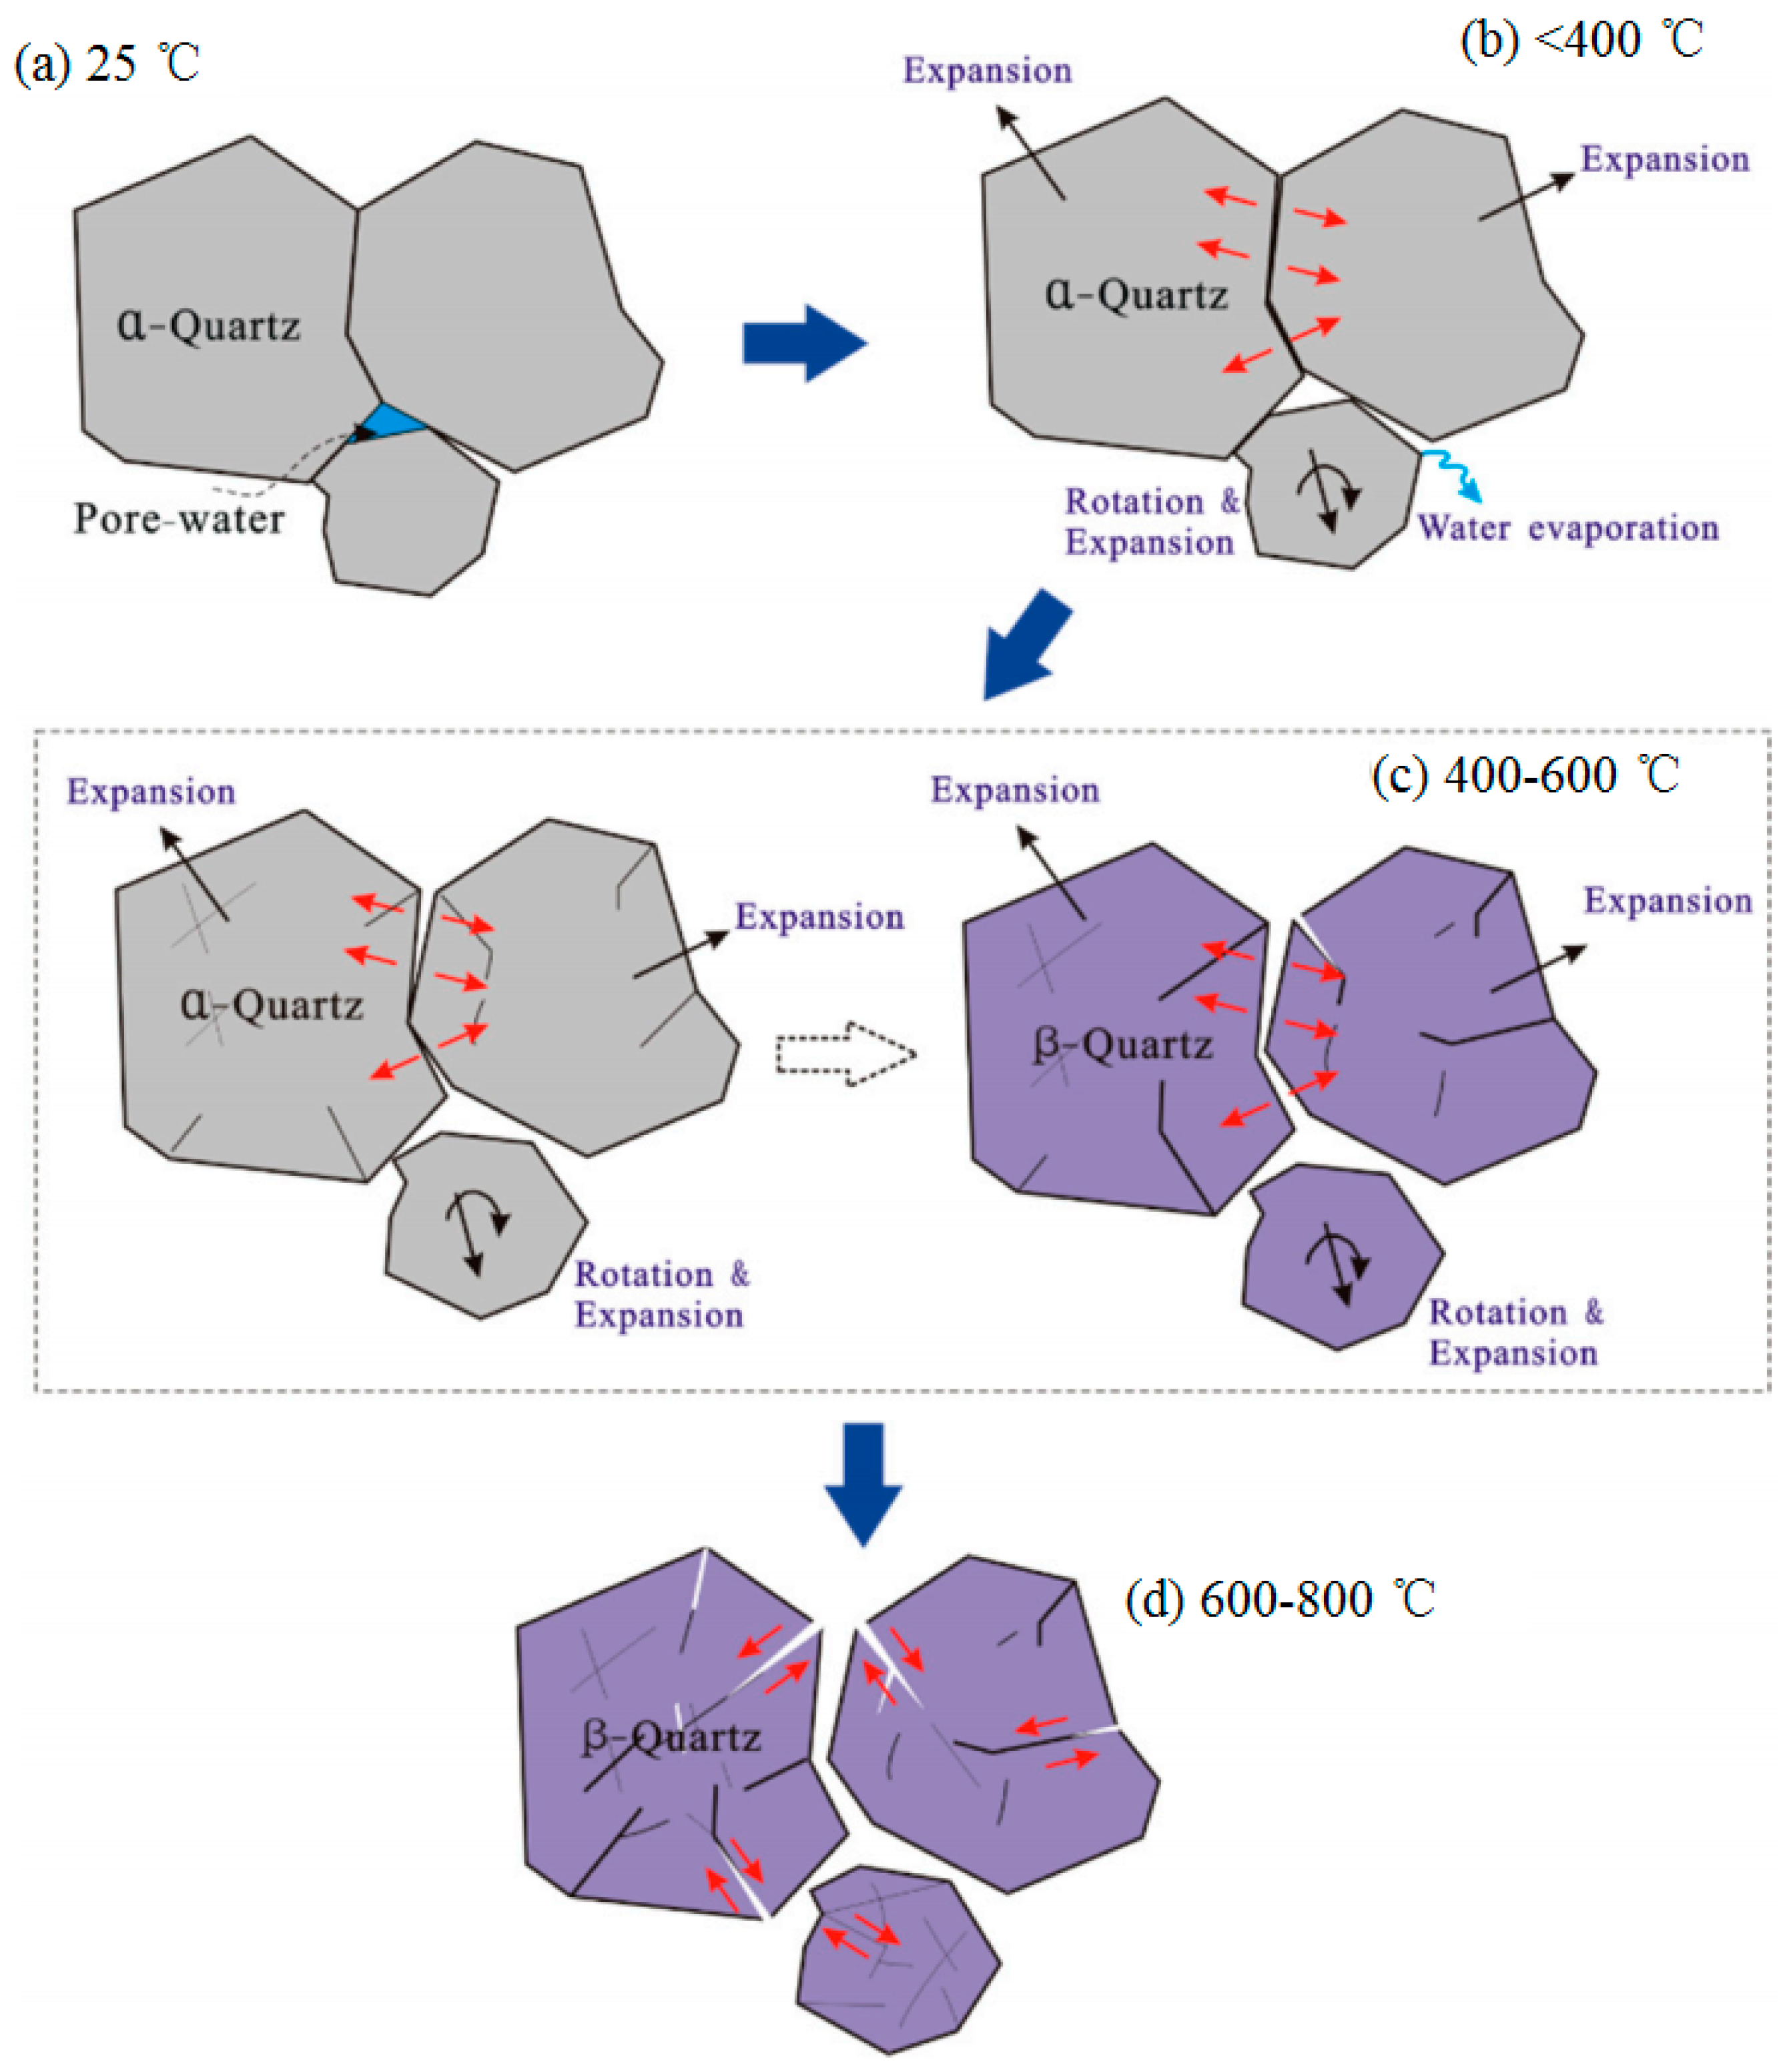
The high temperature heat treatment changes the mineralogical characteristics of granite, including dehydration, phase transformation, and anisotropic and uncoordinated thermal expansion of minerals. The variation of minerals further changes the pore structure and mechanical properties of the granite rock.
In this experiment, the granite samples were heated followed by natural cooling, however the fracturing and reduction of mechanical properties under constant high-temperature condition would be definitely different. Furthermore, heating rate, heating duration, and cooling method would also have great impact on the test results. Also, some other tests such as thermal expansion, specific heat capacity, thermal diffusivity, and heat conductivity would provide worthwhile insights, while the dissolution, phase transformation, and melting of minerals under these high temperature processes require quantitative analysis. These will be the subjects of further investigations.

Author Contributions

Z.Z. and X.S. conceived and designed the experiments; X.S. and X.X. performed the experiments; X.S., T.L., and Y.X. analyzed the data; Z.Z. contributed funding supports; X.S. and Z.Z. wrote the paper. Z.Z. revised the English of this paper.

Funding

The authors are supported by the Independent Innovation Project of “Double First Rate” of China University of Mining and Technology (Grant No. 2018ZZCX04).

Conflicts of Interest

The authors declare no conflict of interest.

References

  1. Lei, Z.H.; Zhang, Y.J.; Yu, Z.W.; Hu, Z.J.; Li, L.Z.; Zhang, S.Q.; Fu, L.; Zhou, L.; Xie, Y.Y. Exploratory research into the enhanced geothermal system power generation project: The Qiabuqia geothermal field, Northwest China. Renew. Energy 2019, 139, 52–70. [Google Scholar] [CrossRef]
  2. Hossain, M.E.; Mousavizadegan, S.H.; Islam, M.R. The effects of thermal alterations on formation permeability and porosity. Pet. Sci. Technol. 2008, 26, 1282–1302. [Google Scholar] [CrossRef]
  3. Cao, Z.D.; Lin, B.Q.; Liu, T. The impact of depositional environment and tectonic evolution on coalbed methane occurrence in West Henan, China. Int. J. Min. Sci. Technol. 2019, 29, 297–305. [Google Scholar] [CrossRef]
  4. Kamble, A.D.; Saxena, V.K.; Chavan, P.D.; Mendhe, V.A. Co-gasification of coal and biomass an emerging clean energy technology: Status and prospects of development in Indian context. Int. J. Min. Sci. Technol. 2019, 29, 171–186. [Google Scholar] [CrossRef]
  5. Prentice, D.P.; Walkley, B.; Bernal, S.A.; Bankhead, M.; Hayes, M.; Provis, J.L. Thermodynamic modelling of BFS-PC cements under temperature conditions relevant to the geological disposal of nuclear wastes. Cem. Concr. Res. 2019, 119, 21–35. [Google Scholar] [CrossRef]
  6. Chaki, S.; Takarli, M.; Agbodjan, W.P. Influence of thermal damage on physical properties of a granite rock: Porosity, permeability and ultrasonic wave evolutions. Constr. Build. Mater. 2008, 22, 1456–1461. [Google Scholar] [CrossRef]
  7. Shen, Y.J.; Zhang, Y.L.; Gao, F.; Yang, G.S.; Lai, X.P. Influence of temperature on the microstructure deterioration of sandstone. Energies 2018, 11, 1753. [Google Scholar] [CrossRef]
  8. Sirdesai, N.N.; Mahanta, B.; Ranjith, P.G.; Singh, T.N. Effects of thermal treatment on physico-morphological properties of Indian fine-grained sandstone. Bull. Eng. Geol. Environ. 2019, 78, 883–897. [Google Scholar] [CrossRef]
  9. Chen, Y.L.; Wang, S.R.; Ni, J.; Azzam, R.; Fernandez-Steeger, T.M. An experimental study of the mechanical properties of granite after high temperature exposure based on mineral characteristics. Eng. Geol. 2017, 220, 234–242. [Google Scholar] [CrossRef]
  10. Zhang, W.Q.; Sun, Q.; Zhang, Y.L.; Xue, L.; Kong, F.F. Porosity and wave velocity evolution of granite after high-temperature treatment: A review. Environ. Earth Sci. 2018, 77, 350. [Google Scholar] [CrossRef]
  11. Taheri-Shakib, J.; Keshavarz, V.; Kazemzadeh, E.; Hosseini, S.A.; Rajabi-Kochi, M.; Salimidelshad, Y.; Naderi, H.; Bakhtiari, H.A. Experimental and mathematical model evaluation of asphaltene fractionation based on adsorption in porous media: Part 1. Calcite reservoir rock. J. Pet. Sci. Eng. 2019, 177, 24–40. [Google Scholar] [CrossRef]
  12. Kammlein, M.; Stollhofen, H. Pore-fluid-dependent controls of matrix and bulk thermal conductivity of mineralogically heterogeneous sandstones. Geotherm. Energy 2019, 7, 13. [Google Scholar] [CrossRef]
  13. Shang, X.J.; Wang, J.G.; Zhang, Z.Z. Iterative analytical solutions for nonlinear two-phase flow with gas solubility in shale gas reservoirs. Geofluids 2019. [Google Scholar] [CrossRef]
  14. Zhang, Z.Z.; Peng, W.H.; Shang, X.J.; Wang, K.; Li, H.; Ma, W.M. Temperature field distribution of coal seam in heat injection. Therm. Sci. 2017, 21, S39–S45. [Google Scholar] [CrossRef]
  15. Yang, Y.L.; Zheng, K.Y.; Li, Z.W.; Li, Z.H.; Si, L.L.; Hou, S.S.; Duan, Y.J. Experimental study on pore-fracture evolution law in the thermal damage process of coal. Int. J. Rock Mech. Min. Sci. 2019, 116, 13–24. [Google Scholar] [CrossRef]
  16. Liu, P.; Cui, S.G.; Li, Z.H.; Xu, X.F.; Guo, C. Influence of surrounding rock temperature on mechanical property and pore structure of concrete for shotcrete use in a hot-dry environment of high-temperature geothermal tunnel. Constr. Build. Mater. 2019, 207, 329–337. [Google Scholar] [CrossRef]
  17. Zhang, W.Q.; Sun, Q.; Zhu, S.Y.; Wang, B. Experimental study on mechanical and porous characteristics of limestone affected by high temperature. Appl. Therm. Eng. 2017, 110, 356–362. [Google Scholar] [CrossRef]
  18. Sun, Q.; Zhang, W.Q.; Su, T.M.; Zhu, S.Y. Variation of wave velocity and porosity of sandstone after high temperature heating. Acta Geophys. 2016, 64, 633–648. [Google Scholar] [CrossRef]
  19. Zhang, Y.L.; Sun, Q.; He, H.; Cao, L.W.; Zhang, W.Q.; Wang, B. Pore characteristics and mechanical properties of sandstone under the influence of temperature. Appl. Therm. Eng. 2017, 113, 537–543. [Google Scholar] [CrossRef]
  20. Zhang, Y.L.; Sun, Q.; Cao, L.W.; Geng, J.S. Pore, mechanics and acoustic emission characteristics of limestone under the influence of temperature. Appl. Therm. Eng. 2017, 123, 1237–1244. [Google Scholar] [CrossRef]
  21. Meng, T.; Liu, R.C.; Meng, X.X.; Zhang, D.H.; Hu, Y.Q. Evolution of the permeability and pore structure of transversely isotropic calcareous sediments subjected to triaxial pressure and high temperature. Eng. Geol. 2019, 253, 27–35. [Google Scholar] [CrossRef]
  22. Glatz, G.; Castanier, L.M.; Kovscek, A.R. Visualization and quantification of thermally induced porosity alteration of immature source rock using X-ray computed tomography. Energy Fuels 2016, 30, 8141–8149. [Google Scholar] [CrossRef]
  23. Li, Y.; Wang, Z.S.; Pan, Z.J.; Niu, X.L.; Yu, Y.; Meng, S.Z. Pore structure and its fractal dimensions of transitional shale: A cross-section from east margin of the Ordos Basin, China. Fuel 2019, 241, 417–431. [Google Scholar] [CrossRef]
  24. Hazra, B.; Wood, D.A.; Kumar, S.; Saha, S.; Dutta, S.; Kumari, P.; Singh, A.K. Fractal disposition, porosity characterization and relationships to thermal maturity for the Lower Permian Raniganj basin shales, India. J. Nat. Gas Sci. Eng. 2018, 59, 452–465. [Google Scholar] [CrossRef]
  25. Xu, J.Z.; Zhai, C.; Liu, S.M.; Qin, L.; Dong, R.W. Investigation of temperature effects from LCO2 with different cycle parameters on the coal pore variation based on infrared thermal imagery and low-field nuclear magnetic resonance. Fuel 2018, 215, 528–540. [Google Scholar] [CrossRef]
  26. Schmitt, M.; Poffo, C.M.; de Lima, J.C.; Fernandes, C.P.; dos Santos, V.S.S. Application of photoacoustic spectroscopy to characterize thermal diffusivity and porosity of caprocks. Eng. Geol. 2017, 220, 183–195. [Google Scholar] [CrossRef]
  27. Ugur, I.; Sengun, N.; Demirdag, S.; Altindag, R. Analysis of the alterations in porosity features of some natural stones due to thermal effect. Ultrasonics 2014, 54, 1332–1336. [Google Scholar] [CrossRef] [PubMed]
  28. Haffen, S.; Geraud, Y.; Rosener, M.; Diraison, M. Thermal conductivity and porosity maps for different materials: A combined case study of granite and sandstone. Geothermics 2017, 66, 143–150. [Google Scholar] [CrossRef]
  29. Zhang, Z.Z.; Gao, F.; Gao, Y.N.; Xu, X.L.; Hou, P.; Teng, T.; Shang, X.J. Fractal structure and model of pore size distribution of granite under high temperatures. Chin. J. Rock Mech. Eng. 2016, 35, 2426–2438. [Google Scholar]
  30. Peng, J.; Yang, S.Q. Comparison of mechanical behavior and acoustic emission characteristics of three thermally-damaged rocks. Energies 2018, 11, 2350. [Google Scholar] [CrossRef]
  31. Rong, G.; Peng, J.; Yao, M.D.; Jiang, Q.H.; Wong, L.N.Y. Effects of specimen size and thermal-damage on physical and mechanical behavior of a fine-grained marble. Eng. Geol. 2018, 232, 46–55. [Google Scholar] [CrossRef]
  32. Gautam, P.K.; Verma, A.K.; Jha, M.K.; Sharma, P.; Singh, T.N. Effect of high temperature on physical and mechanical properties of Jalore granite. J. Appl. Geophys. 2018, 159, 460–474. [Google Scholar] [CrossRef]
  33. Kumari, W.G.P.; Beaumont, D.M.; Ranjith, P.G.; Perera, M.S.A.; Isaka, B.L.A.; Khandelwal, M. An experimental study on tensile characteristics of granite rocks exposed to different high-temperature treatments. Geomech. Geophys. Geo-Energy Geo-Resour. 2019, 5, 47–64. [Google Scholar] [CrossRef]
  34. Zuo, J.P.; Li, Y.L.; Zhang, X.Y.; Zhao, Z.H.; Wang, T.Z. The effects of thermal treatments on the subcritical crack growth of Pingdingshan sandstone at elevated high temperatures. Rock Mech. Rock Eng. 2018, 51, 3439–3454. [Google Scholar] [CrossRef]
  35. Wang, Z.L.; Shi, H.; Wang, J.G. Mechanical behavior and damage constitutive model of granite under coupling of temperature and dynamic loading. Rock Mech. Rock Eng. 2018, 51, 3045–3059. [Google Scholar] [CrossRef]
  36. Zhang, Z.Z.; Gao, F.; Xu, X.L. Experimental study of temperature effect of mechanical properties of granite. Rock Soil Mech. 2011, 32, 2346–2352. [Google Scholar]
  37. Zhang, Z.Z.; Gao, F.; Gao, Y.N.; Xu, X.L. Experimental study of brittle stress drop coefficient of granite endured high temperature. J. Exp. Mech. 2010, 25, 589–597. [Google Scholar]
  38. Zhang, W.Q.; Sun, Q.; Zhu, Y.M.; Guo, W.H. Experimental study on response characteristics of micro-macroscopic performance of red sandstone after high-temperature treatment. J. Therm. Anal. Calorim. 2019, 136, 1935–1945. [Google Scholar] [CrossRef]
  39. Sun, H.; Sun, Q.; Deng, W.N.; Zhang, W.Q.; Lu, C. Temperature effect on microstructure and P-wave propagation in Linyi sandstone. Appl. Therm. Eng. 2017, 115, 913–922. [Google Scholar] [CrossRef]
  40. Zhang, Z.Z.; Xu, X.L.; Sun, Q.P.; Dong, Y. Effect of thermal treatment on fractals in acoustic emission of rock material. Adv. Mater. Sci. Eng. 2016, 2016, 6309856. [Google Scholar] [CrossRef]
  41. Xu, X.L.; Zhang, Z.Z. Acoustic emission and damage characteristics of granite subjected to high temperature. Adv. Mater. Sci. Eng. 2018, 2018, 8149870. [Google Scholar] [CrossRef]
  42. Wang, Z.L.; He, A.L.; Shi, G.Y.; Mei, G.X. Temperature effect on AE energy characteristics and damage mechanical behaviors of granite. Int. J. Geomech. 2018, 18, 04017163. [Google Scholar] [CrossRef]
  43. Yang, S.Q.; Ranjith, P.G.; Jing, H.W.; Tian, W.L.; Ju, Y. An experimental investigation on thermal damage and failure mechanical behavior of granite after exposure to different high temperature treatments. Geothermics 2017, 65, 180–197. [Google Scholar] [CrossRef]
  44. Gautam, P.K.; Jha, M.K.; Verma, A.K.; Singh, T.N. Evolution of absorption energy per unit thickness of damaged sandstone. J. Therm. Anal. Calorim. 2019, 136, 2305–2318. [Google Scholar] [CrossRef]
  45. Zhang, R.R.; Jing, L.W.; Ma, Q.Y. Experimental study on thermal damage and energy evolution of sandstone after high temperature treatment. Shock Vib. 2018, 2018, 3845353. [Google Scholar] [CrossRef]
  46. Zhang, Z.Z.; Gao, F.; Liu, Z.J. Research on rockburst proneness and its microcosmic mechanism of granite considering temperature effect. Chin. J. Rock Mech. Eng. 2010, 29, 1591–1602. [Google Scholar]
  47. Ersoy, H.; Kolayli, H.; Karahan, M.; Karahan, H.H.; Sunnetci, M.O. Effect of thermal damage on mineralogical and strength properties of basic volcanic rocks exposed to high temperatures. Bull. Eng. Geol. Environ. 2019, 78, 1515–1525. [Google Scholar] [CrossRef]
  48. Laita, E.; Bauluz, B.; Yuste, A. High-temperature mineral phases generated in natural clinkers by spontaneous combustion of coal. Minerals 2019, 9, 213. [Google Scholar] [CrossRef]
  49. Liu, X.F.; Yuan, S.Y.; Sieffert, Y.; Fityus, S.; Buzzi, O. Changes in mineralogy, microstructure, compressive strength and intrinsic permeability of two sedimentary rocks subjected to high-temperature heating. Rock Mech. Rock Eng. 2016, 49, 2985–2998. [Google Scholar] [CrossRef]
  50. Yang, S.Q.; Xu, P.; Li, Y.B.; Huang, Y.H. Experimental investigation on triaxial mechanical and permeability behavior of sandstone after exposure to different high temperature treatments. Geothermics 2017, 69, 93–109. [Google Scholar] [CrossRef]
  51. Nowak, J. The influence of thermal transformation of coal mining wastes on their petrographic and mineralogical composition. Gospod. Surowcami Miner. Miner. Resour. Manag. 2014, 30, 143–159. [Google Scholar] [CrossRef] [Green Version]
  52. Mahanta, B.; Singh, T.N.; Ranjith, P.G. Influence of thermal treatment on mode I fracture toughness of certain Indian rocks. Eng. Geol. 2016, 210, 103–114. [Google Scholar] [CrossRef]
  53. Seipold, U.; Schilling, F.R. Heat transport in serpentinites. Tectonophysics 2003, 370, 147–162. [Google Scholar] [CrossRef]
  54. Maeshima, T.; Noma, H.; Sakiyama, M.; Mitsuda, T. Natural 1.1 and 1.4 nm tobermorites from Fuka, Okayama, Japan: Chemical analysis, cell dimensions, Si-29 NMR and thermal behavior. Cem. Concr. Res. 2003, 33, 1515–1523. [Google Scholar] [CrossRef]
  55. Plevova, E.; Kozusnikova, A.; Vaculikova, L.; Martynkova, G.S. Thermal behavior of selected Czech marble samples. J. Therm. Anal. Calorim. 2010, 101, 657–664. [Google Scholar] [CrossRef]
  56. Teixeira, A.M.D.; Garrido, F.; Medeiros, M.E.; Sampaio, J.A. Effect of thermal treatments on the potassium and sodium availability in phonolite rock powder. Int. J. Miner. Process. 2015, 145, 57–65. [Google Scholar] [CrossRef]
  57. Saidi, R.; Tlili, A.; Jamoussi, F. The effect of heating on mineral composition and grain size distribution of flux calcined porcelanites from the Gafsa-Metlaoui basin, southwestern Tunisia. J. Afr. Earth Sci. 2016, 124, 189–198. [Google Scholar] [CrossRef]
  58. Zhang, Y.L.; Sun, Q.; Geng, J.S. Microstructural characterization of limestone exposed to heat with XRD, SEM and TG-DSC. Mater. Charact. 2017, 134, 285–295. [Google Scholar] [CrossRef]
  59. Liu, L.; Chu, G.; Li, Y.G.; Yang, X.Y.; Santosh, M.; Hu, Q. Mesozoic high- and low-SiO2 adakites and a-type granites in the lower Yangtze River belt, eastern China: Implications for petrogenesis and metallogeny. Minerals 2018, 8, 328. [Google Scholar] [CrossRef]
  60. Shu, B.; Zhu, R.J.; Tan, J.Q.; Zhang, S.H.; Liang, M. Evolution of permeability in a single granite fracture at high temperature. Fuel 2019, 242, 12–22. [Google Scholar] [CrossRef]
  61. Wang, G.X.; Wang, Z.T.; Feng, B.; Rudolph, V.; Jiao, J.L. Semi-industrial tests on enhanced underground coal gasification at Zhong-Liang-Shan coal mine. Asia-Pac. J. Chem. Eng. 2009, 4, 771–779. [Google Scholar] [CrossRef]
  62. Xin, L.; Wang, Z.T.; Huang, W.G.; Kang, G.J.; Lu, X.F.; Zhang, P.; Wang, J.H. Temperature field distribution of burnt surrounding rock in UCG stope. Int. J. Min. Sci. Technol. 2014, 24, 573–580. [Google Scholar] [CrossRef]
  63. Shao, S.S.; Ranjith, P.G.; Wasantha, P.L.P.; Chen, B.K. Experimental and numerical studies on the mechanical behaviour of Australian Strathbogie granite at high temperatures: An application to geothermal energy. Geothermics 2015, 54, 96–108. [Google Scholar] [CrossRef]
  64. Ding, Q.L.; Ju, F.; Mao, X.B.; Ma, D.; Yu, B.Y.; Song, S.B. Experimental investigation of the mechanical behavior in unloading conditions of sandstone after high-temperature treatment. Rock Mech. Rock Eng. 2016, 49, 2641–2653. [Google Scholar] [CrossRef]
  65. Sang, L.K.; Ma, C.Q. Petrology, 2nd ed.; Geological Publishing House: Beijing, China, 2012. [Google Scholar]
  66. RaigonPichardo, M.; GarciaRamos, G.; SanchezSoto, P.J. Characterization of a waste washing solid product of mining granitic tin-bearing sands and its application as ceramic raw material. Resour. Conserv. Recycl. 1996, 17, 109–124. [Google Scholar] [CrossRef]
  67. Oikonomopoulos, I.K.; Perraki, M.; Tougiannidis, N.; Perraki, T.; Kasper, H.U.; Gurk, M. Clays from Neogene Achlada lignite deposits in Florina basin (Western Macedonia, N. Greece): A prospective resource for the ceramics industry. Appl. Clay Sci. 2015, 103, 1–9. [Google Scholar] [CrossRef]
  68. Yokoyama, T.; Takeuchi, S. Porosimetry of vesicular volcanic products by a water-expulsion method and the relationship of pore characteristics to permeability. J. Geophys. Res. Solid Earth 2009. [Google Scholar] [CrossRef]
  69. Guo, X.B.; Huang, Z.L.; Zhao, L.B.; Han, W.; Ding, C.; Sun, X.W.; Yan, R.T.; Zhang, T.H.; Yang, X.J.; Wang, R.M. Pore structure and multi-fractal analysis of tight sandstone using MIP, NMR and NMRC methods: A case study from the Kuqa depression, China. J. Pet. Sci. Eng. 2019, 178, 544–558. [Google Scholar] [CrossRef]
  70. Chen, X.J.; Liu, J.; Wang, L.; Qi, L.L. Influence of pore size distribution of different metamorphic grade of coal on adsorption constant. J. China Coal Soc. 2013, 38, 294–300. [Google Scholar]
  71. Wu, E.J.; Han, B.P.; Wang, G.L.; Peng, Z.C.; Liu, G.J. Pore structure test of Jurassic red-bed in yanzhou mining area, shandong province, and its affecting factors. Geol. J. China Univ. 2005, 11, 442–452. [Google Scholar]
  72. Brady, B.H.G.; Brown, E.T. Rock Mechanics for Underground Mining; Springer: Berlin, Germany, 2006. [Google Scholar]
  73. Zhang, Z.Z.; Gao, F. Energy Evolution Mechanism During Rock Deformation and Failure; China University of Mining and Technology Press: Xuzhou, China, 2014. [Google Scholar]
  74. Han, L.J.; He, Y.N.; Zhang, H.Q. Study on complete stress-strain experiment and destruction characteristics of rock under lower confining pressure. In Progresses in Fracture and Strength of Materials and Structures; Zhou, Y., Tu, S.T., Xie, X., Eds.; Trans Tech Publications Ltd.: Zurich, Switzerland, 2007; Volume 353, pp. 70–73. [Google Scholar]
  75. Yang, D.F.; Zhang, D.Y.; Niu, S.J.; Dang, Y.H.; Feng, W.L.; Ge, S.S. Experiment and study on mechanical property of sandstone post-peak under the cyclic loading and unloading. Geotech. Geol. Eng. 2018, 36, 1609–1620. [Google Scholar] [CrossRef]
  76. Yang, S.Q.; Jing, H.W.; Wang, S.Y. Experimental investigation on the strength, deformability, failure behavior and acoustic emission locations of red sandstone under triaxial compression. Rock Mech. Rock Eng. 2012, 45, 583–606. [Google Scholar] [CrossRef]
  77. Becattini, V.; Motmans, T.; Zappone, A.; Madonna, C.; Haselbacher, A.; Steinfeld, A. Experimental investigation of the thermal and mechanical stability of rocks for high-temperature thermal-energy storage. Appl. Energy 2017, 203, 373–389. [Google Scholar] [CrossRef]
  78. Luque, A.; Ruiz-Agudo, E.; Cultrone, G.; Sebastian, E.; Siegesmund, S. Direct observation of microcrack development in marble caused by thermal weathering. Environ. Earth Sci. 2011, 62, 1375–1386. [Google Scholar] [CrossRef]
  79. Zhao, Y.S.; Wan, Z.J.; Feng, Z.J.; Xu, Z.H.; Liang, W.G. Evolution of mechanical properties of granite at high temperature and high pressure. Geomech. Geophys. Geo-Energy Geo-Resour. 2017, 3, 199–210. [Google Scholar] [CrossRef]
  80. David, C.; Menendez, B.; Darot, M. Influence of stress-induced and thermal cracking on physical properties and microstructure of La Peyratte granite. Int. J. Rock Mech. Min. Sci. 1999, 36, 433–448. [Google Scholar] [CrossRef]
  81. Dwivedi, R.D.; Goel, R.K.; Prasad, V.V.R.; Sinha, A. Thermo-mechanical properties of Indian and other granites. Int. J. Rock Mech. Min. Sci. 2008, 45, 303–315. [Google Scholar] [CrossRef]
  82. Isaka, B.L.A.; Ranjith, P.G.; Rathnaweera, T.D.; Perera, M.S.A.; De Silva, V.R.S. Quantification of thermally-induced microcracks in granite using X-ray CT imaging and analysis. Geothermics 2019, 81, 152–167. [Google Scholar] [CrossRef]
  83. Hajpal, M.; Torok, A. Mineralogical and colour changes of quartz sandstones by heat. Environ. Geol. 2004, 46, 311–322. [Google Scholar] [CrossRef]
  84. Sun, Q.; Zhang, Z.Z.; Xue, L.; Zhu, S.Y. Physico-mechanical properties variation of rock with phase transformation under high temperature. Chin. J. Rock Mech. Eng. 2013, 32, 935–942. [Google Scholar]
  85. Winkler, E.M. Stone in Architecture: Properties, Durability, 3rd ed.; Spring: Berlin, Germany, 1994. [Google Scholar]
  86. Ohno, I. Temperature variation of elastic properties of alpha-quartz up to the alpha-beta transition. J. Phys. Earth 1995, 43, 157–169. [Google Scholar] [CrossRef]
  87. Hartlieb, P.; Toifl, M.; Kuchar, F.; Meisels, R.; Antretter, T. Thermo-physical properties of selected hard rocks and their relation to microwave-assisted comminution. Miner. Eng. 2016, 91, 34–41. [Google Scholar] [CrossRef]
  88. Chen, S.W.; Yang, C.H.; Wang, G.B. Evolution of thermal damage and permeability of Beishan granite. Appl. Therm. Eng. 2017, 110, 1533–1542. [Google Scholar] [CrossRef]
  89. Zhao, Z.K.; Sun, Q.Z.; Zhang, P.Q.; Jing, H.O.; Sun, Y.M. Effect of calcinatin on phase transformation and expansibility of quartz sands during heating. Foundry 2006, 55, 961–964. [Google Scholar]
  90. Huang, B.L. Mineral Differential Thermal Analysis and Identification Manual; Science Press: Beijing, China, 1987. [Google Scholar]
  91. Vagnon, F.; Colombero, C.; Colombo, F.; Comina, C.; Ferrero, A.M.; Mandrone, G.; Vinciguerra, S.C. Effects of thermal treatment on physical and mechanical properties of Valdieri Marble-NW Italy. Int. J. Rock Mech. Min. Sci. 2019, 116, 75–86. [Google Scholar] [CrossRef]
  92. Yavuz, H.; Demirdag, S.; Caran, S. Thermal effect on the physical properties of carbonate rocks. Int. J. Rock Mech. Min. Sci. 2010, 47, 94–103. [Google Scholar] [CrossRef]
  93. Zhang, Z.Z. Fractal dimension of fracture surface in rock material after high temperature. Adv. Mater. Sci. Eng. 2015, 2015, 468370. [Google Scholar] [CrossRef]
  94. Xu, X.L.; Zhang, Z.Z. Fractal characteristics of rock fracture surface under triaxial compression after high temperature. Adv. Mater. Sci. Eng. 2016, 2016, 2181438. [Google Scholar] [CrossRef]
  95. Rong, G.; Yao, M.D.; Peng, J.; Sha, S.; Tan, J. Influence of initial thermal cracking on physical and mechanical behaviour of a coarse marble: Insights from uniaxial compression tests with acoustic emission monitoring. Geophys. J. Int. 2018, 214, 1886–1900. [Google Scholar]
  96. Dang, J.X.; Zhou, Y.S.; Rybacki, E.; He, C.R.; Dresen, G. An experimental study on the brittle-plastic transition during deformation of granite. J. Asian Earth Sci. 2017, 139, 30–39. [Google Scholar] [CrossRef]
  97. Masotta, M.; Laumonier, M.; McCammon, C. Transport of melt and volatiles in magmas inferred from kinetic experiments on the partial melting of granitic rocks. Lithos 2018, 318, 434–447. [Google Scholar] [CrossRef]
  98. Zuo, J.P.; Wang, J.T.; Sun, Y.J.; Chen, Y.; Jiang, G.H.; Li, Y.H. Effects of thermal treatment on fracture characteristics of granite from Beishan, a possible high-level radioactive waste disposal site in China. Eng. Fract. Mech. 2017, 182, 425–437. [Google Scholar] [CrossRef]
  99. Xi, D.Y. Physical characteristics of mineral phase transition in the granite. Acta Mineral. Sin. 1994, 14, 223–227. [Google Scholar]
  100. Fan, L.F.; Gao, J.W.; Wu, Z.J.; Yang, S.Q.; Ma, G.W. An investigation of thermal effects on micro-properties of granite by X-ray CT technique. Appl. Therm. Eng. 2018, 140, 505–519. [Google Scholar] [CrossRef]
Figure 1. Collection location and basic form of the granite blocks.
Minerals 09 00553 g001
Figure 2. Heating device and procedure for thermal treatment. (a) The high temperature furnace MTS653; (b) the heating process.
Minerals 09 00553 g002
Figure 3. X-ray diffraction (XRD) patterns of granite at different heating temperatures from 25 °C to 1200 °C.
Minerals 09 00553 g003
Figure 4. The maximum diffracted intensity (MDI) of the main minerals at different temperatures.
Minerals 09 00553 g004
Figure 5. Mineral contents of granite specimens at different temperatures.
Minerals 09 00553 g005
Figure 6. The height–width ratio of the diffraction peak of feldspar with temperature.
Minerals 09 00553 g006
Figure 7. The mercury injection and ejection curves in granite samples heat-treated at different temperatures.
Minerals 09 00553 g007
Figure 8. Relationship between cumulative pore volume and pore radius in granite samples heat-treated at different temperatures.
Minerals 09 00553 g008
Figure 9. Volume change of the six types of pores in granite samples with increasing temperature.
Minerals 09 00553 g009
Figure 10. Volume proportion of the six types of pores in granite samples with increasing temperature.
Minerals 09 00553 g010
Figure 11. Variation of porosity of the granite samples with increasing temperature.
Minerals 09 00553 g011
Figure 12. Variation of P-wave velocity of the granite samples with heating temperature.
Minerals 09 00553 g012
Figure 13. Variation of uniaxial compressive strength (UCS) and peak strain of the granite samples with heating temperature.
Minerals 09 00553 g013
Figure 14. Variation of elastic modulus of the granite samples with heating temperature.
Minerals 09 00553 g014
Figure 15. Variation of shear-slip strain of the granite samples with heating temperature.
Minerals 09 00553 g015
Figure 16. Variation of thermal expansion coefficient of quartz and calcium feldspar with heating temperature [85].
Minerals 09 00553 g016
Figure 17. Diagram of change in the quartz bond angle from α phase (a) to β phase (b) [89].
Minerals 09 00553 g017
Figure 18. Diagrams of the microstructure development process of quartz crystals [7]. (a) 25 °C; (b) <400 °C; (c) 400–600 °C; (d) 600–800 °C.
Minerals 09 00553 g018
Figure 19. SEM images of fracture surfaces in rock samples at different temperature: (a) 25 °C; (b) 200 °C; (c) 500 °C; (d) 800 °C; (e) 1000 °C; (f) 1200 °C [93].
Minerals 09 00553 g019
Table 1. The maximum diffracted intensity (MDI) of the main minerals at different temperatures.
Temperature (°C)2510020030050080010001200
Feldspar (cps)435486366488401268268283
Pyroxene (cps)1018716011511312011997
Quartz (cps)98130142123127118117119
Illite (cps)886267806762600
Mullite (cps)000000035
Table 2. Mineral contents of granite specimens at different temperatures.
Temperature (°C)2510020030050080010001200
Feldspar (%)64.2562.7660.3360.5661.8861.4661.6359.35
Pyroxene (%)19.2320.8721.5619.8921.5921.8819.422.12
Quartz (%)9.410.2612.6913.3511.1111.9810.229.32
Illite (%)5.13.673.094.163.353.232.650
Mullite (%)00000001.05
Others (%)2.022.442.332.042.071.456.18.16
Table 3. Pore volume and proportion with different size in granite samples after different heating temperatures.
Temperature (°C)PropertiesPore Radius (μm)
<0.01 (Nano)0.01–0.1 (Micro)0.1–1 (Small)1–10 (Medium)10–100 (Big)>100 (Large)
25Volume (cm3/g)0.00010.0010.00040.00050.0010.0001
Proportion (%)3.2332.2612.9016.1332.263.23
100Volume (cm3/g)0.00030.001100.00050.00070.0002
Proportion (%)10.7139.29017.8625.007.14
200Volume (cm3/g)0.00050.00070.00060.00050.00070.0004
Proportion (%)14.7120.5917.6514.7120.5911.76
300Volume (cm3/g)0.00070.00060.00060.00080.00090.0013
Proportion (%)14.2912.2412.2416.3318.3726.53
500Volume (cm3/g)0.00040.00060.00060.00050.00080.0005
Proportion (%)11.7617.6517.6514.7123.5314.71
800Volume (cm3/g)0.00050.00120.00160.00240.00210.0007
Proportion (%)5.8814.1218.8228.2424.718.24
1000Volume (cm3/g)0.00060.00160.00220.00490.00220.0005
Proportion (%)5.0013.3318.3340.8318.334.17
1200Volume (cm3/g)0.00060.00060.00200.00640.00320.0007
Proportion (%)4.444.4414.8147.4123.705.19

