Article

Struvite Crystallisation and the Effect of Co2+ Ions

by
Jörn Hövelmann
1,*,
Tomasz M. Stawski
1,
Helen M. Freeman
1,2,
Rogier Besselink
1,3,
Sathish Mayanna
1,
Jeffrey Paulo H. Perez
1,4,
Nicole S. Hondow
2 and
Liane G. Benning
1,4
1
GFZ German Research Centre for Geosciences, 14473 Potsdam, Germany
2
School of Chemical and Process Engineering, University of Leeds, LS2 9JT Leeds, UK
3
Université Grenoble Alpes, CNRS, ISTerre, 38000 Grenoble, France
4
Department of Earth Sciences, Freie Universität Berlin, 12249 Berlin, Germany
*
Author to whom correspondence should be addressed.
Minerals 2019, 9(9), 503; https://doi.org/10.3390/min9090503
Submission received: 12 July 2019 / Revised: 14 August 2019 / Accepted: 19 August 2019 / Published: 22 August 2019
(This article belongs to the Special Issue Crystal Nucleation and Growth)

Abstract

:
The controlled crystallisation of struvite (MgNH4PO4∙6H2O) is a viable means for the recovery and recycling of phosphorus (P) from municipal and industrial wastewaters. However, an efficient implementation of this recovery method in water treatment systems requires a fundamental understanding of struvite crystallisation mechanisms, including the behavior and effect of metal contaminants during struvite precipitation. Here, we studied the crystallisation pathways of struvite from aqueous solutions using a combination of ex situ and in situ time-resolved synthesis and characterization techniques, including synchrotron-based small- and wide-angle X-ray scattering (SAXS/WAXS) and cryogenic transmission electron microscopy (cryo-TEM). Struvite syntheses were performed both in the pure Mg-NH4-PO4 system as well as in the presence of cobalt (Co), which, among other metals, is typically present in waste streams targeted for P-recovery. Our results show that in the pure system and at Co concentrations < 0.5 mM, struvite crystals nucleate and grow directly from solution, much in accordance with the classical notion of crystal formation. In contrast, at Co concentrations ≥ 1 mM, crystallisation was preceded by the transient formation of an amorphous nanoparticulate phosphate phase. Depending on the aqueous Co/P ratio, this amorphous precursor was found to transform into either (i) Co-bearing struvite (at Co/P < 0.3) or (ii) cobalt phosphate octahydrate (at Co/P > 0.3). These amorphous-to-crystalline transformations were accompanied by a marked colour change from blue to pink, indicating a change in Co2+ coordination in the formed solid from tetrahedral to octahedral. Our findings have implications for the recovery of nutrients and metals during struvite crystallisation and contribute to the ongoing general discussion about the mechanisms of crystal formation.

Graphical Abstract

1. Introduction

In a world of an ever-growing global population and increasing use of raw materials, the recovery of critical elements from municipal, agricultural, and industrial wastewater streams is of paramount importance for the conservation of limited natural resources, and the prevention and remediation of environmental pollution. This becomes particularly clear when looking at phosphorus (P) because modern agriculture increasingly relies on P-fertilizers, yet the natural phosphate rock reserves for fertilizer production are steadily declining and may be depleted in the mid-term future [1]. At the same time, the application of fertilizers locally leads to large excesses of P, which can cause major environmental problems, such as eutrophication in aquatic systems. A viable means of addressing these problems is to recover P from wastewaters by controlled precipitation of the mineral struvite (MgNH4PO4·6H2O). Such a P-recovery process not only enables the safe disposal of nutrient-laden wastes, but ultimately also contributes to the conservation of non-renewable geologic P reserves, as recovered struvite crystals may be reused directly as an eco-friendly slow-release fertilizer [2,3].
Phosphorus recovery as struvite involves its crystallisation from a solution oversaturated with respect to its constituent ions, which in turn may be achieved by adjusting parameters, such as the pH and ion content, of the wastewater stream. So far, research has primarily focused on optimizing the conditions under which struvite can be removed from the wastewater by bulk precipitation ([4] and references therein). Yet, a detailed mechanistic understanding of the early nucleation and growth stages in this precipitation process is lacking although such knowledge would help to control and manipulate struvite precipitation in many different wastewater treatment systems. In recent years, numerous studies have revitalized the discussion about the processes governing the formation of crystals from solution. There is ample evidence suggesting that the classical view on crystal nucleation, in which the most stable crystalline phase nucleates and grows directly from solution, is far too simplified and alternatives have been suggested. Among these is the emerging picture of non-classical crystallisation, which involves a pre-nucleation stage that is followed by a number of stages where various transient precursor phases form before the thermodynamically stable crystal is formed [5]. Although demonstrated for several other mineral systems (including carbonates, sulphates, phosphates, oxides, and hydroxides [6]), the existence of such precursor pathways during the crystallisation of struvite from solution has not yet been clarified. This lack of information is, in part, due to the low solubility of struvite as well as its fast growth kinetics at high supersaturation [7,8], which limits the range of applicable experimental techniques that can be used to follow these reactions.
In addition to the knowledge gap on fundamental mechanisms of struvite crystallisation in pure systems, very little is currently known about how struvite crystallisation is affected by the presence of foreign ions. Such knowledge is important since wastes targeted for P recovery (e.g., sewage sludge) contain a wide variety of other inorganic and organic substances, which may associate with the precipitating struvite and affect its quality and applicability as a fertilizer [3]. Common contaminants present in wastes include heavy metals and metalloids, such as chromium (Cr), zinc (Zn), copper (Cu), nickel (Ni), cobalt (Co), arsenic (As), and selenium (Se), as well as various organic substances and pathogens. During struvite precipitation, these species could either be incorporated in the struvite structure, adsorbed to the crystal surface, or precipitated as separate phases [9,10,11,12,13]. Thus, such ions likely affect the crystallisation behaviour of struvite. In this context, divalent transition metal ions are of particular interest because they can substitute Mg2+ in the struvite structure [14,15,16,17]. One such metal is cobalt, which is also typically present in sewage sludge at concentrations on the order of 10 to 2500 mg kg−1 dry sludge [18]. Cobalt has been, together with phosphate rock, included in the EU’s list of critical raw materials (CRMs) [19,20] due to its high economic importance and low substitutability in advanced technological applications. In low quantities, cobalt is also an essential element for human and animal nutrition as it is the central atom in cobalamin, also known as vitamin B12. Cobalt deficiency in soils can cause vitamin B12 deficiency in livestock [21], therefore the presence of small quantities of cobalt in struvite may be beneficial for its use as a fertilizer. Excessive concentrations of cobalt in the environment, on the other hand, are toxic and can have severe effects on the health of plants, animals, and humans [22,23].
The goal of this study is to shed light on the crystallisation pathways of struvite from aqueous solutions both in the pure system and in the presence of Co2+ ions. To do this, we have used a combination of ex situ and in situ time-resolved synthesis and characterization techniques. Our results contribute to the current discussion regarding the early stages of crystal formation in general and, in particular, provide important insights for the recovery of nutrients and metals during struvite crystallisation, for downstream use and development of struvite-based fertilizers.

2. Materials and Methods

2.1. Crystallisation Experiments

Reagent grade di-ammonium phosphate (DAP; (NH4)2HPO4), magnesium chloride (MgCl2·6H2O), and cobalt sulfate (CoSO4·7H2O) (Sigma Aldrich) were used as starting materials to synthesize struvite, according to the generic reaction:
Mg2+(aq) + HxPO4(3−x)−(aq) + NH4+(aq) → MgNH4PO4·6H2O(s) ↓ + xH+(aq)
Solutions were prepared by dissolving appropriate amounts (according to Table 1) of each salt in double-deionized water (resistivity > 18 mΩ·cm). Struvite crystallisation experiments were performed at 25 °C by mixing DAP and MgCl2 solutions in the absence or presence of CoSO4 (0.25–6 mM in the mixed solutions). The CoSO4 was added to the MgCl2 solution prior to mixing with the DAP solution. The start of an experiment is defined as the moment when the initial salt solutions were mixed. In most cases, these mixed solutions contained equimolar concentrations of DAP and MgCl2 (6.1 or 3.05 mM). However, in some experiments, we also tested the effect of a 9-fold molar excess of DAP relative to MgCl2 or CoSO4 (i.e., 54:6 or 27:3 mM). The starting (mixed) concentrations of all solutions are listed in Table 1. The typical experimental procedure was as follows: 25 mL of a DAP solution were poured into a 50 mL glass beaker and vigorously stirred at room temperature. Then, 25 mL of a MgCl2 (± CoSO4) solution were quickly added under continuous stirring. The crystallisation reactions were run for up to 1500 s and the reaction progress was continuously monitored through the change in solution pH and turbidity. At specific time intervals, an aliquot (1 mL) was withdrawn from the reaction mixture and vacuum-filtered through a 0.2-μm polycarbonate membrane filter to recover any formed solid particles. The remaining suspensions were kept stirring until no further changes in pH and turbidity were observed. Thereafter, the final solids were collected by vacuum filtration. All solid samples were dried in air at room temperature and stored in glass vials before further ex situ analysis by scanning electron microscopy (SEM) and X-ray diffraction (XRD). Furthermore, to assess the nucleation and growth pathway in a time-resolved manner, we also carried out in situ small- and wide-angle X-ray scattering (SAXS/WAXS) experiments and characterized selected precipitates at high resolution with conventional (TEM) and cryogenic transmission electron microscopy (cryo-TEM).

2.2. Analytical Methods

The time-dependent development of turbidity in the mixed solutions was monitored using a UV-VIS Evolution 220 spectrophotometer (Thermo Fischer Scientific, Waltham, MA, USA) equipped with a fibre optics add-on immersion probe. All UV-VIS measurements were carried out at a 1 s time resolution and at a wavelength of 700 nm, where light absorption from the initial solutions was found to be minimal. The pH was continuously recorded with a time resolution of 1 s using a multi-purpose data logger board, “DrDAQ” (Pico Technology, Cambridgeshire, UK), equipped with a pH probe.
Powder X-ray diffraction (XRD) patterns of dried solid reaction products were collected on a PANalytical Empyrean X-ray diffractometer (Almelo, the Netherlands) using a Cu Kα radiation source operating at 40 kV and 40 mA. Data were collected in the 2θ range between 4.6° and 85° using a step size of 0.013° and a counting time of 60 s per step.
Dried synthesized solids were coated with a ~20 nm-thick layer of carbon using a BAL-TEC MED 020 (Leica Microsystems, Wetzlar, Germany) high-vacuum sputter coater and characterized with an Ultra Plus 55 (Carl Zeiss Microscopy GmbH, Oberkochen, Germany) high-resolution field emission scanning electron microscope (FESEM). An acceleration voltage of 2 to 5 kV with a 30 µm aperture and 20 kV with a 120 µm aperture were used for imaging and energy dispersive X-ray (EDX) analysis, respectively. All EDX elemental counts were ZAF-corrected and are semi-quantitative.
In situ and time-resolved small- and wide-angle X-ray scattering (SAXS/WAXS) measurements were carried out at beamline I22 of the Diamond Light Source Ltd. (UK). Experiments were performed using a monochromatic X-ray beam at 12.4 keV, and scattered intensities were collected at small angles with a Dectris Pilatus P3-2M and at wide angles with Dectris Pilatus P3-2M-DLS-L (2D large area pixel-array detectors). Transmission was measured by means of a photodiode installed in the beam-stop of the SAXS detector. The sample-to-detector distances allowed for a usable q-range of 0.01 < q < ~0.35 Å−1 in SAXS, and of 0.17 < q < 5 Å−1 in WAXS. The used configuration provided an overlap in q, and the measured WAXS intensity was scaled against the SAXS signal in order to obtain a continuous recording of scattered intensities spanning over 3.5 decades. The scattering range at small angles was calibrated against silver behenate and the corresponding measured intensity was calibrated to absolute units against glassy carbon. The q-range in WAXS was calibrated with cerium(IV) oxide powder. The recorded 2D SAXS and WAXS patterns were found to be independent of the in-plane azimuthal angle with respect to the detector (i.e., scattering patterns were circular in shape), showing that the investigated systems could be considered isotropic. In the obtained patterns, pixels corresponding to similar q regardless of their azimuthal angle were averaged, and hence the 2D patterns were reduced to 1D curves. SAXS/WAXS data processing and reduction included among other steps: Masking of undesired pixels, normalizations and correction for transmission, background subtraction, and data integration to 1D, for which we followed Pauw et al. [24]. All these steps were performed using the Data Analysis WorkbeNch (DAWN) software package (v. 2.6+) according to I22 guidelines and using I22 pre-defined pipelines. The formation of pure Mg-struvite was followed in situ by time-resolved SAXS/WAXS analyses of changes in a 6.1 mM MgCl2-DAP solution. The content of the reactor was circulated by means of a peristaltic pump, via Teflon-coated tubing (ID 2 mm) through a borosilicate capillary (external diameter of 1.5 mm and a wall-thickness of 10 µm) aligned with the X-ray beam. The scattering data was collected at 1 frame s−1 from the moment of mixing of the two solutions, and over a period of up to 1 h.
Samples for conventional transmission electron microscopic (TEM) imaging and analyses were prepared by drop-casting an aliquot of the suspension onto a holey amorphous carbon-coated Cu grid deposited on a cellulose nitrite filter paper. Once dried the TEM grid was loaded into a single tilt TEM holder and transferred to the TEM instrument, TEM images were collected using an FEI Tecnai G2 F20 X-Twin FEG TEM (FEI company, Hillsboro, OR, USA) operated at 200 kV and equipped with a Gatan Imaging Filter (GIF) Tridiem™, a Fischione high angle annular dark field (HAADF) detector, and an EDAX X-ray analyzer.
As struvite is a hydrated mineral and therefore sensitive to the vacuum of the TEM [25], we also employed cryogenic transmission electron microscopy (cryo-TEM) to ensure the reaction products investigated were representative of the native state. Cryo-TEM sample preparation was done using a FEI Vitrobot© markIV (FEI company, Hillsboro, OR, USA). A ~3.5 μL aliquot of the same solution analysed with conventional TEM was dispensed onto a lacey amorphous carbon-coated Cu grid, which was immediately (within <1 s) blotted and plunge frozen into liquid ethane at blot force 6. The frozen sample was then cryo-transferred to an FEI Titan3 Themis G2 S/TEM (FEI company, Hillsboro, OR, USA) using a Gatan 914 holder with the temperature maintained below −165 °C. The TEM was operated at 300 kV, and is equipped with an FEI Super-X energy dispersive X-ray (EDX) system and a Gatan OneView CCD. Cryo-TEM images were collected in low-dose mode with an average electron fluence of 5 eÅ−2 per image. For STEM imaging, a probe current of 40 pA was used (as measured by the dose meter on the flu cam, calibrated using a Faraday cup), which resulted in an electron fluence of ca. 2400 eÅ−2 per STEM-EDX dataset.

3. Results and Discussion

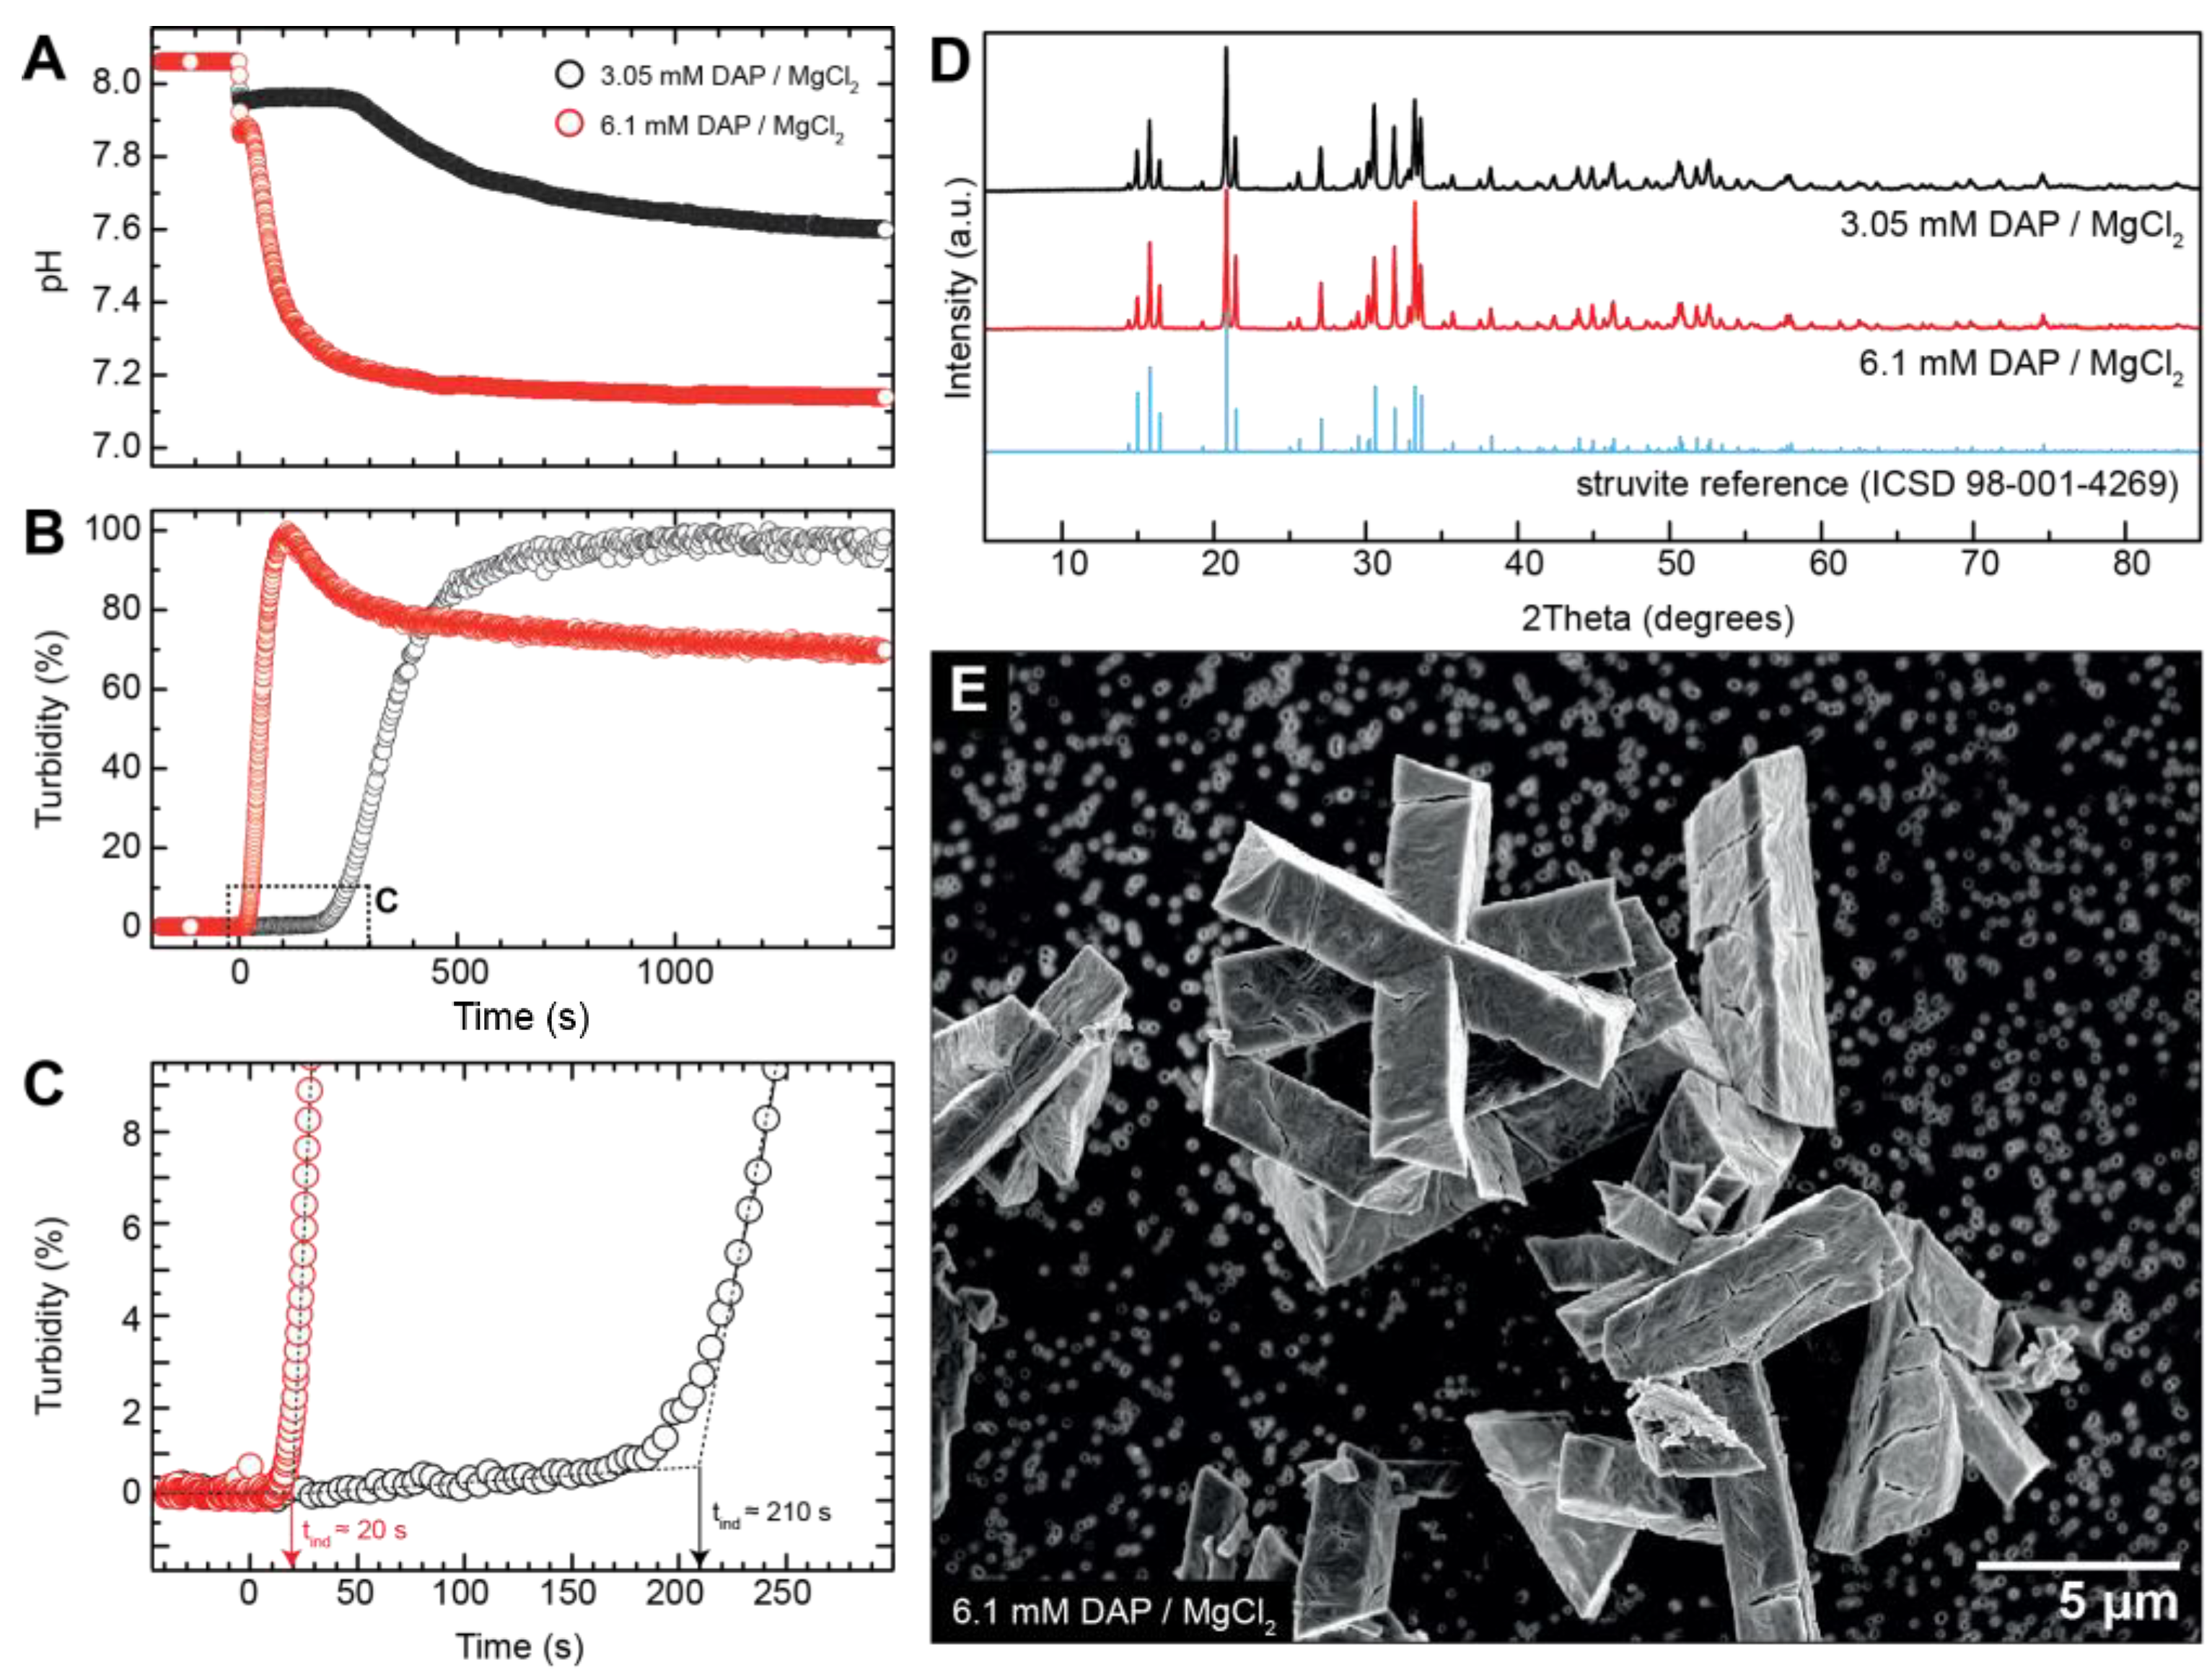
3.1. Crystallisation in the Absence of Co

The non-mixed DAP solution had a pH of ~8.1, which dropped to ~7.9 upon mixing with the MgCl2 solution (pH ~7) and this point defines the initiation of an experiment. The mixed MgCl2-DAP solutions were initially clear, but after a short time period (depending on solution composition) a white precipitate formed, accompanied by a gradual decrease in pH and a mirrored increase in turbidity (Figure 1A,B). The time span between the mixing of the two solutions and the moment of the first pH decrease and concomitant turbidity increase is defined as the precipitation induction time (tind). At mixed MgCl2 and DAP concentrations of 3.05 mM, the precipitation induction time was ~210 s (estimated graphically from the turbidity curves, Figure 1C). The turbidity increased a further ~1000 s before reaching a steady maximum value. Similarly, the pH steadily decreased, reaching a value of ~7.6 after ~1500 s. Doubling the concentrations to 6.1 mM resulted in a ~10 times shorter induction time of only ~20 s (Figure 1C), and a ~10 times faster pH drop that led to a constant value of ~7.15 after ~1000 s (Figure 1A). The turbidity increased ~3 times faster and reached a maximum already after ~100 s, but then gradually declined to about 70% of the maximum value (Figure 1B). This decline in turbidity is likely a consequence of the settling of large particles and/or aggregates.
XRD analyses of solids recovered from the solutions at the end of each experiment showed that crystalline struvite was the only phase produced in all experiments regardless of the sampling time (Figure 1D). SEM images revealed elongated, partly twinned crystals (up to 10 µm long) with the typical coffin-like (i.e., orthorhombic prism) shape of struvite (Figure 1E). The struvite crystals showed rather rough surfaces with abundant cracks. These morphological features are artefacts caused by the (partial) decomposition and amorphization of the struvite crystals in the high vacuum of the SEM [25].
In addition to the experiments with equimolar MgCl2-DAP solutions, we also performed experiments with 9-fold excess of DAP (i.e., 27 mM DAP to 3 mM MgCl2 or 54 mM DAP to 6 mM MgCl2; Table 1). These experiments also resulted in the formation of only struvite, but the crystals were slightly larger (10–20 µm) and had butterfly-like shapes (Figure S1). Such crystal shapes are typically observed for struvite, when crystal growth is rapid and happens at high supersaturations [26].
The formation of solids from a 6.1 mM MgCl2-DAP solution was also followed by in situ time-resolved small- and wide-angle X-ray scattering (SAXS/WAXS) in order to capture all details of the reaction pathway from the earliest dissolved stages to the final solid products. The measurement covered a q-range of 0.01 to 6 Å−1, giving a maximum observable feature length-scale of ∼60 nm (diameter). Figure 2A shows an overview of the scattering patterns for the first 120 s after mixing, i.e., to the point where turbidity reached the maximum (cf. Figure 1A). At a q < 0.4 Å−1, the scattering patterns followed a I(q) ∝ q−4 dependence (dotted line in Figure 2A) extending to the noise level at high-q values. Such a scattering pattern is expected for the formation and development of large (µm-sized) scattering features and originates from the interface between the solid particles and the matrix (solution). We observed that over the course of the experiments, the overall scattering intensity increased by a factor of ~15 in the low-q part (<0.02 Å−1). This can primarily be attributed to the progressive increase in the solid-liquid interface area in the course of nucleation (formation) and further growth of particles.
If the pathway of struvite crystallisation from ions occurred through the aggregation of nano-sized objects, one would expect gradual changes in the intensity and shape of the scattering curves in the mid-q range (~0.02–0.3 Å−1). Such a change has been documented as corresponding to scattering from ~2 to 30 nm large particles, as shown previously, for example, for the crystallisation of gypsum [28]. In our case, however, the scattering intensity in the mid-q range was generally very low (<0.001 cm−1, i.e., around the noise/background level), resulting in a very noisy signal. Thus, the SAXS curves do not contain any measurable scattering features attributable to transient nano-sized objects, such as particles or pores. This could either mean that such objects did not exist in the crystallisation process or that their volume fraction was below the detection limit of the SAXS measurement. The latter possibility seems plausible considering that the volume fraction of solid material in the Mg-NH4-PO4 system at equilibrium is ~10 times lower compared to the Ca-SO4 system (based on bulk solubility data of struvite and gypsum).
In the high-q range of the scattering curves (WAXS, 0.4–6 Å−1), we observed the appearance of clear diffraction peaks already within 2 to 3 s after mixing (Figure 2B). This clearly indicates that the crystallisation of struvite from a 6.1 mM MgCl2-DAP solution occurred virtually instantaneously without any measurable induction time. This is in contrast to our turbidity data that, at equivalent conditions, suggested an induction time of ~20 s (Figure 1C). This discrepancy is likely due to the initially small sizes of the crystalline particles for which the UV-VIS method is limited by the used wavelength. The positions of the diffraction peaks in the WAXS curves remained constant over time and matched the reference pattern for crystalline struvite (Figure 2C,D). No peaks other than those attributable to struvite were observed at any intermediate time step, indicating that struvite crystallised directly from solution without the involvement of any structurally distinct precursor phase(s).
To evaluate the kinetics of crystal nucleation and growth, we considered two kinetic proxies dependent on the scattering features: (1) From SAXS, we investigated the evolution of I(qmin), i.e., the scattering intensity at the lowest q-value (=0.01 Å−1) of our observation window. This parameter is proportional to the electron density of the growing phase, its volume fraction, and the size of particles (volume and/or surface area). Under the assumption that the electron density was constant, this parameter corresponds to the progress of formation and growth of particles. (2) From WAXS, we measured the total area under the diffraction peaks, where the peaks were separated from the overall scattering data using the asymmetric least-squares smoothing algorithm [27]. Here, the change in the total area under the peaks corresponds specifically to the crystallisation progress. Both kinetic proxies were normalized to 1 for comparison and are presented in Figure 3. It can be seen that the peak area from WAXS increases rapidly in the first few seconds, indicating an almost instant onset of crystal formation (matching observations in Figure 2B). After ~100 s, this proxy begins to fluctuate around a constant plateau, suggesting that crystallisation was essentially complete. In a similar manner, I(qmin) from the SAXS data rapidly increased, reaching a maximum at ~11 s, after which it started to decrease to a plateau level after 50 s. The initial increase in I(qmin) indicates a rapid burst of particle nucleation and hence an increase in the volume fraction of the growing phase. The subsequent decrease in I(qmin) can be easily explained if we assume that the growing crystals very quickly reach dimensions that are microns in size (see Figure 1E), and hence their scattering intensities fall out of the minimum q-range, which leads to the apparent decrease in intensity. In fact, this assumption is consistent with the gradual turbidity decline that occurred shortly after the maximum turbidity was reached (see Figure 1B). The decrease in I(qmin) can also be understood as the decrease in the surface area of the particles in the course of aggregation or Ostwald ripening, which also leads to the shift of the intensity towards lower q-values and hence the decrease within our window of observation.

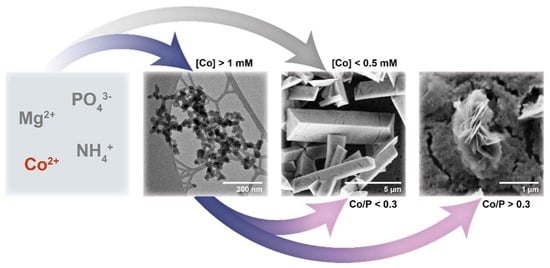
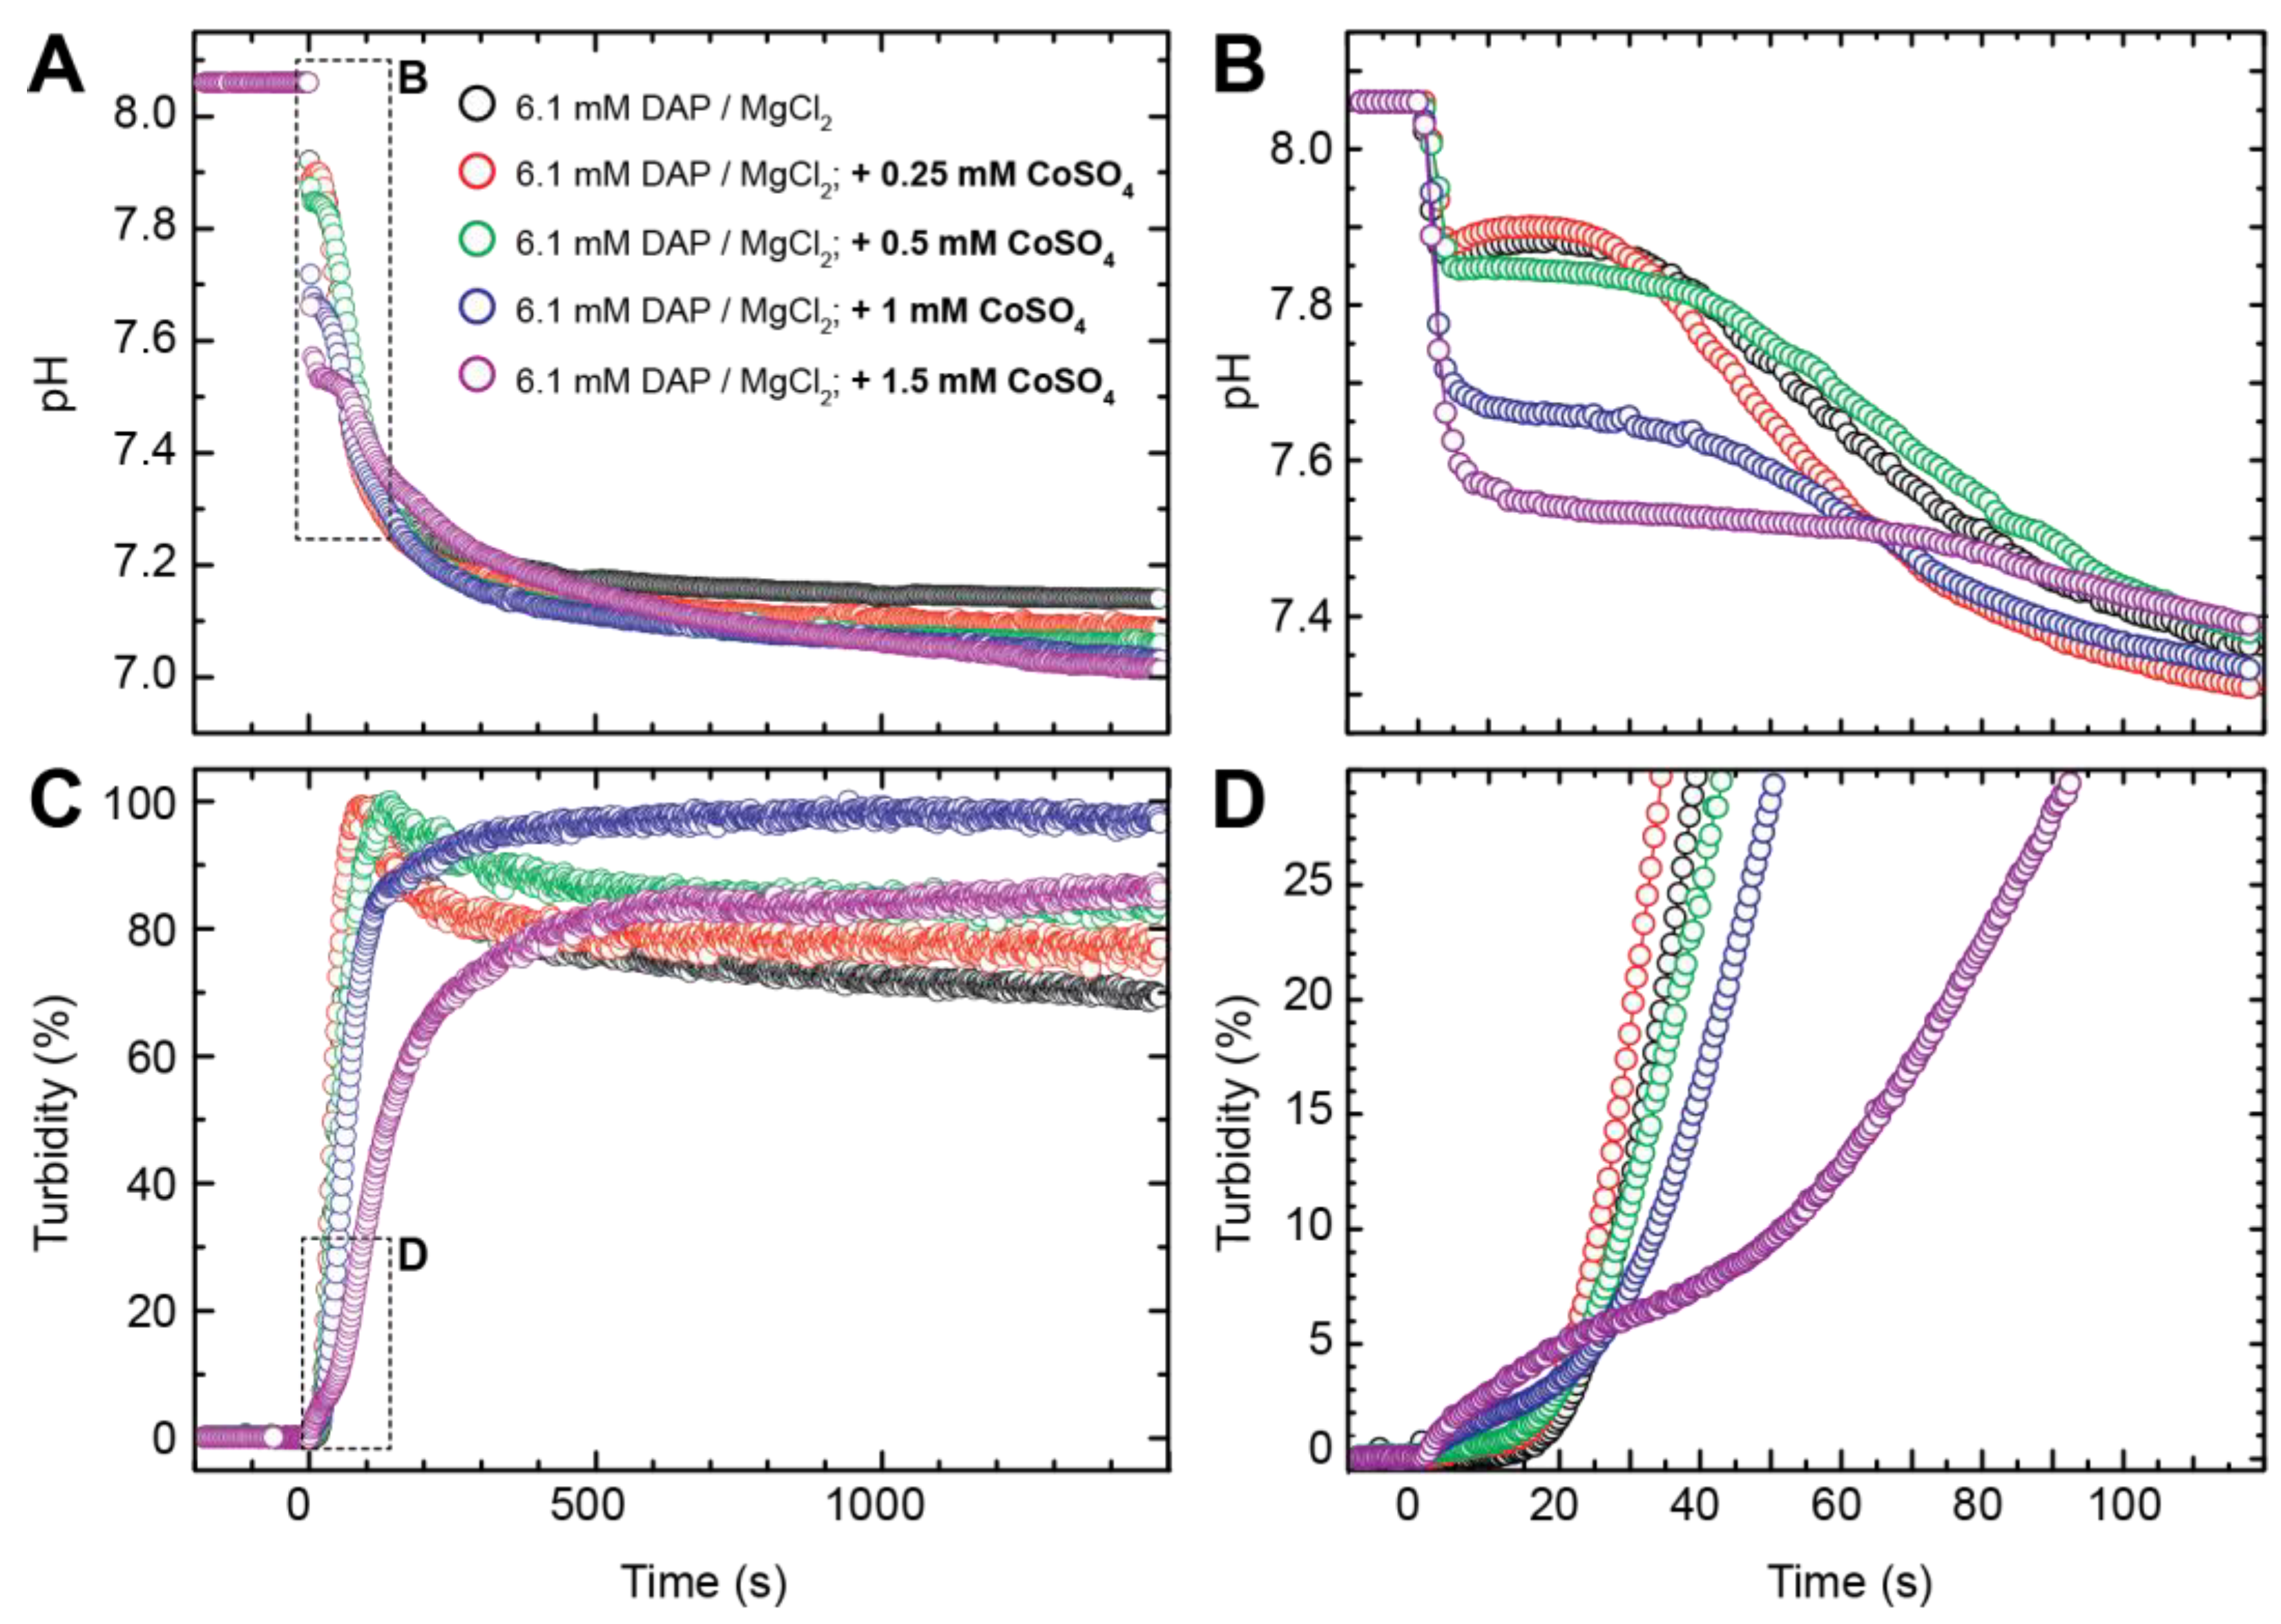
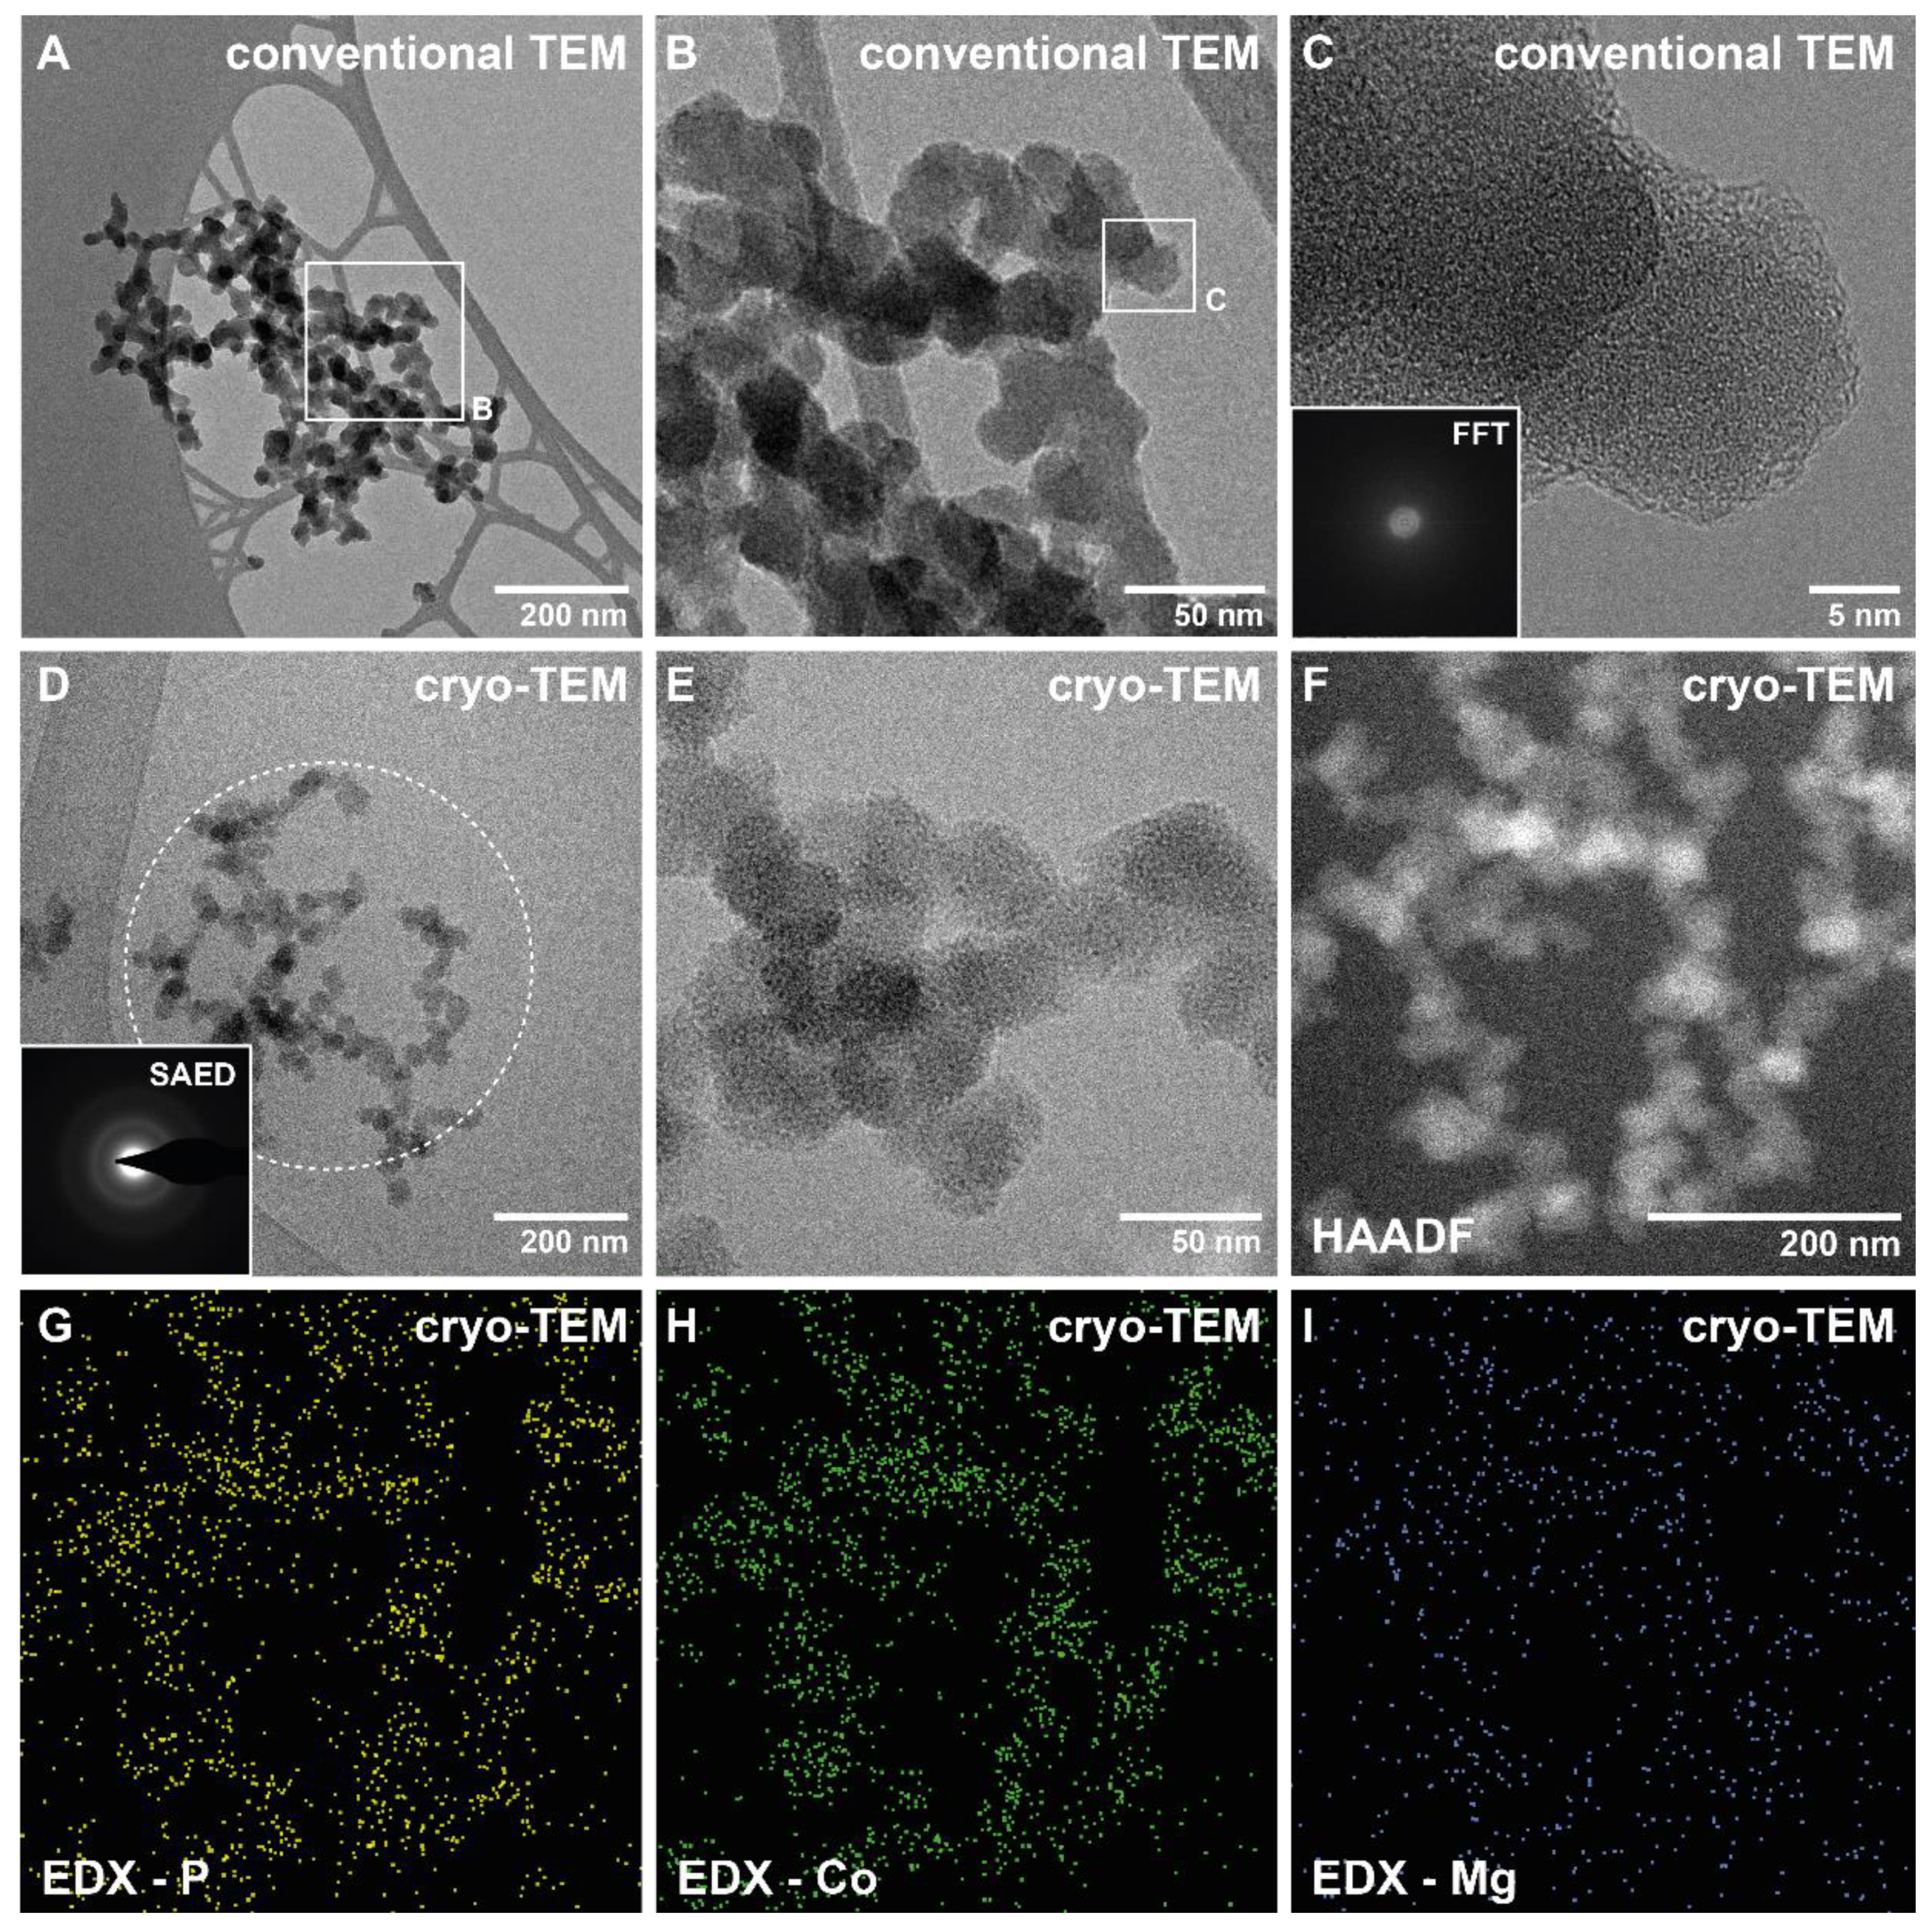
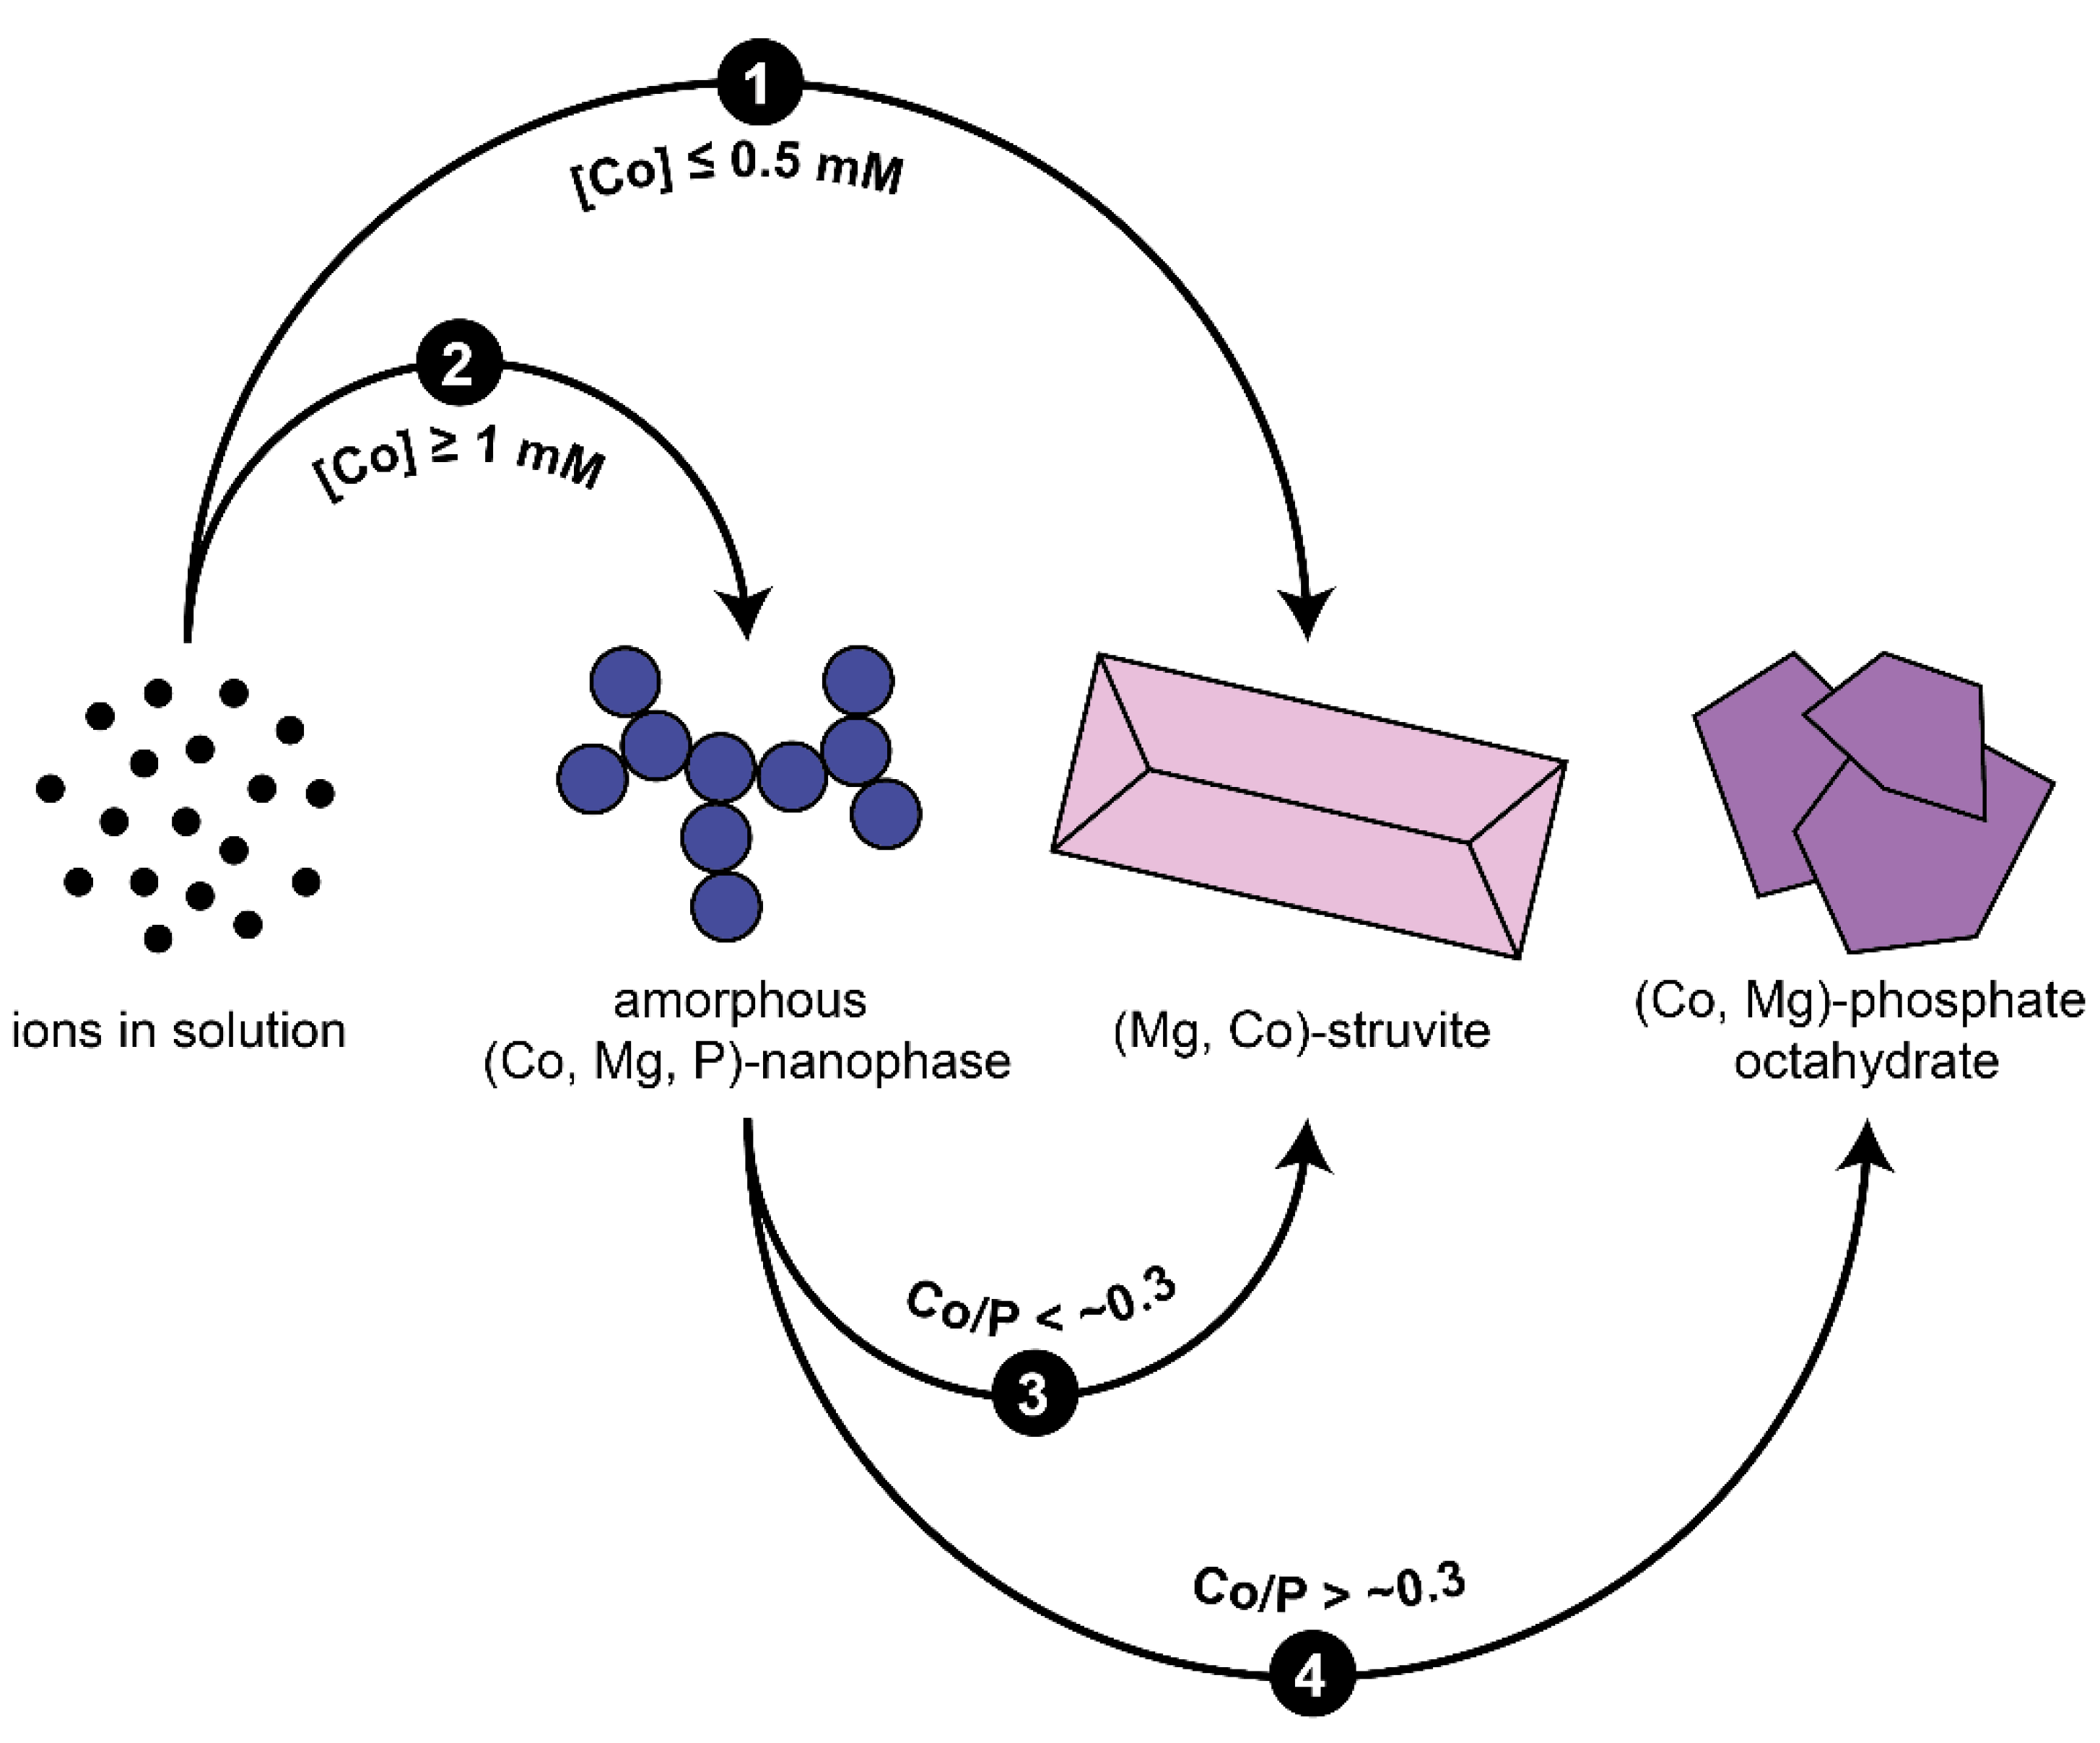
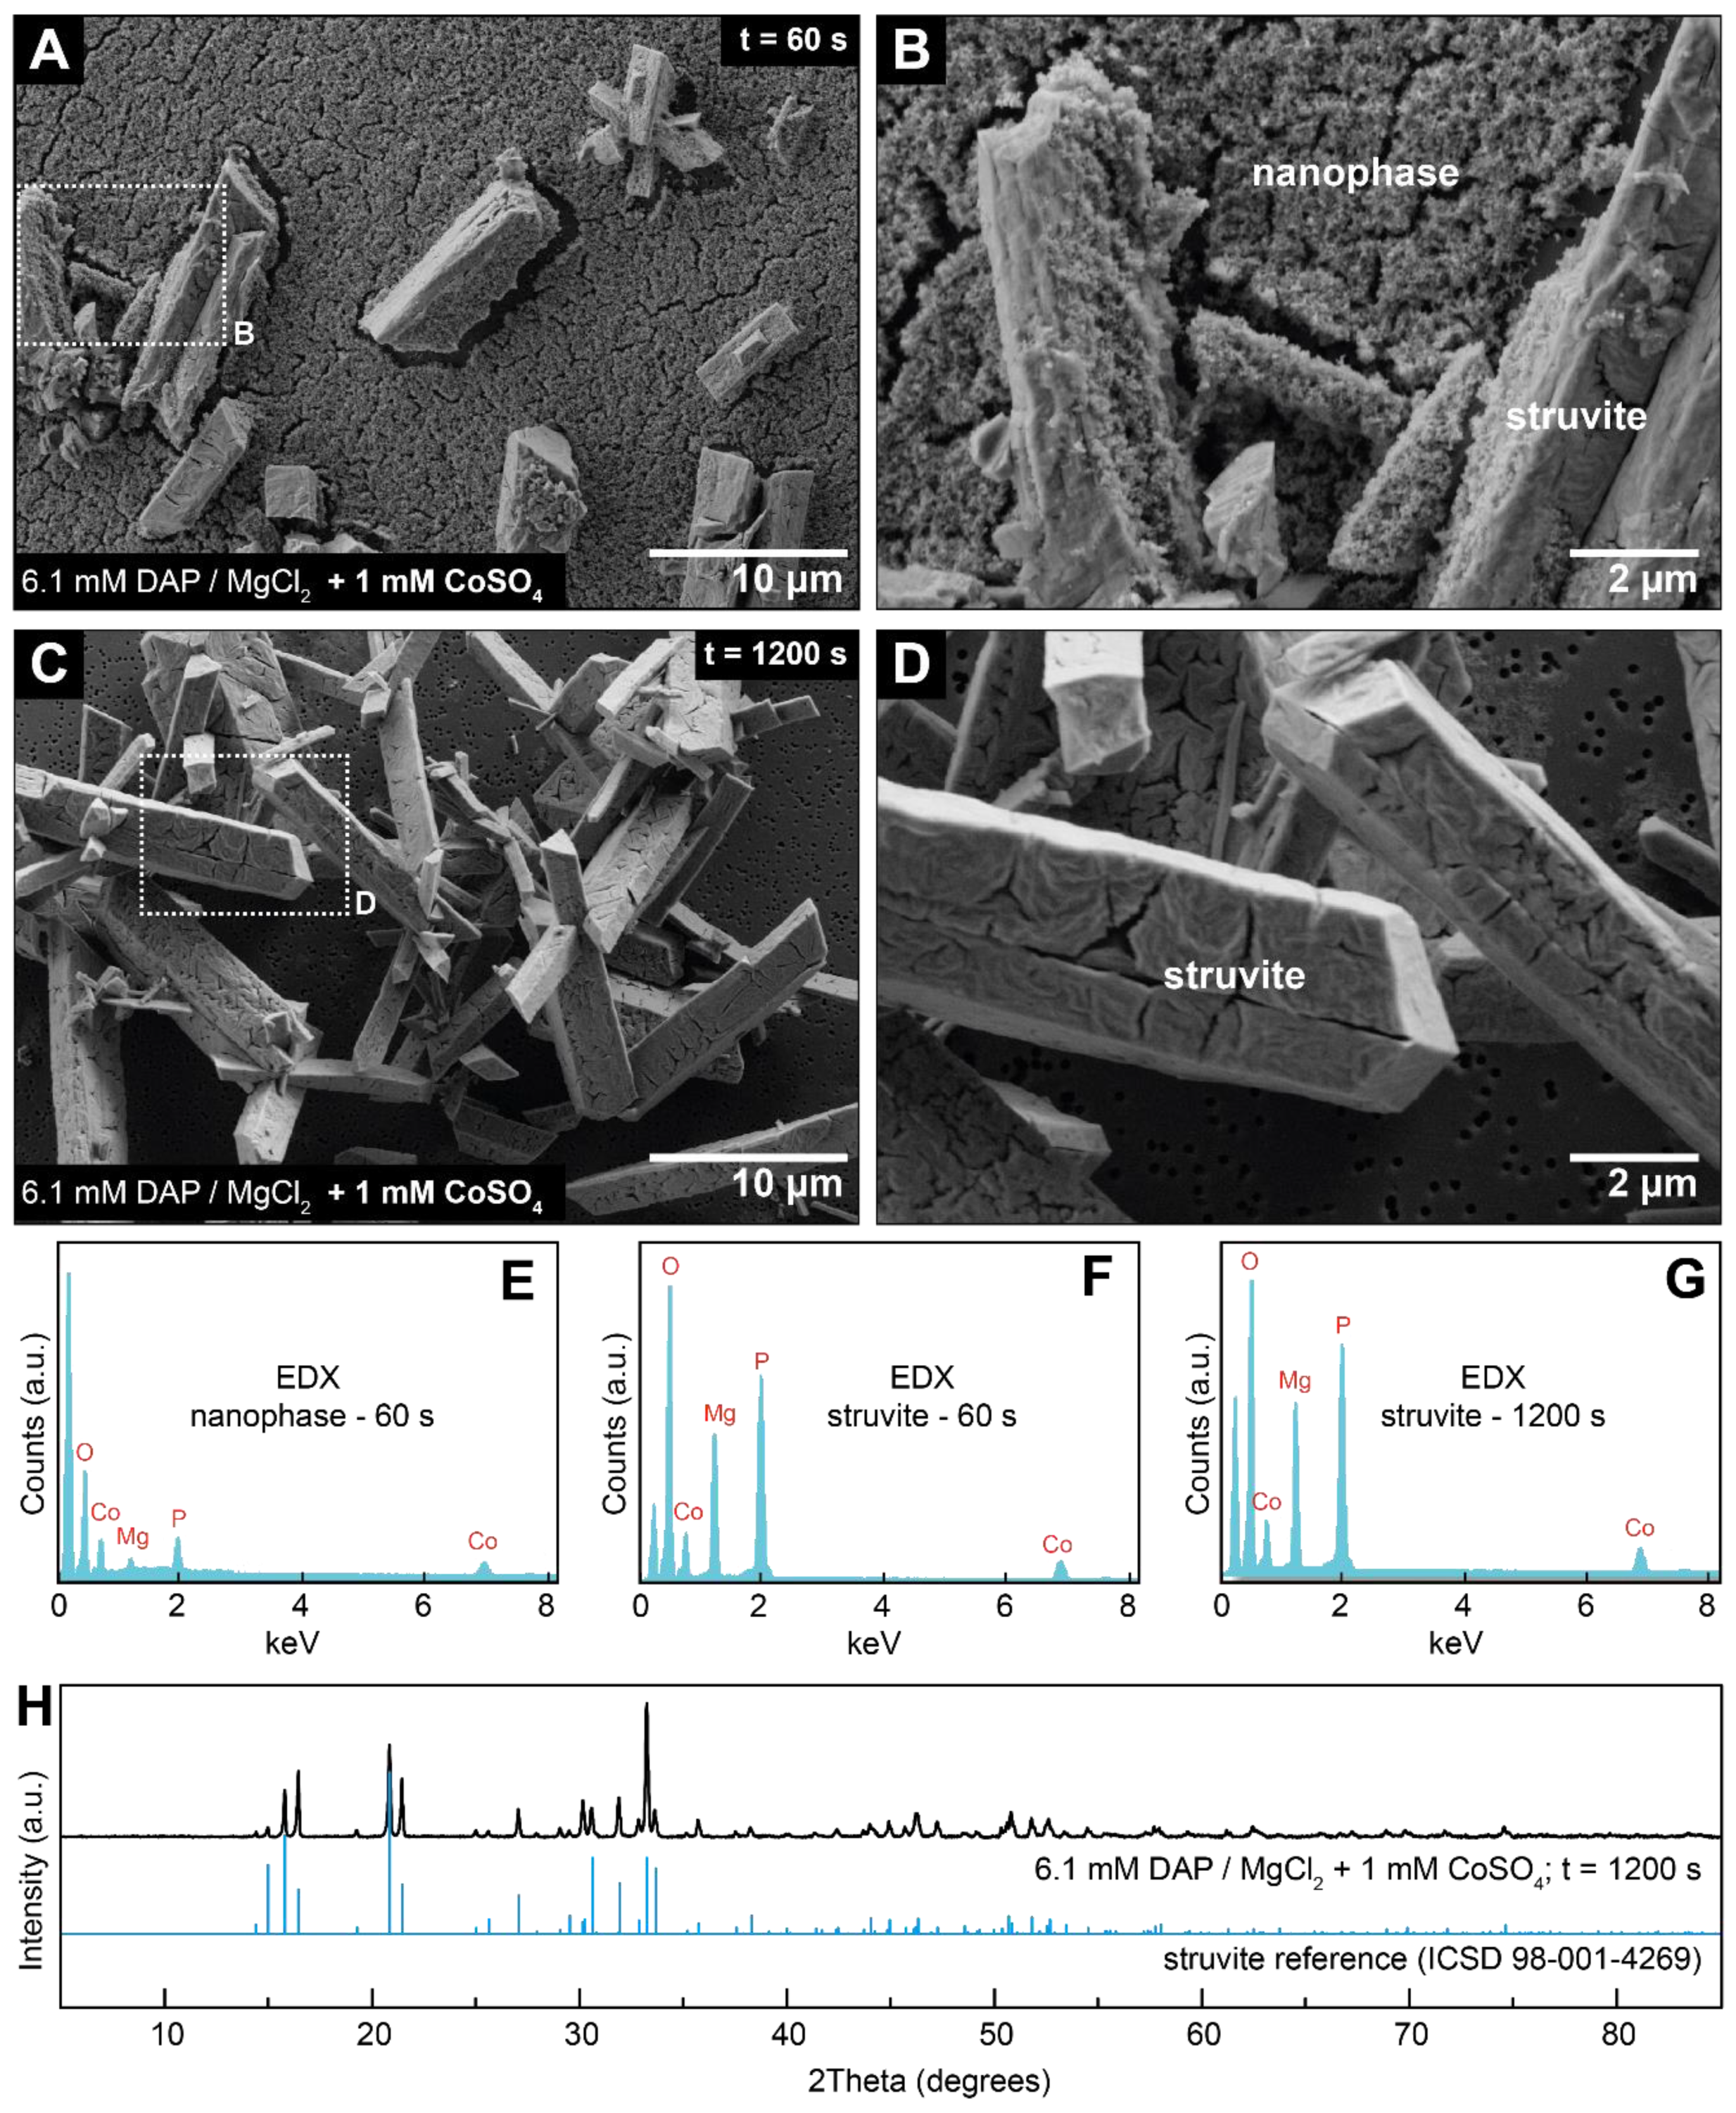
3.2. Crystallisation in the Presence of Low (0.25–1.5 mM) Co Concentrations

The pH and turbidity curves of experiments with 0.25 and 0.5 mM CoSO4 showed essentially the same trends as in the pure MgCl2-DAP system (Figure 4). In contrast, significant changes in the shapes of the pH and turbidity curves were observed at higher CoSO4 concentrations, indicating a different process. At 1 and 1.5 mM CoSO4 immediately after mixing, the pH dropped to 7.7 and 7.55 (Figure 4A,B), respectively, which is a 0.2 to 0.4 greater log unit drop in pH than would be expected from a simple dilution (cf. Figure 1A). After this first decrease, the pH remained relatively constant for several seconds before continuing to decrease to values between 7.0 and 7.1. A similar two-stage trend was also evident in the corresponding turbidity curves (Figure 4C,D). After an instantaneous increase, the slopes of the turbidity curves gradually decreased for several seconds before increasing again and approaching constant maximum values.
SEM images of solids formed during the early reaction stage (60 s after mixing) in the presence of 1 mM CoSO4 revealed a fine-grained, nanoparticulate material in addition to some larger (~10–20 µm long) struvite-like crystals (Figure 5A,B). At the end of the reaction (1200 s after mixing), this nanophase had disappeared and only struvite-like crystals remained (Figure 5C,D). EDX analyses showed that both the struvite-like crystals and the nanophase contained Co in addition to Mg and P (Figure 5E–G). However, the relative peak intensities indicate somewhat higher Co:Mg and Co:P ratios in the nanophase compared to the µm-sized crystals. The XRD pattern of the final reaction product showed that the material was highly crystalline and matched the reference pattern of struvite (Figure 5H), demonstrating that struvite was the only phase present at the end of the reaction.
We employed TEM to obtain detailed morphological, chemical, and structural information about the initially formed nanoparticulate material in the Co-containing synthesis experiments. Conventional TEM images of the (dried) early stage precipitates from a 6.1 mM MgCl2-DAP solution containing 1 mM CoSO4 showed aggregated chains of spherical (20–40 nm) nanoparticles (Figure 6A,B). The high-resolution images revealed no lattice fringes in the nanoparticles and the corresponding fast Fourier transform (FFT) patterns showed only diffuse ring patterns without any spots (Figure 6C), suggesting that the material was amorphous. In fact, the imaged nanoparticles strongly resembled the amorphous cobalt phosphate hydrate nanoparticles documented previously by Bach et al. [29] using conventional TEM. However, we know from our previous work that TEM analyses of drop-cast and dried samples can be problematic due to the possible introduction of artefacts during drying, exposure to high vacuum, and high-energy electron bombardment [25,28]. This is particularly true for struvite, for which we have shown that its crystals decompose easily into an amorphous nanostructured material under the high vacuum of an electron microscope [25]. Hence, it may be that the amorphous structure and morphology of the cobalt phosphate nanoparticles formed at the beginning of the crystallisation reaction may not correspond to their original state. Therefore, we also used low dose cryo-TEM as that way we can assure minimal disturbance of the system and capture the initial Co-containing nanoparticles in their native hydrated state [30]. The nanoparticles imaged by cryo-TEM had a similar appearance to those imaged in the conventional TEM, i.e., similar sizes, shapes, and aggregation states (Figure 6D,E), suggesting that drying and the exposure to high vacuum in this case did not significantly affect the size, shape, or crystallinity of the nanoparticles. Selected area electron diffraction (SAED, inset Figure 6D) showed only diffuse rings characteristic of the vitreous ice matrix without any significant additional contribution from the specimen, hence confirming that the initially formed nanoparticles were amorphous. The STEM-EDX (Figure 6F–I) elemental maps provided clear evidence that they consist of Co, P, and Mg.

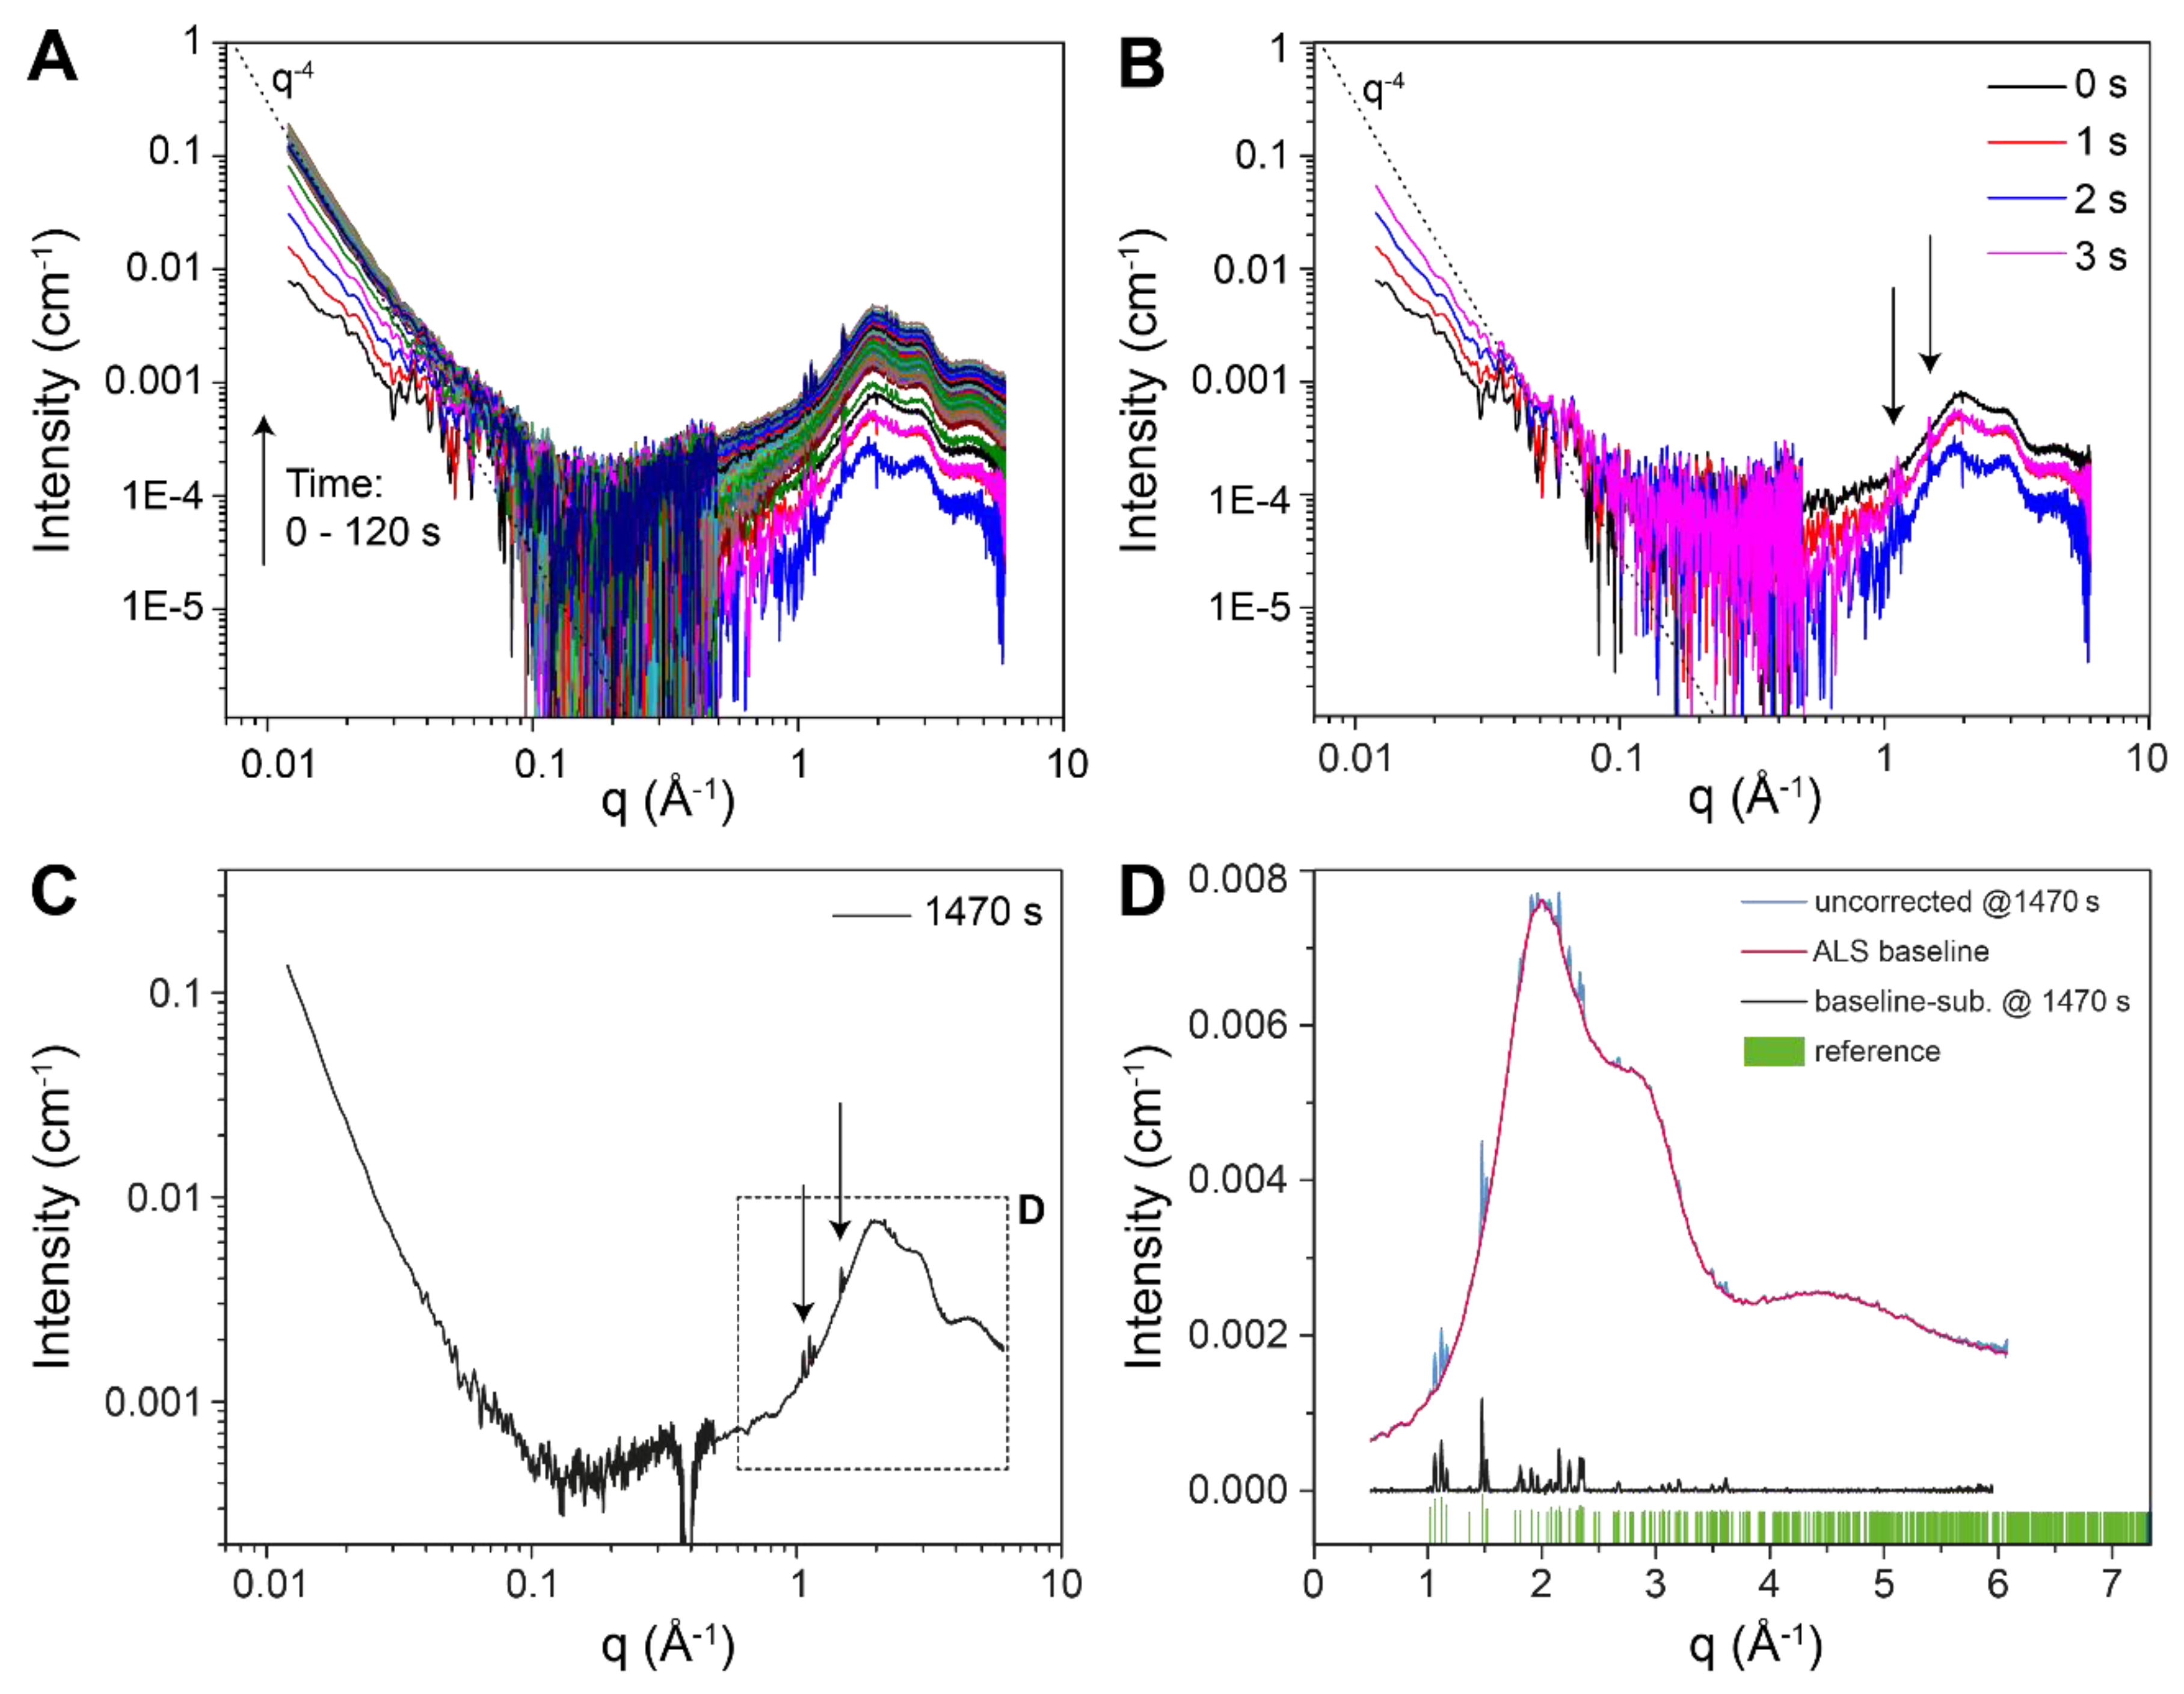
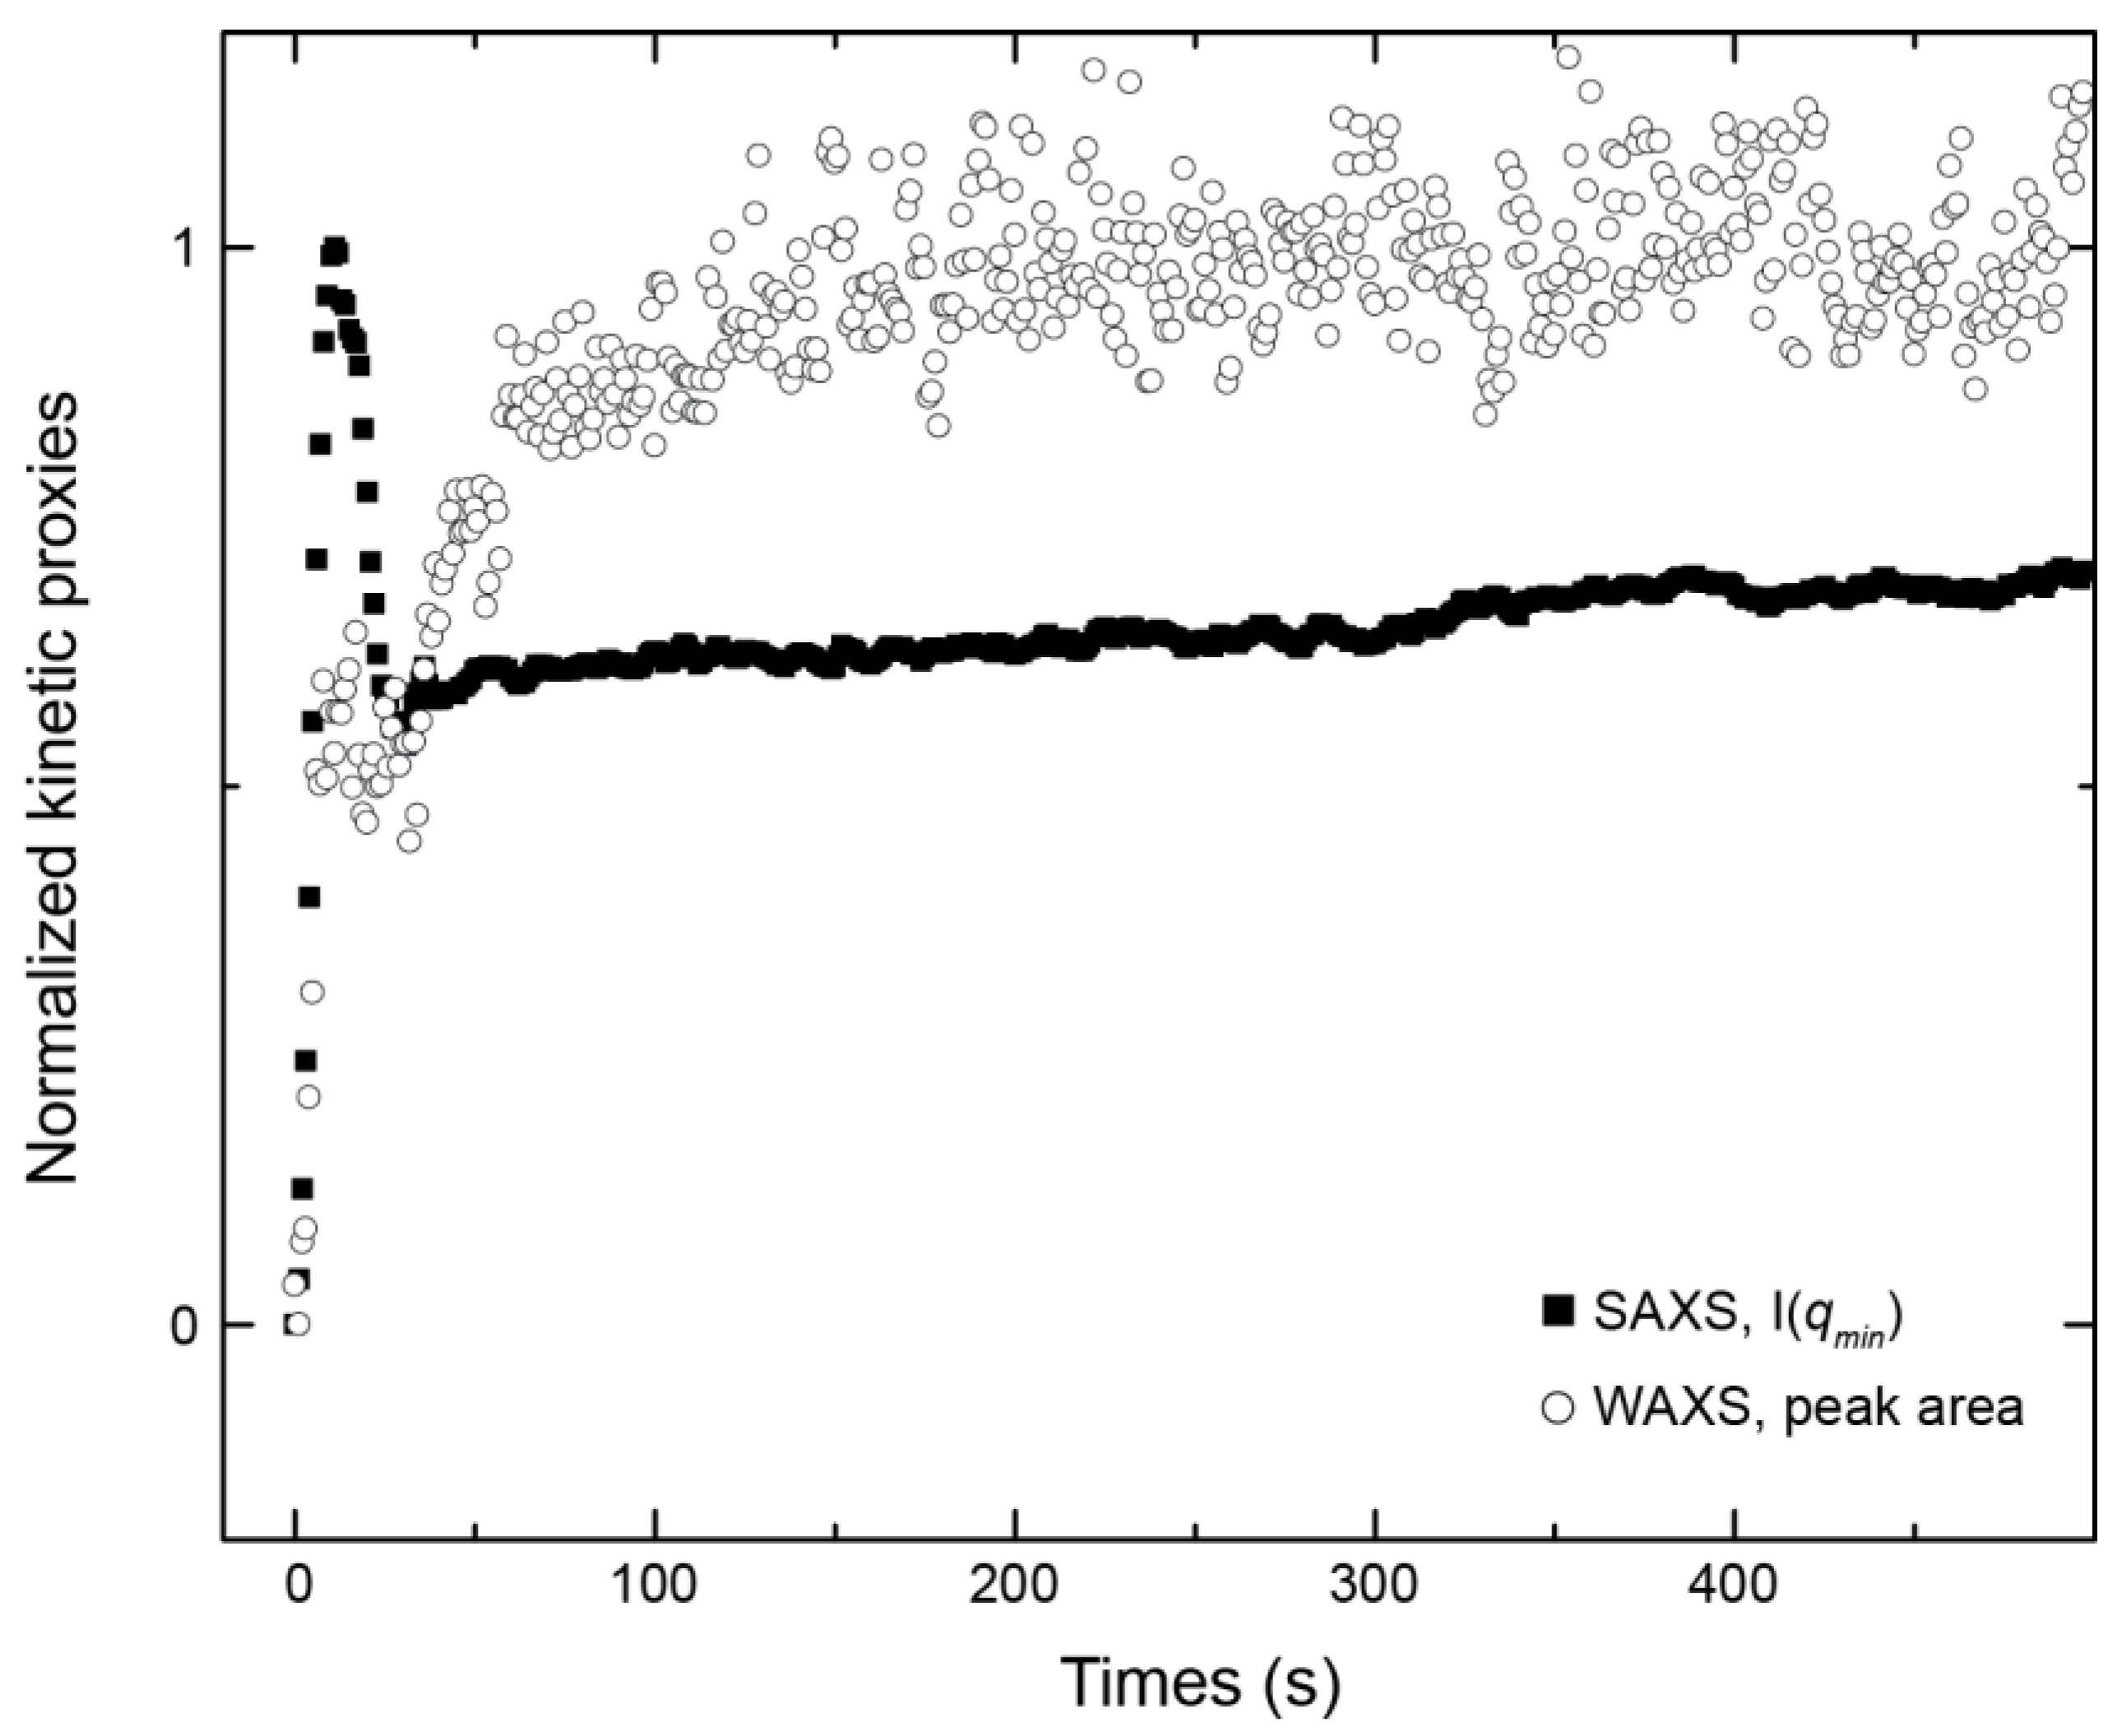
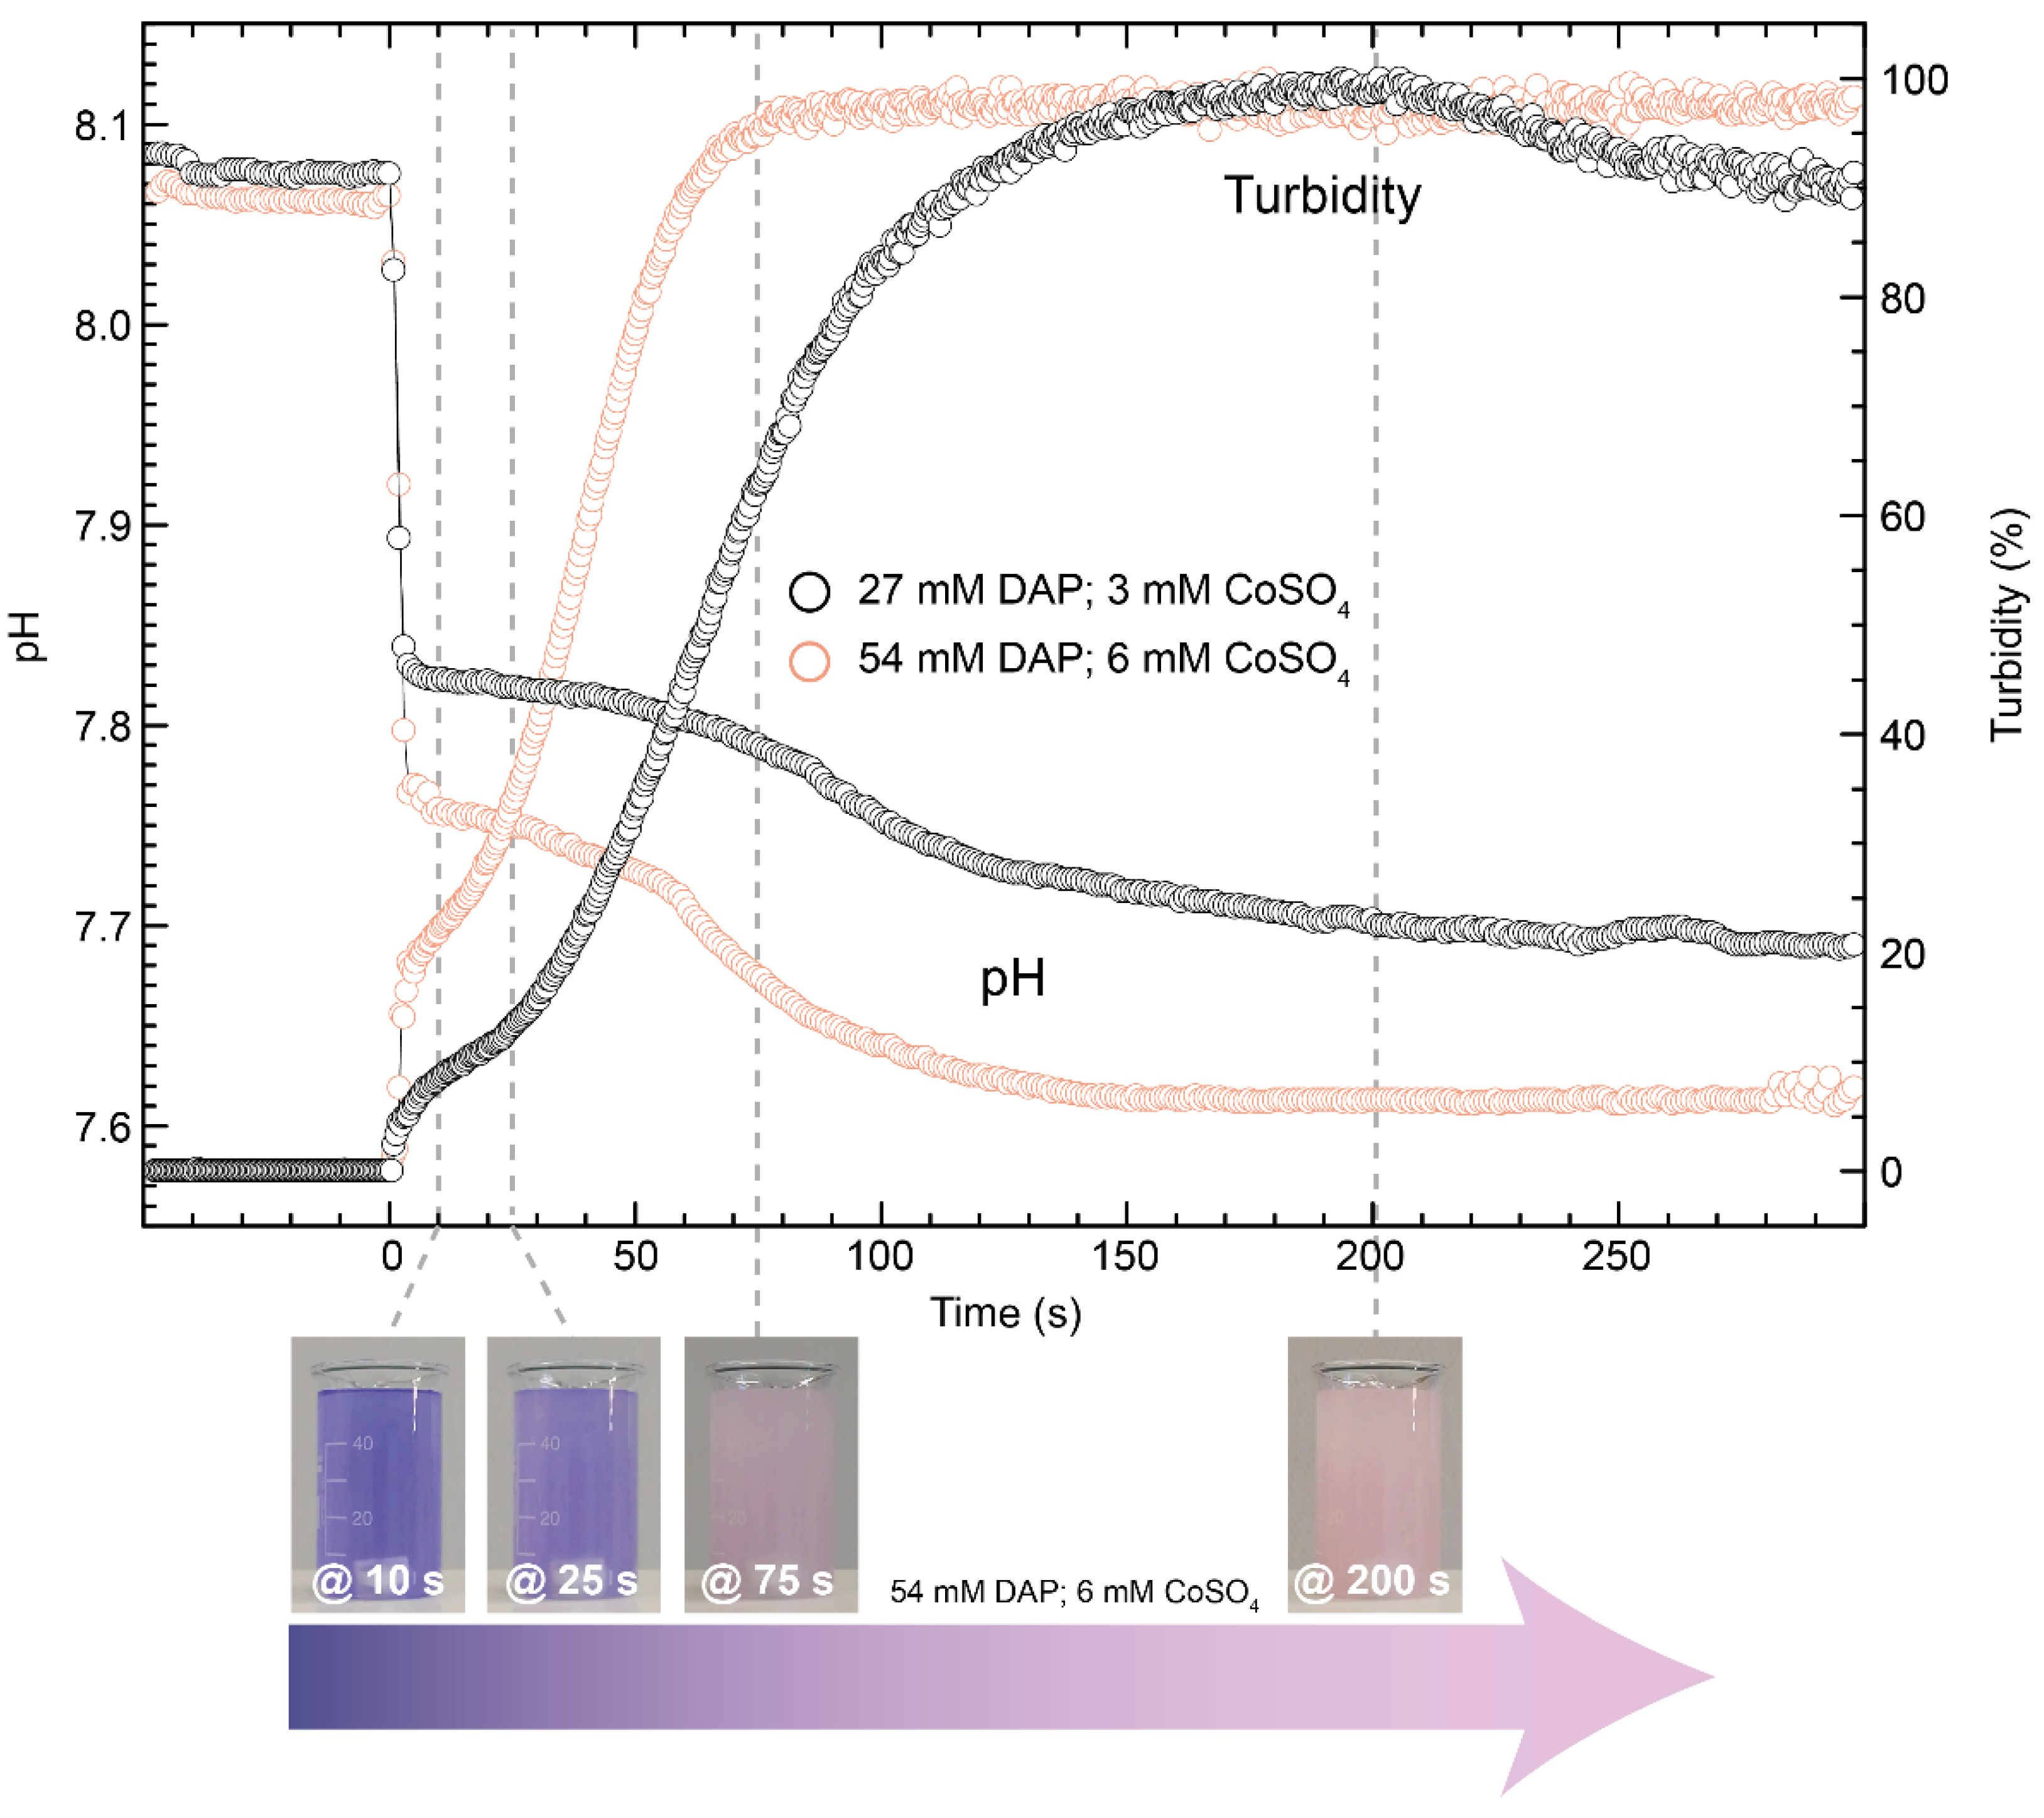
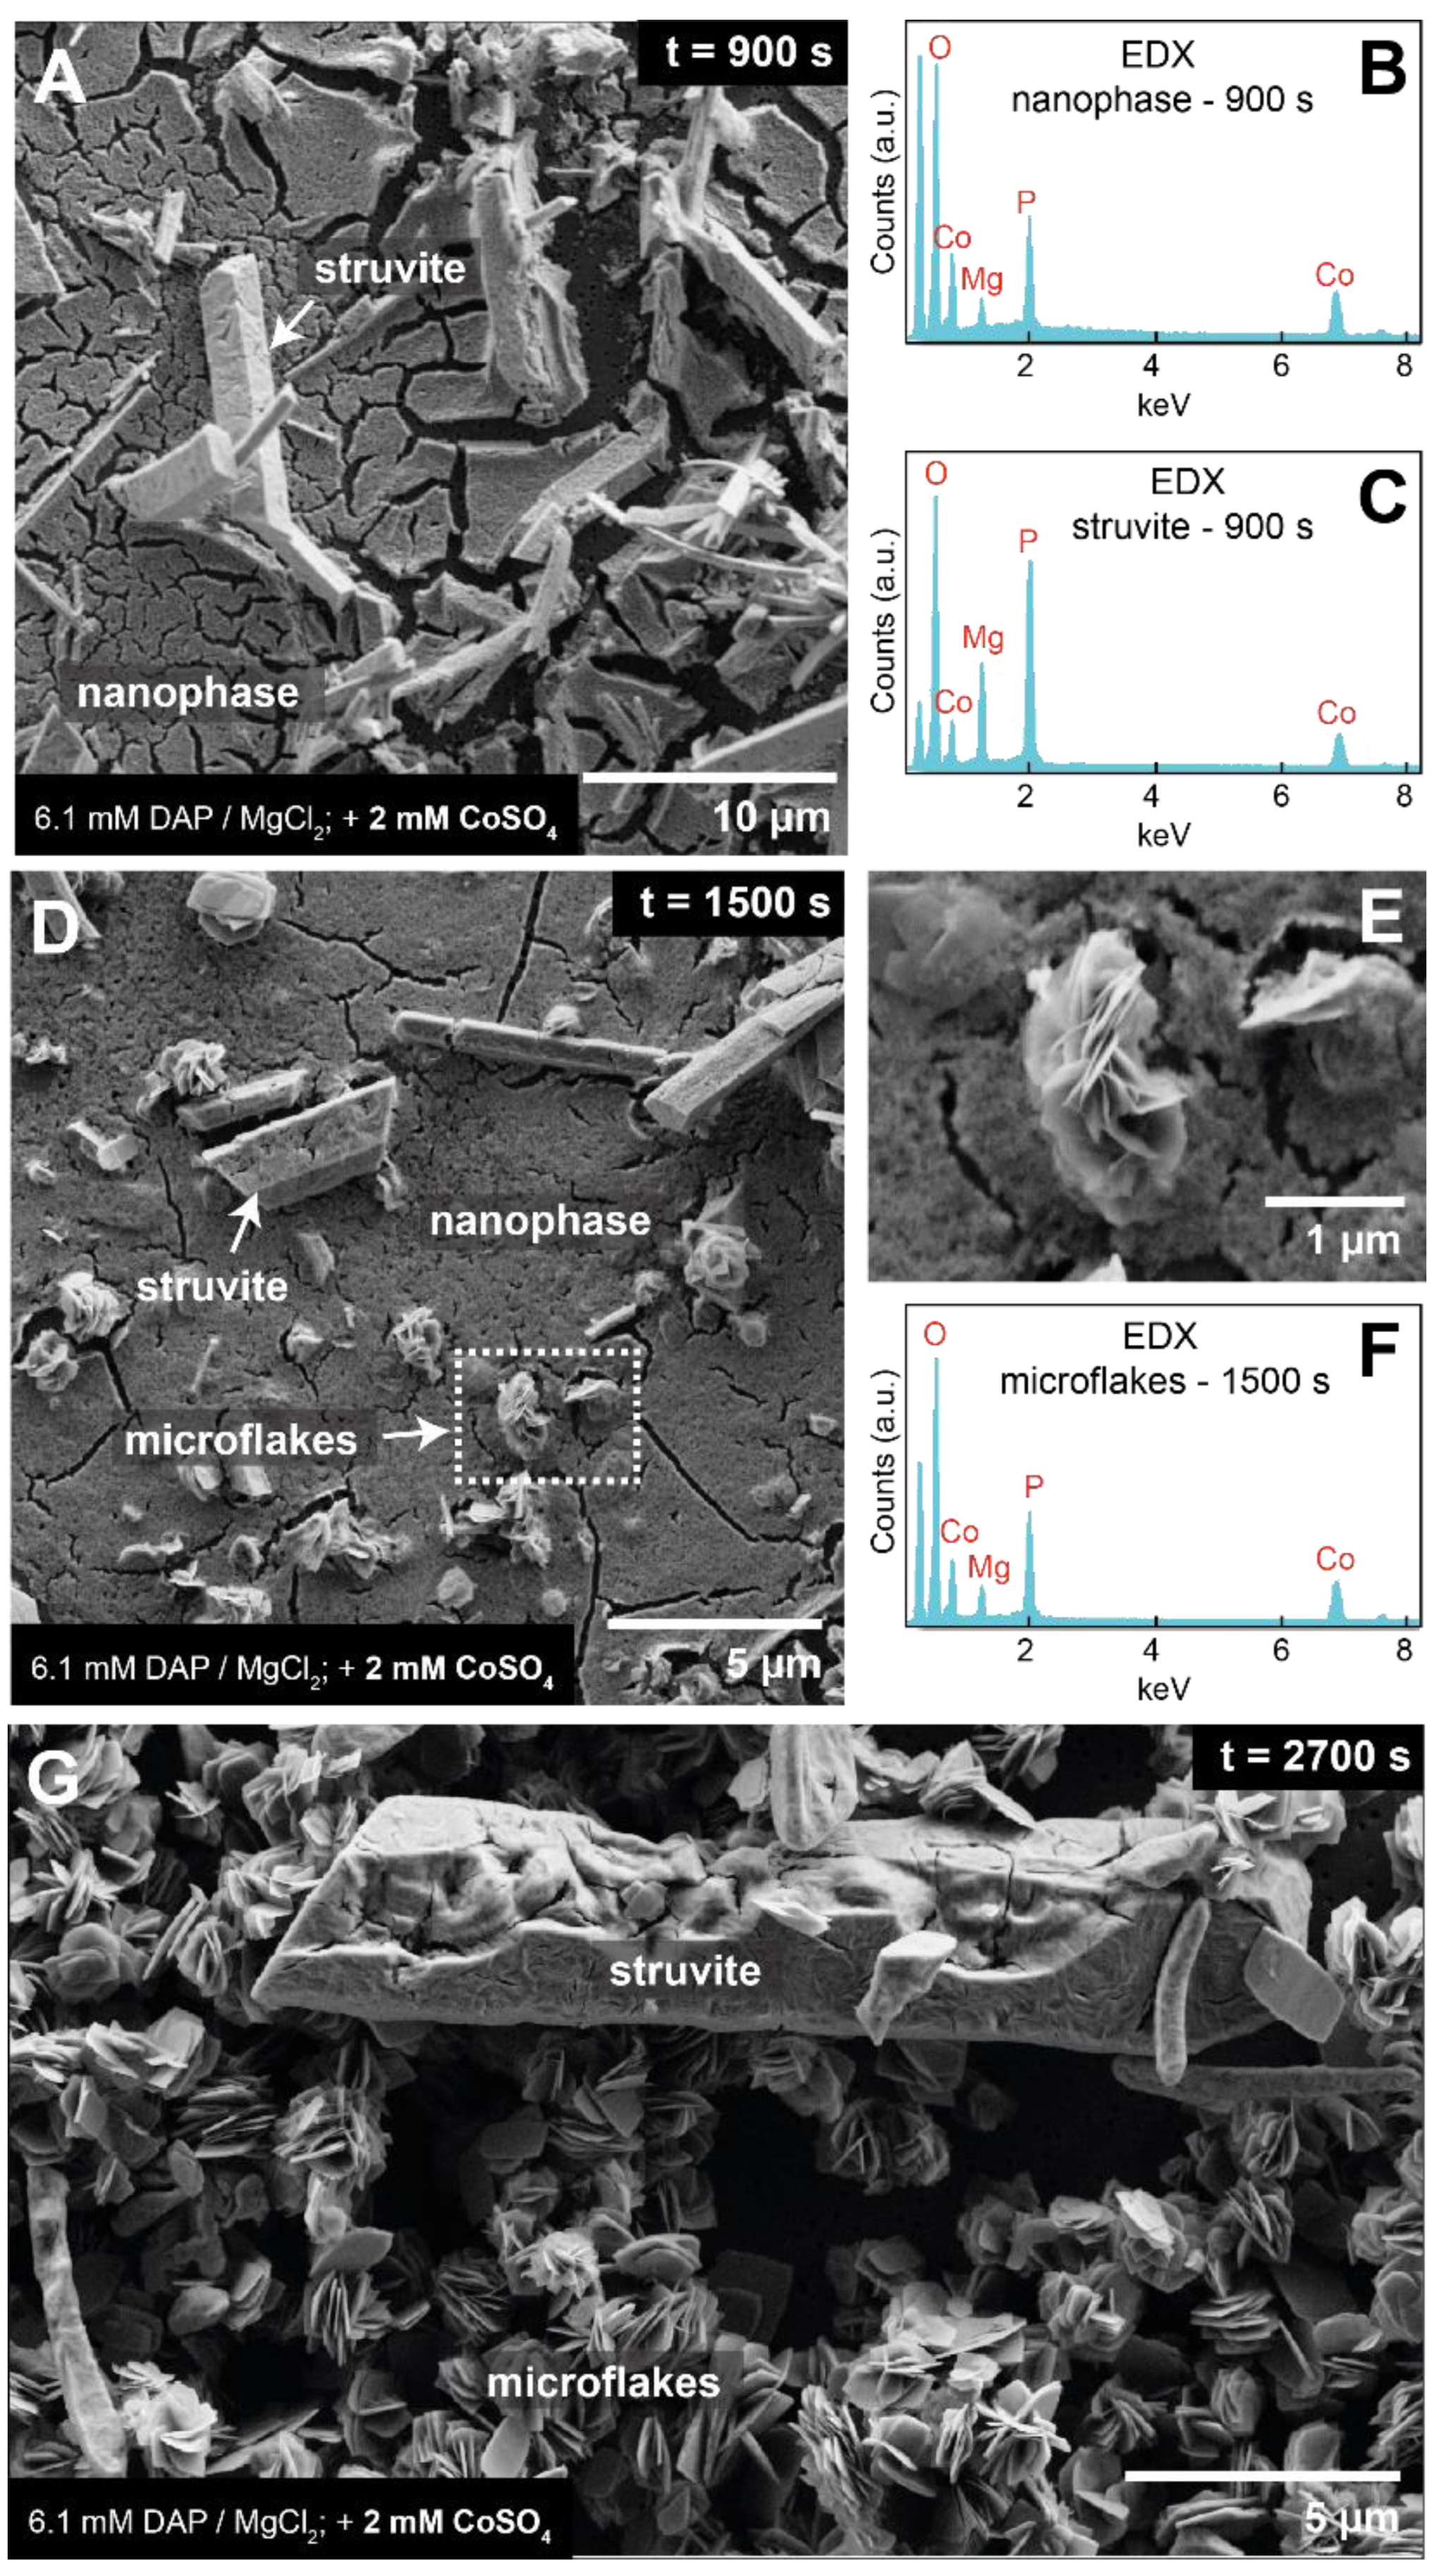
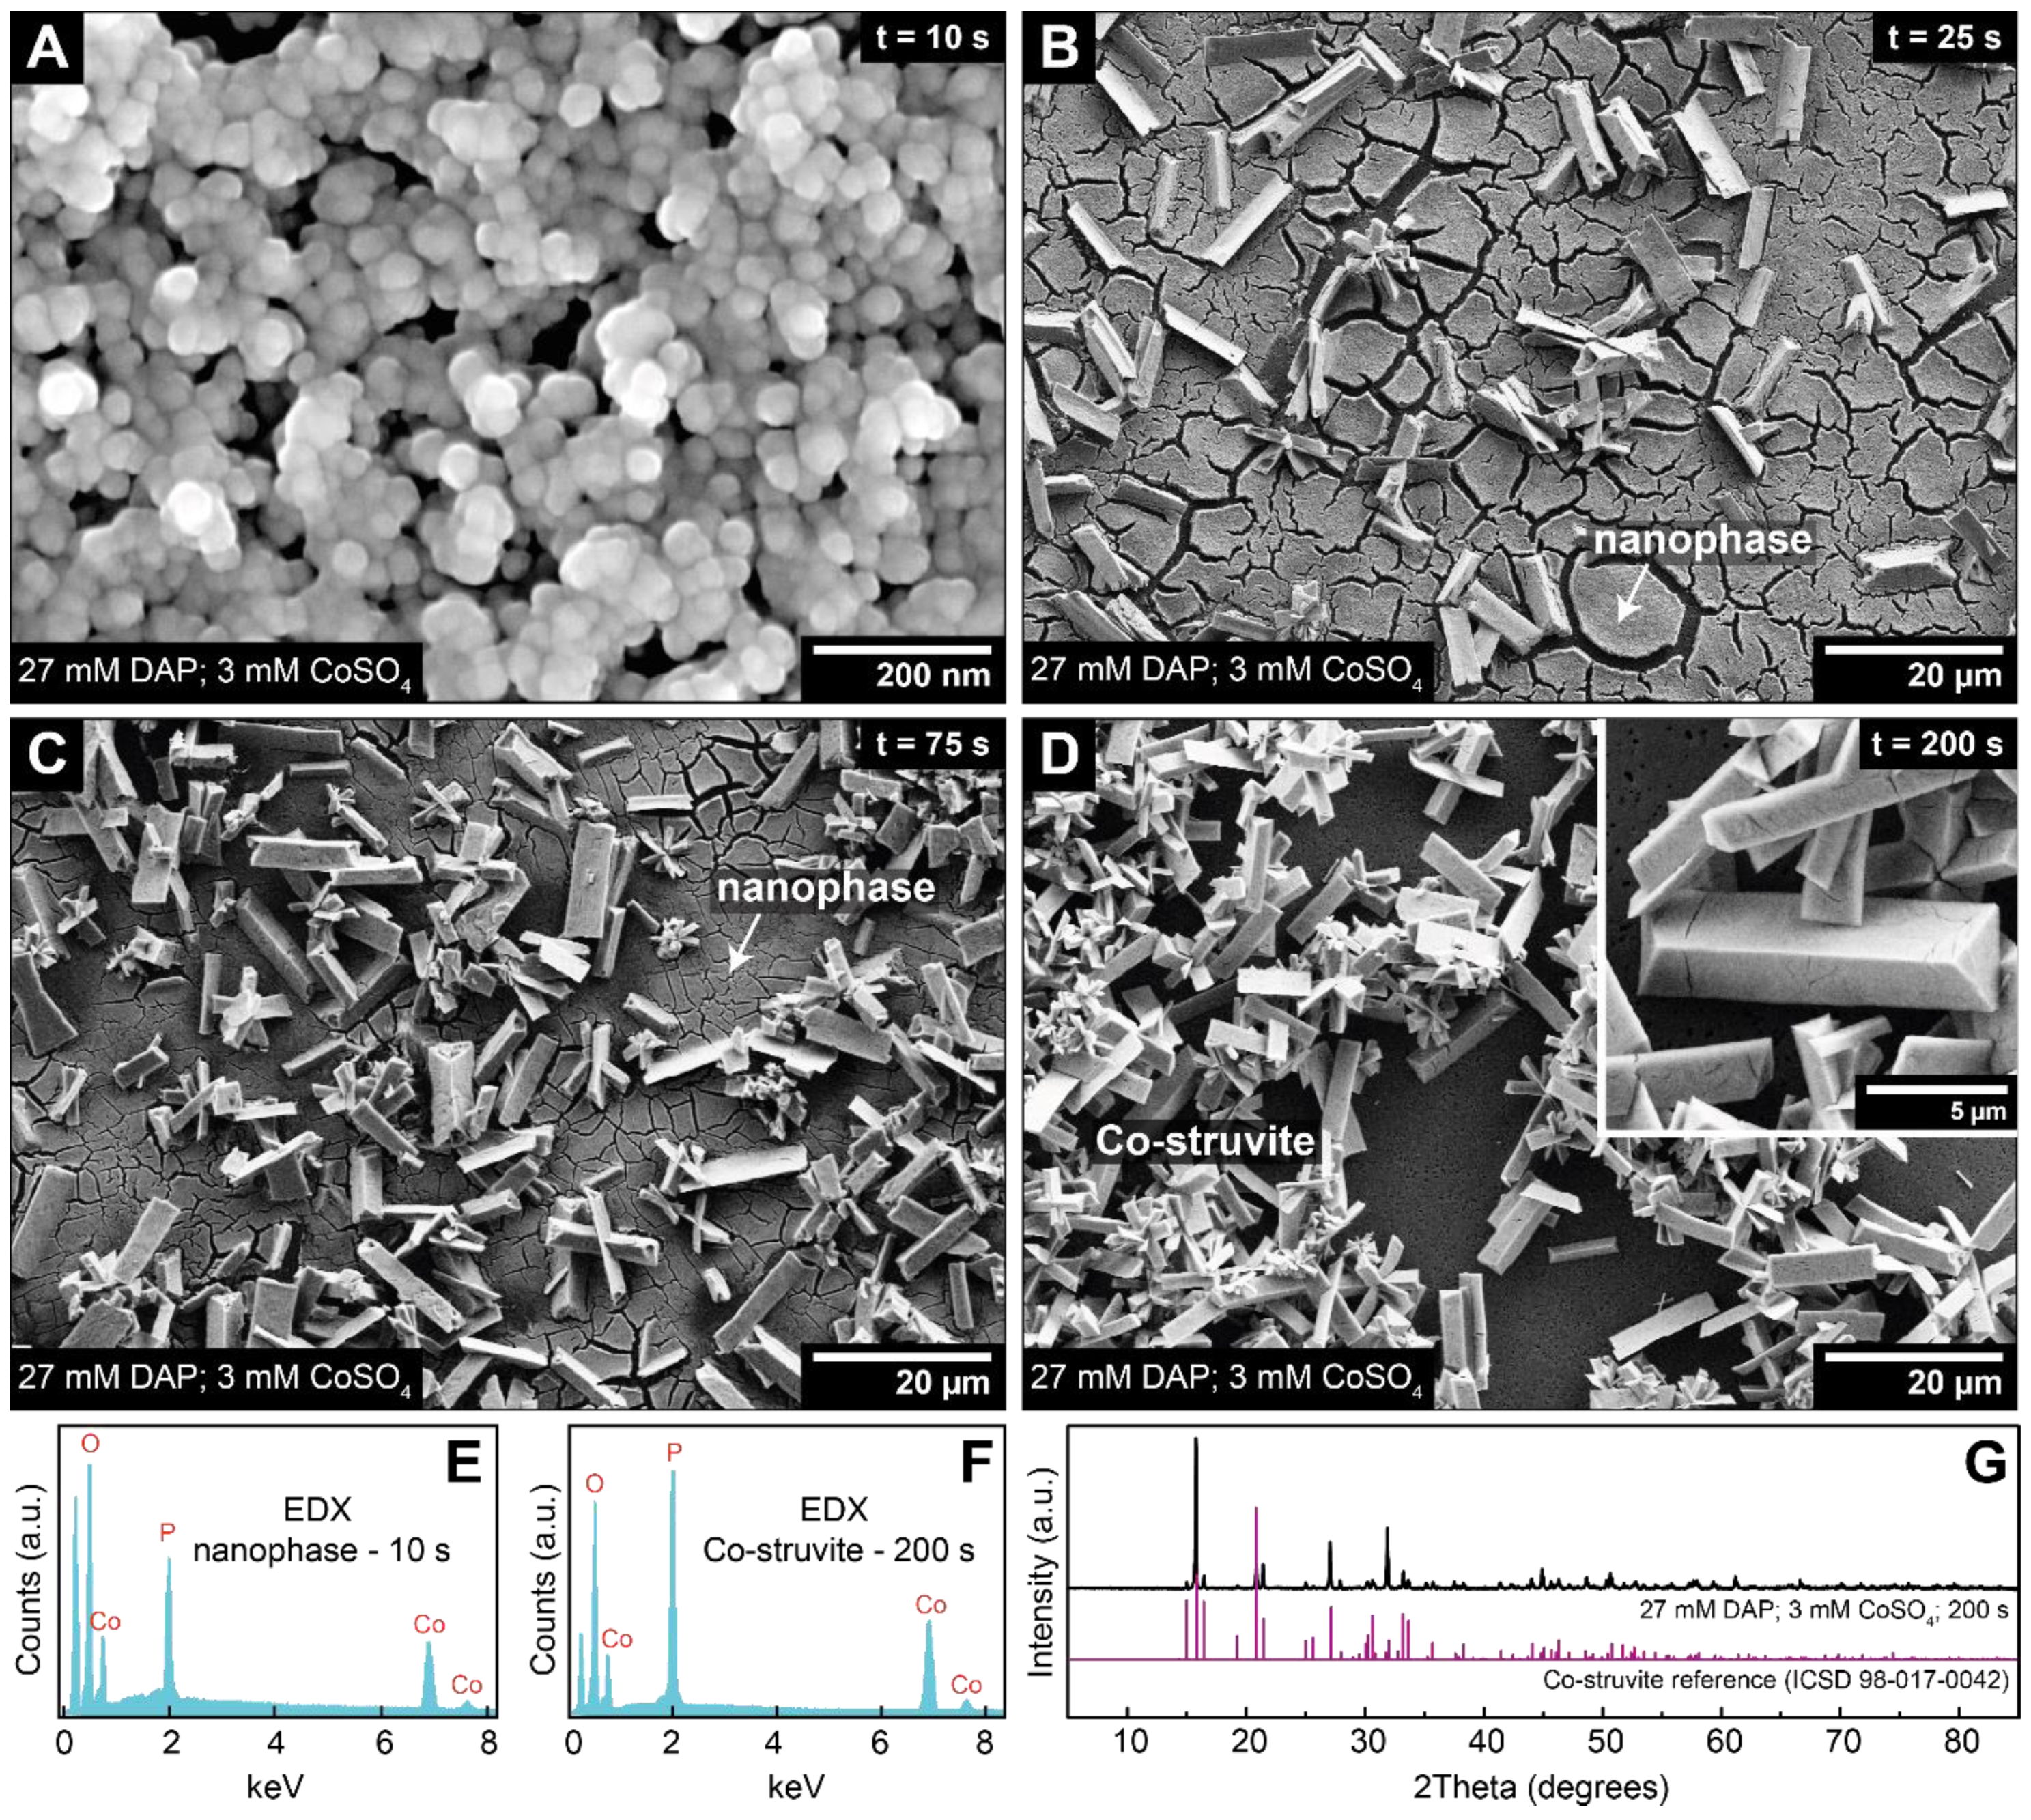
3.3. Crystallisation in the Presence of High (2–6 mM) Co Concentrations

Increasing the CoSO4 concentration to 2 mM resulted again in the early formation of a nanoparticulate Co-Mg-P-phase together with Co-bearing struvite (Figure 7). In this case, however, the nanophase persisted for longer reaction times. SEM images of solids recovered after 900 s still showed a high proportion of the nanophase material (Figure 7A–C). Then, after 1500 s, a third Co-Mg-P-phase appeared in the form of ~µm-sized aggregates of flaky crystals (Figure 7D–F). After 2700 s, the initial nanophase disappeared completely, leaving only struvite and the microflakes behind (Figure 7G). The struvite crystals seemed corroded along the edges, suggesting that they were partly re-dissolved during the course of the reaction.
In experiments with CoSO4 concentrations ≥ 3 mM (added to 6.1 mM MgCl2-DAP or DAP; Table 1), struvite was no longer observed in the reaction products, neither in the intermediate nor in the final products. In these experiments, immediately after mixing, we observed a rapid increase in turbidity and decrease in pH to values around ~7, again indicating a practically instantaneous precipitation (Figure S2). With increasing CoSO4 concentration, the suspension gradually changed from an initially intense deep-blue colour into a pale-pink colour. This marked colour change was accompanied by a further decrease in pH (to values below 6) and increase in turbidity (Figure S2A). SEM images of solids recovered at intermediate times showed that the initial blue precipitate was a nanoparticulate material, which over time and with the transition, the pink-coloured suspension transformed into flaky crystals similar to those observed in the 2 mM CoSO4 experiment (Figure S2B). XRD analyses of the pinkish end-product indicated Co-phosphate octahydrate (Co3(PO4)2·8H2O) as the sole crystalline phase (Figure S2C). The flaky morphology of the crystals observed in SEM is consistent with the typical crystal shape of Co-phosphate octahydrate [29]. The observed colour change (from blue to pink) during the crystallisation reaction is a consequence of the change in Co2+ coordination of the formed solids, with the deep-blue colour of the initial nanophase and the pinkish colour of the final crystalline material being indicative of tetrahedral and octahedral coordination, respectively [29].
We also performed experiments with a 9-fold excess of DAP relative to CoSO4 (i.e., 27 mM DAP and 3 mM CoSO4 or 54 mM DAP and 6 mM CoSO4), but in the absence of MgCl2 (Table 1). Again, a deep-blue precipitate formed instantaneously, causing a rapid increase in turbidity and decrease in pH to values around 7.8 (Figure 8) and within two to three minutes, the colour of the suspension changed to pale pink, which was accompanied by a further ~5 to 10 times increase in turbidity and a further minor (0.1–0.2 log unit) decrease in pH to 7.6 to 7.7.
SEM images of solids recovered ~10 s after mixing revealed that the initial deep-blue precipitate consisted of spherical to sub-spherical nanoparticles of ~40 nm in size (Figure 9A). After ~25 s, elongated crystals (~10–20 µm in length) with typical coffin-like struvite shapes appeared and became more abundant over time (Figure 9B,C). At the end of the reaction (~200 s after mixing), the nanoparticulate phase had completely disappeared and the struvite-like crystals were the only phase present at the end of the experiment (Figure 9D). EDX analyses showed that both the nanophase and the crystals contained Co and P (Figure 9E,F), but at different relative proportions (Co:P ratios were ~1.4 in the nanophase and ~1 in the crystals). XRD patterns of the final reaction product were in perfect agreement with a reference pattern of cobalt ammonium phosphate hexahydrate (CoNH4PO4·6H2O), a compound that is isostructural to struvite (Figure 9G).
We also imaged and analysed the nanophases formed from (i) 6.1 mM MgCl2-DAP + 6 mM CoSO4 (Figure S3A–C) and (ii) 27 mM DAP + 3 mM CoSO4 solutions (Figure S3D–F), which were the respective precursors of the later formed (Co, Mg)-phosphate octahydrate and Co-struvite. In both cases, the nanoparticles strongly resembled the ones that formed from 6.1 mM MgCl2-DAP + 1 mM CoSO4 solutions (cf., Figure 6), i.e., they were similar in size and shape and also had an amorphous structure. Nevertheless, EDX analyses showed that the various nanophase precursors differed slightly in their chemical composition as they contained various amounts of Mg (Figure S3C,F). Approximate Mg:Co ratios in the nanophases were ~0.3 for the 6.1 mM MgCl2-DAP + 1 mM CoSO4 solution ((Mg, Co)-struvite precursor), ~0.1 for the 6.1 mM MgCl2-DAP + 6 mM CoSO4 solution ((Co, Mg)-phosphate octahydrate precursor), and 0 for the 27 mM DAP + 3 mM CoSO4 solution (Co-struvite precursor).

4. Conclusions

Based on the presented results and observations we can draw the following conclusions:
In the pure MgCl2-DAP system and at Co concentrations < 0.5 mM, struvite forms via a single-step process (Figure 10, arrow 1), i.e., following the classical picture of crystallisation, in which the most stable crystalline phase nucleates and grows directly from solution. This interpretation is in part based on the fact that our in situ SAXS/WAXS data contain no measurable scattering features attributable to the formation of nano-sized, structurally distinct precursor phase(s). However, it should be noted that the volume fraction of solid material in the struvite system is very low (~0.02% at equilibrium), making the detection of any transient nanoparticles by in situ SAXS/WAXS measurements inherently difficult. Furthermore, the growing crystals very quickly reached a size of several microns so that we may not have been able to capture any short-lived intermediates with the time resolution (~1 s) of our measurements. In a previous in situ atomic force microscopy (AFM) study, we observed that the formation and growth of larger μm-sized struvite crystals in a heterogeneous growth reaction can indeed occur through the formation and continuous aggregation of primary nanoparticles [31]. However, it could not be clarified whether these were structurally different from crystalline struvite and also the substrate surface-mediated growth will differ from the more ‘homogenous’ growth from aqueous ions as followed in the current study.
At Co concentrations > 1 mM, crystallisation occurs via a two-step process that involves the formation of an amorphous (Mg-)Co-phosphate precursor prior to the transformation into a final thermodynamically stable crystalline phase (Figure 10, arrow 2). The precursor phase was shown to consist of aggregated chains of small (20–40 nm) spherical amorphous nanoparticles that can (depending on the solution composition) incorporate variable amounts of Mg and Co and transform into different crystalline phases, i.e., Co-bearing struvite (Figure 10, arrow 3) or cobalt phosphate octahydrate (Figure 10, arrow 4). The main factor determining the final crystalline phase appears to be the Co/P ratio in the solution, with a Co/P ratio < 0.3 leading to struvite and a Co/P ratio > 0.3 to cobalt phosphate octahydrate (see also Table 1). Whether these amorphous-to-crystalline transformations occurred via a dissolution and re-precipitation process or involved internal structural re-organisations within the individual nanoparticles remains presently unclear.
Overall, our study provides an improved mechanistic understanding of struvite crystallisation and emphasizes the notion that small changes in a given system (e.g., the presence or absence of organic or inorganic additives) can dramatically alter the pathways from dissolved ions to the final crystal [6]. From a practical point of view, our results have significant implications for the recovery of phosphate from wastewaters and the fate of metals during struvite crystallization. In this context, even if metal-bearing struvite is not the only final crystalline phase, the precipitation of other solid phases is beneficial for metal remediation from wastewater. This because the in situ formation of struvite launches a “cascade” of reactions, yielding easy-to-remove solids [32].

Supplementary Materials

The following are available online at https://www.mdpi.com/2075-163X/9/9/503/s1, Figure S1: SEM images and XRD pattern of precipitation products from solutions with a 9-fold molar excess of DAP relative to MgCl2, Figure S2: Turbidity, pH, SEM-EDX and XRD data from the crystallisation reaction of Co-phosphate octahydrate, Figure S3: TEM analyses of the nanophase precursors of Co-phosphate octahydrate and Co-struvite.

Author Contributions

J.H. conceived and designed the experiments; J.H., T.M.S., and R.B. performed the experiments; J.H. and T.M.S. analysed the data; S.M. carried out SEM imaging and analyses; H.M.F. and N.S.H. carried out cryo-TEM imaging and analyses; J.P.H.P. carried out conventional TEM imaging and analyses; J.H. wrote the paper. T.M.S., H.M.F., R.B., S.M., J.P.H.P., N.S.H. and L.G.B. helped with the discussion and interpretation of the results and edited the manuscript.

Funding

J.H., R.B., S.M., H.M.F., and L.G.B. acknowledge financial support by the Helmholtz Recruiting Initiative (Award No. I-044-16-01). J.P.H.P. and L.G.B. also acknowledge funding received through the European Union’s Horizon 2020 Marie Skłodowska-Curie Innovative Training Network Metal-Aid (Project No. 675219). T.M.S, L.G.B., J.H. and R.B. thank Diamond Light Source for funding of beamtime at beamline I22 (Proposal No. SM16256-1). This research was partially supported by a Marie Curie grant from the European Commission in the framework of the NanoSiAl Individual Fellowship (Project No. 703015) to T.M.S. and a Scientific Network grant from the German Research Council (DFG) (Project No. 548 389508713) to H.M.F. For cryo-TEM N.S.H. acknowledges funding from the UK’s EPSRC (EP/M028143/1 and EP/R043388/1).

Acknowledgments

We thank Anja Schleicher from the Inorganic and Isotope Geochemistry Section at GFZ for her help with the XRD analyses and Andy Smith from Diamond Light Source Ltd. for his help with the SAXS/WAXS measurements at beamline I22.

Conflicts of Interest

The authors declare no conflict of interest.

References

  1. Cordell, D.; Drangert, J.O.; White, S. The story of phosphorus: Global food security and food for thought. Glob. Environ. Chang. 2009, 19, 292–305. [Google Scholar] [CrossRef]
  2. El Diwani, G.; El Rafie, S.; El Ibiari, N.N.; El-Aila, H.I. Recovery of ammonia nitrogen from industrial wastewater treatment as struvite slow releasing fertilizer. Desalination 2007, 214, 200–214. [Google Scholar] [CrossRef]
  3. Uysal, A.; Yilmazel, Y.D.; Demirer, G.N. The determination of fertilizer quality of the formed struvite from effluent of a sewage sludge anaerobic digester. J. Hazard. Mater. 2010, 181, 248–254. [Google Scholar] [CrossRef] [PubMed]
  4. Kataki, S.; West, H.; Clarke, M.; Baruah, D.C. Phosphorus recovery as struvite from farm, municipal and industrial waste: Feedstock suitability, methods and pre-treatments. Waste Manag. 2016, 49, 437–454. [Google Scholar] [CrossRef] [PubMed]
  5. Gebauer, D.; Kellermeier, M.; Gale, J.D.; Bergström, L.; Cölfen, H. Pre-nucleation clusters as solute precursors in crystallisation. Chem. Soc. Rev. 2014, 43, 2348–2371. [Google Scholar] [CrossRef] [PubMed] [Green Version]
  6. De Yoreo, J.J.; Gilbert, P.U.P.A.; Sommerdijk, N.A.J.M.; Penn, R.L.; Whitelam, S.; Joester, D.; Zhang, H.; Rimer, J.D.; Navrotsky, A.; Banfield, J.F.; et al. Crystallization by particle attachment in synthetic, biogenic, and geologic environments. Science 2015, 349, aaa6760. [Google Scholar] [CrossRef] [PubMed]
  7. Ariyanto, E.; Ang, H.M.; Sen, T.K. Impact of various physico-chemical parameters on spontaneous nucleation of struvite (MgNH4PO4·6H2O) formation in a wastewater treatment plant: Kinetic and nucleation mechanism. Desalin. Water Treat. 2013, 52, 6620–6631. [Google Scholar] [CrossRef]
  8. Mehta, C.M.; Batstone, D.J. Nucleation and growth kinetics of struvite crystallization. Water Res. 2013, 47, 2890–2900. [Google Scholar] [CrossRef] [PubMed]
  9. Rouff, A.A.; Juarez, K.M. Zinc interaction with struvite during and after mineral formation. Environ. Sci. Technol. 2014, 48, 6342–6349. [Google Scholar] [CrossRef]
  10. Rouff, A.A.; Ramlogan, M.V.; Rabinovich, A. Synergistic removal of zinc and copper in greenhouse waste effluent by struvite. ACS Sustain. Chem. Eng. 2016, 4, 1319–1327. [Google Scholar] [CrossRef]
  11. Ma, N.; Rouff, A.A. Influence of pH and oxidation state on the interaction of arsenic with struvite during mineral formation. Environ. Sci. Technol. 2012, 46, 8791–8798. [Google Scholar] [CrossRef] [PubMed]
  12. Taddeo, R.; Honkanen, M.; Kolppo, K.; Lepistö, R. Nutrient management via struvite precipitation and recovery from various agroindustrial wastewaters: Process feasibility and struvite quality. J. Environ. Manag. 2018, 212, 433–439. [Google Scholar] [CrossRef] [PubMed]
  13. Rouff, A.A. Sorption of chromium with struvite during phosphorus recovery. Environ. Sci. Technol. 2012, 46, 12493–12501. [Google Scholar] [CrossRef] [PubMed]
  14. Basset, H.; Bedwell, W.L. Studies of phosphates. Part I. ammonium magnesium phosphate and related compounds. J. Chem. Soc. 1933, 1933, 854–871. [Google Scholar] [CrossRef]
  15. Ravikumar, R.V.S.S.N.; Rao, S.N.; Reddy, B.J.; Reddy, Y.P. Electronic spectra of hexa aqua coordinated transition metal doped zinc struvite. Ferroelectrics 1996, 189, 139–147. [Google Scholar] [CrossRef]
  16. Ravikumar, R.V.S.S.N.; Chandrasekhar, A.V.; Reddy, B.J.; Reddy, Y.P.; Ikeda, K. X-ray powder diffraction, DTA and vibrational studies of CdNH4PO4·6H2O crystals. Cryst. Res. Technol. 2002, 37, 1127–1132. [Google Scholar] [CrossRef]
  17. Chand, P.; Agarwal, O.P. Electron paramagnetic resonance study of doped synthetic crystals of struvite and its zinc analogue. Spectrochim. Acta Part Mol. Spectrosc. 1991, 47, 775–783. [Google Scholar] [CrossRef]
  18. Fytili, D.; Zabaniotou, A. Utilization of sewage sludge in EU application of old and new methods—A review. Renew. Sustain. Energy Rev. 2008, 12, 116–140. [Google Scholar] [CrossRef]
  19. European Commission Report on Critical Raw Materials for the EU—Report of the Ad Hoc Working Group on Defining Critical Raw Materials. Available online: https://ec.europa.eu/growth/tools-databases/eip-raw-materials/en/system/files/ged/79%20report-b_en.pdf (accessed on 4 March 2019).
  20. Perez, J.P.H.; Folens, K.; Leus, K.; Vanhaecke, F.; Van Der Voort, P.; Du Laing, G. Progress in hydrometallurgical technologies to recover critical raw materials and precious metals from low-concentrated streams. Resour. Conserv. Recycl. 2019, 142, 177–188. [Google Scholar] [CrossRef]
  21. Reid, R.L.; Horvath, D.J. Soil chemistry and mineral problems in farm livestock. A review. Anim. Feed Sci. Technol. 1980, 5, 95–167. [Google Scholar] [CrossRef]
  22. Gray, C.; Zhao, F.J.; Li, H.F.; McGrath, S.P.; Mico, C. Phytotoxicity and bioavailability of cobalt to plants in a range of soils. Chemosphere 2009, 75, 979–986. [Google Scholar]
  23. Simonsen, L.O.; Harbak, H.; Bennekou, P. Cobalt metabolism and toxicology—A brief update. Sci. Total Environ. 2012, 432, 210–215. [Google Scholar] [CrossRef] [PubMed]
  24. Pauw, B.R.; Smith, A.J.; Snow, T.; Terrill, N.J.; Thünemann, A.F. The modular small-angle X-ray scattering data correction sequence. J. Appl. Crystallogr. 2017, 50, 1800–1811. [Google Scholar] [CrossRef] [PubMed]
  25. Hövelmann, J.; Stawski, T.M.; Besselink, R.; Freeman, H.M.; Dietmann, K.M.; Mayanna, S.; Pauw, B.R.; Benning, L.G. A template-free and low temperature method for the synthesis of mesoporous magnesium phosphate with uniform pore structure and high surface area. Nanoscale 2019, 11, 6939–6951. [Google Scholar] [CrossRef] [PubMed] [Green Version]
  26. Shaddel, S.; Ucar, S.; Andreassen, J.P.; Sterhus, S.W. Engineering of struvite crystals by regulating supersaturation—Correlation with phosphorus recovery, crystal morphology and process efficiency. J. Environ. Chem. Eng. 2019, 7, 102918. [Google Scholar] [CrossRef]
  27. Eilers, P.H.; Boelens, H.F. Baseline correction with asymmetric least squares smoothing. Leiden Univ. Med. Cent. Rep. 2005, 1, 5. [Google Scholar]
  28. Stawski, T.M.; Van Driessche, A.E.S.; Ossorio, M.; Diego Rodriguez-Blanco, J.; Besselink, R.; Benning, L.G. Formation of calcium sulfate through the aggregation of sub-3 nanometre primary species. Nat. Commun. 2016, 7, 1–9. [Google Scholar] [CrossRef] [PubMed]
  29. Bach, S.; Panthöfer, M.; Bienert, R.; Buzanich, A.D.O.G.; Emmerling, F.; Tremel, W. Role of water during crystallization of amorphous cobalt phosphate nanoparticles. Cryst. Growth Des. 2016, 16, 4232–4239. [Google Scholar] [CrossRef]
  30. Pouget, E.M.; Bomans, P.H.H.; Goos, J.A.C.M.; Frederik, P.M.; de With, G.; Sommerdijk, N.A.J.M. The initial stages of template-controlled CaCO3 formation revealed by Cryo-TEM. Science 2009, 323, 1455–1458. [Google Scholar] [CrossRef]
  31. Hövelmann, J.; Putnis, C.V. In situ nanoscale imaging of struvite formation during the dissolution of natural brucite: Implications for phosphorus recovery from wastewaters. Environ. Sci. Technol. 2016, 50, 13032–13041. [Google Scholar] [CrossRef]
  32. Liu, L.; Song, W.; Guo, M. Remediation techniques for heavy metal-contaminated soils: Principles and applicability. Sci. Total Environ. 2018, 633, 206–219. [Google Scholar] [CrossRef] [PubMed]
Figure 1. The development of (A) pH and (B) turbidity over a period of 1500 s in the pure MgCl2-DAP system at equimolar concentrations of 3.05 and 6.1 mM. (C) Detail of the first 300 s of the experiments (area marked in (B) by a dotted rectangle) showing the onsets and development of the turbidity profiles and the graphical estimation of the precipitation induction times. (D) XRD patterns of the final reaction products (after 1500 s) matching the reference pattern for crystalline struvite. (E) SEM image of the precipitated material showing the typical coffin-like shape of struvite crystals (orthorhombic prisms). The cracks at the crystal surfaces originate from partial decomposition in the high vacuum of the SEM [25].
Minerals 09 00503 g001
Figure 2. X-ray scattering patterns obtained from in situ time-resolved SAXS/WAXS measurements during precipitation from a 6.1 mM MgCl2-DAP solution. (A) Overview of the scattering patterns for the first 120 s after mixing. Most of the increase in overall intensity occurred within the first 10 to 20 s. In the scattering patters between 50 and 1470 s, essentially no further changes were observed. (B) Scattering patterns for the first 3 s showing the almost instantaneous appearance of clear diffraction peaks (indicated by black arrows) in the WAXS part of the probed q-range (0.4–6 Å−1). (C) Final scattering pattern and (D) enlarged view of the WAXS part of the final scattering pattern recorded 1470 s after mixing. Note that in (C) the scaling of the y-axis is different from that in (A) and (B). The baseline-subtracted pattern (shown in black) matches the struvite reference pattern (shown in green). The baseline was corrected with asymmetric least-squares smoothing (ALS) algorithm [27].
Minerals 09 00503 g002
Figure 3. Evolution of the two normalized kinetic proxies derived from SAXS and WAXS as a function of the reaction time during struvite crystallisation from a 6.1 mM MgCl2-DAP solution.
Minerals 09 00503 g003
Figure 4. The development of (A,B) pH and (C,D) turbidity in 6.1 mM MgCl2-DAP solutions in the presence of 0.25–1.5 mM CoSO4. (B) and (D) are enlarged representation of the first 120 s of the pH and turbidity curves (areas marked in (A) and (B) by dotted rectangles).
Minerals 09 00503 g004
Figure 5. (A) SEM image of precipitates from a 6.1 mM MgCl2-DAP + 1 mM CoSO4 solution sampled after a mixing time of 60 s showing the presence of µm-sized struvite crystals inside a matrix of a nanoparticulate phase. (B) Higher magnification image of the area marked by dashed rectangles in (A). (C) SEM image of precipitates sampled after a mixing time of 1200 s. Only struvite crystals are observed in the sample, while the nanophase is completely absent. (D) Higher magnification image of the area marked by dashed rectangles in (C). (EG) EDX analyses of the nanophase shown in (B) and the struvite crystals shown in (B) and (D). (H) XRD pattern of the final reaction product (1200 s after mixing), confirming that struvite was the only phase present at the end of the reaction.
Minerals 09 00503 g005
Figure 6. (AC) Conventional TEM images of nanoparticles precipitated from a 6.1 mM MgCl2-DAP + 1 mM CoSO4 solution. The nanoparticles were sampled after ~10 s of reaction and imaged after drying. The lack of lattice fringes and spots in the high-resolution image and the corresponding FFT pattern (C) suggest an amorphous structure. (D,E) Cryo-TEM images of nanoparticles formed under equivalent conditions as particles in (AC). The particles are similar in size and shape to those observed in conventional TEM, suggesting that drying did not significantly affect the nature of the particles. The lower spatial resolution of the cryo-TEM image in (E) compared to the conventional TEM image in (C) is due to the surrounding vitreous ice matrix and the low dose imaging that had to be applied to prevent devitrification of the ice. The SAED pattern (inset of (D), taken from the dashed circle region) shows only diffuse rings from vitreous ice, confirming the amorphous structure of the nanoparticles. (F) Cryo-HAADF-STEM image of nanoparticles from the same sample and (GI) corresponding STEM-EDX elemental maps showing the distribution of P, Co, and Mg.
Minerals 09 00503 g006
Figure 7. (A) SEM image of precipitates from a 6.1 mM MgCl2-DAP + 2 mM CoSO4 solution sampled after 900 s of reaction showing the presence of µm-sized struvite crystals inside a matrix of a nanoparticulate phase. (B,C) EDX analyses of the nanophase and struvite crystals shown in (A). (D) SEM image of precipitates sampled after 1500 s showing the presence of µm-sized flaky crystals in addition to struvite and the nanophase. (E) Higher magnification image of the area marked by dashed rectangles in (D) showing an aggregate of microflakes. (F) EDX analysis of the microflakes shown in (E). (G) SEM image of precipitates sampled after 2700 s showing the presence of only struvite and microflakes. The struvite crystals appear corroded along the edges.
Minerals 09 00503 g007
Figure 8. The development of pH and turbidity in experiments with 27 mM DAP + 3 mM CoSO4 (red symbols) and 54 mM DAP + 6 mM CoSO4 (black symbols) over a period of 300 s. Bottom inset: Time series of photographs of the reaction solution/suspension showing the gradual colour change from deep blue to pale pink over the course of 200 s.
Minerals 09 00503 g008
Figure 9. (AD) SEM images of precipitates from a 27 mM DAP + 3 mM CoSO4 solution sampled after 10, 25, 75, and 200 s of reaction. The image sequence shows the progressive formation of Co-struvite crystals at the expense of an initial formed nanoparticulate phase. (E,F) EDX analyses of the initial nanophase (10 s after mixing, shown in (A)) and the final Co-struvite (200 s after mixing, shown in (D)). (G) XRD pattern of the final reaction product (200 s after mixing) showing that Co-struvite was the only phase present at the end of the reaction.
Minerals 09 00503 g009
Figure 10. Schematic illustration of crystallisation pathways in the DAP-MgCl2-CoSO4 system.
Minerals 09 00503 g010
Table 1. Compositions of the starting (mixed) solutions in struvite crystallisation experiments and precipitates formed during the reaction.
DAPMgCl2CoSO4Co/PPrecipitates
[mM][mM][mM]
3.053.05--Mg-struvite
6.16.1--Mg-struvite
273--Mg-struvite
546--Mg-struvite
6.16.10.250.04Mg-struvite
6.16.10.50.08Mg-struvite
6.16.110.16(Co, Mg, P)-NP * → (Mg, Co)-struvite
6.16.11.50.25(Co, Mg, P)-NP * → (Mg, Co)-struvite
6.16.120.33(Co, Mg, P)-NP * → (Mg, Co)-struvite + (Co, Mg)-phosphate octahydrate
6.16.130.5(Co, Mg, P)-NP * → (Co, Mg)-phosphate octahydrate
6.16.140.66(Co, Mg, P)-NP * → (Co, Mg)-phosphate octahydrate
6.16.160.98(Co, Mg, P)-NP * → (Co, Mg)-phosphate octahydrate
6.1-60.98(Co, P)-NP * → Co-phosphate octahydrate
27-30.11(Co, P)-NP * → Co-struvite
54-60.11(Co, P)-NP * → Co-struvite
* NP = nanophase.

